1. Introduction
Bone fractures are becoming a serious worldwide problem, due to their high frequency and surgical complications. Globally, more than
million fractures occur every year, where 10–15% of them result in nonunion [
1,
2,
3,
4,
5]. Prolonged healing, disabilities, and high morbidity rates are associated with severe traumas and immune-compromised-fractured people [
2,
3,
6,
7,
8]. In addition, medical care costs for bone fractures are expected to be over US
billions by 2025; due, in part, to the expensive treatments and prolonged hospitalization and rehabilitation [
3,
9]. It is essential to have a better understanding of the bone fracture healing process, in order to prevent unsuccessful healing and to develop optimal fracture union treatments.
Recently, experimental and mathematical models have demonstrated that macrophages strongly regulate bone fracture healing [
10,
11]. Depletion of macrophages results in delayed bone formation [
12]. Furthermore, during inflammation, classically activated macrophages attract mesenchymal lineage cells (MSCs) to the injury site and activate the healing process [
3,
10,
12]. In contrast, during the repair phase, alternatively activated macrophages promote MSC proliferation and differentiation, and accelerate bone healing [
10,
13]. However, the exact mechanisms by which macrophages contribute to bone healing remain unclear [
3,
10,
14]. Also, the interaction between macrophages and tissue cells, as well as the importance of classically and alternatively activated macrophages during the bone healing process, are still not clearly understood [
10,
12,
13].
In [
11], a mathematical model, based on the interactions among macrophages, MSCs, and osteoblasts, was developed to study the regulatory effects of two generic pro- and anti-inflammatory cytokines during the early stages of bone fracture healing. To our knowledge, it was the first attempt to incorporate the macrophage interactions in the modeling of the bone fracture healing process. The mathematical model revealed that high concentrations of pro-inflammatory cytokines negatively affect the healing time of a fracture, while the administration of anti-inflammatory cytokines can accelerate the healing time in a dose-dependent manner. Therefore, it is important to carefully consider and incorporate in the modeling approach all sources of pro- and anti-inflammatory cytokines, such as macrophages [
2,
3,
15], in order to correctly represent the complex progression of the bone fracture healing process.
In this paper, the mathematical model developed in [
11] is extended, to separately incorporate the two different phenotypes of macrophages: Classically and alternatively activated macrophages, as they have distinct functions during the healing process [
10,
15,
16]. Classically activated macrophages release high levels of pro-inflammatory cytokines, including TNF-
and IL-1
, which exhibit inhibitory and destructive properties in high concentrations [
16,
17]. In contrast, alternatively activated macrophages are characterized by the secretion of anti-inflammatory cytokines, such as IL-10, which increase their phagocytic activities, mitigate the inflammatory responses, promote growth, and accelerate fracture healing [
2,
3,
15,
16]. This extension leads to a more realistic model, by incorporating the different phagocytic rates and the separate production of the pro- and anti-inflammatory cytokines by the two types of macrophages [
15,
18]. The model can be used to investigate the macrophage functions during inflammation and their effects during the bone fracture healing process. The model can also be used to investigate potential therapeutic treatments, based on the use of anti-inflammatory cytokines, stem cells, and macrophages, suggesting possible ways to guide clinical experiments and bone tissue engineering strategies [
15,
16].
The organization of the paper is as follows:
Section 2 discusses the cellular and molecular interactions that occur during the bone fracture healing process. The macrophage-mediated inflammation involved in the bone fracture healing process is also described in detail. The simplifying assumptions are presented in
Section 3. In
Section 4, a system of nonlinear ordinary differential equations is introduced, to mathematically describe the fundamental aspects of the bone fracture healing process during the resolution of inflammation and bone repair. The stability analysis of the system is presented in
Section 5.
Section 6 demonstrates the functionality of the model, by numerically simulating the progression of the bone fracture healing process under normal and pathological conditions. The discussion and future work are presented in
Section 7.
2. Biological Background
Bone fracture healing is a complex biological process, which involves the participation of different cell types (including the immune system and mesenchymal lineage cells [
16]) and is strongly regulated by released molecular factors [
10,
16,
19,
20,
21]. Particularly, at the beginning of the healing process, cytokines activate and direct both immune and tissue cellular functions.
Cytokines are functionally classified into pro-inflammatory and anti-inflammatory families. Pro-inflammatory cytokines, such as the tumor necrotic factor-
(TNF-
), activate the immune system defense to kill bacteria and fight infections. Anti-inflammatory cytokines block the pro-inflammatory synthesis and activate the mesenchymal lineage cellular functions [
2]. Interleukin-10 (IL-10) is one of the most potent anti-inflammatory molecules that inhibits pro-inflammatory production [
2,
22], and is mainly delivered by macrophages and MSCs [
2]. A correct balance between pro- and anti-inflammatory cytokines during fracture healing is necessary for successful fracture repair. High levels of TNF-
induce chronic inflammation and gradual destruction of cartilage and bone tissue [
21], while the absence of TNF-
results in nonunion or delayed nonunions [
17,
23].
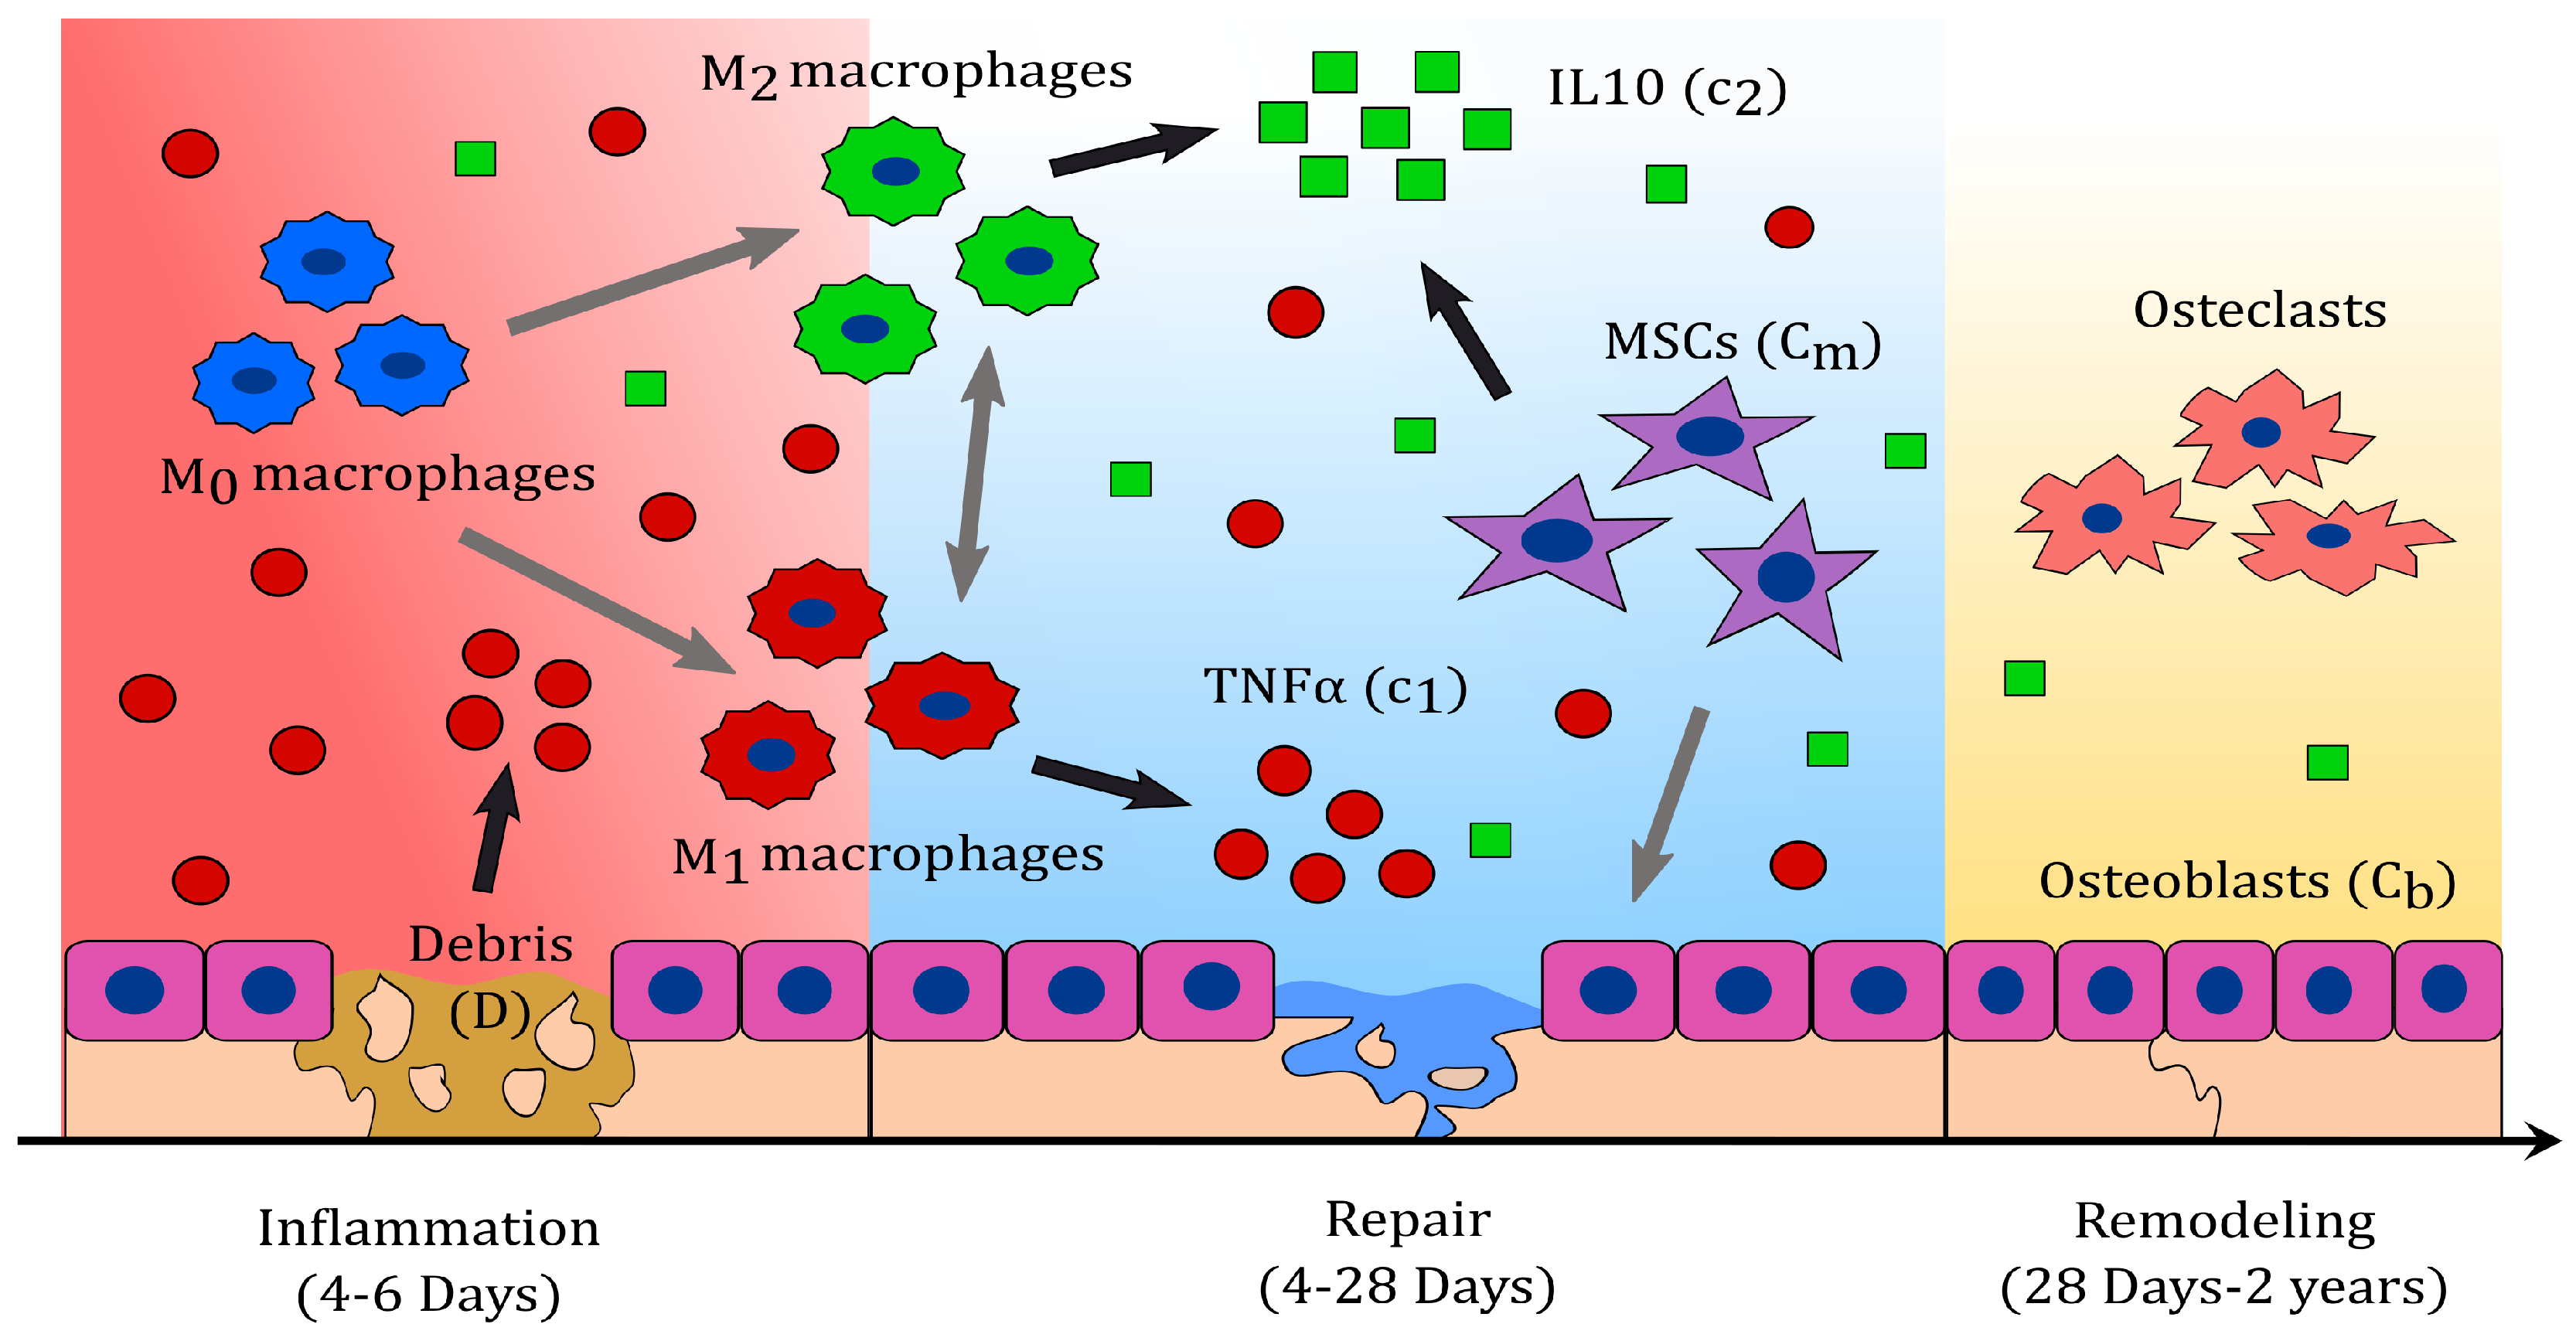
Bone fracture healing can be described in three characteristic phases: Inflammatory, repair, and remodelling (see
Figure 1) [
24]. During inflammation, necroses of cells result in the delivery of pro-inflammatory cytokines which attract inflammatory immune cells, such as neutrophils and monocytes [
1,
23], to the injury site. In response to their phagocytic activities, these cells magnify the pro-inflammatory production, leading to an acute inflammation [
17,
23,
25]. Subsequently, monocytes differentiate into macrophages to down-regulate the inflammation and resolve it. Once this differentiation begins, the influx of the inflammatory cells ceases, and they die out [
26].
During the resolution of inflammation, macrophages increase their population by migration and activate to their classical and alternative phenotypes, accordingly to the cytokine stimuli [
16,
27]. The two phenotypes can also shift between each other during this process [
28,
29]. Macrophages have the capability to release both pro- and anti-inflammatory cytokines through their different phenotypes [
28]. Classically activated macrophages release high concentration of pro-inflammatory cytokines, including TNF-
, and low levels of anti-inflammatory cytokines [
28], in response to their engulfing functions. Alternatively activated macrophages secrete high levels of Il-10 and low levels of TNF-
, as they continue with the clearance of debris and the modulation of inflammation [
28].
During the repair phase, migrating MSCs contribute with the delivery of IL-10, and proliferate or differentiate into fibroblasts, chondrocytes, and osteoblasts [
2,
30]. Fibroblasts and chondrocytes proliferate and release the fibrinous/cartilagenous extracellular matrix, which fills up the fracture gap [
10,
30,
31] while osteoblasts proliferate and deposit the new bone, also called woven bone [
30]. Bone deposit results from mineralized collagen and other proteins being delivered by the osteoblasts [
10]. After bone mineralization, osteoblasts remain on the bone surface or differentiate into osteocytes, which become part of the bone extracellular matrix [
32,
33].
During the last phase of the bone fracture healing process, the fibrocartilage and the woven bone are constantly removed and replaced by a functional bone [
34]. This process is referred to as bone remodeling, and consists of systematic tissue degradation and production by osteoclasts and osteoblasts, respectively. Bone remodeling is a slow process, that can take months to years until the bone recovers to its pre-injury state [
14]. In a moderate fracture, acute inflammation is observed 24 h after the injury; it also corresponds to the peak of TNF-
, which returns to baseline levels within 72 h [
14,
23]. Fibrinous/cartilaginous tissue production is observed in the first 3 days, peaks in about 10 to 12 days, and its removal starts as early as 21 days [
30]. The inflammation is considered resolved when the debris is eliminated, activated macrophages emigrate to the lymphatic nodes to die, and inactivated macrophages return to their normal density [
26]. These events are observed after two weeks from the beginning of the healing process [
34,
35]. At approximately 28 to 35 days, osteoclasts populate the injury site and a substantial removal of the fibrocartilage is observed [
34]. The fracture healing outcome is considered a delayed union if the fibrous/cartilaginous tissue is not removed completely in about 3 to 4 months after the injury, while it is considered a nonunion if no functional bone is obtained in 6 months after the trauma [
36].
3. Modeling Assumptions
The most important effects of macrophages on bone fracture healing are observed during the inflammatory and repair phases of the healing process [
11,
16]. During the inflammatory phase, macrophages modulate and resolve the inflammation while, during the repair phase, macrophages provide an optimal environment for the cellular proliferation, differentiation, and tissue production. The primary variables during the inflammatory and repair phases of the bone fracture healing process are debris (
D), unactivated macrophages (
), classical macrophages (
), alternative macrophages (
), MSCs (
), osteoblasts (
), pro-inflammatory cytokines (
), anti-inflammatory cytokines (
), fibrocartilage (
), and woven bone (
).
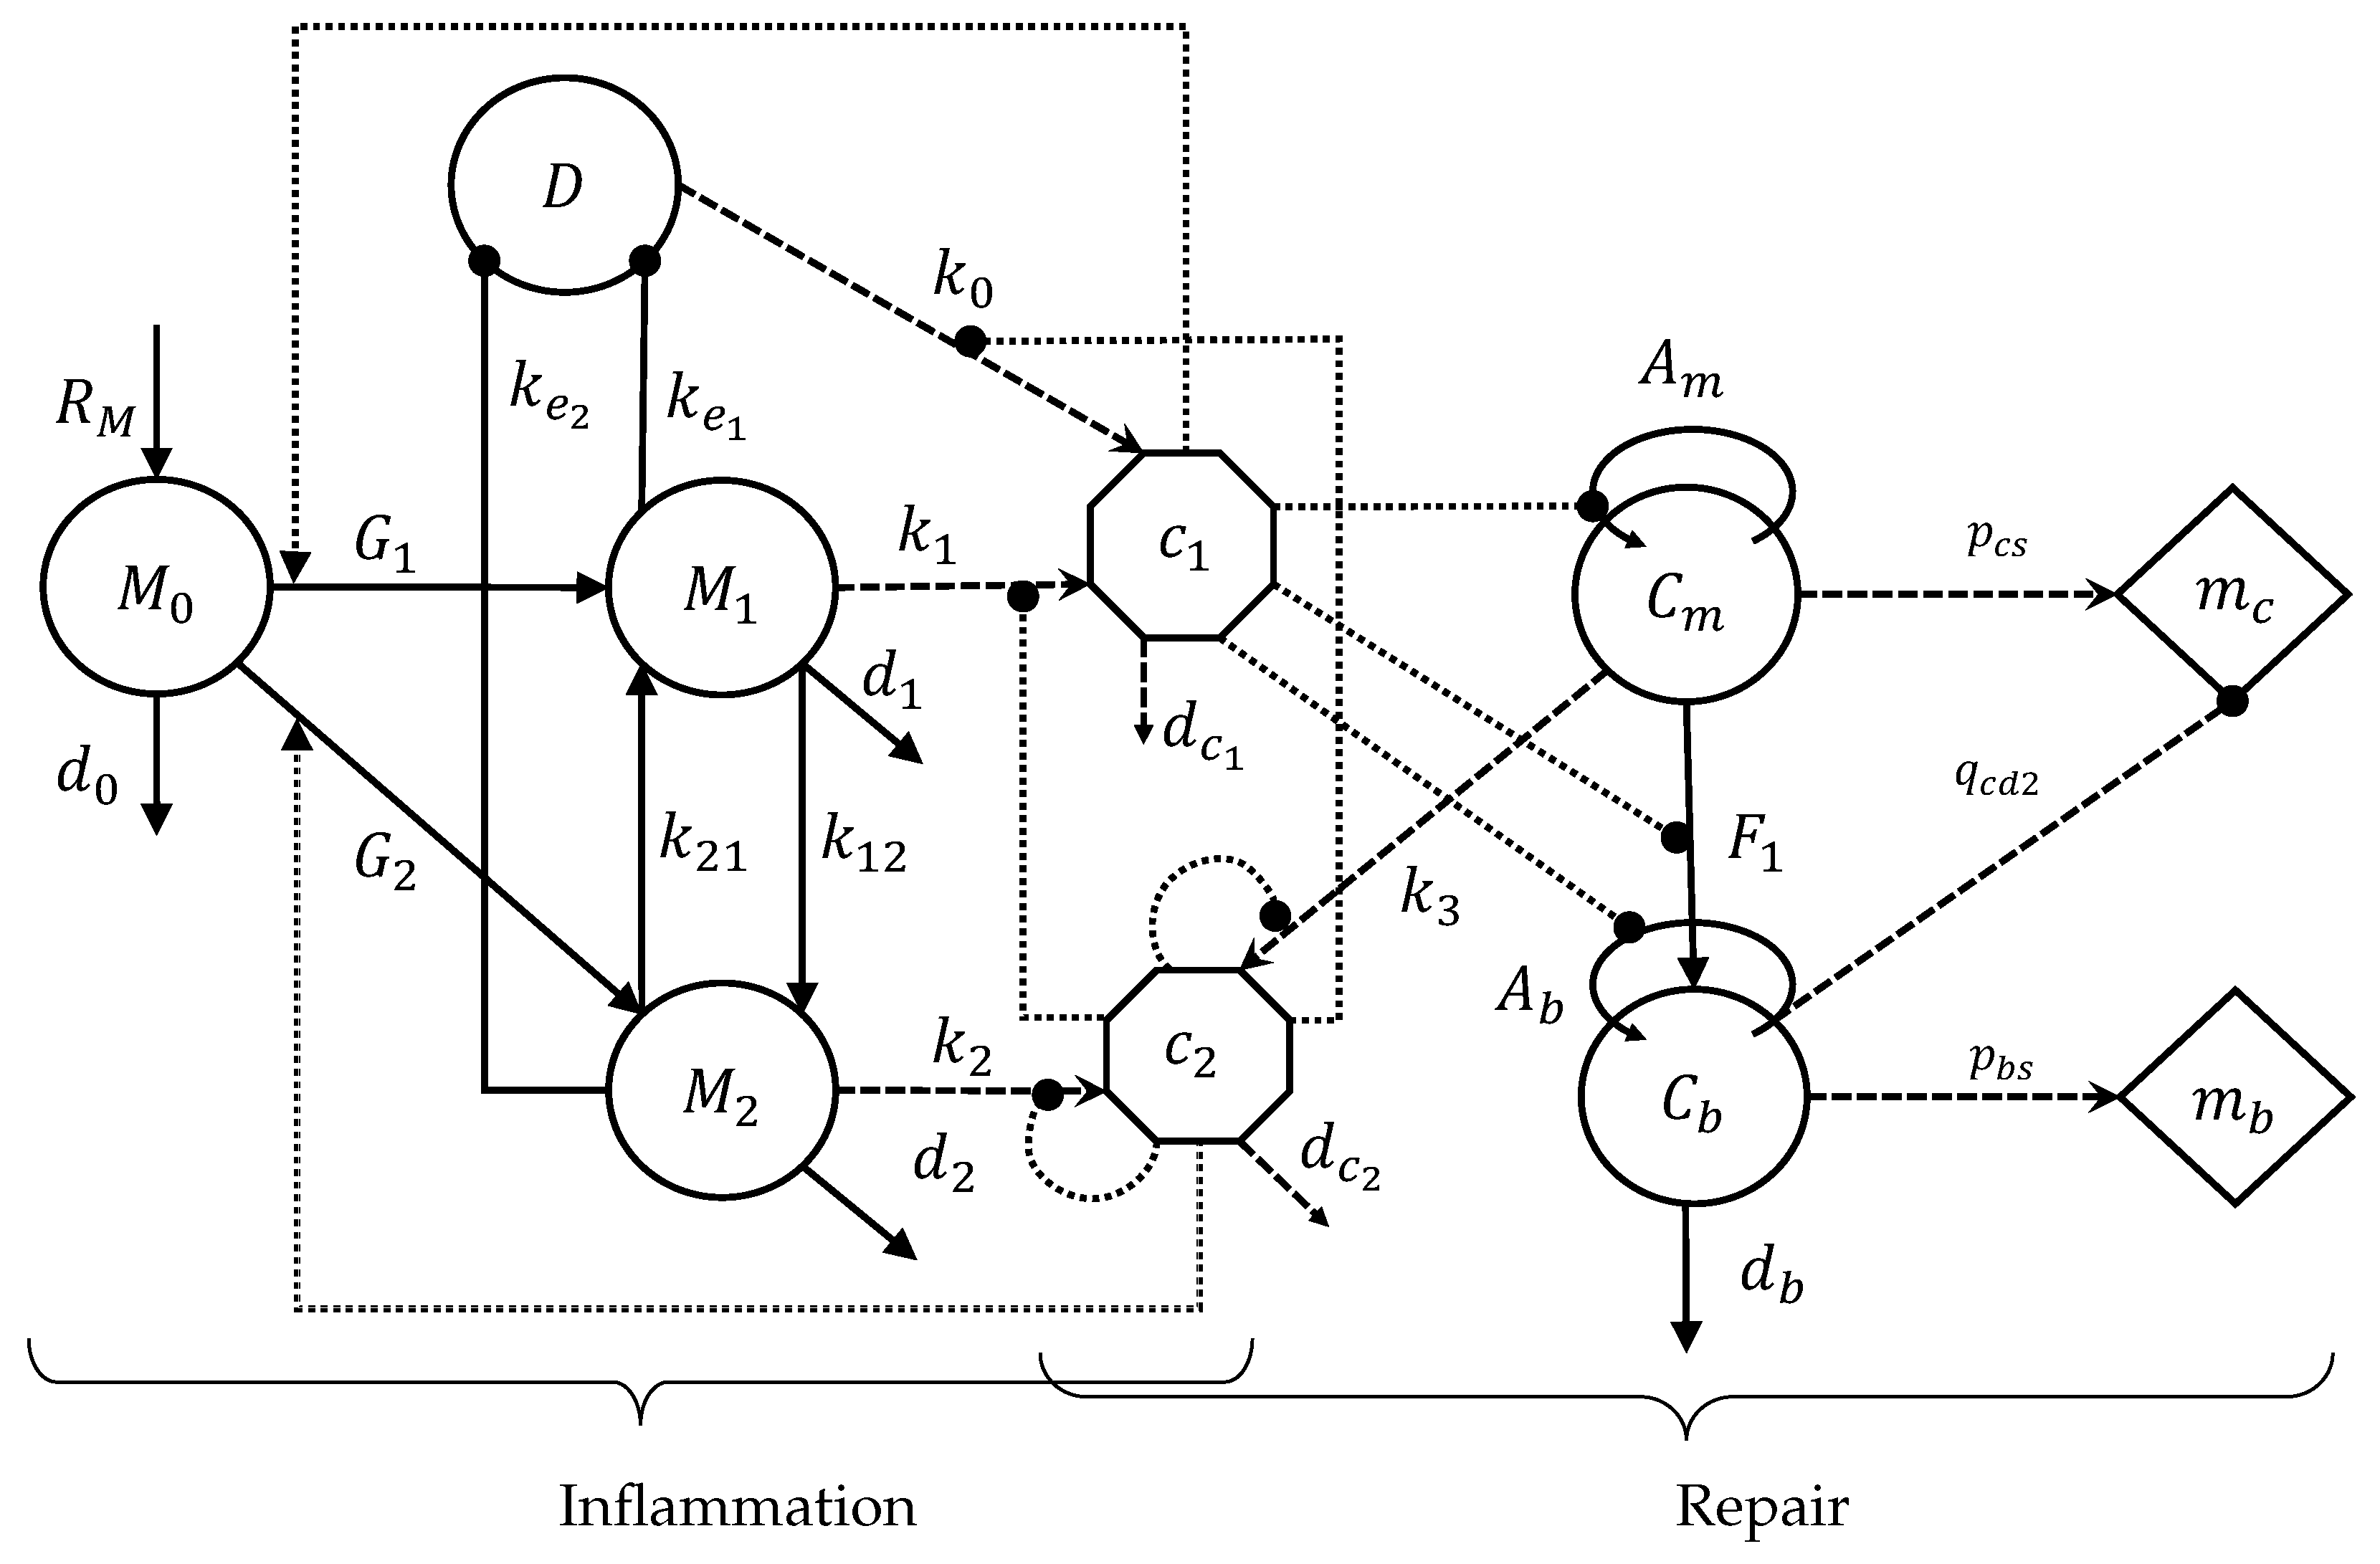
The biological system interactions are depicted in
Figure 2. The cells and cellular dynamics are represented by the circular shapes and solid arrows. The molecular concentrations and their production/decay are represented by the octagonal shapes and dashed arrows. The pro- and anti-inflammatory cytokine activation/inhibition effects on the cellular functions are represented by the dotted arrows. Removal of debris and the negative effect among the variables are represented by the dot-ending dotted arrows.
It is assumed that the cellular functions are regulated by
(such as TNF-
) and
(such as IL-10). It is also assumed that
is delivered through cell necrosis and by the classically activated macrophages, while
is delivered by the alternatively activated macrophages and MSCs. It is further assumed that the repair process is governed by the production of
and
[
30,
37], whose final levels are used to classify the outcome of the bone healing process. Additionally, it is assumed that the debris
D are proportional to the number of necrotic cells [
11]. It is also assumed that unactivated macrophages
do not release cytokines and do not engulf debris. Additionally, the population of
increases proportionally in size to the density of debris, up to a maximal value of
[
27]. The only source of activated macrophages,
and
, is
. Even though both phenotypes of activated macrophages have the ability to release both pro- and anti-inflammatory cytokines, it is assumed that only
deliver
and
deliver
, as those are the major cytokines for each phenotype [
38].
activate to
under the
stimulus, while they activate to
under the
stimulus.
and
macrophages do not de-differentiate back to the
macrophages [
39], and are able to switch phenotypes at a constant rate [
29]. The accumulation of macrophages at the injury site is modeled by its recruitment due to inflammation, which is assumed to be proportional to the debris density.
Furthermore, it is assumed that the differentiation rates of MSCs into osteoblasts and osteoblasts into osteocytes are constant. MSCs synthesize the fibrocartilage, while osteoblasts synthesize the woven bone. It is also assumed that only the fibrocartilage is constantly removed by the osteoclasts, with the density of the osteoclasts being assumed proportional to the density of the osteoblasts [
30]. In addition, it is assumed that the populations of the two tissue cells,
and
, experience logistic growth, where the growth rates decrease linearly as the population sizes approach a maximum value,
and
, respectively, imposed by the limited resources of the environment [
30,
40]. It is also assumed that there is no recruitment of MSCs and osteoblasts.
4. Model Formulation
The inflammatory and repair phases of the bone fracture healing process are modeled with a mass-action system of nonlinear ordinary differential equations. All variables represent homogeneous quantities in a given volume. Following the outlined biological assumptions and the flow diagram given in
Figure 2 yields the resulting system of equations:
Equation (
1) describes the rate of change with respect to time of the debris density, which decreases proportionally to
and
. The engulfing rate
is modeled by a Hill Type II function to represent the saturation of the phagocyte rate of macrophages [
38,
41]:
Equation (2) describes the rate of change with respect to time of the undifferentiated macrophages density. It increases because of migration and decreases by differentiating into
and
or by a constant emigration rate. It is assumed that
migrate to the injury site proportionally to
D, up to a maximal constant rate,
, [
22,
28]:
where
. The differentiation rates of
into
and
are stimulated by the cytokines accordingly to Hill Type II equations, respectively [
29]:
Equation (3) describes the rate of change with respect to time of
, which increases when
activates to
, and
shifts phenotype; and decreases by emigration, and when
shift phenotype. Similarly, Equation (4) describes the rate of change with respect to time of
. Equations (5) and (6) describes the rate of change with respect to time of
and
. Here,
,
,
, and
are the constant rates of the cytokine productions and
and
are the cytokine constant decay rates. The inhibitory effects of the anti-inflammatory cytokines are modeled by the following functions [
29]:
Equation (7) describes the rate of change with respect to time of
, which increases by cellular division up to a constant-maximal carrying capacity,
, and decreases by differentiation [
30]. The total MSC proliferation rate is modeled by [
42]:
where in the absent of inflammation,
, MSC proliferate at a constant rate
. However, when there is inflammation,
, and the proliferation rate of MSCs increases or decreases according to the concentration of
(i.e., high concentration levels of
inhibit
proliferation, while low concentration levels of
accelerate
proliferation). The differentiation rate of
is inhibited by
, which is modeled by the following function [
11]:
Equation (8) describes the rate of change with respect to time of
. It increases when MSC differentiate into osteoblasts, or when osteoblasts proliferate [
30]. It decreases at a constant rate
when osteoblasts differentiate into osteocytes. The osteoblast proliferation rate is inhibited by
, which is modeled by the following function [
11]:
Equations (9) and (10) describe the rate of change with respect to time of the fibrocartilage and woven bone, where
and
are the tissue constant synthesis rates and
,
, and
are the tissue degradation rates, respectively [
30].
5. Analysis of the Model
The analysis of Model (1)–(10) is done by finding the equilibria and their corresponding stability properties. An equilibrium is a state of the system where the variables do not change over time [
40]. Once the equilibria are identified, it is important to determine the behavior of the model near the equilibria by analyzing their local stability properties. An equilibrium is locally stable if the system moves toward it when it is near the equilibrium, otherwise it is unstable [
40]. Therefore, the equilibria provide the possible outcomes of the bone fracture healing process, and their corresponding stability properties define the conditions under which a particular healing result occurs.
System (1)–(10) has the following three biologically meaningful equilibria of the vector form
:
,
where
,
,
, and
. The existence conditions for the three equilibria are summarized in
Table 1 and their stability conditions are summarized in
Table 2, and are proved in
Appendix A.
The existence conditions, listed in
Table 1, arise from the fact that all biologically meaningful variables are nonnegative. Therefore, the existence condition for
requires the steady state tissue densities to be either zero or any positive number. For
, the existence condition arises from the requirement that the steady state density of
must be greater than zero, which implies that the proliferation rate of osteoblasts must be greater than their differentiation rate (i.e.,
).
Similarly for , the existence condition arises from the requirement that the steady state density for must be greater than zero, which implies that the proliferation rate of MSCs must be greater than their differentiation rate (i.e., ).
The stability conditions of each biologically feasible equilibrium are listed in
Table 2, and is determined from the eigenvalues of its associated Jacobian matrix (see
Appendix A), as follows:
is stable when and (see Theorem A1), which implies that the differentiation rates of the MSC and osteoblasts are greater than or equal to their proliferation rates, respectively. The steady-state represents a nonunion. In this case, the inflammation is resolved, since the first five entries of are zero; however, the repair process has failed since the osteoblasts and osteoclasts have died out before the beginning of the remodeling process. Hence, the tissue densities, and , can be any two positive values smaller than their maximal densities, and , respectively (see Theorem A1).
is stable when and (see Theorem A2). The steady-state represents a successful repair of the bone fracture, where the inflammation is resolved, the fibrocartilage is completely removed from the repair site, and the woven bone has achieved its maximal density. In this case, osteoblasts proliferate faster than they differentiate, while MSC have the opposite behavior.
is stable when (see Theorem A3). The steady-state represents a nonunion or delayed union, where the inflammation is resolved, but the osteoclasts have failed to degrade the cartilage in a timely fashion.
6. Numerical Results
The proposed new model (1)–(10) is used to study the importance of macrophages during the inflammatory and repair phases of the bone fracture healing process, which occur within the first 21 days after trauma [
11,
13]. It is also used to investigate the evolution of a broken bone under normal and pathological conditions.
Table 3 summarizes the baseline parameter values and units for the numerical simulations. These values are estimated in a qualitative manner from data in other studies [
11,
27,
30,
38,
39,
43]. Some of those, from [
11], were also rescaled to account for the different mathematical expressions of the proliferation and differentiation rates of the tissue cells. All parameter values are based on murine experiments, with healthy mice having a moderate fracture (a broken bone with a gap size less than 3 mm) [
30,
43]. However, the bone fracture healing process for humans involves the same cells, cytokines, and qualitative dynamics, differing only in the number of cells, concentrations, and the length of time it takes for a full recovery [
24].
First, a set of numerical simulation results was presented to compare two mathematical models of the bone fracture healing process that incorporate macrophages: The model developed in [
11], and the new model (1)–(10). Next, numerical simulations were performed to support the theoretical stability results (successful and nonunion equilibria) and to numerically monitor the healing progression of a moderate fracture in normal conditions. Another set of numerical simulations was performed to analyze the effects of different debris densities on bone fracture healing. Finally, a set of numerical simulation results was presented, to investigate the effects of different concentrations of anti-inflammatory cytokines and various cellular treatments on the fracture healing under numerous pathological conditions. All simulations were obtained by using the adaptive
Matlab solver
, and were initiated with densities of debris, macrophages, and MSCs set to
,
,
, respectively, and the pro-inflammatory cytokine concentration set to
.
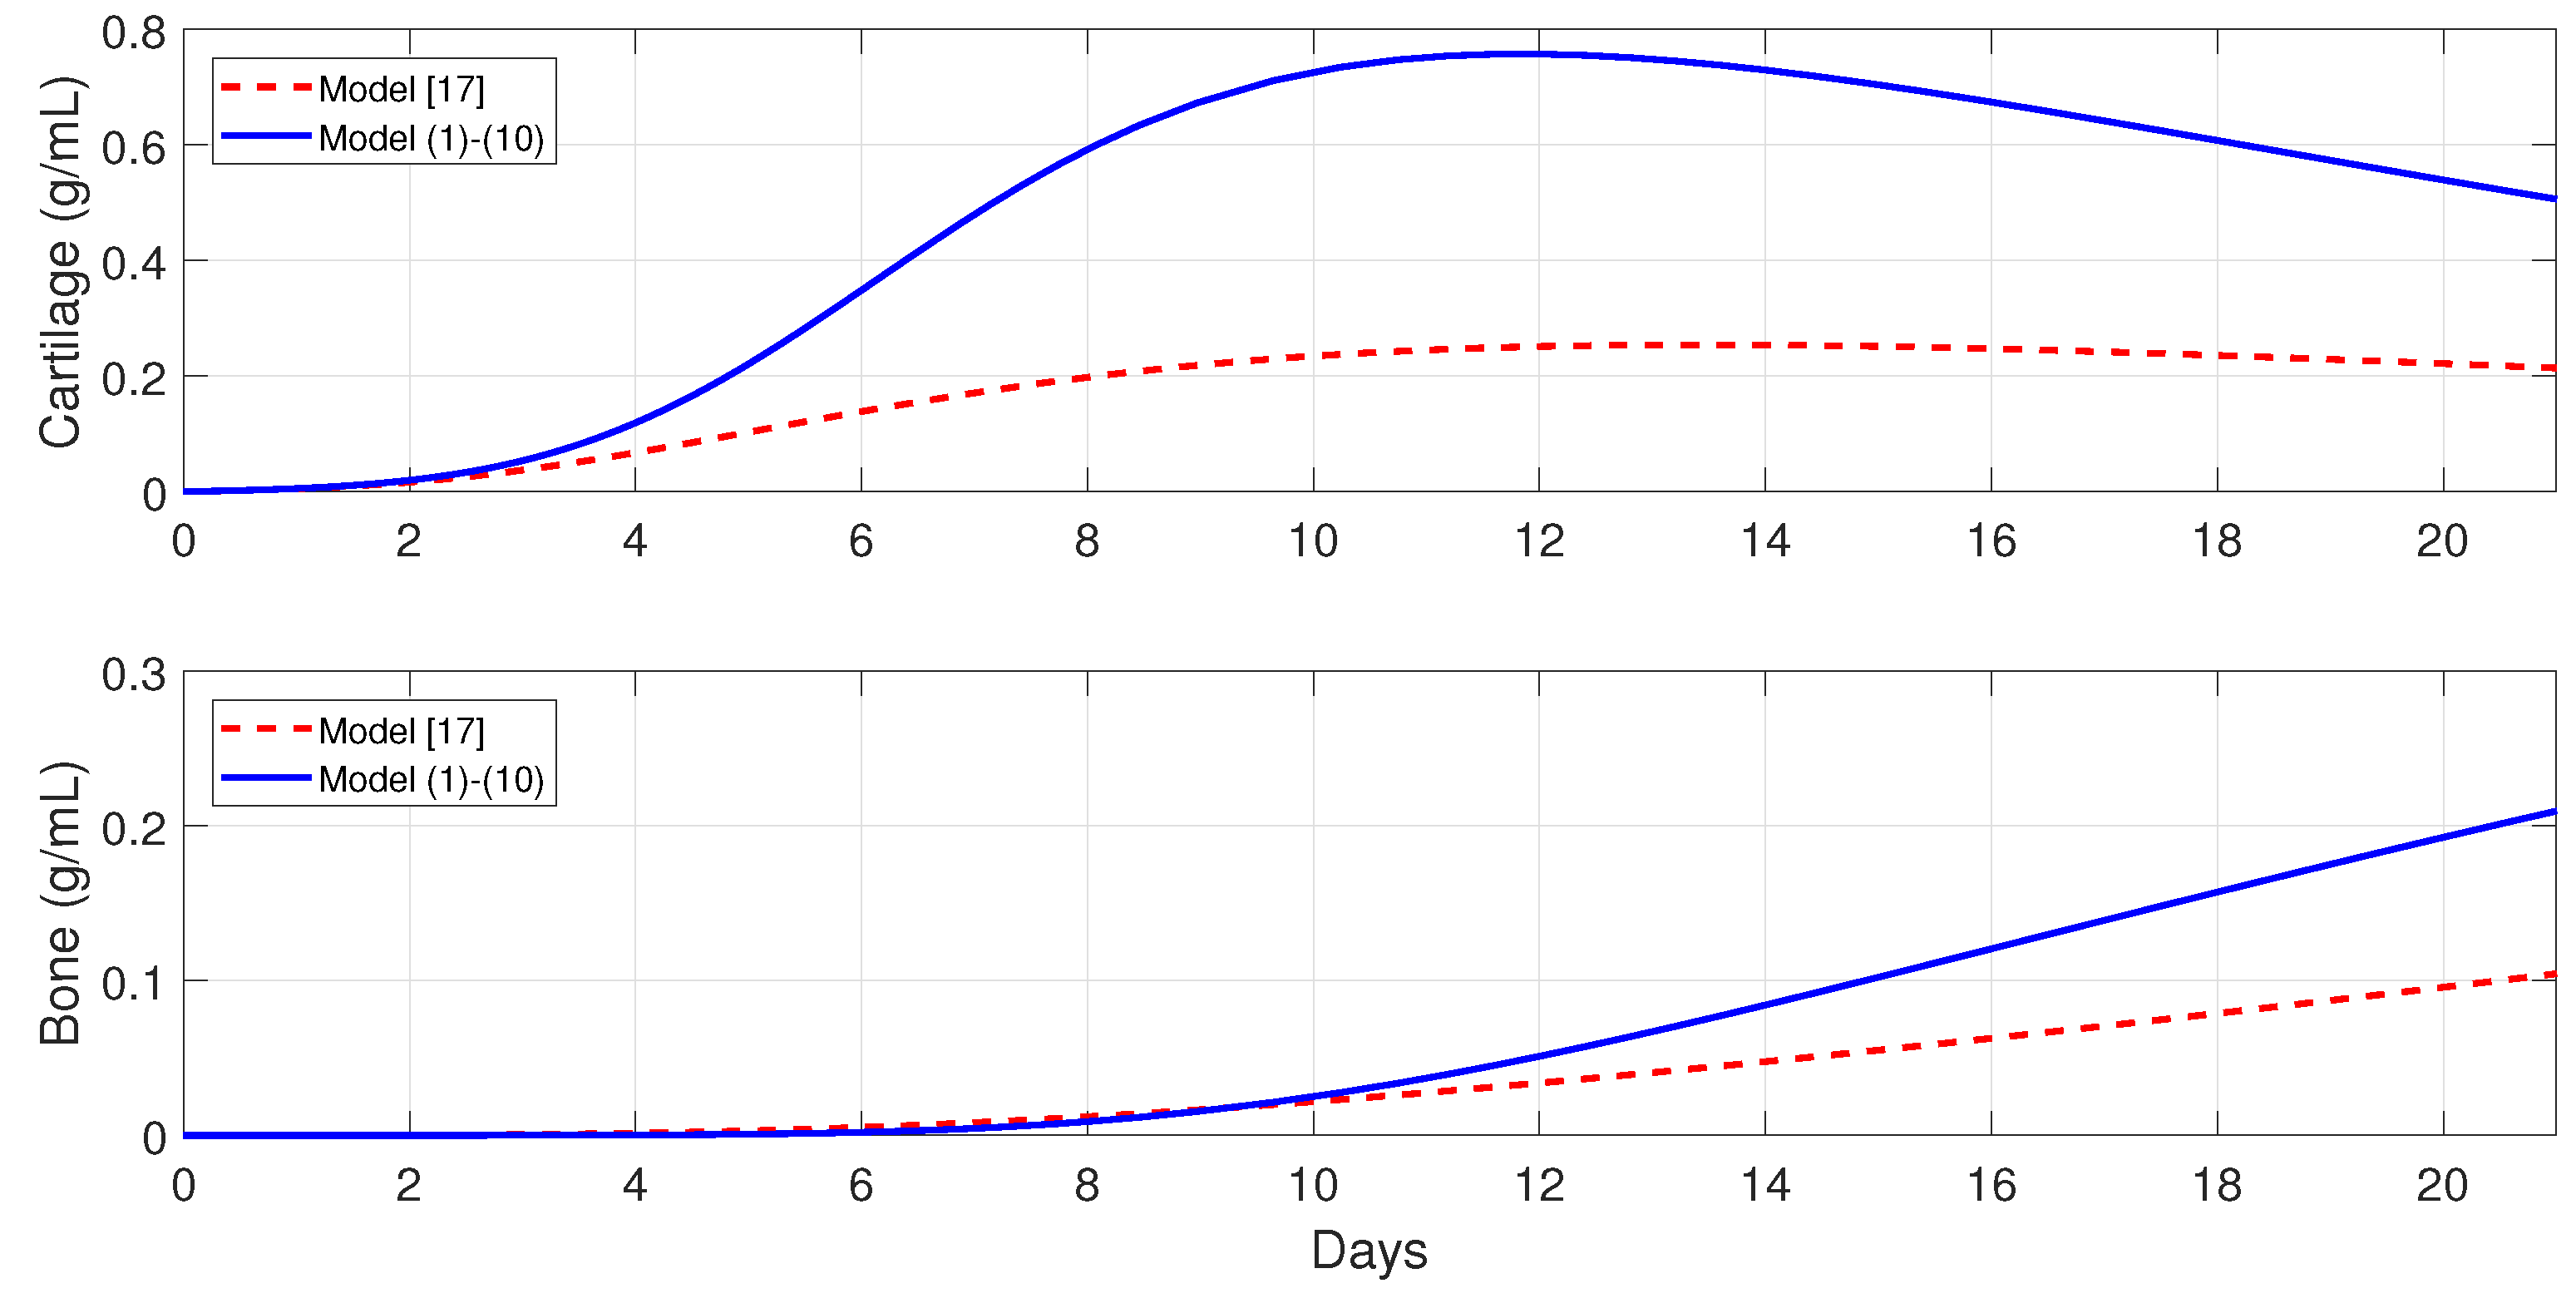
6.1. Comparison of Existing Models
The model developed in [
11] and the present mathematical model (1)–(10) were compared when
(i.e., the initial debris concentration was below the half-saturation of debris). In this case, the macrophage digestion rate increased approximately linearly with respect to the debris population, as assumed in model [
11]. The same parameter values were used in both models (
Table 3), with
,
,
,
, and
.
Figure 3 shows the numerical evolutions of the tissues’ production when
. In all simulations, we refer to fibrocartilage and woven bone as cartilage and bone, respectively. The production of cartilage
and bone
given by the present model is much more realistic than the production given by the model developed [
11], since, according to the experimental data, the cartilage production peaks to its maximal density of around 1 g/mL about 10–12 days after trauma, and significant bone tissue production is observed after the second week [
44].
6.2. Different Outcomes of the Bone Fracture Healing Process
Next, a set of numerical simulations is presented to support the theoretical results. Accordingly to the qualitative analysis of the model there are three equilibria:
,
, and
, where their stability conditions are determined by the tissue cells’ proliferation and differentiation rates,
,
,
and
, respectively. The following parameter values were used:
,
,
, and
, to demonstrate the stability of
, since then
and
. The stability of
was demonstrated using the following parameter values:
,
,
, and
, since then
and
. Finally, the following parameter values were used:
and
, to demonstrate the stability of
, since then
. Different time-periods are used in
Figure 4,
Figure 5 and
Figure 6 to better demonstrate the qualitative behavior of the system under different stability conditions.
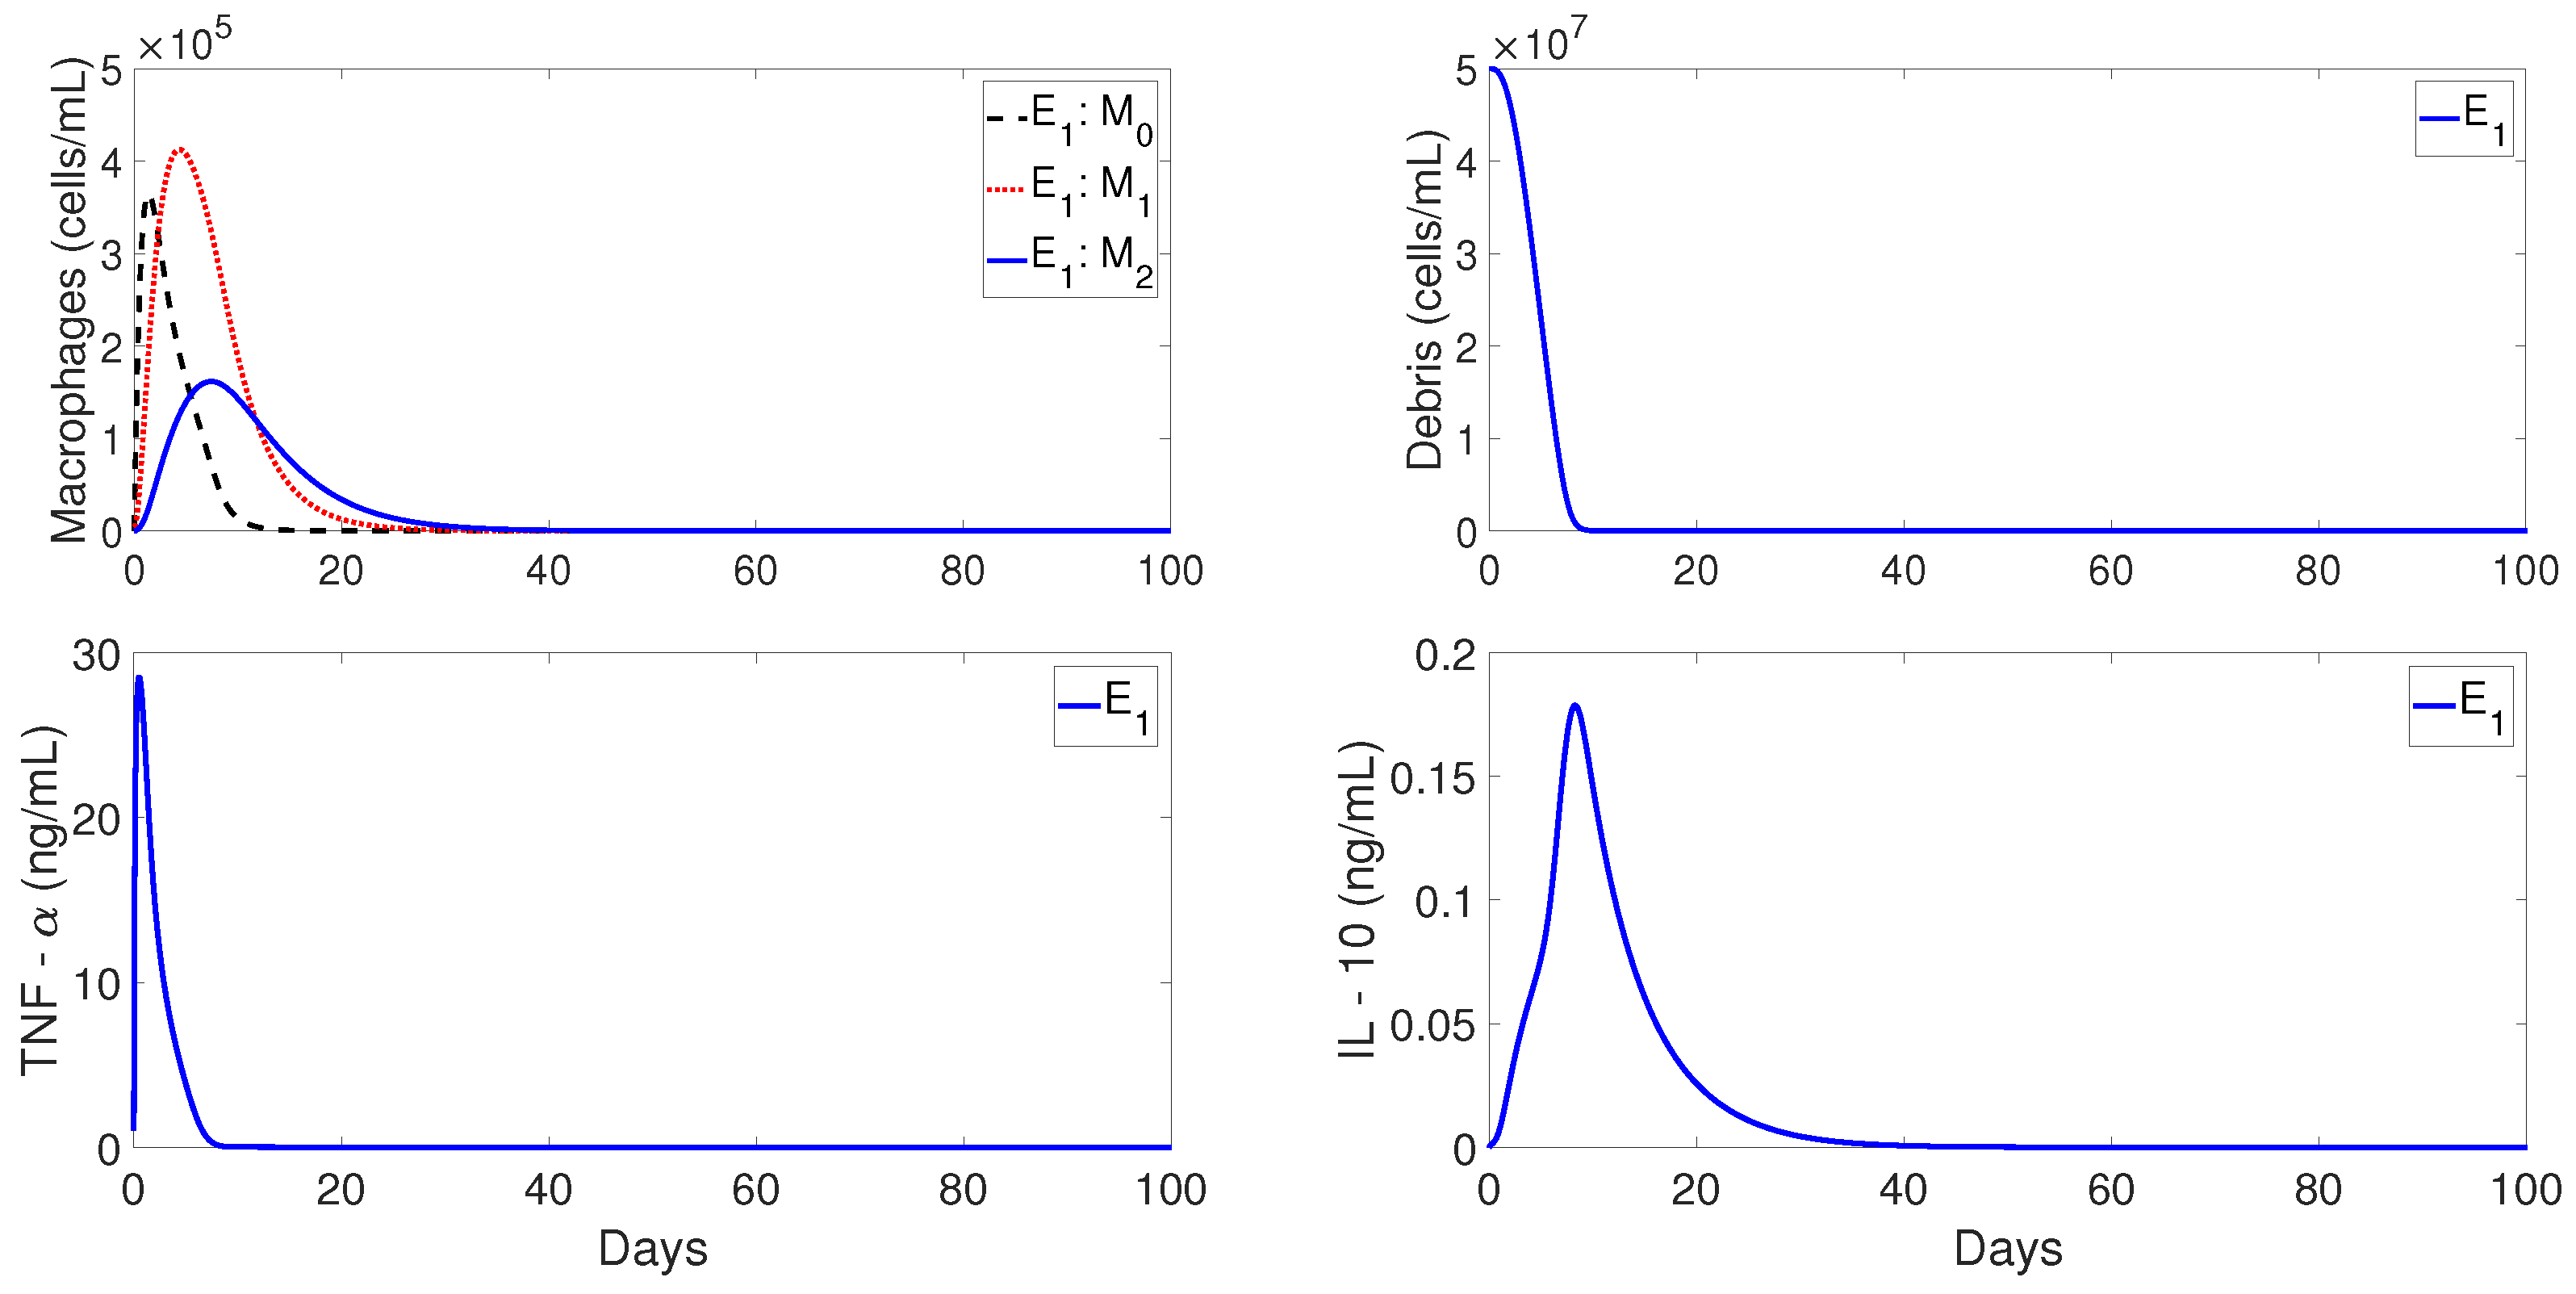
Figure 4 shows the qualitative behavior of
for the macrophages, debris, TNF-
, and IL-10 densities, with the inflammation being resolved in about 40 days. The top-left plot of
Figure 4 shows the temporal evolution of
(dashed lines),
(dotted lines), and
(solid lines). It can be observed that
first peaks to its maximum value, which is then followed by
. Similar sequences of transitions of first
, and then
, are commonly observed in normal tissue healing conditions [
2,
39].
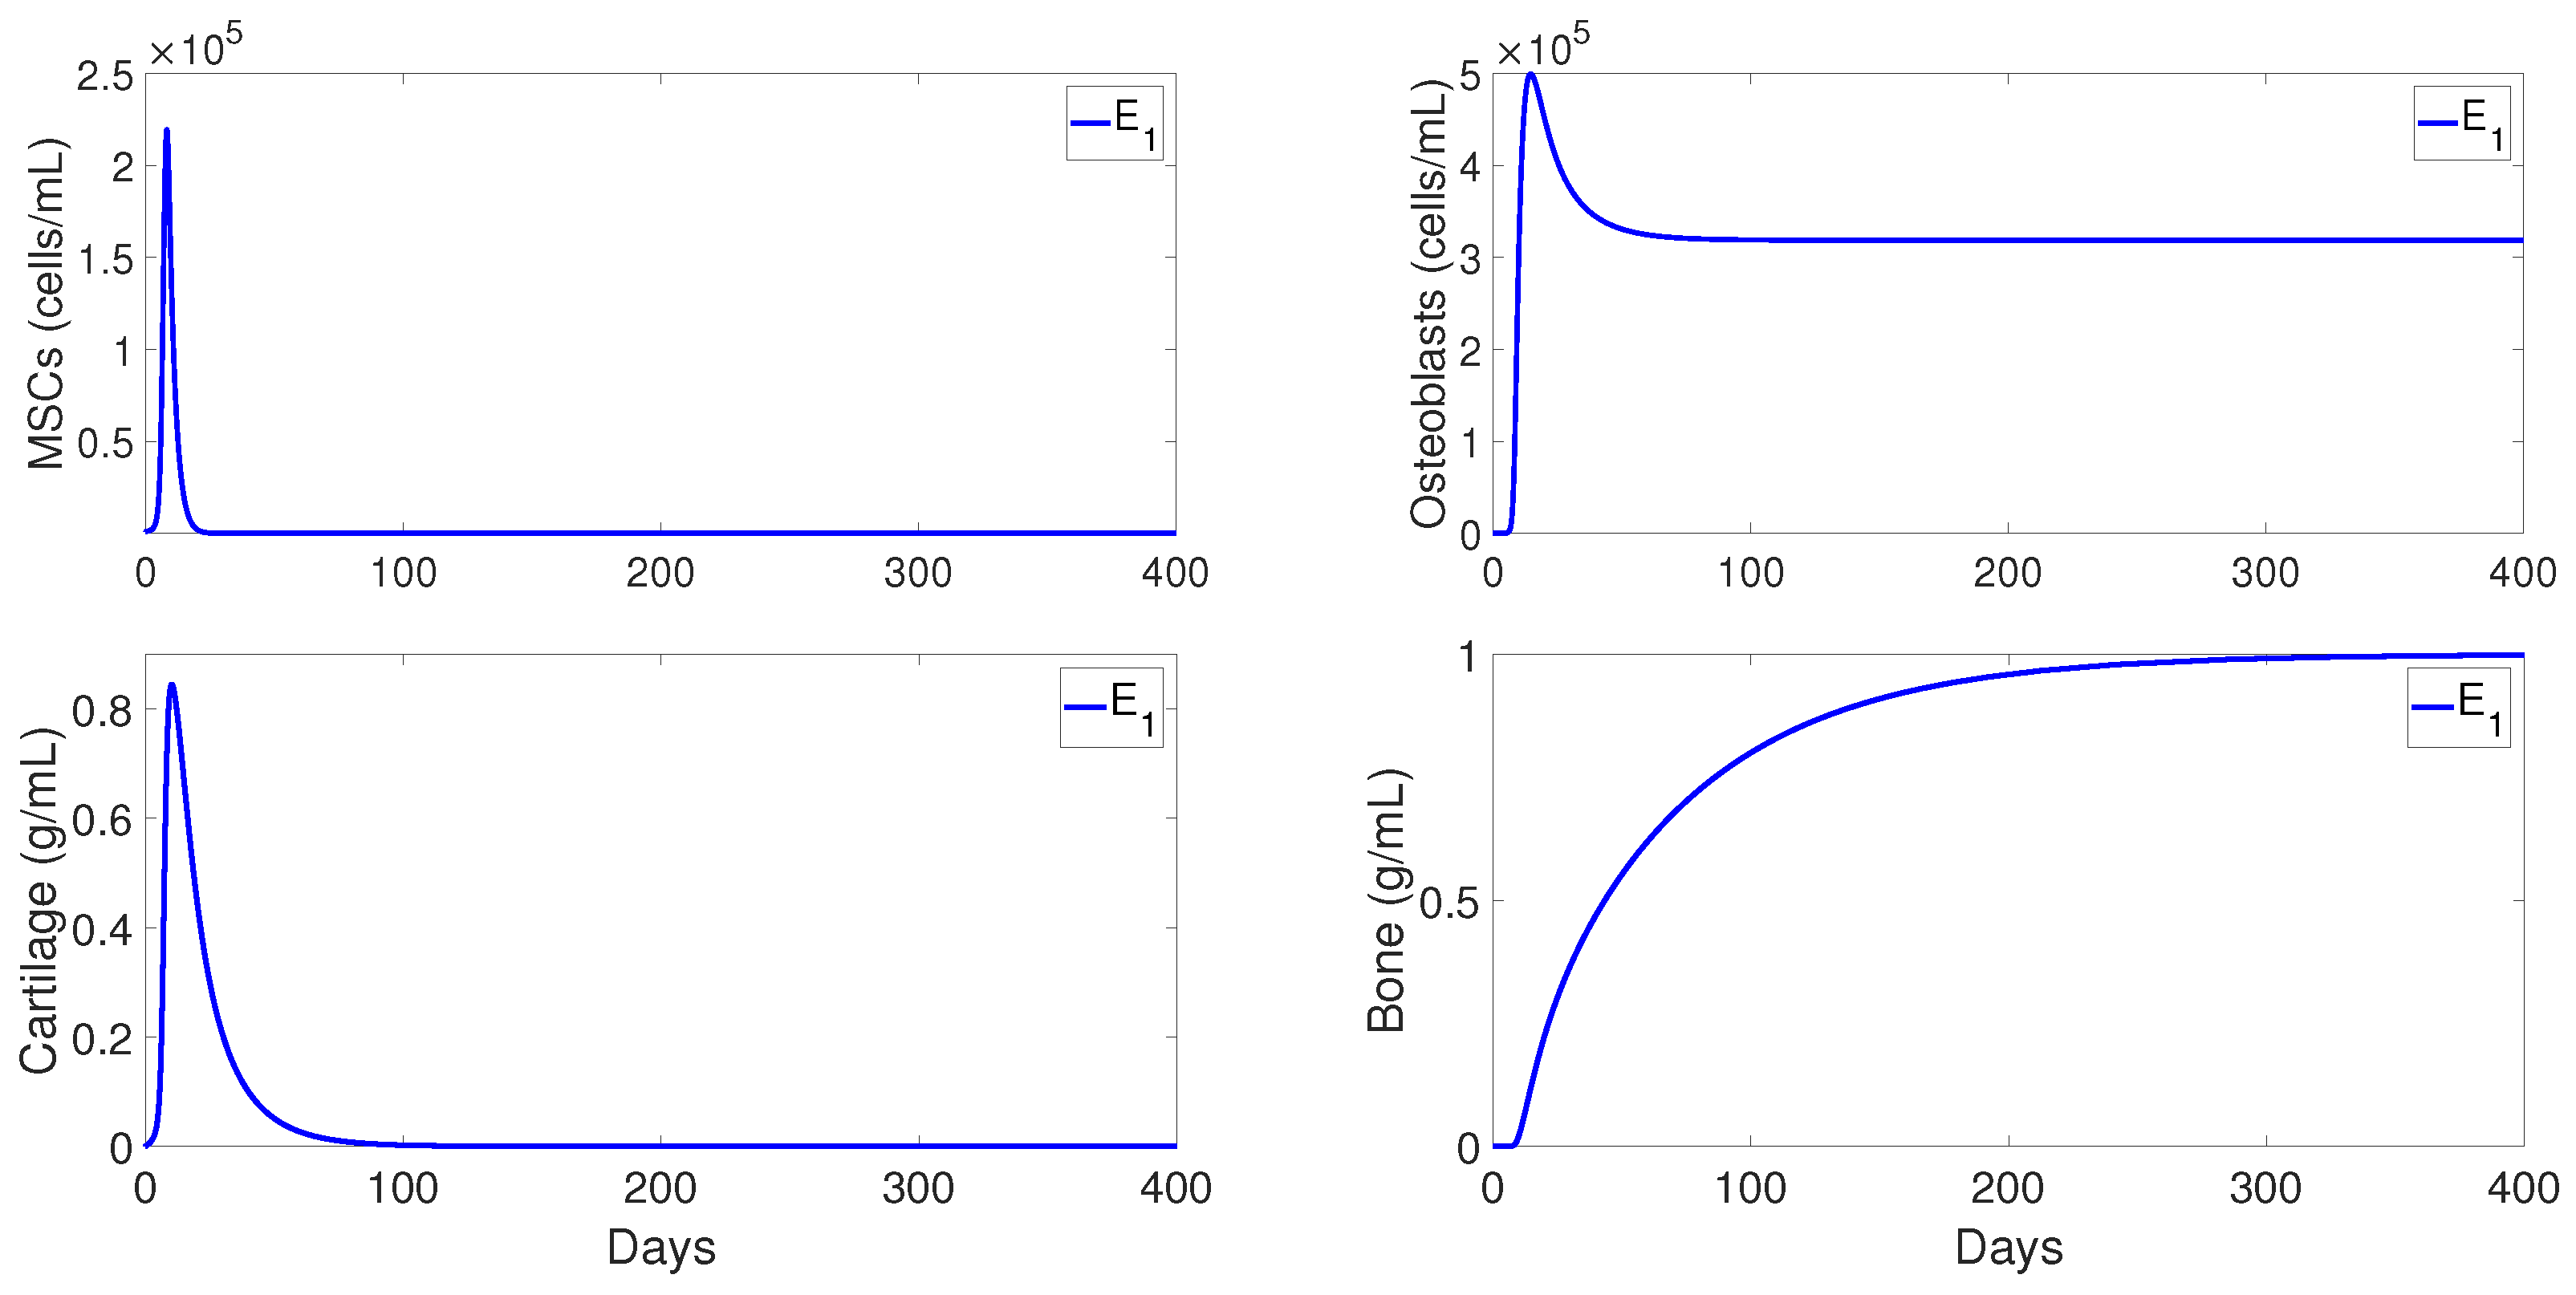
Figure 5 shows the qualitative behaviors of
for the MSC, osteoblasts, cartilage, and bone densities. Here, the MSC density decayed to zero over time, while the osteoblasts maintained a constant density below their carrying capacity
. In addition, the bottom plots of
Figure 5 shows that the cartilage was eventually degraded by the osteoclasts and the bone achieved its maximum density of 1 ng/mL. Therefore,
exhibits the temporal progression of a successful bone fracture healing.
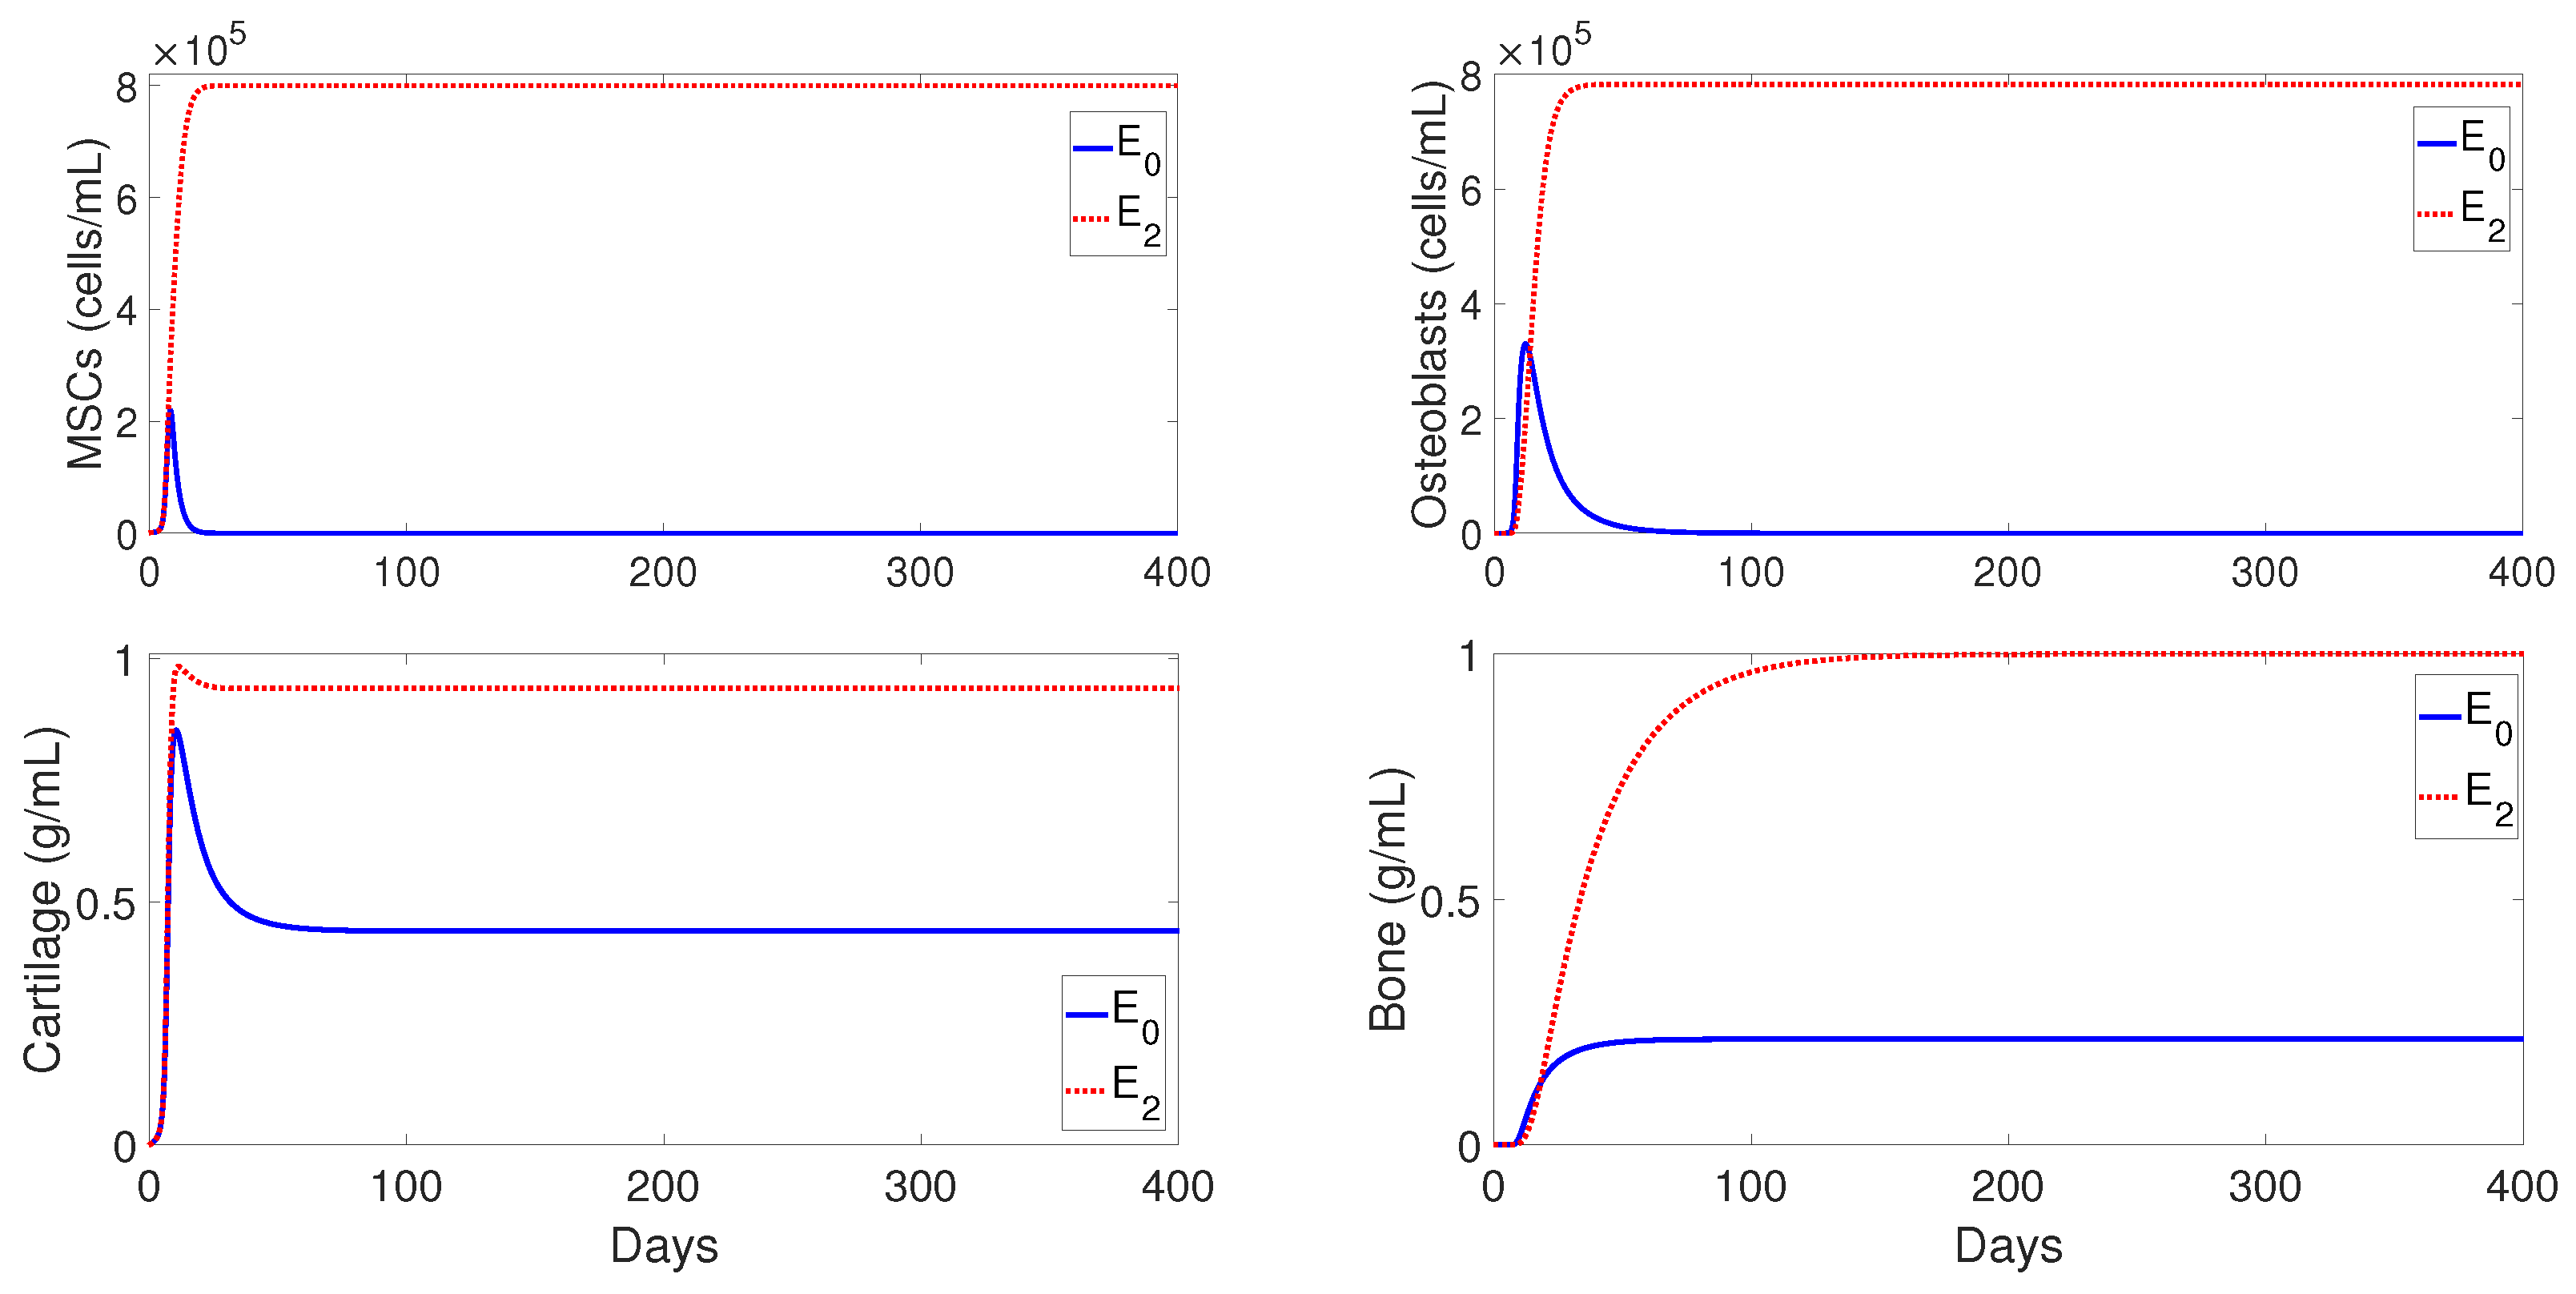
Figure 6 shows the qualitative evolution for the MSC, osteoblasts, cartilage, and bone densities for
(solid lines) and
(dotted lines). Since the temporal evolution of macrophages, debris, and cytokines densities in
and
are similar to those for
showed in
Figure 4, they are omitted here. It can be observed, in
Figure 6, that the two cellular densities in
, MSC, and osteoblasts, decayed to zero over time, with the osteoclasts failing to degrade the cartilage; this results in nonunion. Mathematically, this case occurs when osteoblasts proliferate at a rate lower than their differentiation rate, i.e.,
. In practice, this scenario is commonly observed in advanced-age patients whose MSC and osteoblast cells decrease their capability to proliferate and differentiate [
3]. On the other hand, the two cells and the two tissues in
remain at positive constant values (
Figure 6), but the final fracture healing outcome is still a nonunion. Here, the osteoclasts again fail to degrade the cartilage [
3], even though the bone has achieved its maximum density of 1 ng/mL. Therefore, in this case, migration of osteoclasts must be enhanced through surgical interventions, in order to achieve a successful bone repair [
30].
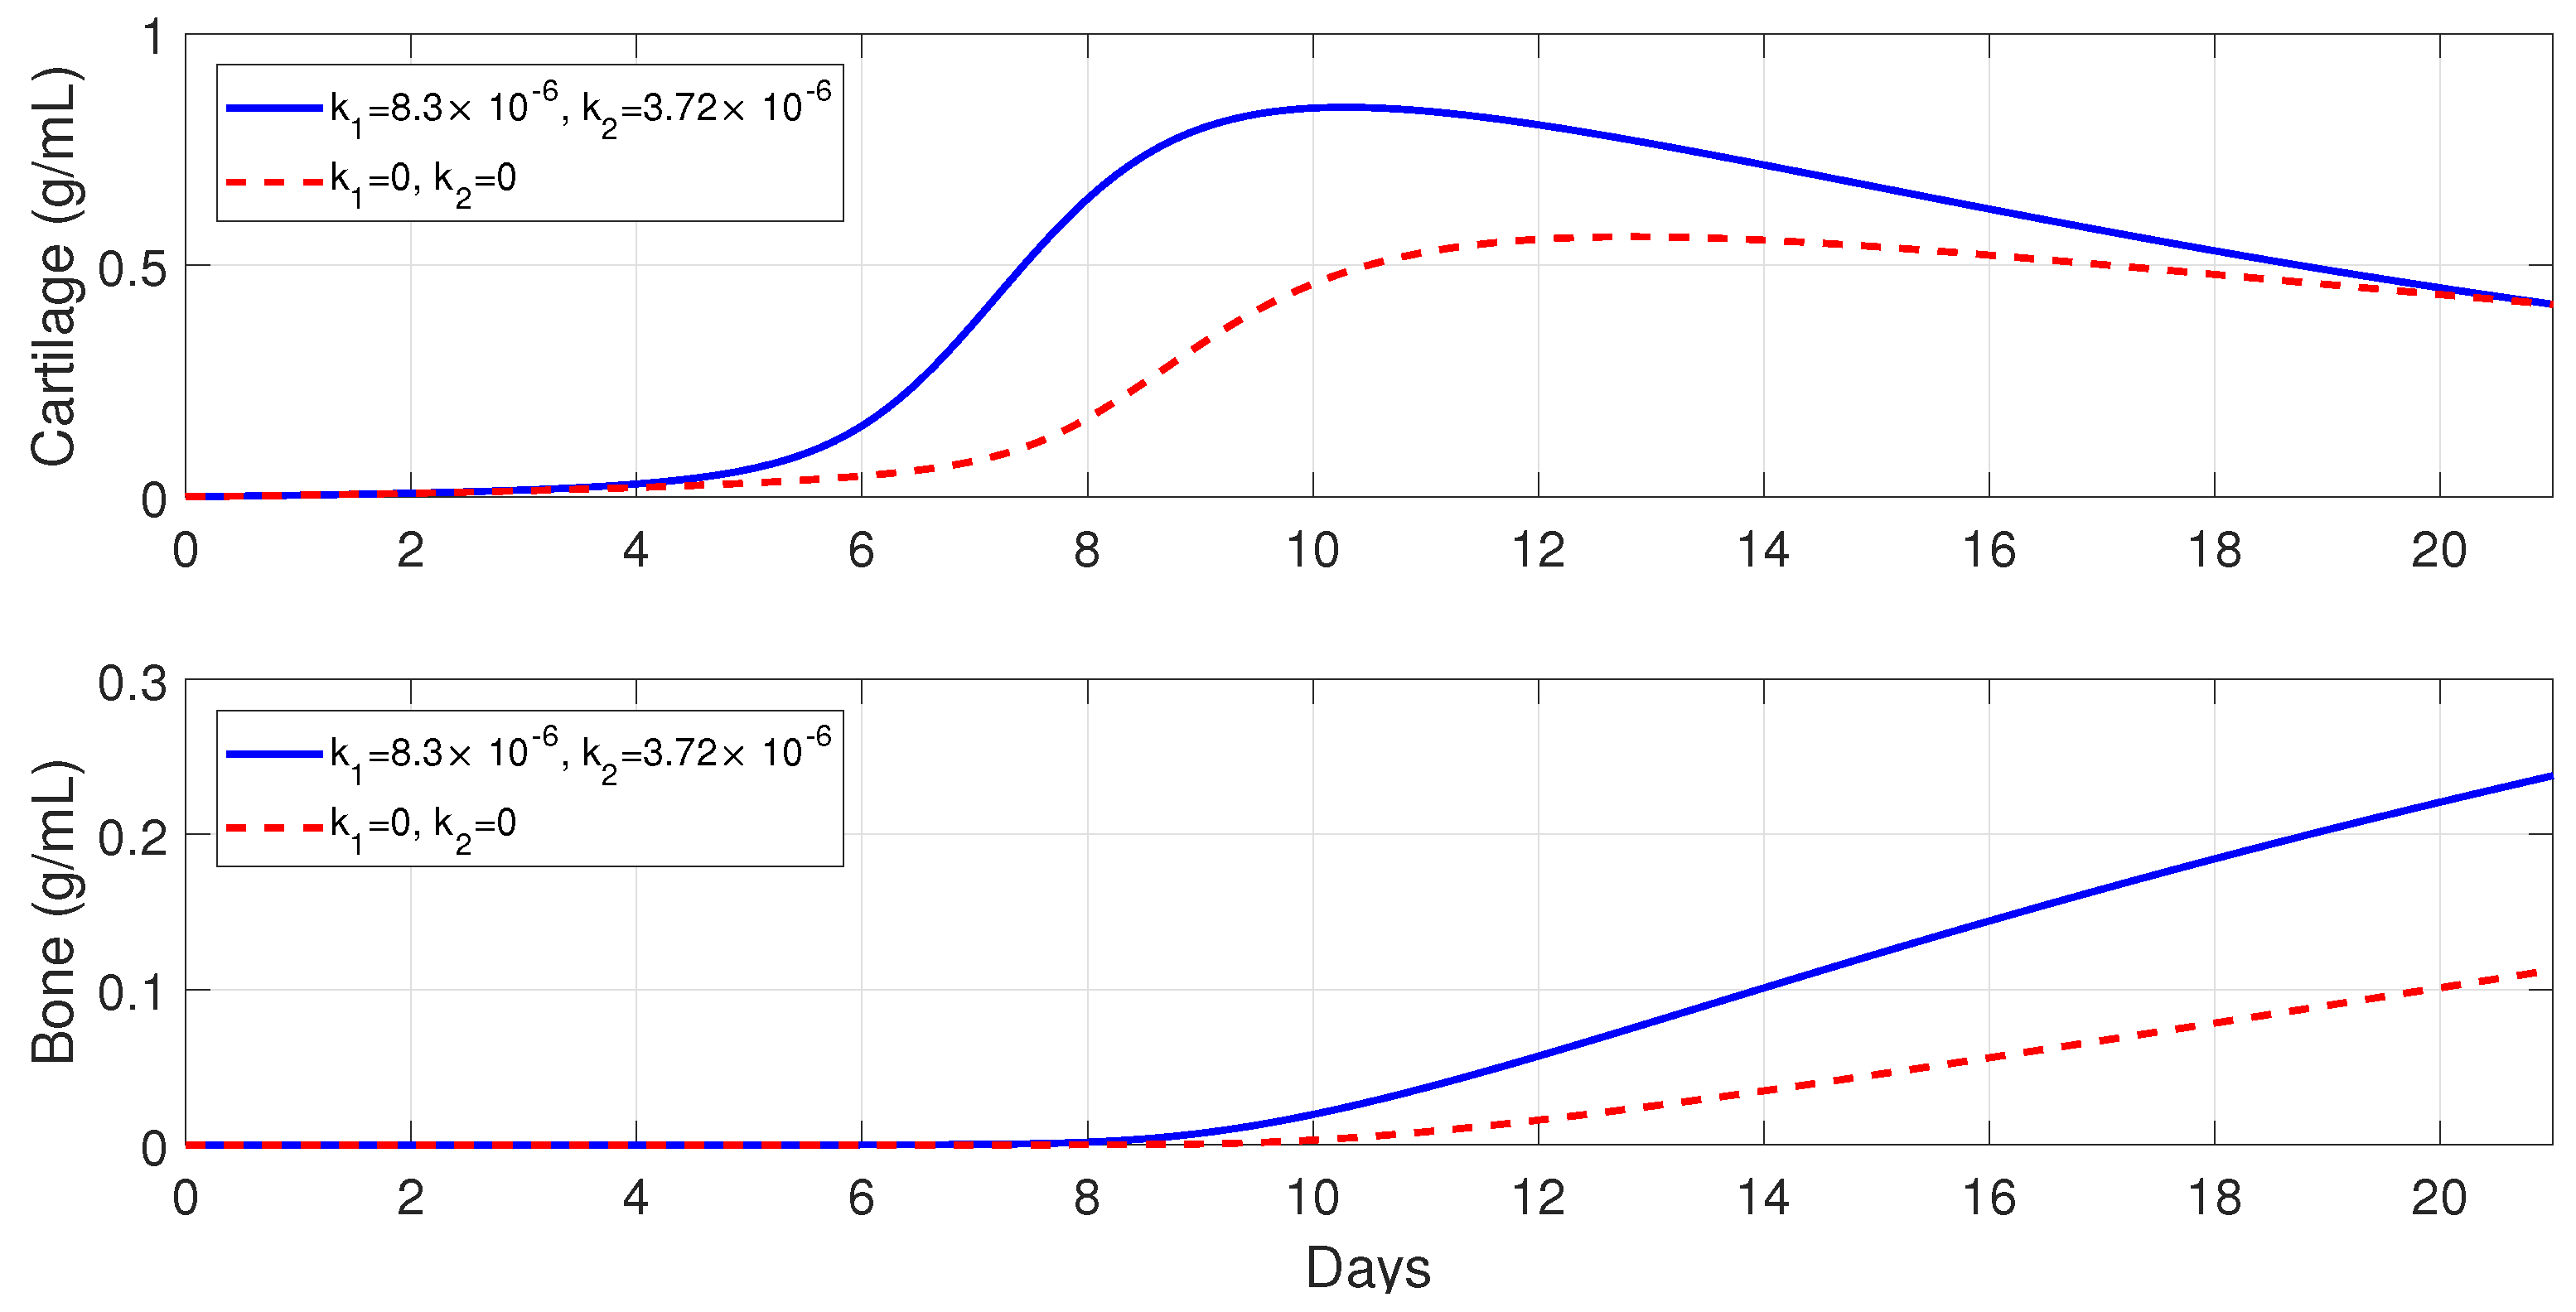
6.3. Importance of Macrophages during the Bone Fracture Healing Process
In this section, the mathematical model is used to investigate the effects of macrophages during the inflammatory and repair phases of the bone fracture healing process. The major contribution of macrophages to fracture healing is through the delivery of pro- and anti-inflammatory cytokines at the repair site. Therefore, the values of the parameters
, representing the secretion rates of
by
,
, are varied in the numerical simulations, as compared to their base values from
Table 3.
Figure 7 shows that macrophages have a drastic effect on the short-term tissue dynamics during the healing process. In the presence of
and
, fibrocartilage formation more than doubles in about 1 week, while woven bone experiences an additional steady increase during the same period and beyond. The simulations presented in
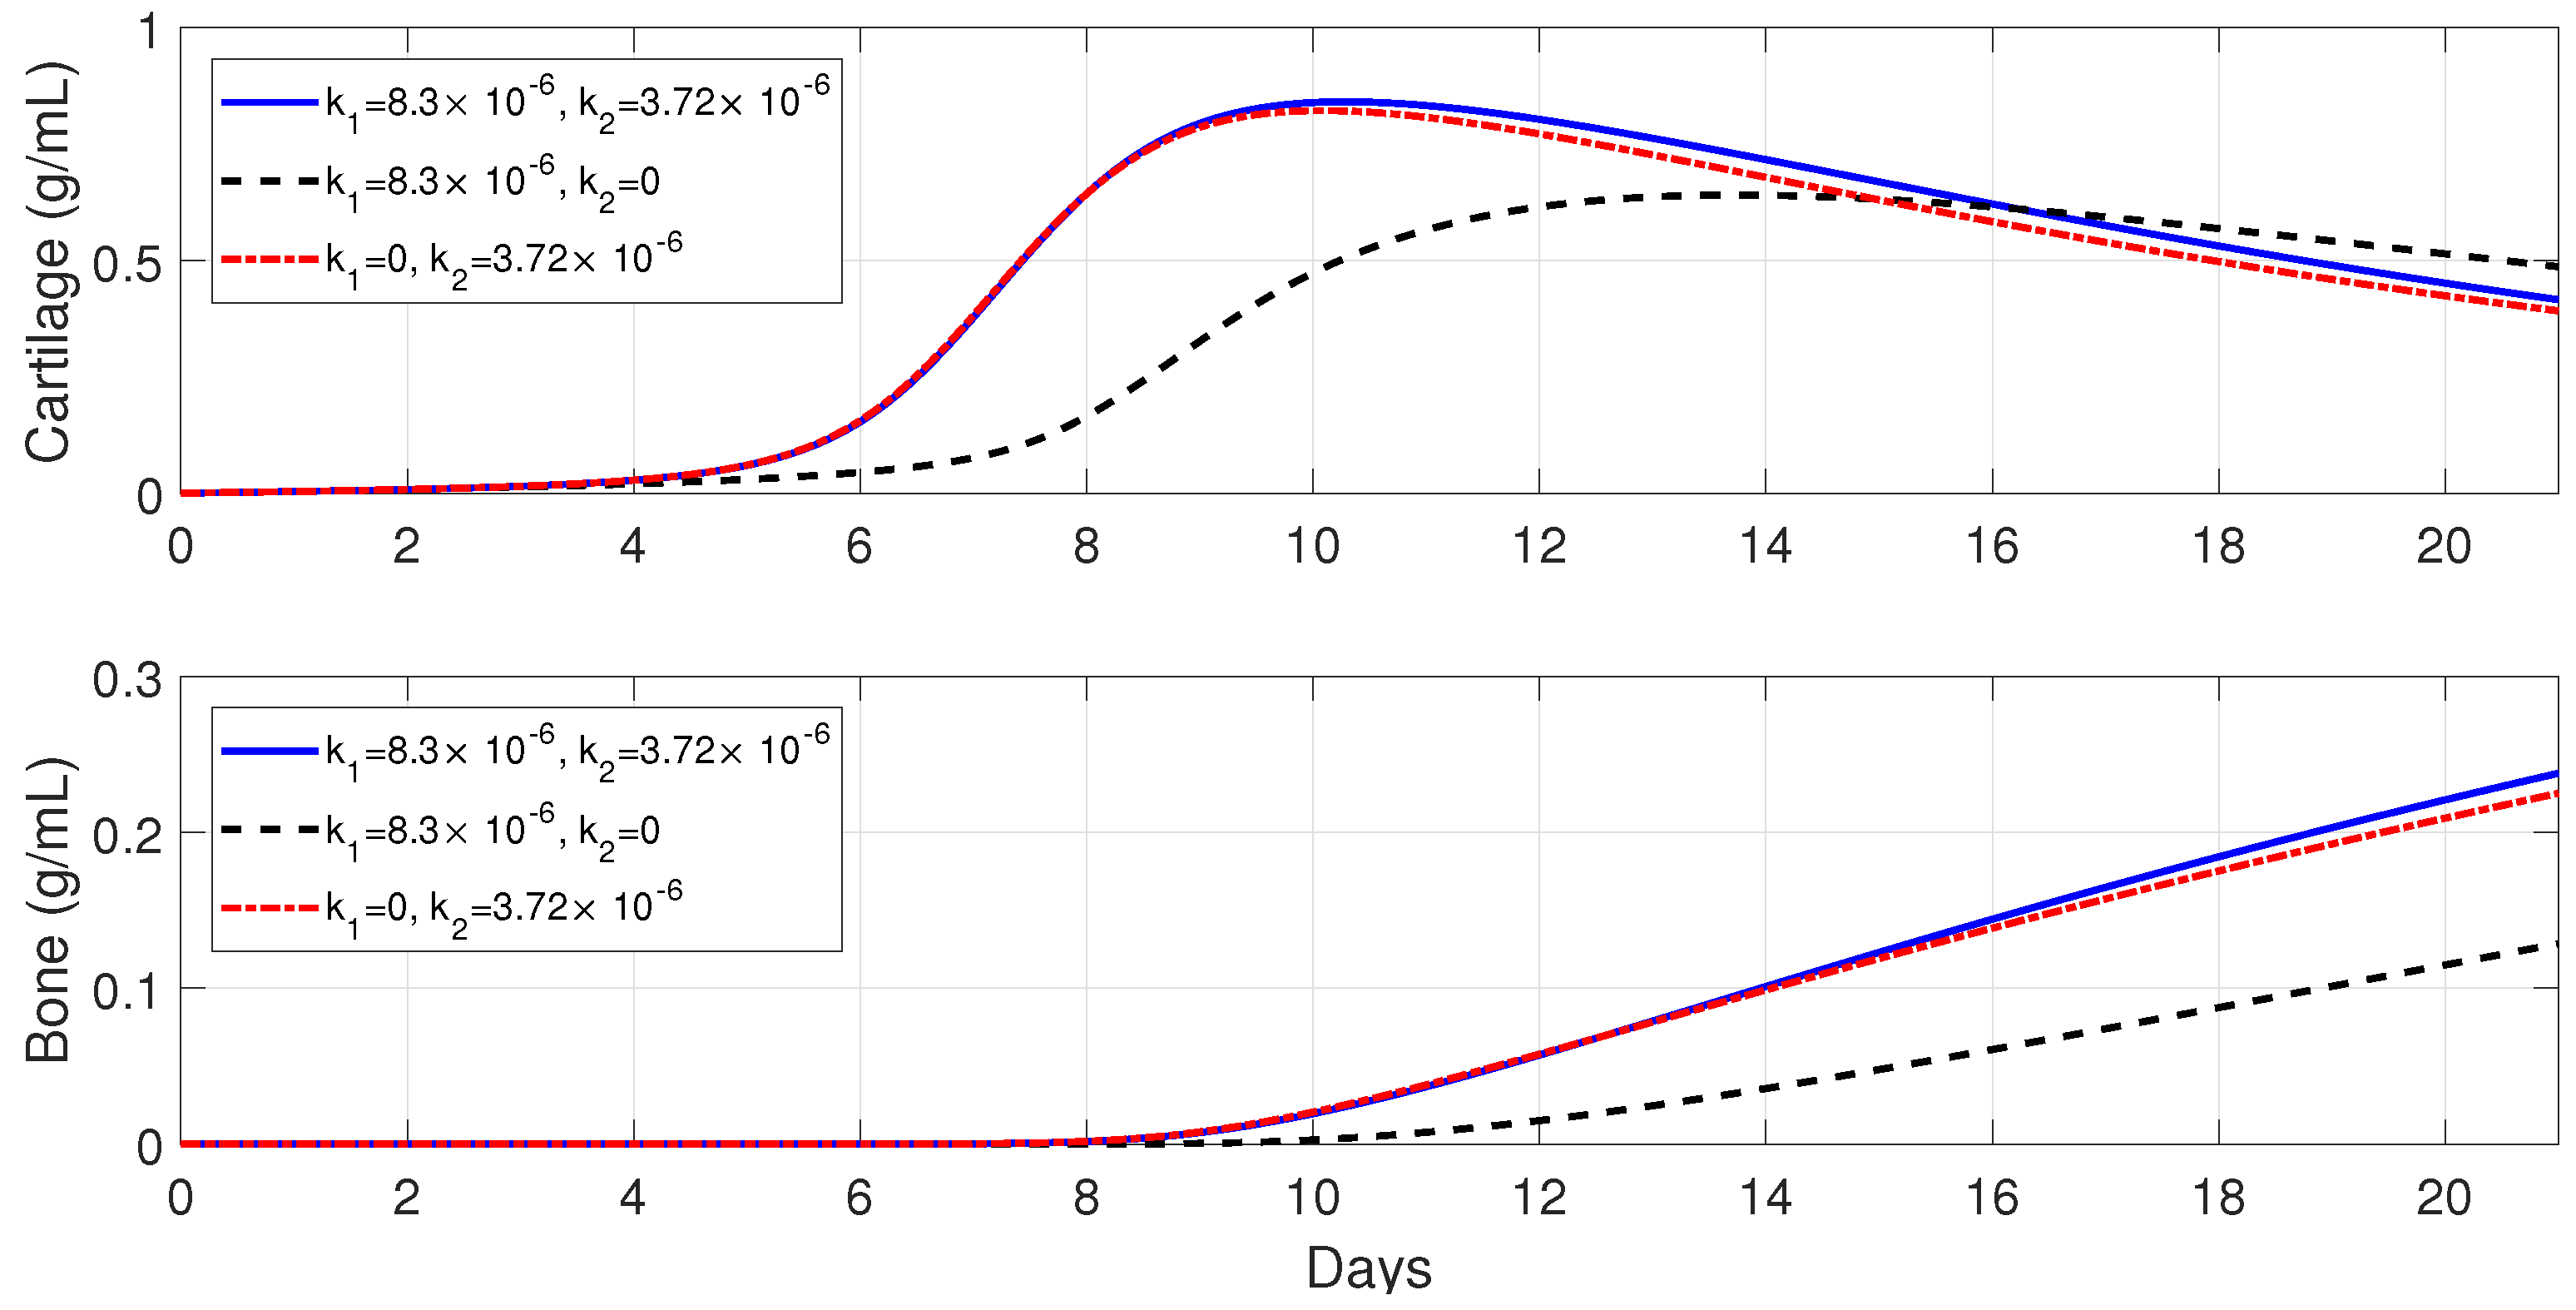
Figure 8 demonstrate the individual effects of the different phenotypes of macrophages, and show that the alternatively activated macrophages
have a more dominant contribution to the tissue production, as compared to the classically activated macrophages
.
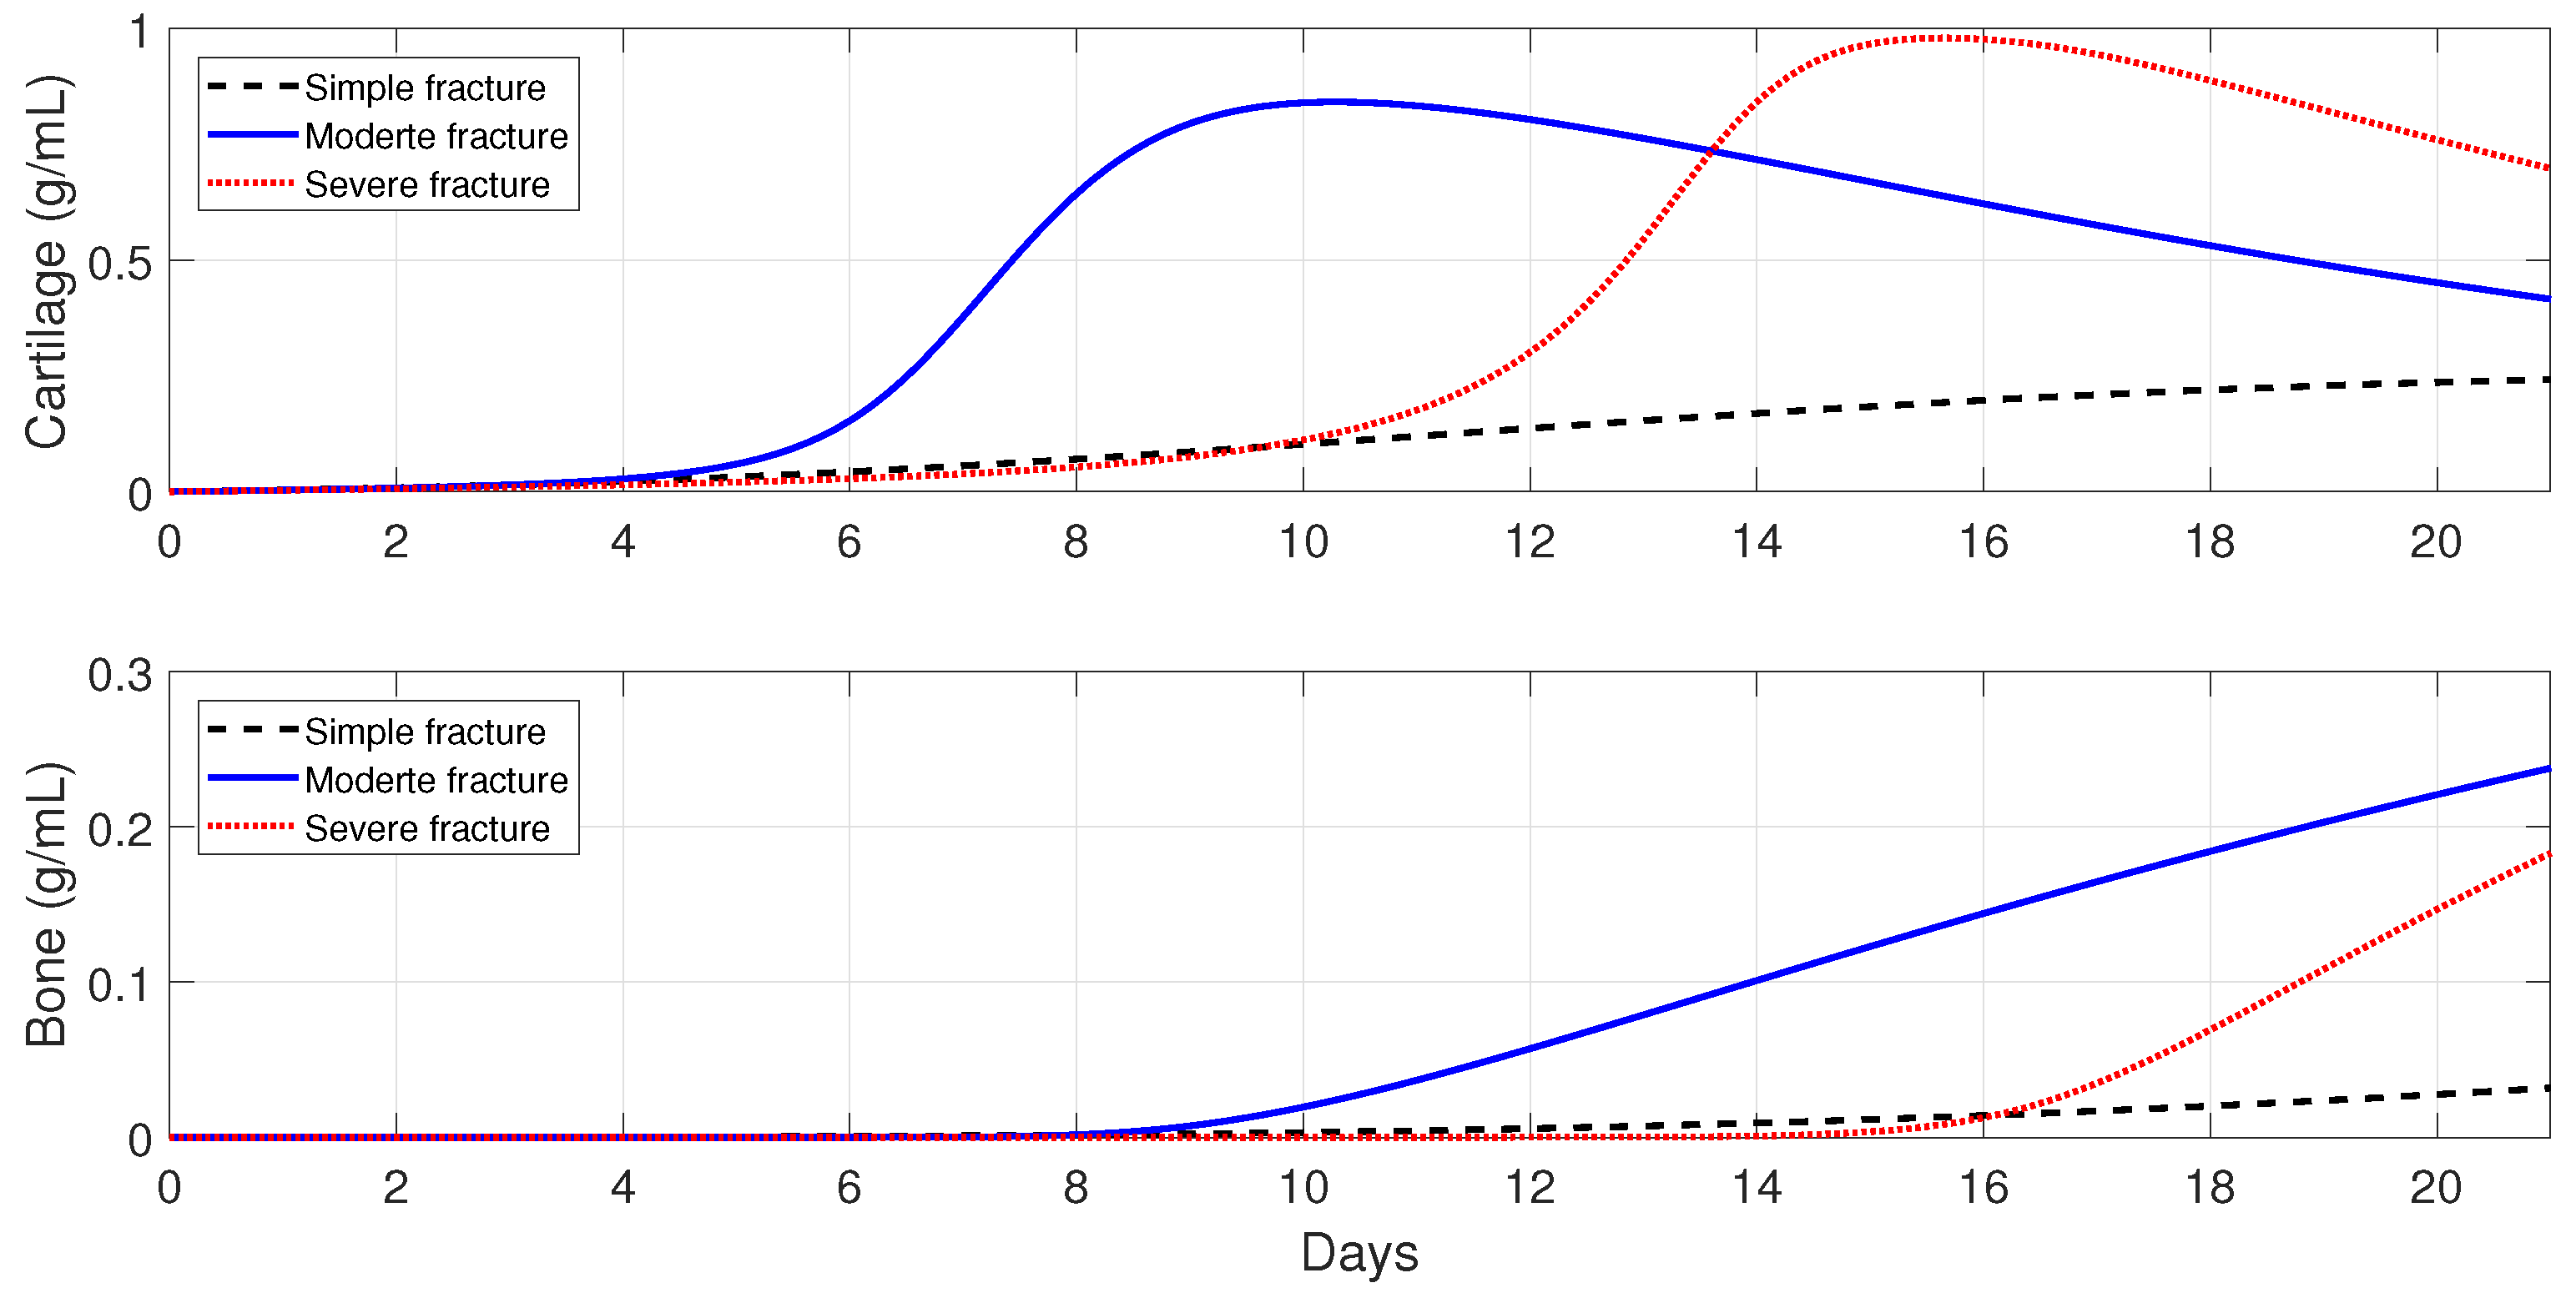
6.4. Evolution of the Healing Process for Different Types of Fractures
In this section, the model is used to monitor the evolution of a successful repair (
Table 3) for different types of fractures. In healthy individuals, simple, moderate, and severe fractures are correlated with the debris densities [
49,
50]. Therefore, the initial debris concentration is set to
,
, and
, for a simple, moderate, and severe fracture, respectively.
Figure 9 shows that the tissue production is a slow process for a simple fracture, since the cartilage and bone densities are less than the corresponding tissue densities for moderate and severe fractures. A slow healing process is commonly observed in micro-crack healing [
49]. Furthermore, there is less cartilage formation over time in simple fractures [
50]. For a moderate fracture, the maximal production of cartilage is observed around 10 days, followed by a significant degradation, while the bone tissue production occurs after the first week. For a severe fracture,
Figure 9 shows that there is a delay in the two tissues’ production, compared with those given by moderate fractures, with the peak of the cartilage and bone production observed at around day 16.
6.5. Immune-Modulation Therapeutic Treatments of Bone Fractures
The administration of anti-inflammatory drugs and the injection and/or transplantation of MSC and macrophages are two of the clinical trials that have been implemented in orthopedics to stimulate and accelerate bone fracture healing [
2,
23]. In this section, Model (1)–(10) is used to explore these possible therapeutic treatments to accelerate the healing of a broken bone, under normal and pathological conditions such as severe fractures, advanced age, and senile osteoporosis [
3].
6.5.1. Administration of Anti-Inflammatory Drugs at the Beginning of the Healing Process
Treatments based on anti-inflammatory cytokines, such as the cytokine-specific agents that block the pro-inflammatory cytokines productions, have exhibited promising clinical results and have led to intense orthopedic research activities [
1,
2,
17,
23,
33,
51,
52,
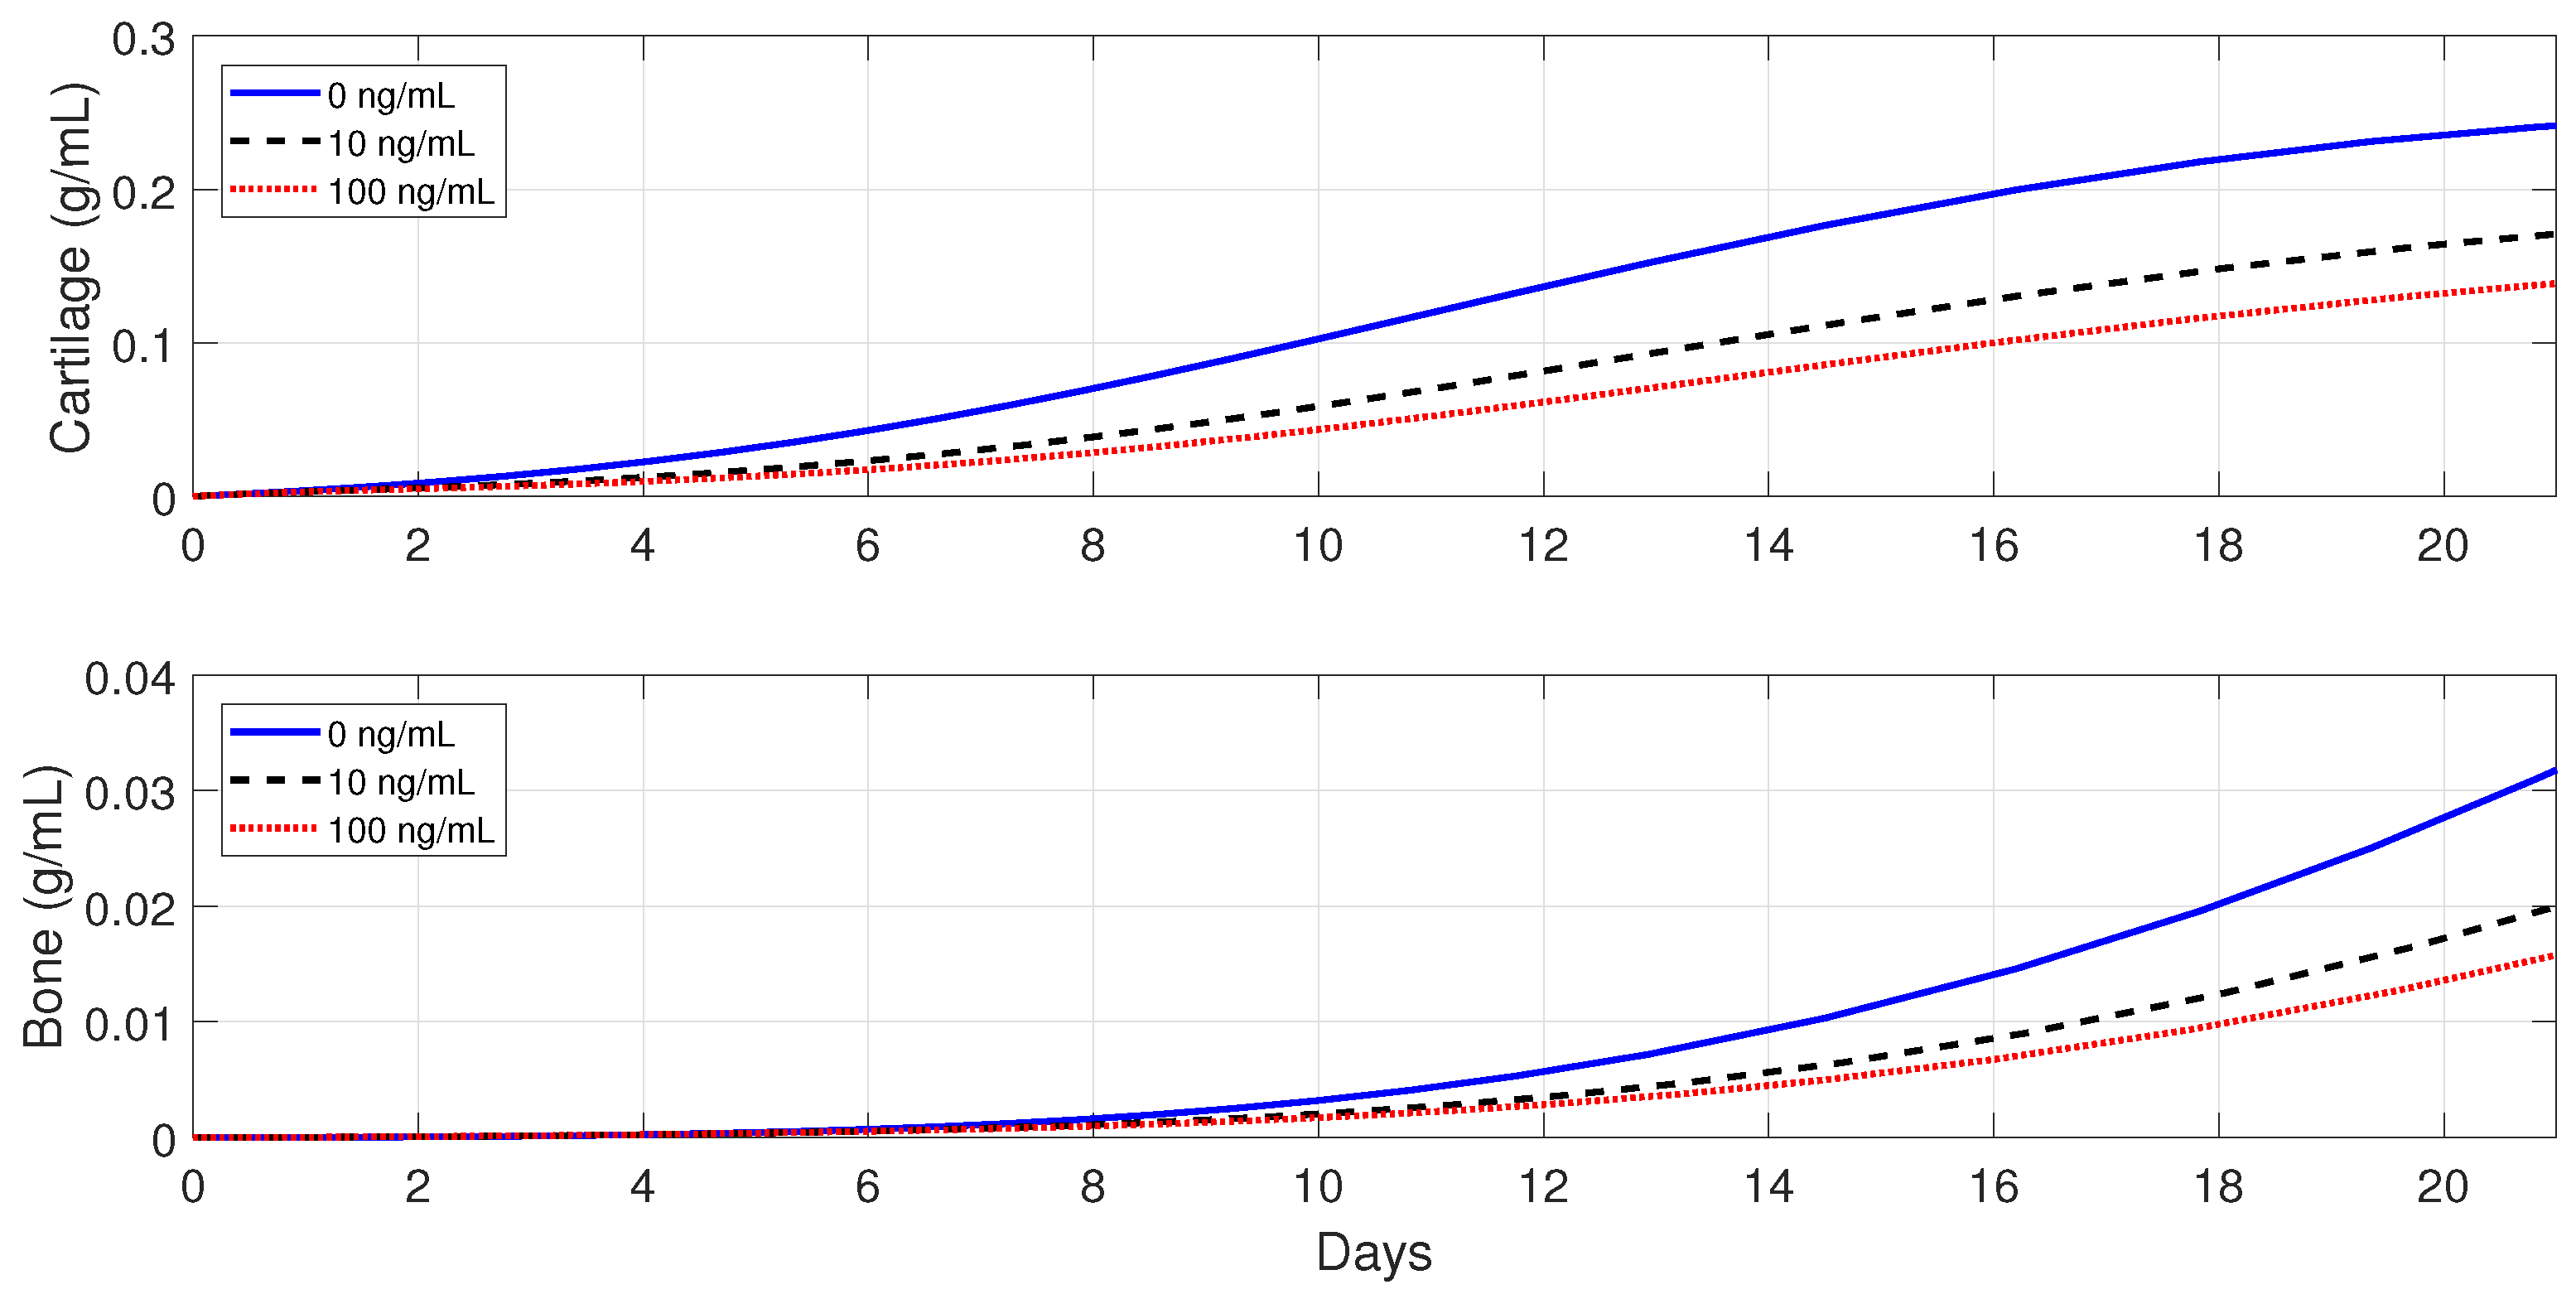
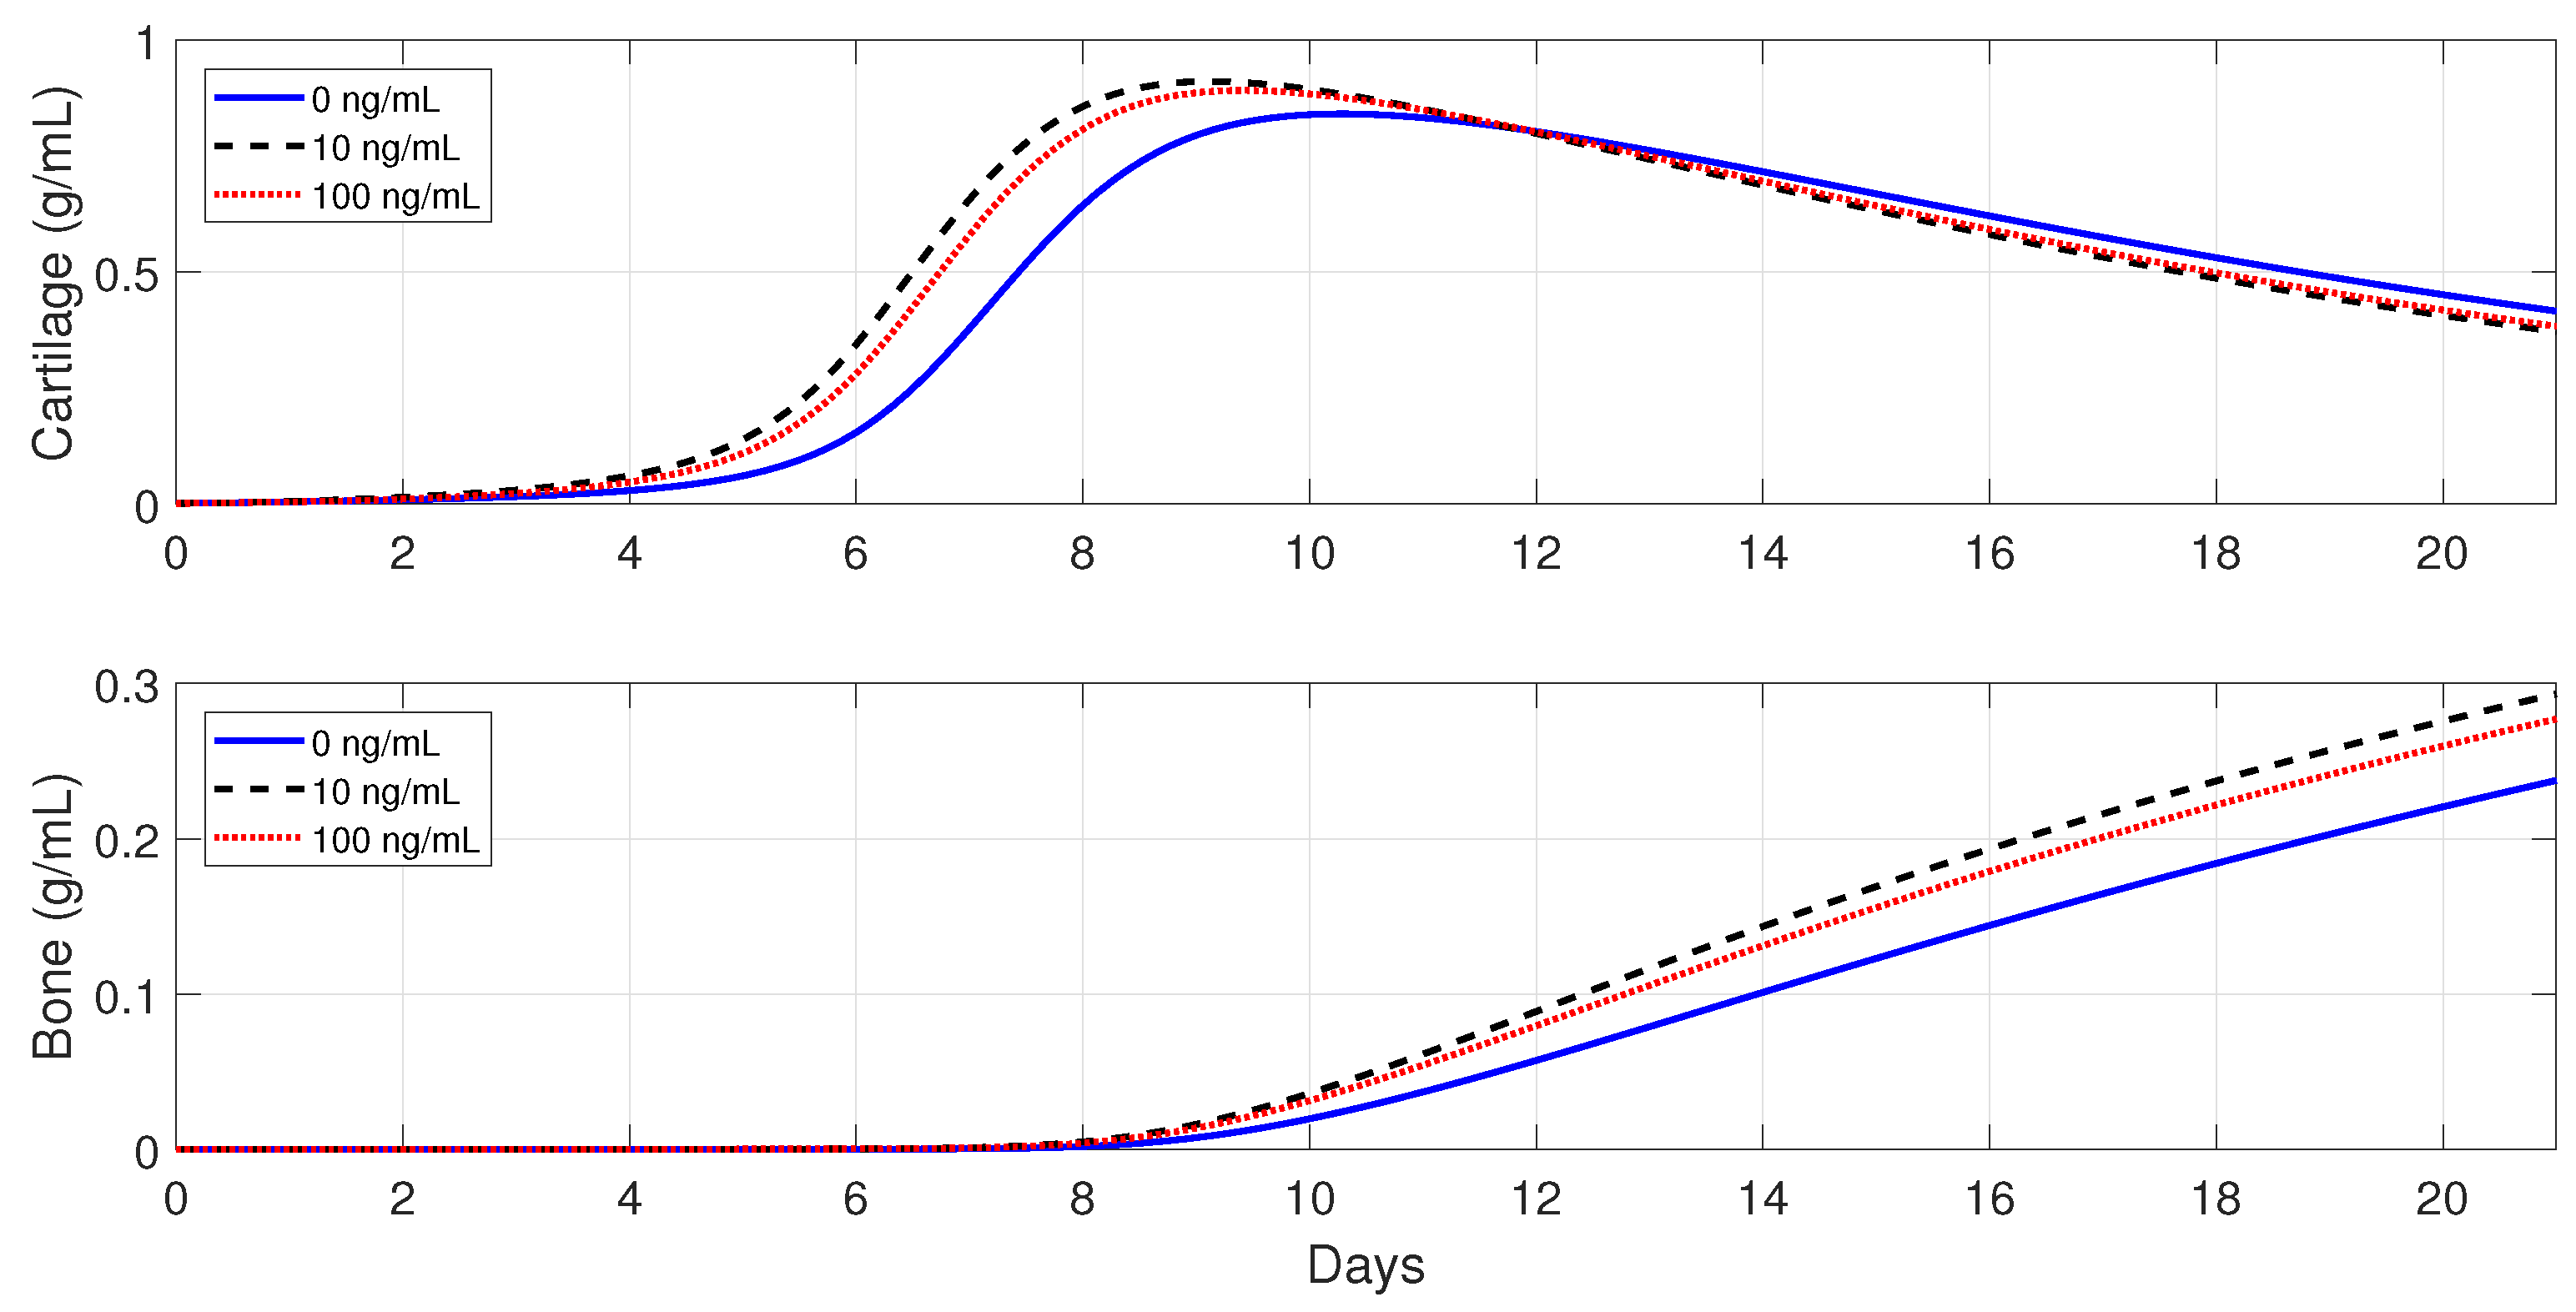
53]. In this section, a set of numerical simulations is presented to investigate the effect of the administrations of anti-inflammatory cytokines at the beginning of the healing process in healthy individuals and also in immune-compromised patients. In each case of the numerical simulations,
, 10, and 100 ng/mL.
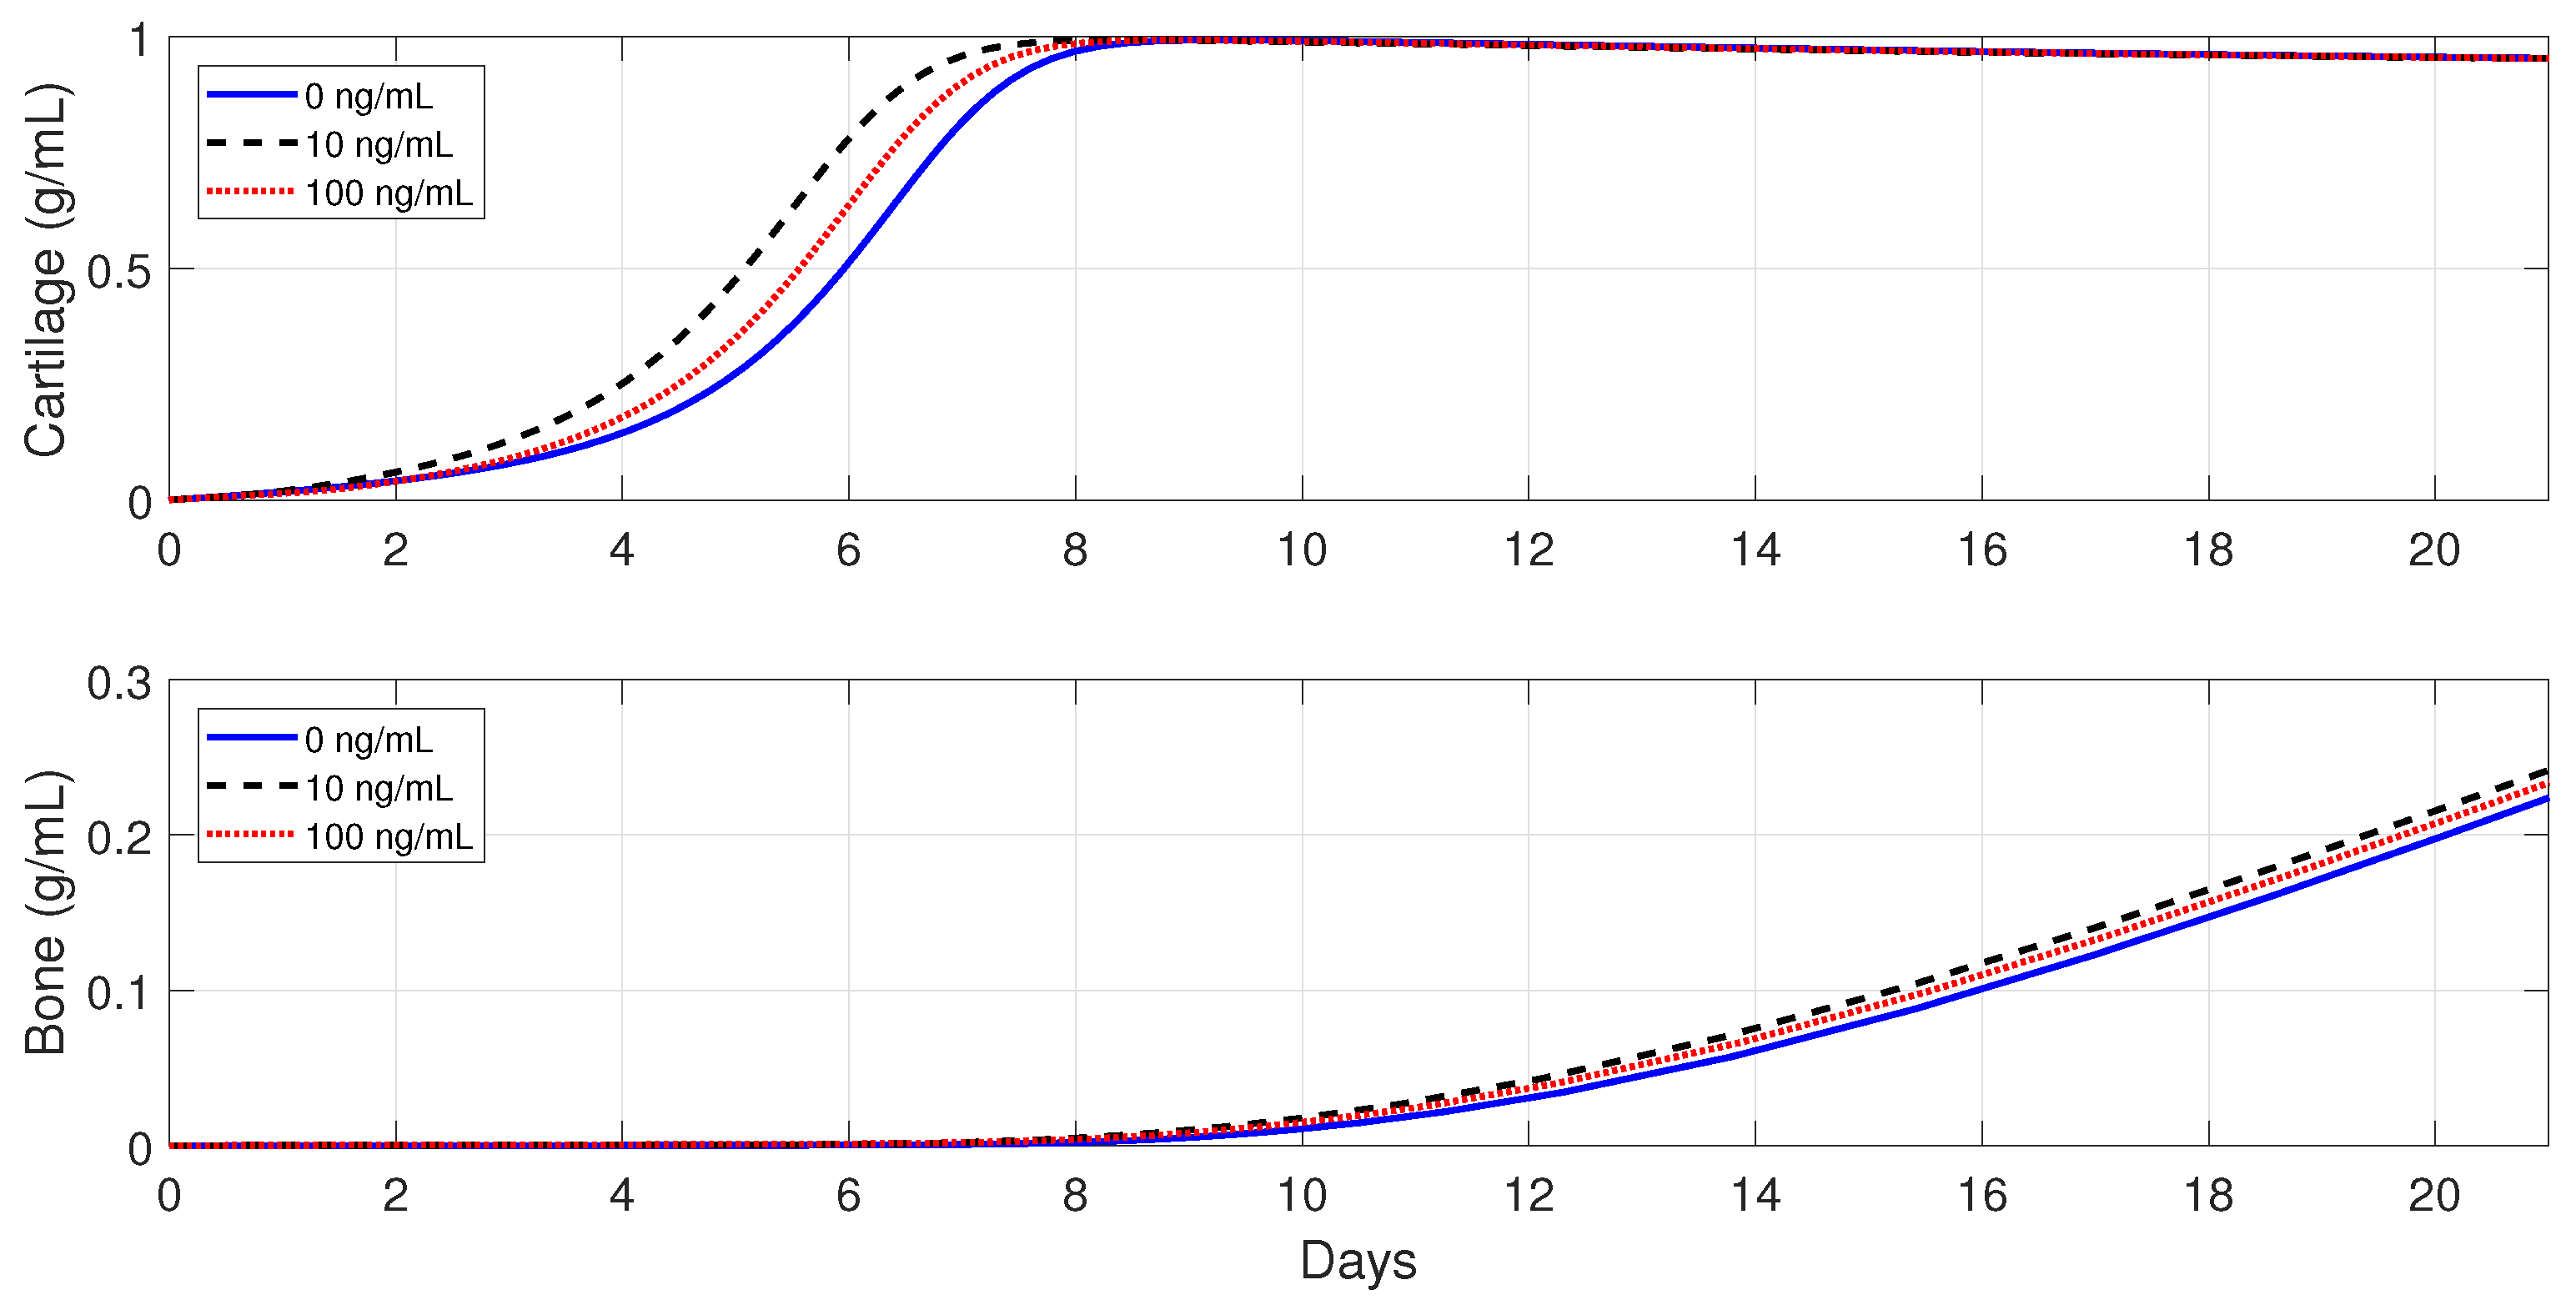
In healthy individuals, the administration of anti-inflammatory drugs is implemented for a simple fracture and also for two moderate fractures with different debris concentrations: , , and .
Figure 10 shows that the administration of
in the simple fracture slows down both the cartilage and bone productions.
Figure 11 and
Figure 12 show that the administration of
in the moderate fractures improves the tissue evolution, but in a dose-dependent manner. On one hand, when
, the administration of
has either a positive or negative effect on the two tissue productions. The administration of 10 ng/mL of
enhances the early production of cartilage and increases the bone synthesis, while the administration of 100 ng/mL of
results in the opposite effect. On the other hand, when
, the administration of
enhances the earlier cartilage production and improves the synthesis of the bone for both concentrations, with 10 ng/mL being the optimal of the two doses.
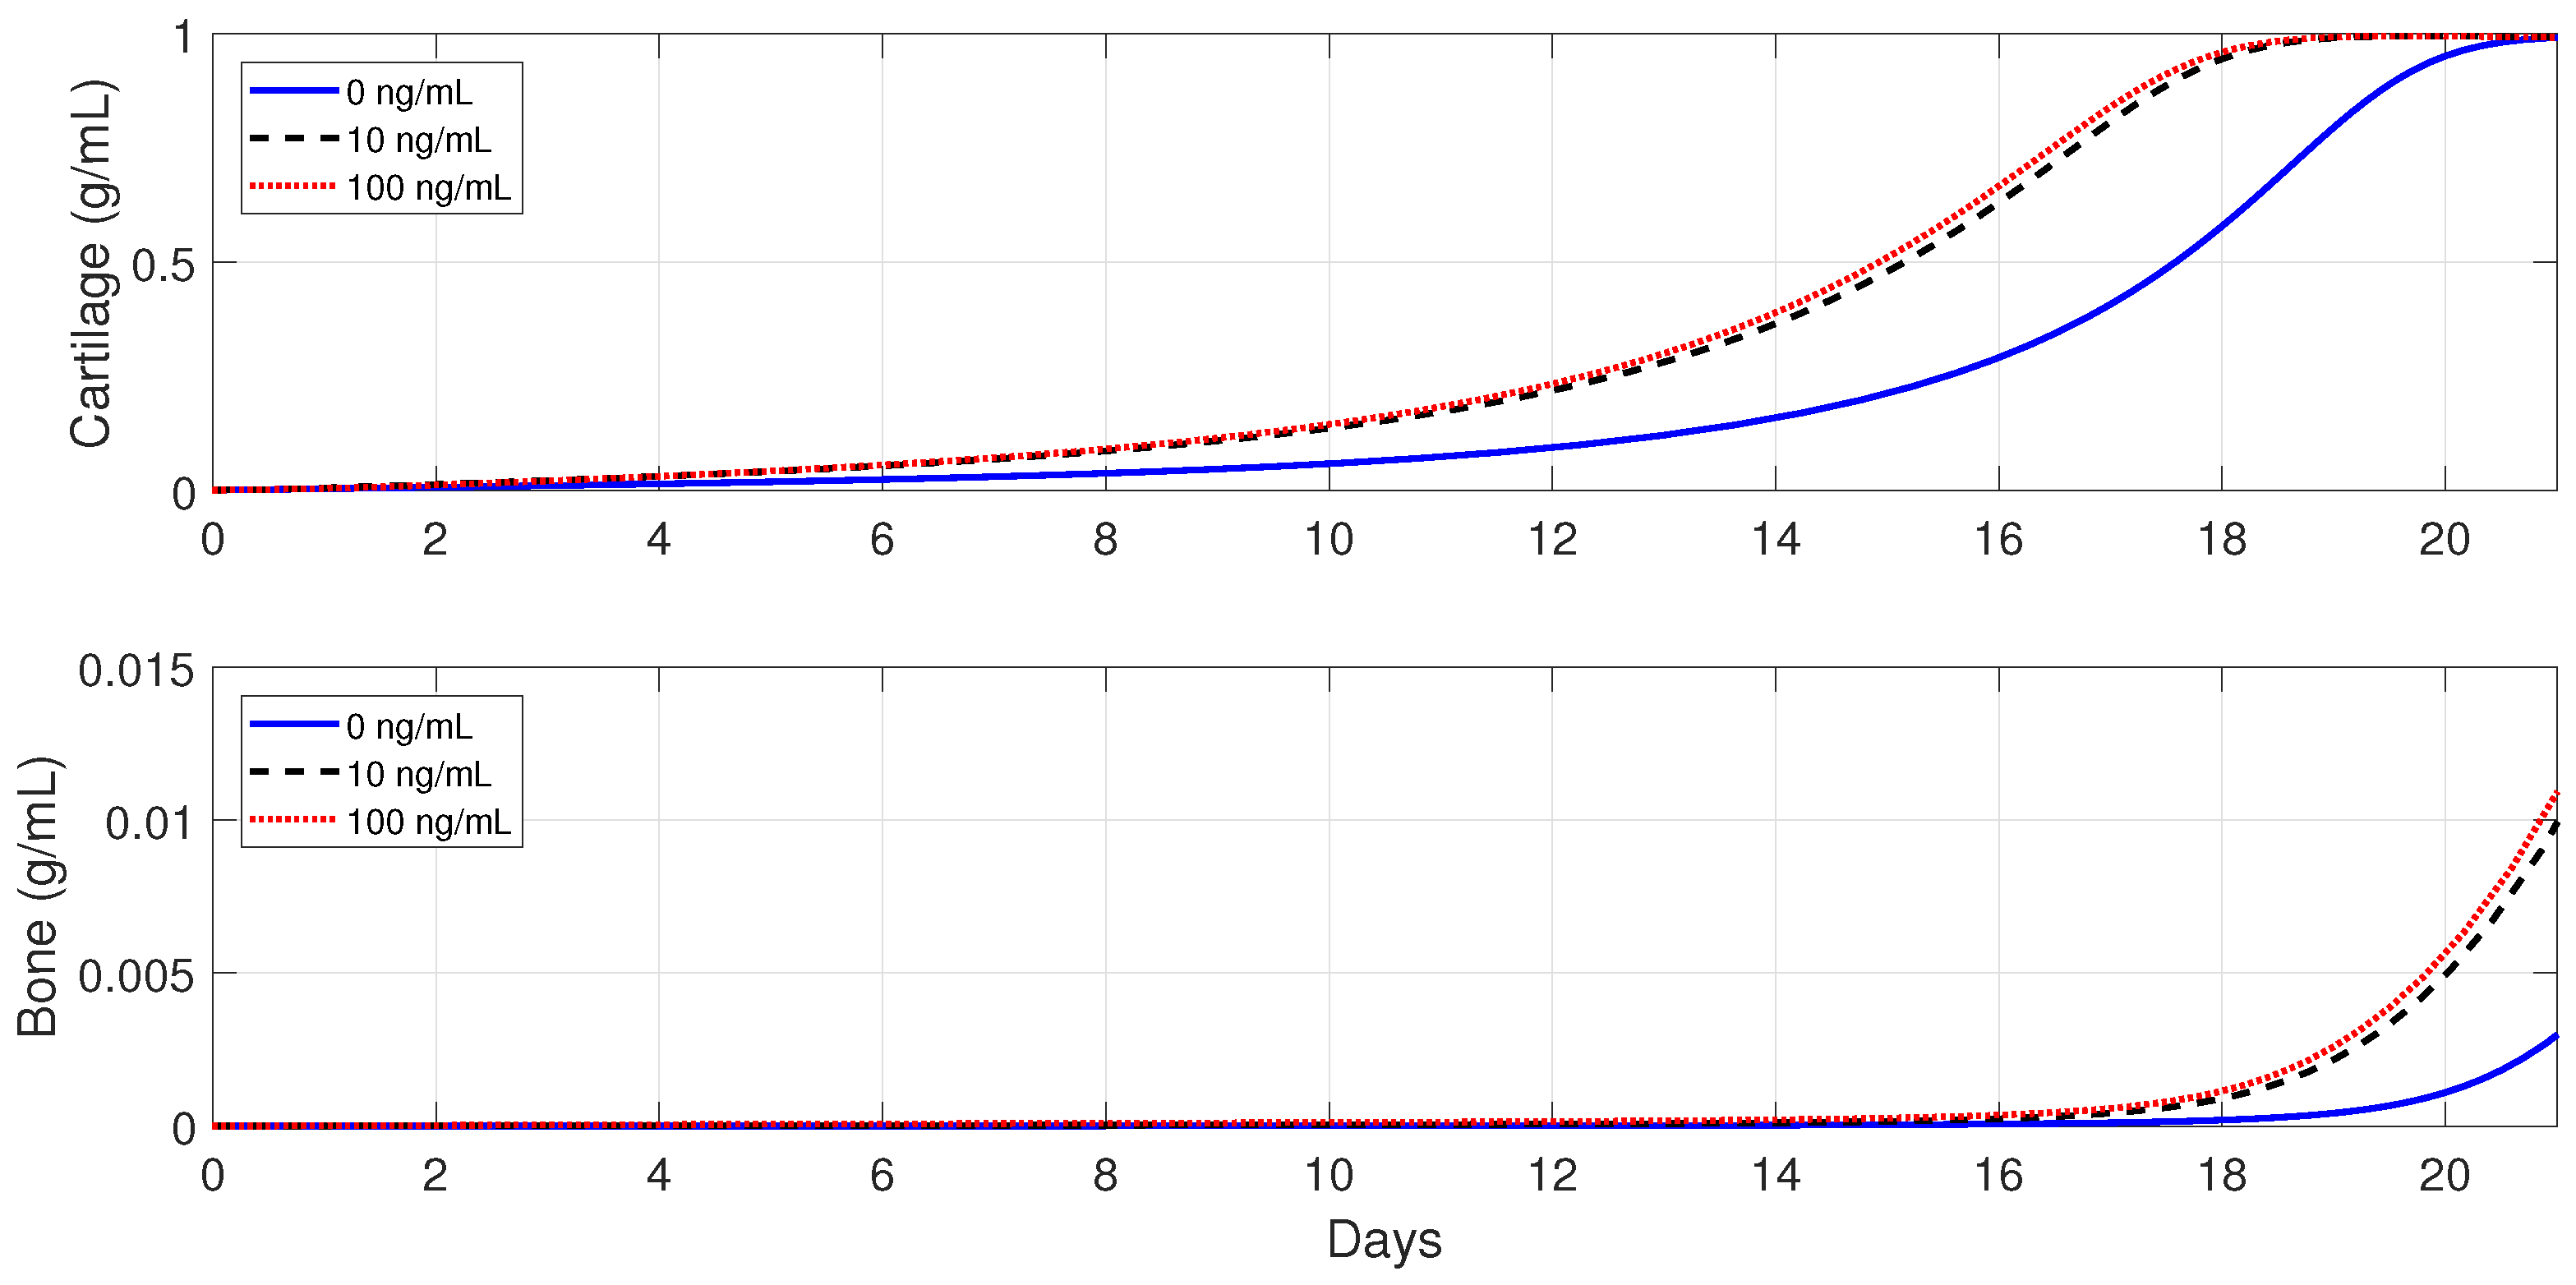
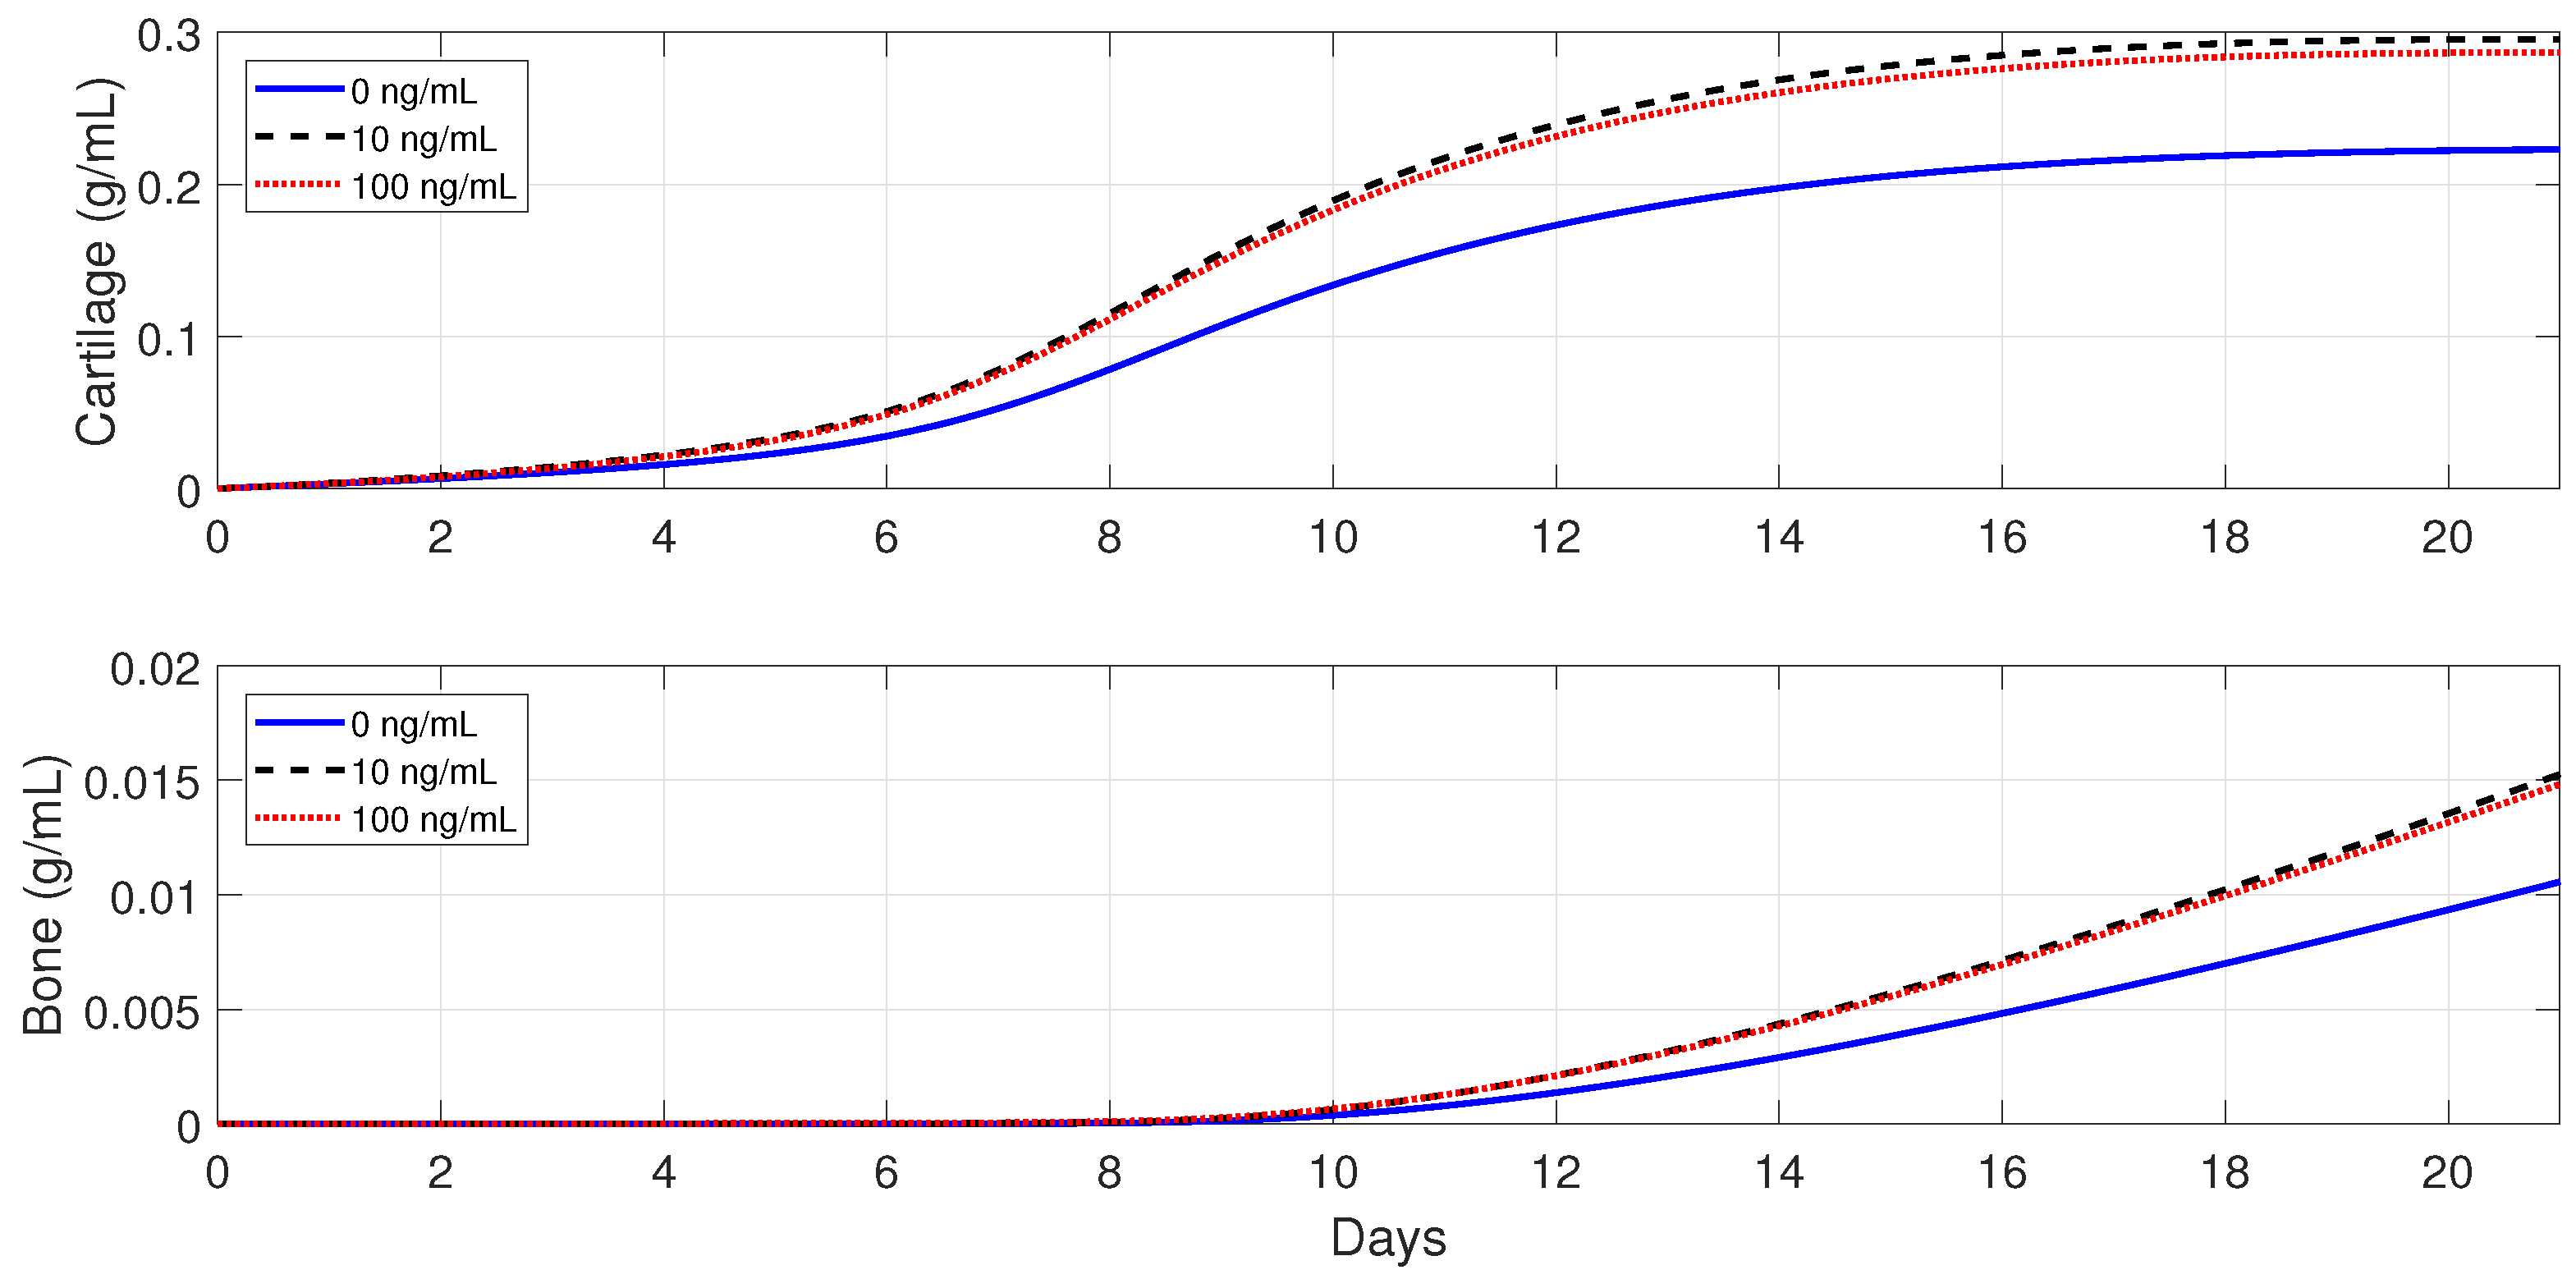
Next, the model is used to implement the administration of anti-inflammatory drugs under different pathological conditions. First, severe fractures in immune-compromised individuals are simulated by using the following parameter values:
and
, since, in the fractures of such individuals, there is an increase in the accumulation of debris [
50] and a decrease in the macrophage migration rate [
54]. Second, the following parameter values are used:
and
, to simulate bone fracture healing in aging individuals, since, in this case, the macrophage phagocytic rate decreases and there is an increase of pro-inflammatory cytokine synthesis by
[
3,
25]. Finally,
,
,
,
, and
are used to simulate the healing process for an senil osteoporotic fracture, since, in this case, a high level of pro-inflammatory cytokines is observed and the MSC and osteoblast functions decrease [
3].
Figure 13,
Figure 14 and
Figure 15 show that the administration of anti-inflammatory cytokines under the above three different pathological conditions always improve tissue productions, where the optimal dose of
, for both the advanced-age individuals and senile osteoporotic fractures, is 10 ng/mL.
6.5.2. Cellular Therapeutic Interventions under Immune-Compromised Conditions
Additions of MSC to the injury site through injection and/or transplantation have been used in practice to stimulate and augment bone fracture healing [
2]. Another cellular intervention is scaffold implants, where undifferentiated macrophages and MSCs are co-cultured together, and cytokines are slowly released to stimulate
activation [
3]. The parameter values used in the numerical simulations that explore these possible therapeutic treatments are the same as in
Section 6.5.1.
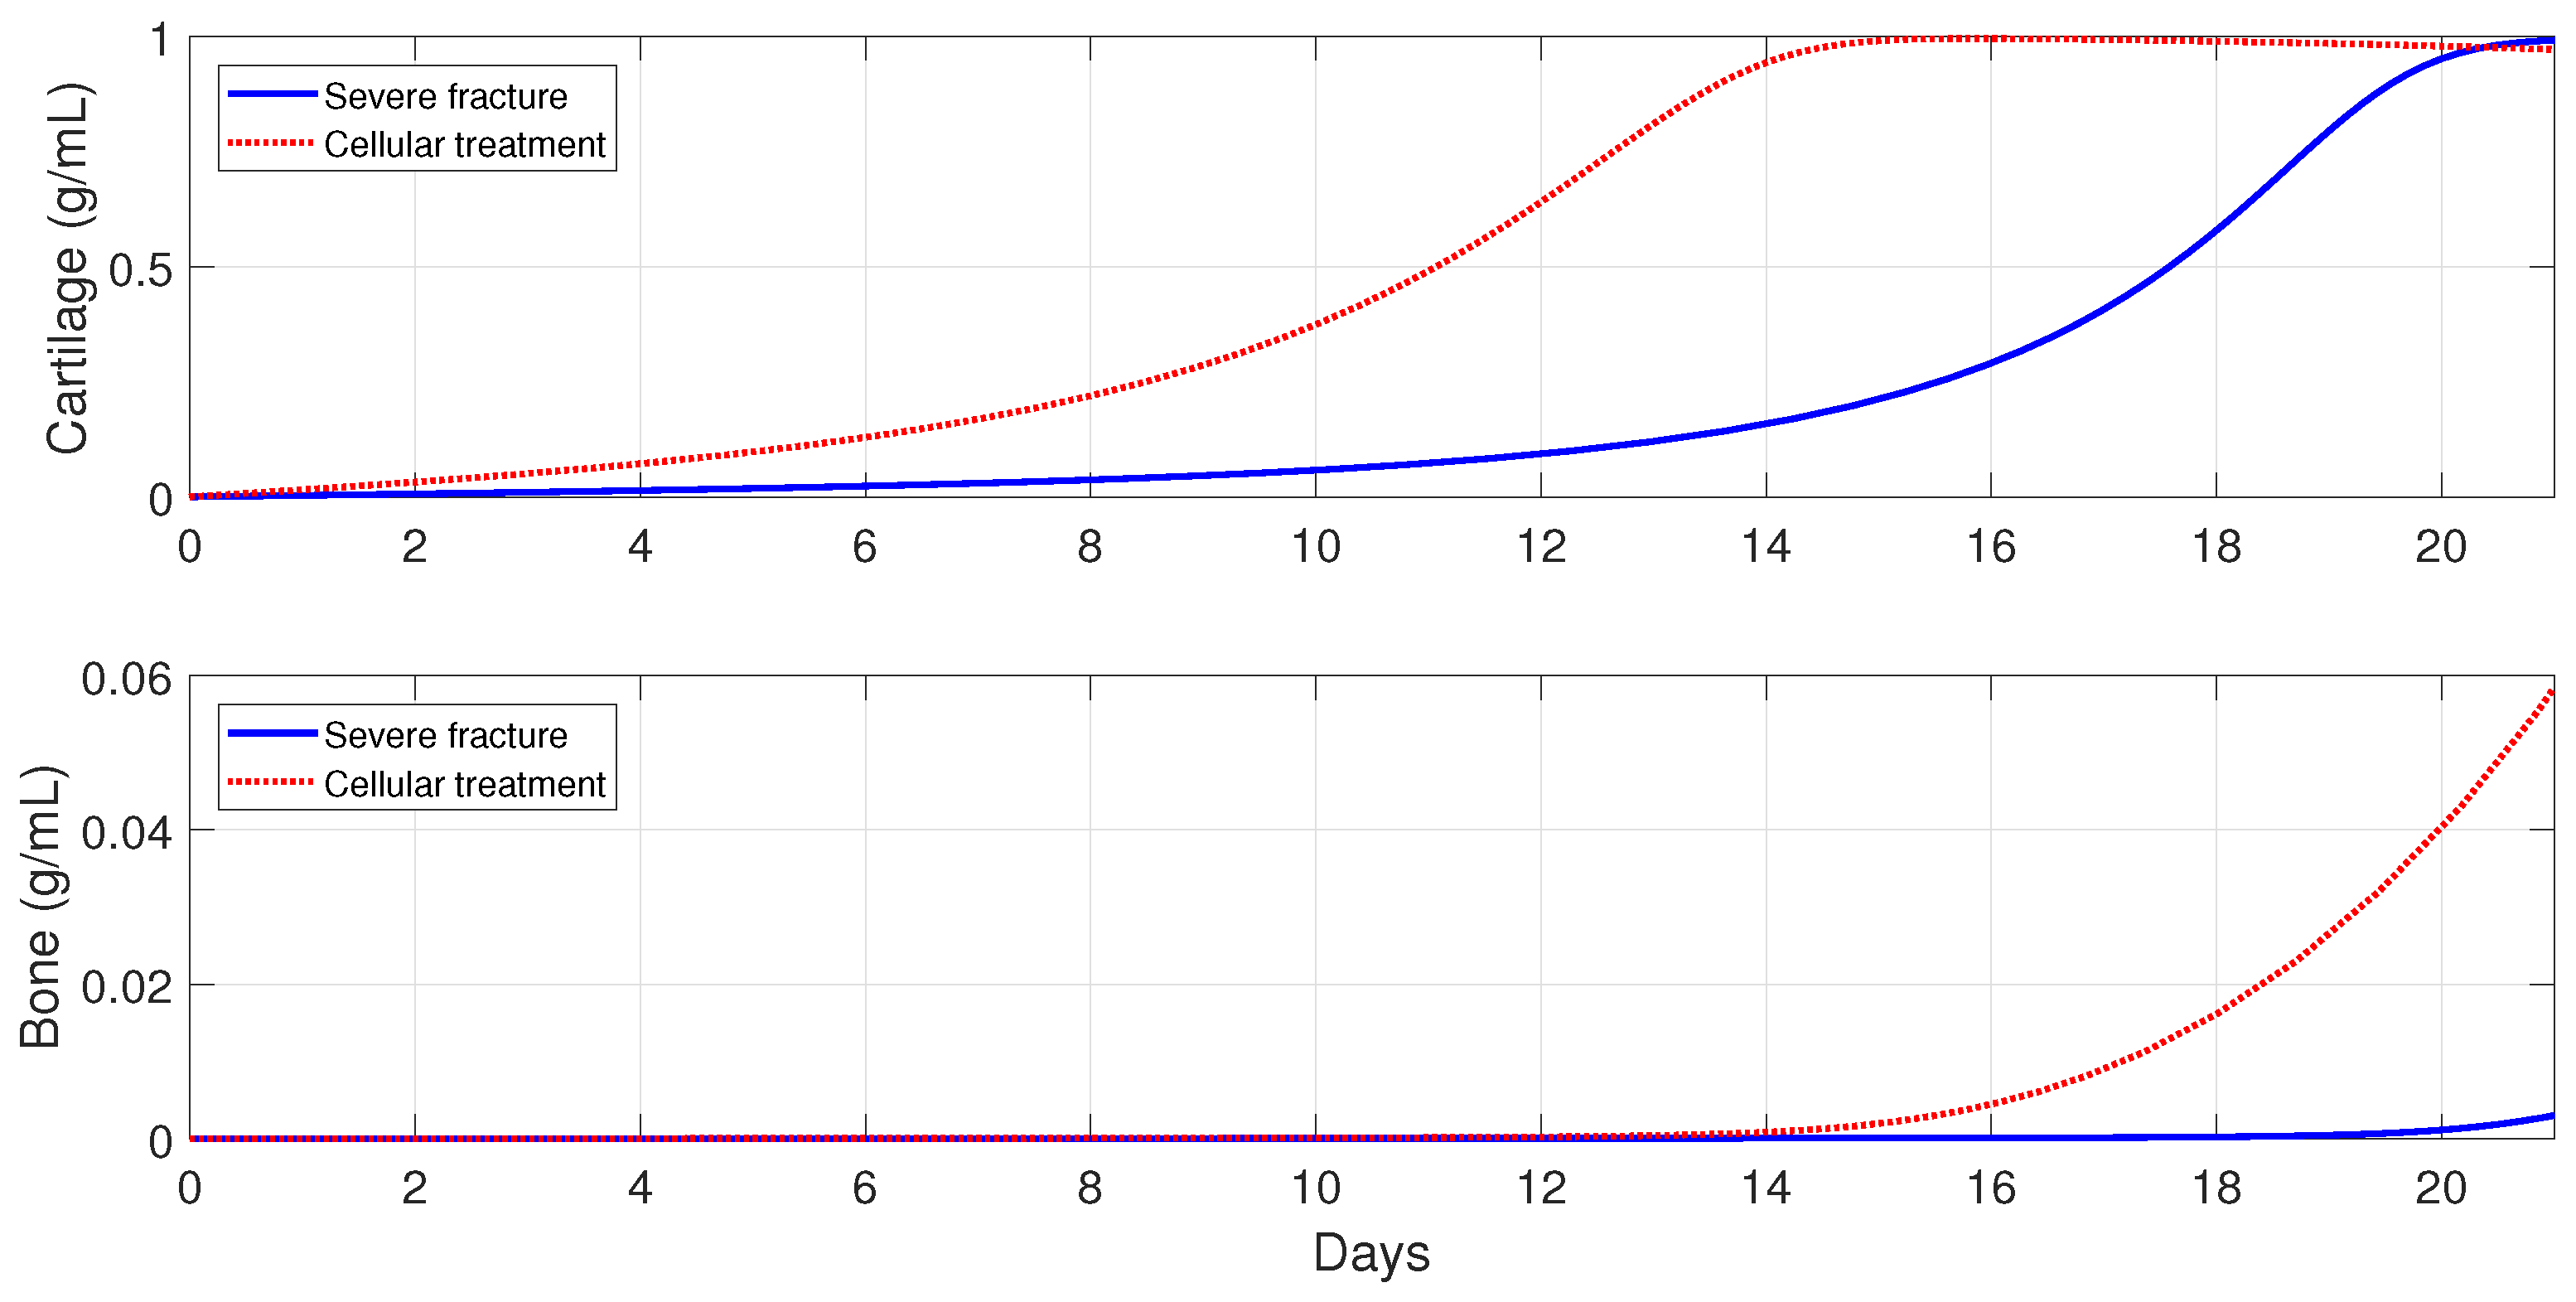
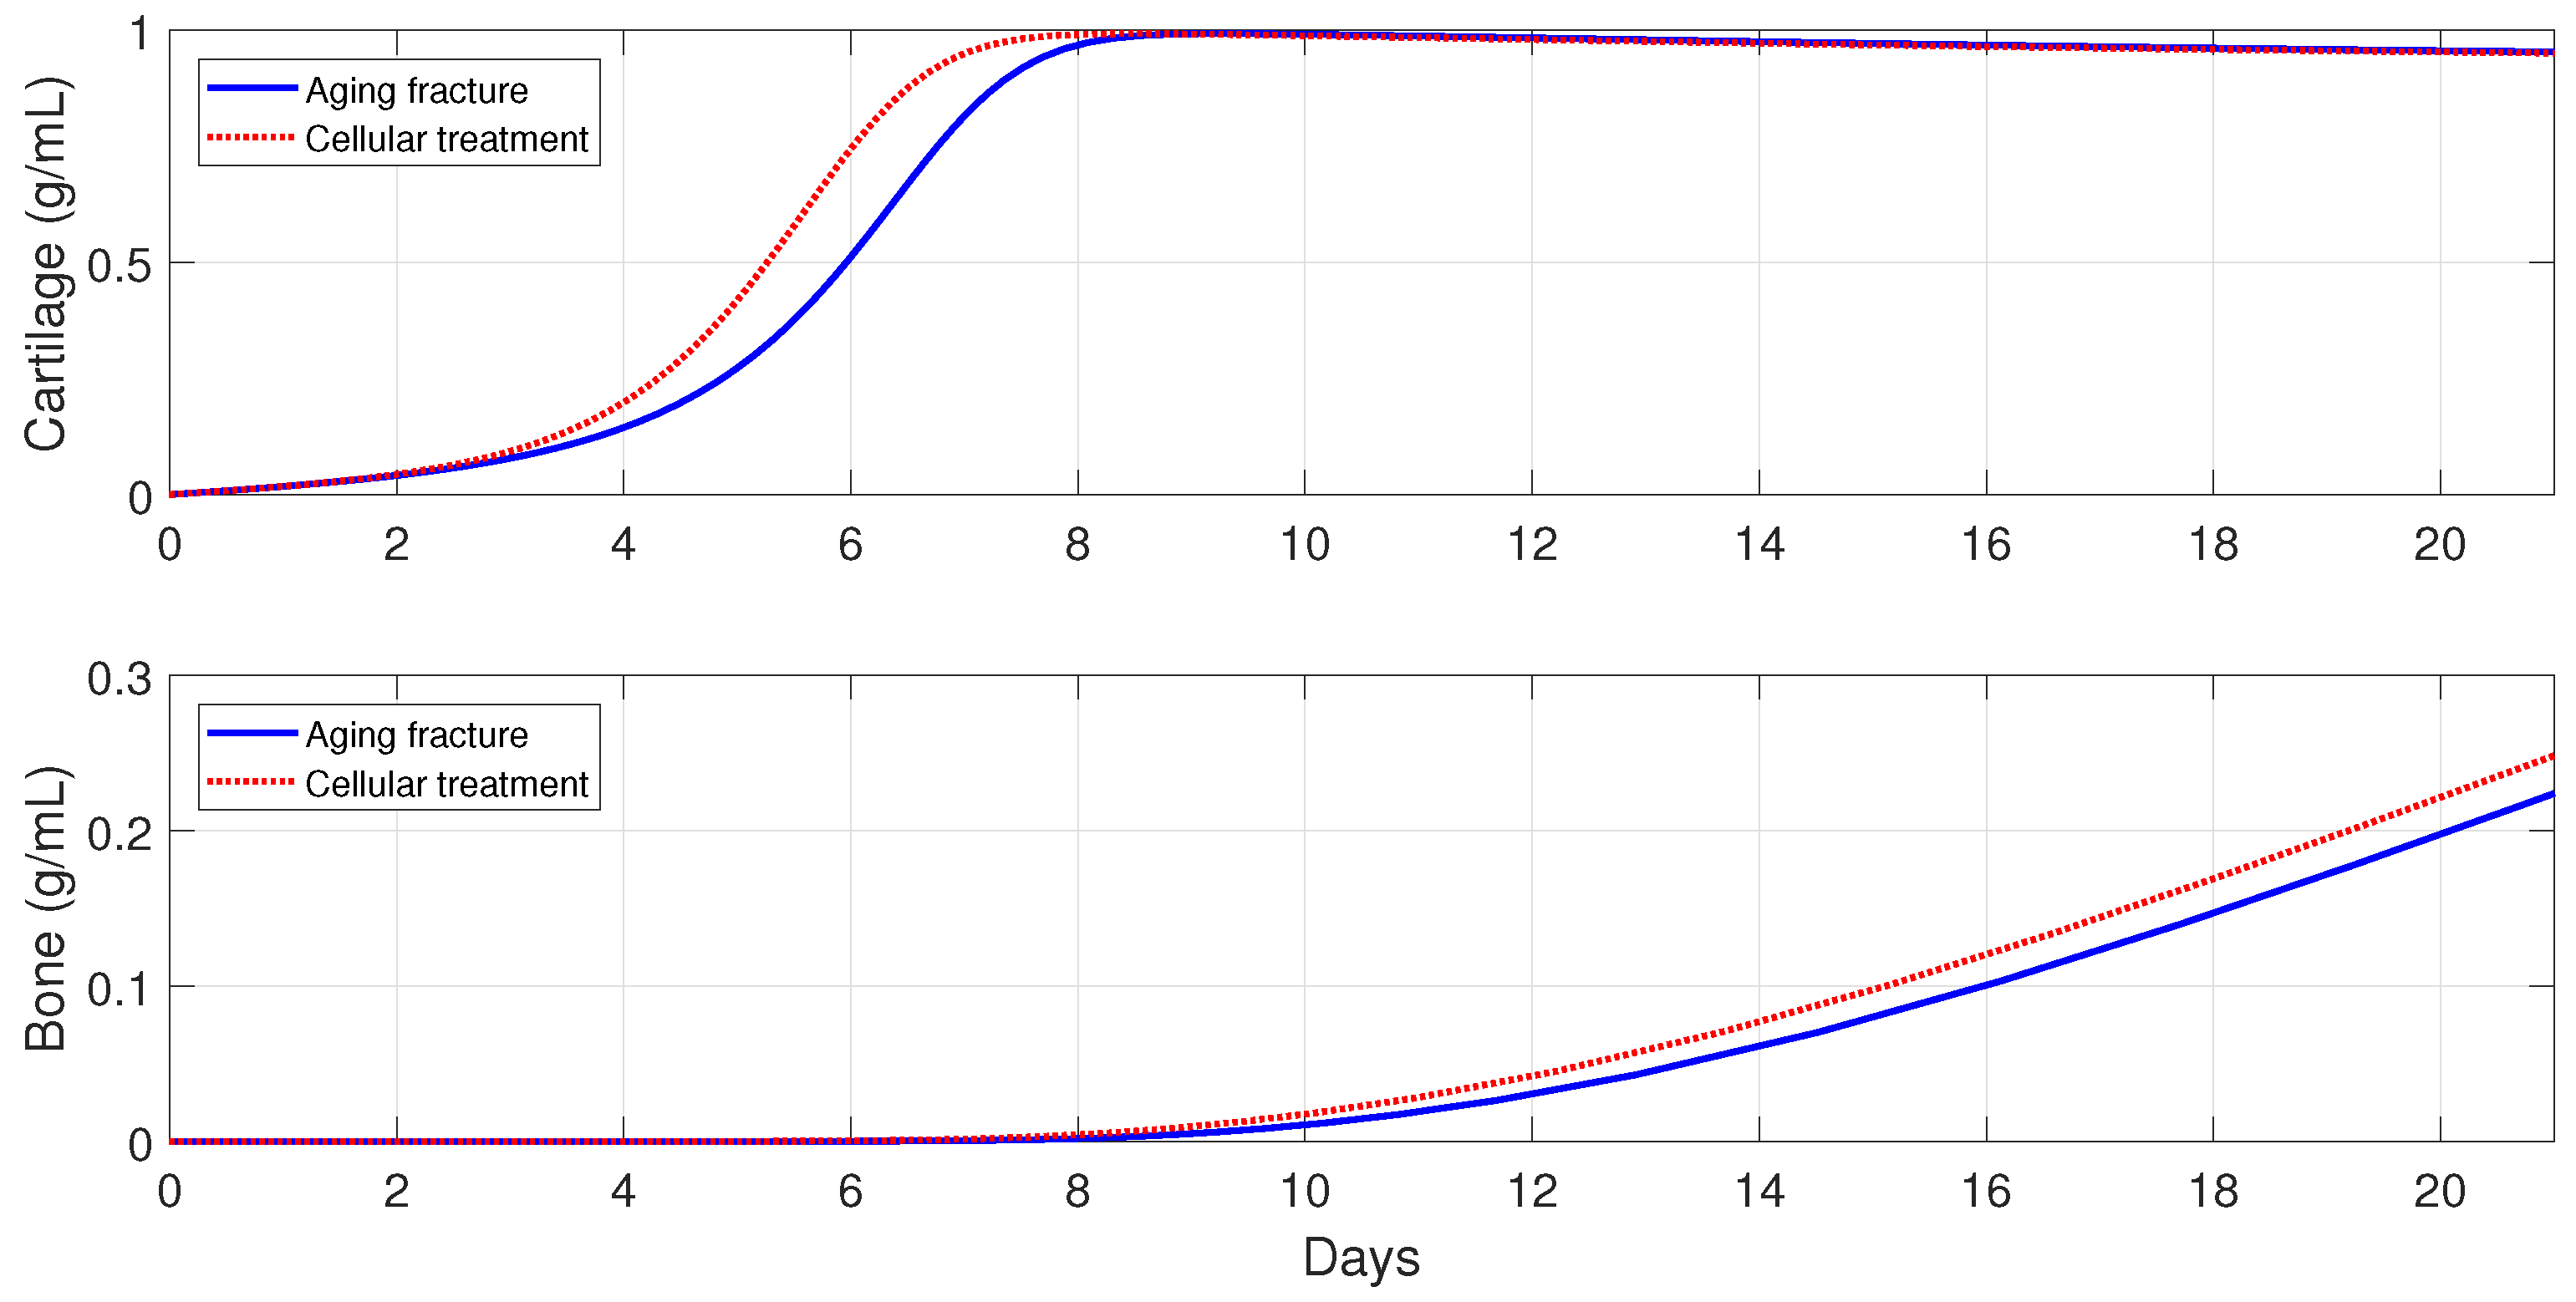
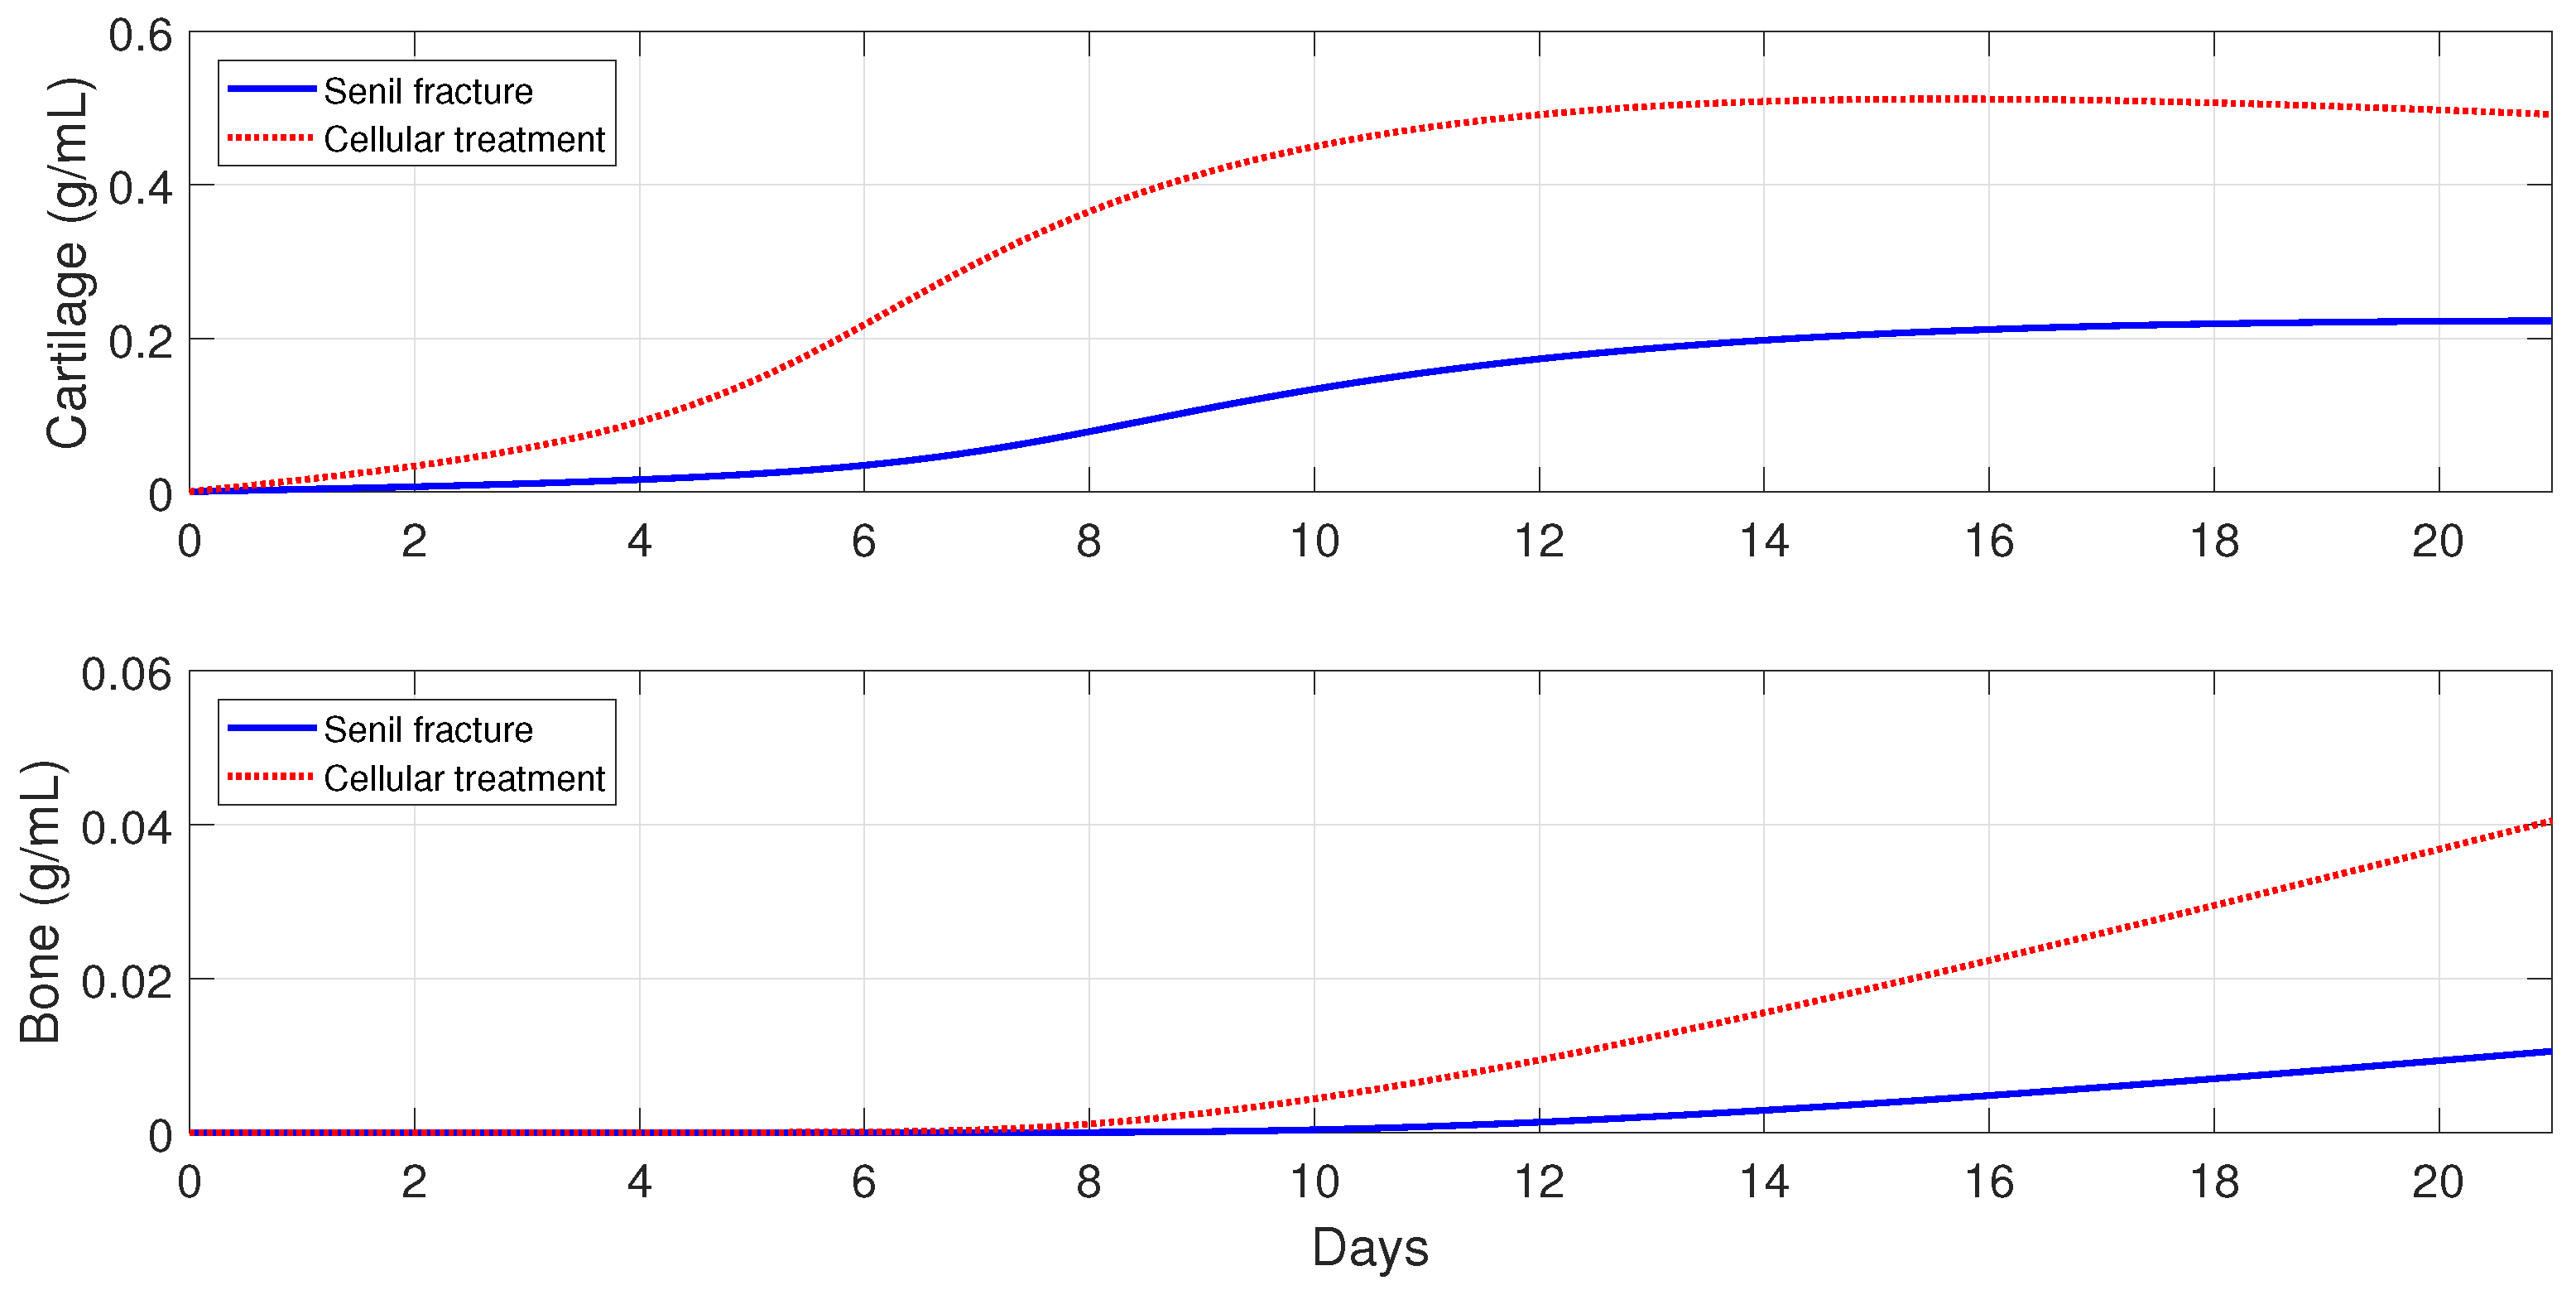
For severe fractures with immune-compromised conditions, the use of scaffold implants is simulated through a fast activation (i.e., and ), and also an increase in the and densities (i.e., and ). For fractures in aging individuals and individuals with senile osteoporotic fractures, the MSC injection and the fast activation are simulated by setting , , and .
Figure 16,
Figure 17 and
Figure 18 show that the two cellular interventions increase both tissue productions. Furthermore, those interventions result in larger improvements in severe and senil osteoporotic fractures, when compared to fractures in aging individuals.
7. Discussion and Conclusions
A new mathematical model was introduced to mathematically and numerically study the macrophage-mediated inflammation involved in the early stages of the bone fracture healing process: The inflammatory and repair phases. Classically and alternatively activated macrophages were incorporated in the model, to study their capabilities to modulate and resolve the inflammation. The model also included the macrophage abilities to regulate the tissue cellular functions through the delivery of pro- and anti-inflammatory cytokines. The resolution of the inflammation was assumed to be initiated with the activation of the macrophages into their classical phenotype. The classically activated macrophages deliver pro-inflammatory cytokines, such as TNF-, as they engulf debris. Then, the alternatively activated macrophages and the MSC modulate the inflammation by releasing anti-inflammatory cytokines, such as IL-10. Finally, the classically activated macrophages remove the remaining debris. The model also incorporated different engulfing rates of activated macrophages, saturation rates of phagocytes, and the maximal density of macrophages at the injury site, thus allowing a better understanding of the interplay between macrophages and tissue cells during the bone fracture healing process.
The mathematical analysis revealed that there are three feasible fracture healing outcomes. Two of the outcomes represent a nonunion healing: One is the case when the cells deactivate or die out before the healing process finishes up, and the other is the case when the tissue cells remain constant but the osteoclasts fail to completely remove the cartilage. The third outcome represents a successful healing, where the osteoblasts and osteoclasts are constantly producing and removing the woven bone. The stability conditions of each outcome can be used to biologically explain why the fracture healing fails, as well as to design therapeutic interventions to stimulate or accelerate the healing process.
The new model was used to study the importance of macrophages during the early stages of tissue production. It revealed that macrophages significantly improve the tissue production, with alternatively activated macrophages having the main effect on the process. The flexibility of the model also allowed us to perform a variety of different types of numerical simulations quickly and cost effectively. It was used to monitor the progression of the healing of a broken bone and to predict its final outcome. In particular, the administration of anti-inflammatory drugs to improve the bone fracture healing process was numerically simulated. It was found that the administration of anti-inflammatory cytokines fails to accelerate the healing process in simple fractures, while it accelerates the healing process in moderate fractures, depending on the cytokine concentrations, and always improves the healing process in severe fractures. Such results have been also clinically observed, when corticosteroids and nonsteroidal anti-inflammatory drugs (NSAIDs) are administered in bone fractures [
23]. Therefore, based on the model findings, the concentration of debris must be carefully considered when administering anti-inflammatory drugs to enhance the fracture healing process [
50]. The model was also used to explore other potential cellular therapeutic approaches, such as MSC injection and transplantation. It was found that such treatments can also improve the healing time of a broken bone, especially in immune-compromised patients. The model can also be easily adapted to other therapeutic approaches, such as the administration of different anti-inflammatory drugs, suggesting a variety of possible ways to guide clinical experiments and bone tissue engineering strategies.
Future research directions include modifications of the model by incorporating additional molecular and cellular interactions and processes during the inflammatory and repair phases of fracture healing, such as macrophage migration and MSC differentiation due to cytokine stimulus. Another research direction is the incorporation of the bone remodeling phase of the healing process, which begins at the end of the repair phase and continues long after fracture union. There are different factors that affect the bone remodeling, including other bone cells, such as osteoclasts, osteocytes, progenitor cells, and other sources of cytokines [
30,
32,
43]. This presents a challenging new research direction in the pursuit to better understand the bone fracture healing process and the development of new treatment strategies.


