Article

Influence of Mineralogy on the Dry Magnetic Separation of Ferruginous Manganese Ore—A Comparative Study

by
Sharath Kumar Bhoja
1,
Sunil Kumar Tripathy
2,3,*,
Yanamandra Rama Murthy
2,
Tamal Kanti Ghosh
2,
C. Raghu Kumar
1 and
Deba Prasad Chakraborty
1
1
Process Technology Group, Tata Steel, Jamshedpur 831001, India
2
Research and Development Division, Tata Steel Ltd., Jamshedpur 831001, India
3
GeoRessources, Université de Lorraine, CNRS, Georessources, F54000 Nancy, France
*
Author to whom correspondence should be addressed.
Minerals 2021, 11(2), 150; https://doi.org/10.3390/min11020150
Submission received: 3 November 2020 / Revised: 11 January 2021 / Accepted: 26 January 2021 / Published: 31 January 2021
(This article belongs to the Special Issue Ferroalloy Minerals Processing and Technology)

Abstract

:
Magnetic separation is often considered pertinent for manganese ore beneficiation when the ore is abundant with siliceous rich gangue mineral phases. However, the process is deemed to be inapposite for the ferruginous type of ore, and remains a grey area of research. In the present investigation, two different types of manganese ore were studied in detail to understand the influence of mineralogy on their magnetic separation performance. Detailed experiments were performed by varying the critical variables of the dry magnetic separator, and the separation features were studied. The ore samples were thoroughly characterized by various techniques, including an automated advanced mineralogical tool. The mineralogical results revealed that primary manganese bearing minerals in both the ores are rich in cryptomelene, pyrolusite, psilomelane, and bixybyite. Similarly, the major gangue minerals were alumina-bearing minerals and iron-bearing phases (hematite and goethite). The optimum grade that could be obtained from single-stage dry magnetic separation was 35.52% Mn, and with a Mn:Fe ratio of 1.77, and 44% Mn recovery in the case of sample 1; whereas, a 33.75% Mn grade, with a Mn:Fe ratio of 1.66 at Mn recovery of 44% was reported for Sample 2. It was observed that both samples had a similar input chemistry (~28% Mn, ~1 Mn: Fe ratio) however, they had distinctive mineralogical assemblages. Furthermore, it was observed that the liberation of manganese mineral was in a course size range, i.e., 300 to 450 µm, while the association of iron and manganese bearing phases was lower in sample 1 when compared to sample 2.

1. Introduction

There are various factors and criteria which are taken into consideration when opting for an efficient beneficiation process. However, the ore mineralogy, and its associated mineral assemblage, plays a vital role in identifying the suitable beneficiation route for concentrating the different ore minerals. [1,2,3,4,5]. The mineral assemblage and grain development with respect to size, coupled with grain interlocking, also influence the process (dry or wet) selection. However, the desired mineral, and the gangue bearing mineral physical properties, greatly influence the process selection for optimum recovery [1,4]. The upgradation potential of any ore deposit is determined by several parameters: the mineral assemblage, liberation characteristics, along with the textural pattern, rather than its elemental composition [2,3]. The mineral characterization data is widely used in the modeling, simulation, and prediction of the process [4,5,6,7,8,9,10].
Manganese mineral is an essential raw material in the steel making process; hence, its demand is proportional to steel production. The steel industry consumes over 95% of manganese ore production, and the remaining 5% is used by the other sectors, including chemical, paint, fertilizer, and battery industries [11]. Furthermore, manganese mineral has been extensively used for different low carbon technologies [12]. Manganese ore is generally available and mined in different parts of the world, including India, and most of the deposits need beneficiation prior to their application in the smelting process. Different techniques, like ore sorting, gravity, magnetic, roasting-magnetic, and flotation [13,14] are employed globally to beneficiate the manganese ore. Magnetic separation is one of the most widely used processes for the upgradation of manganese ore. Furthermore, dry-based magnetic separation methods are gaining importance due to advantages such as water saving, and avoiding the tailing dam/dewatering step [15,16,17,18,19,20]. The magnetic susceptibilities of the major manganese minerals and associated gangue bearing minerals are tabulated in Table 1 [16]. The chemical composition, density, and specific magnetic susceptibility of the minerals reported were measured at 25 °C under a weak magnetic field.
Ample literature has been published on siliceous manganese ore concentration using the wet magnetic separation technique. However, there is very limited literature on the concentration of manganese mineral using dry magnetic separation from ferruginous manganese ore (low-grade manganese ores with high iron contents). A summary of earlier research on magnetic separation of manganese ore is tabulated in Table 2 [21,22,23,24,25].
The influence of mineralogy on the magnetic separation of manganese minerals has been studied and reported by various researchers [16,20,32,33,34,35,36]). Different minerals have a different response to the magnetic field (i.e., measured by magnetic susceptibility), and exploiting the same the separation in other minerals is sought [37,38]. As the mineralogy varies, the operating parameters of the magnetic separator also need to be changed to obtain optimum metallurgical performance [32].
The beneficiation studies using the magnetic separation technique carried out to date mostly present different insights specific to the siliceous type of ore, and predominantly by wet processing at finer particle size ranges, and using high-intensity magnetic separators. There are limited avenues for dry magnetic separation, due to small differences in the magnetic susceptibility of manganese minerals and the associated gangue bearing minerals. However, some researchers have attempted to study the separation behavior, and reported the dry magnetic separation of manganese ore. However, the influence of mineralogy on separation behavior has been a grey area, and needs further study. In the present investigation, an attempt has been made to understand the importance of mineralogy on the beneficiation of ferruginous manganese ore using the dry magnetic separation technique. The ore samples were thoroughly characterized by various methods, including an advanced mineralogical study.

2. Geology of the Deposit

Manganese ore deposits in India are mainly distributed in the Madhya Pradesh–Maharashtra, Odisha–Jharkhand, and Karnataka regions. The Odisha state alone, contributes 29% of the total Indian reserves of manganese ores that are ferruginous and are inherently friable. [39]. In Orissa, the manganese ores are confined to three stratigraphic horizons: the iron ore group (IOG), the Eastern Ghats group, and the Gangpur group [2]. Furthermore, all of these stratigraphic groups of manganese deposits have been reported, three varieties of low-grade manganese ores: (a) siliceous, (b) ferruginous, and (c) aluminous types [2].
Mn-Fe oxide ores are abundantly observed in stratiform ore bodies. Besides manganese, it also contains a large volume of iron and silicate gangue bearing minerals. The chief Fe-phases are hematite and goethite, with kaolinite as the significant gangue mineral. The major manganese minerals are romanechite/cryptomelene, with occasional pyrolusite. Mn-ore’s strata-bound categories are mostly nodular/spherulitic and oolitic/mangcrete types, or appear massive due to repetitive precipitation [40]. Pyrolusite, and cryptomelene with sub-ordinate lithiophorite/chalcophanite/manganite are the manganese minerals observed, and are generally of low to medium grade ore type.
The primary gangue mineral is quartz, in shear zone silicified categories of the ore body. The iron minerals are mostly of hematite, with occasional goethite. Both stratiform and strata-bound categories of ore bodies get oxidized locally, and get enriched in pyrolusite. Such ores are usually of a high-grade type, and locally occur as small pockets [37,41].

3. Materials and Methods

3.1. Manganese Ore

Representative samples of two different ore types were collected from the open cast mines, as indicated in Figure 1 (red flags are the actual locations of the sample from where they were withdrawn). A lot of around 600 t was collected from the mines as per the standard practice (ISO 2859-1, Second edition, 15 November 1999), and it was further reduced to a sub lot of 250 t. The representative sample of around 1 ton was drawn through the channel sampling, dressing, and screening. This sub lot was reduced to a 500 kg sample, which was used for experimentation. Thus collected representative samples were subjected to detailed characterization and magnetic separation test work.

3.2. Characterization Studies

The elemental assays were carried out using an ICP-AES (Integra XL, I.R. Tech. Pvt. Ltd. (GBC Scientific Equipment, Victoria, Australia)). The particle size distribution (PSD) was measured by means of laboratory sieve shaker. The mineral phase analysis was carried out by X-ray diffraction (XRD) (supplied by PAN analytical B.V. Malvern Analytical, Almelo, The Netherlands) and QEMSCAN (supplied by FEI Company, Hillsboro, OR, United States). The details of the procedure followed for preparing the sample for these analyses are as reported in earlier publications [42,43,44].

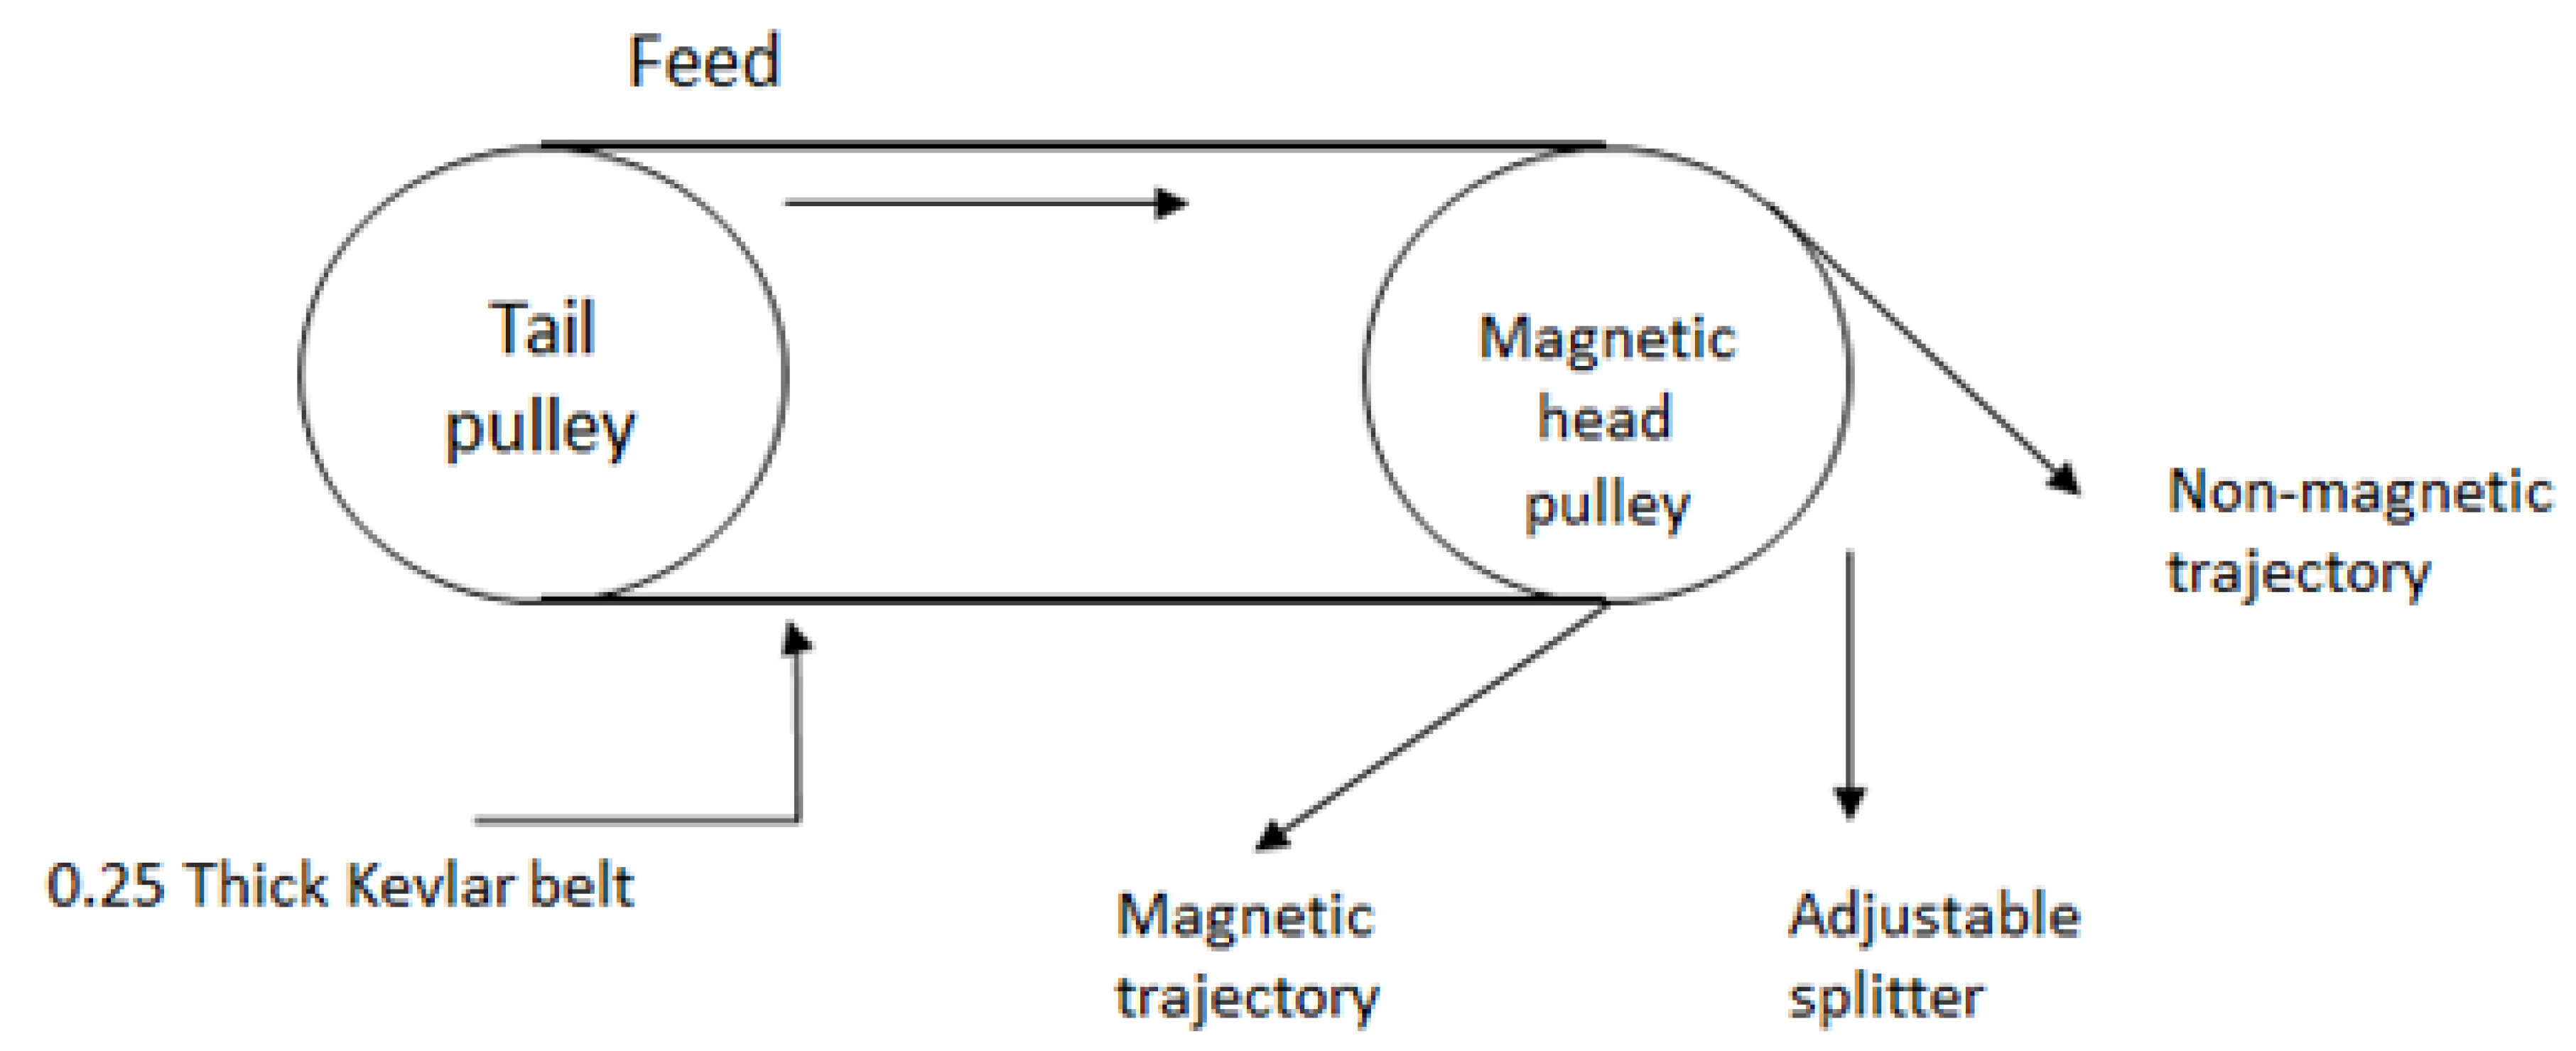
3.3. Magnetic Separation Studies

The experimentation was carried out using the standard bench scale rare earth roll magnetic separator (RERMS) (M/s Eriez India Ltd. Chennai, Tamil Nadu, India). The neodymium-iron-boron magnet had a field strength of 12,000 to 18,000 Gauss at the surface of the magnetic roll. However, with Kevlar® belts, the field strength was around 10,000 to 16,000 Gauss. The used magnetic separator (Figure 2) had the provision to control the feed rate and roll speed, as depicted in Figure 2. The splitters were provided to split the non-magnetic fraction stream from the magnetic fraction stream. Tests were carried out by varying the feed flow rate and roll speed. The design of the experiments (based on Box–Benkhen) considered for the magnetic separation is tabulated in Table 3. Each experiment was conducted as per the design of experiments, and the products (magnetic and non-magnetic fractions) were collected, weighed, and analyzed chemically and mineralogically. The elemental analysis was carried out to investigate performance in terms of grade, recovery, and Mn:Fe ratio, estimated as per Equations (1) and (2).
M n   r e c o v e r y ( % ) = P r o d u c t   w e i g h t ( % )   ×   P r o d u c t   M n   g r d e   ( % ) F e e d   M n   g r a d e   ( % )
M n : F e   r a t i o = M a n a g a n e s e   c o n t e n t   i n   t h e   s a m p l e I r o n   c o n t e n t   i n   t h e   s a m p l e

4. Results and Discussion

4.1. Characterization Results
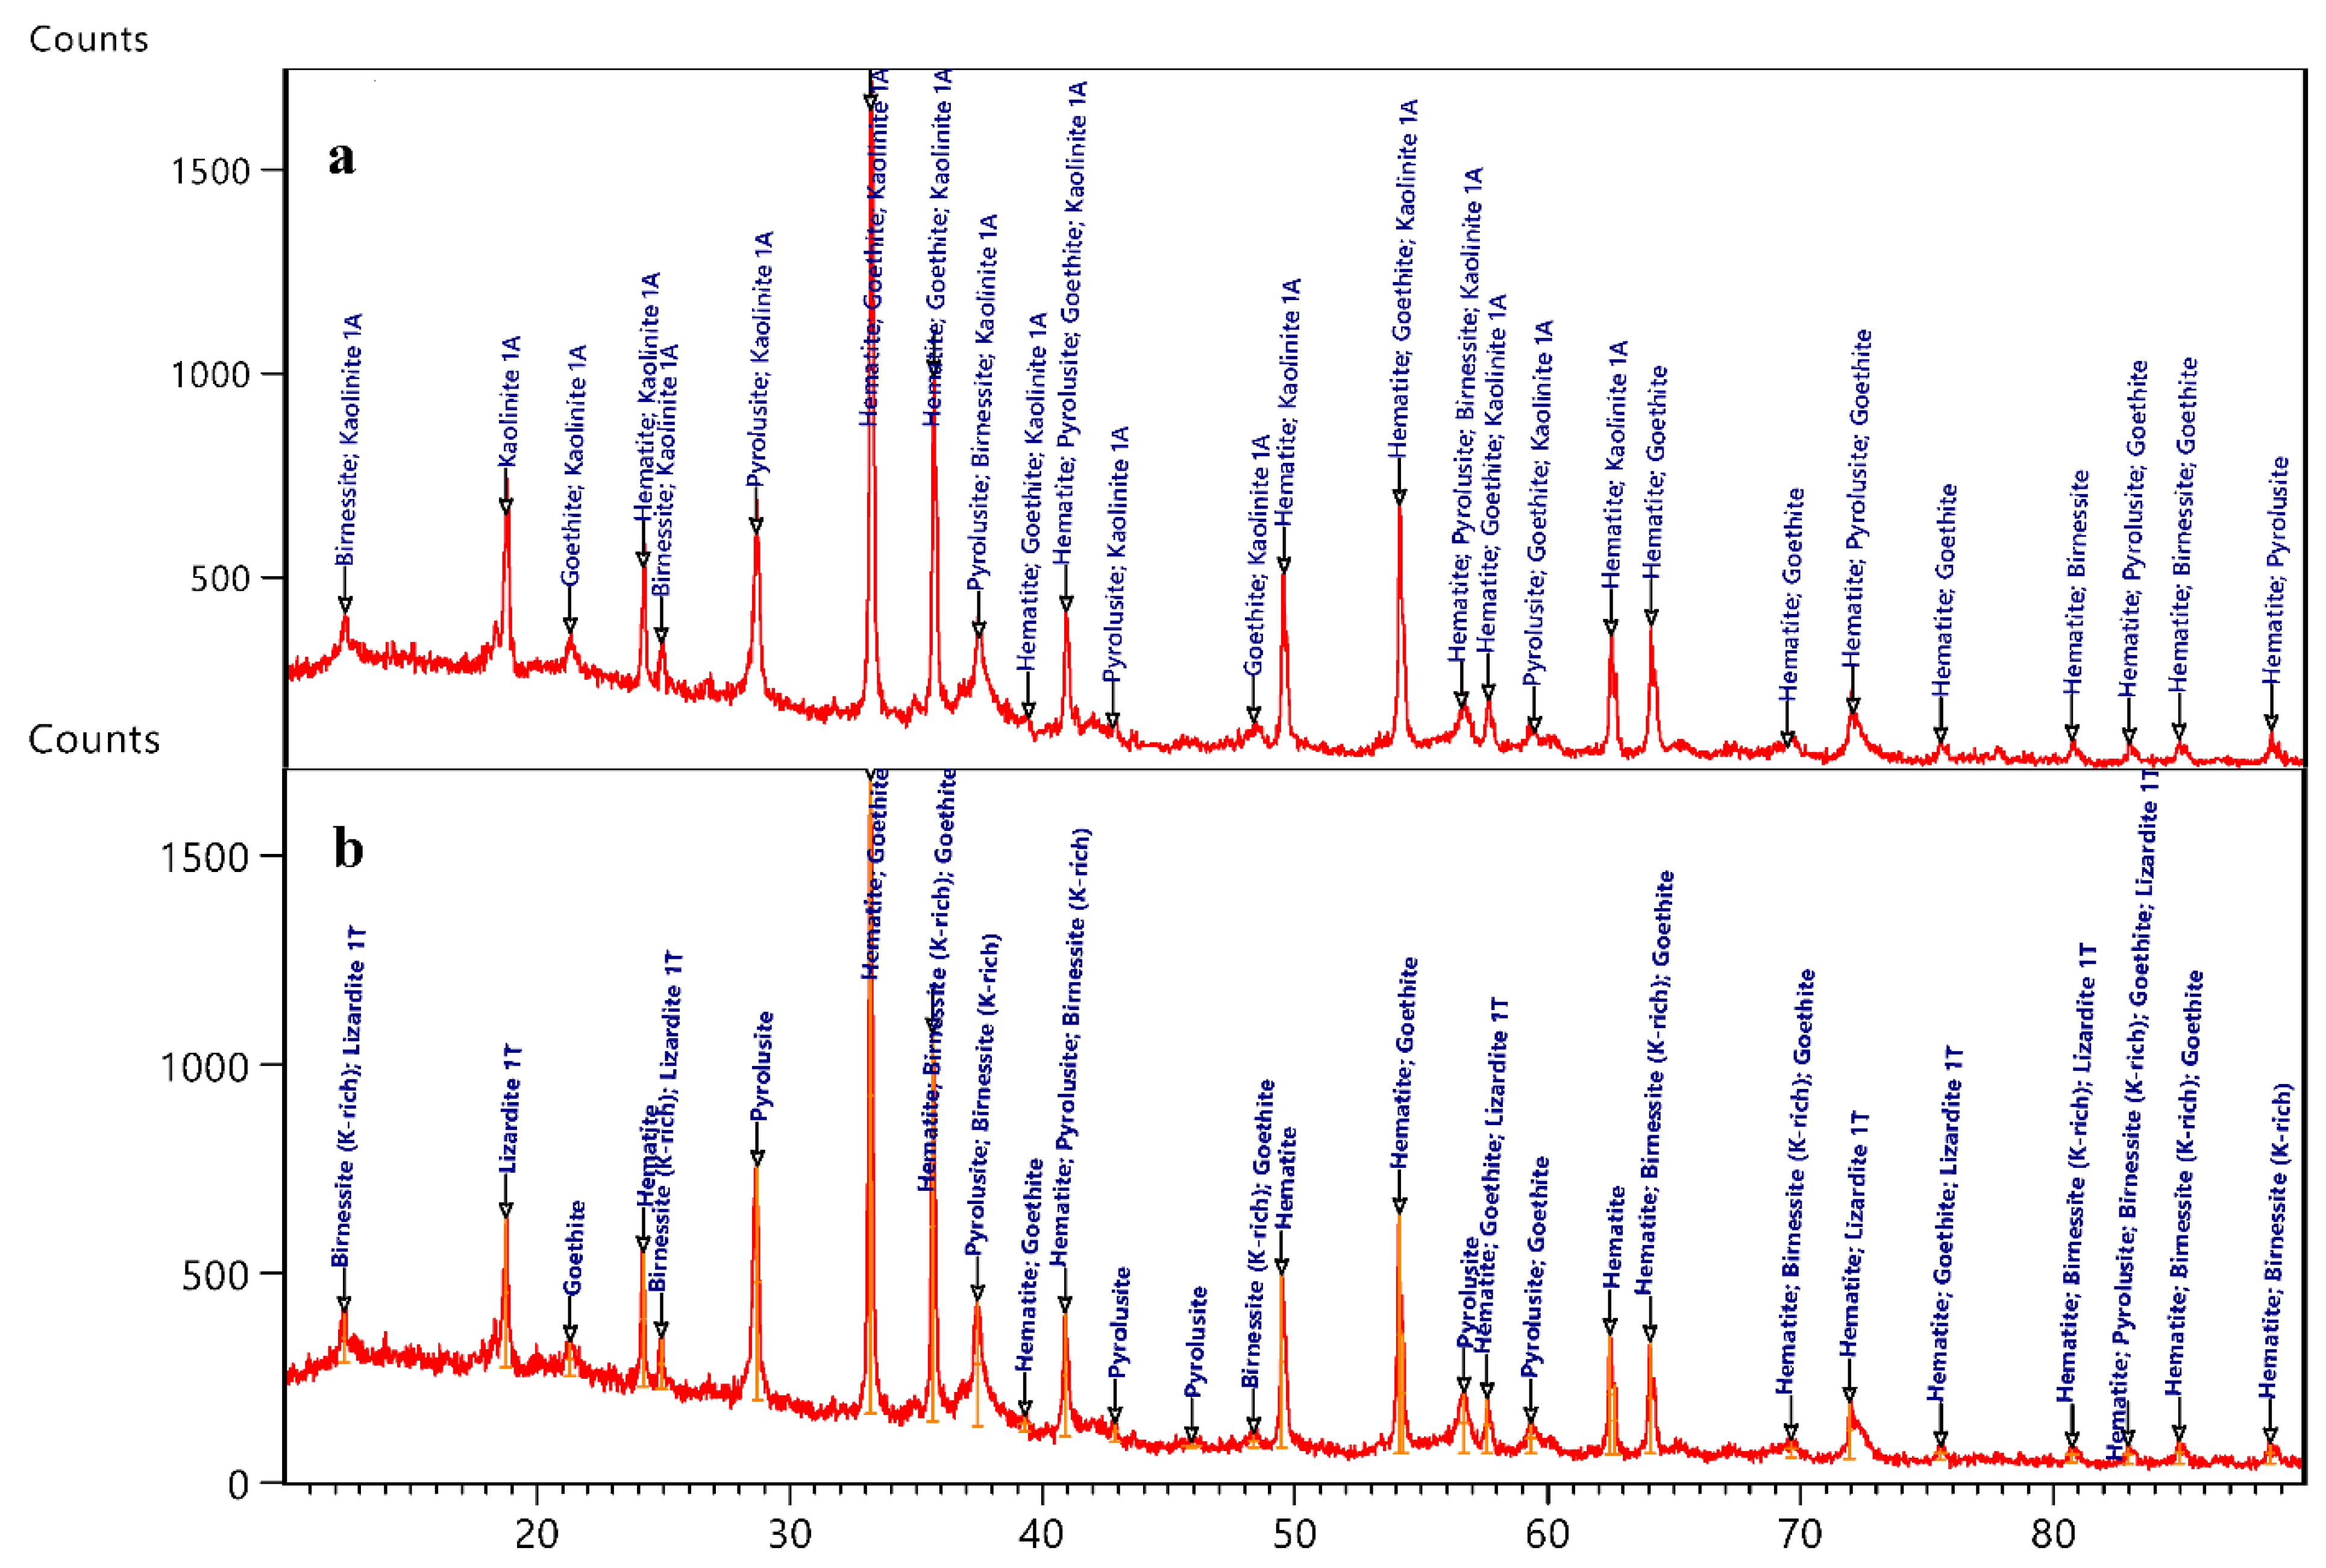
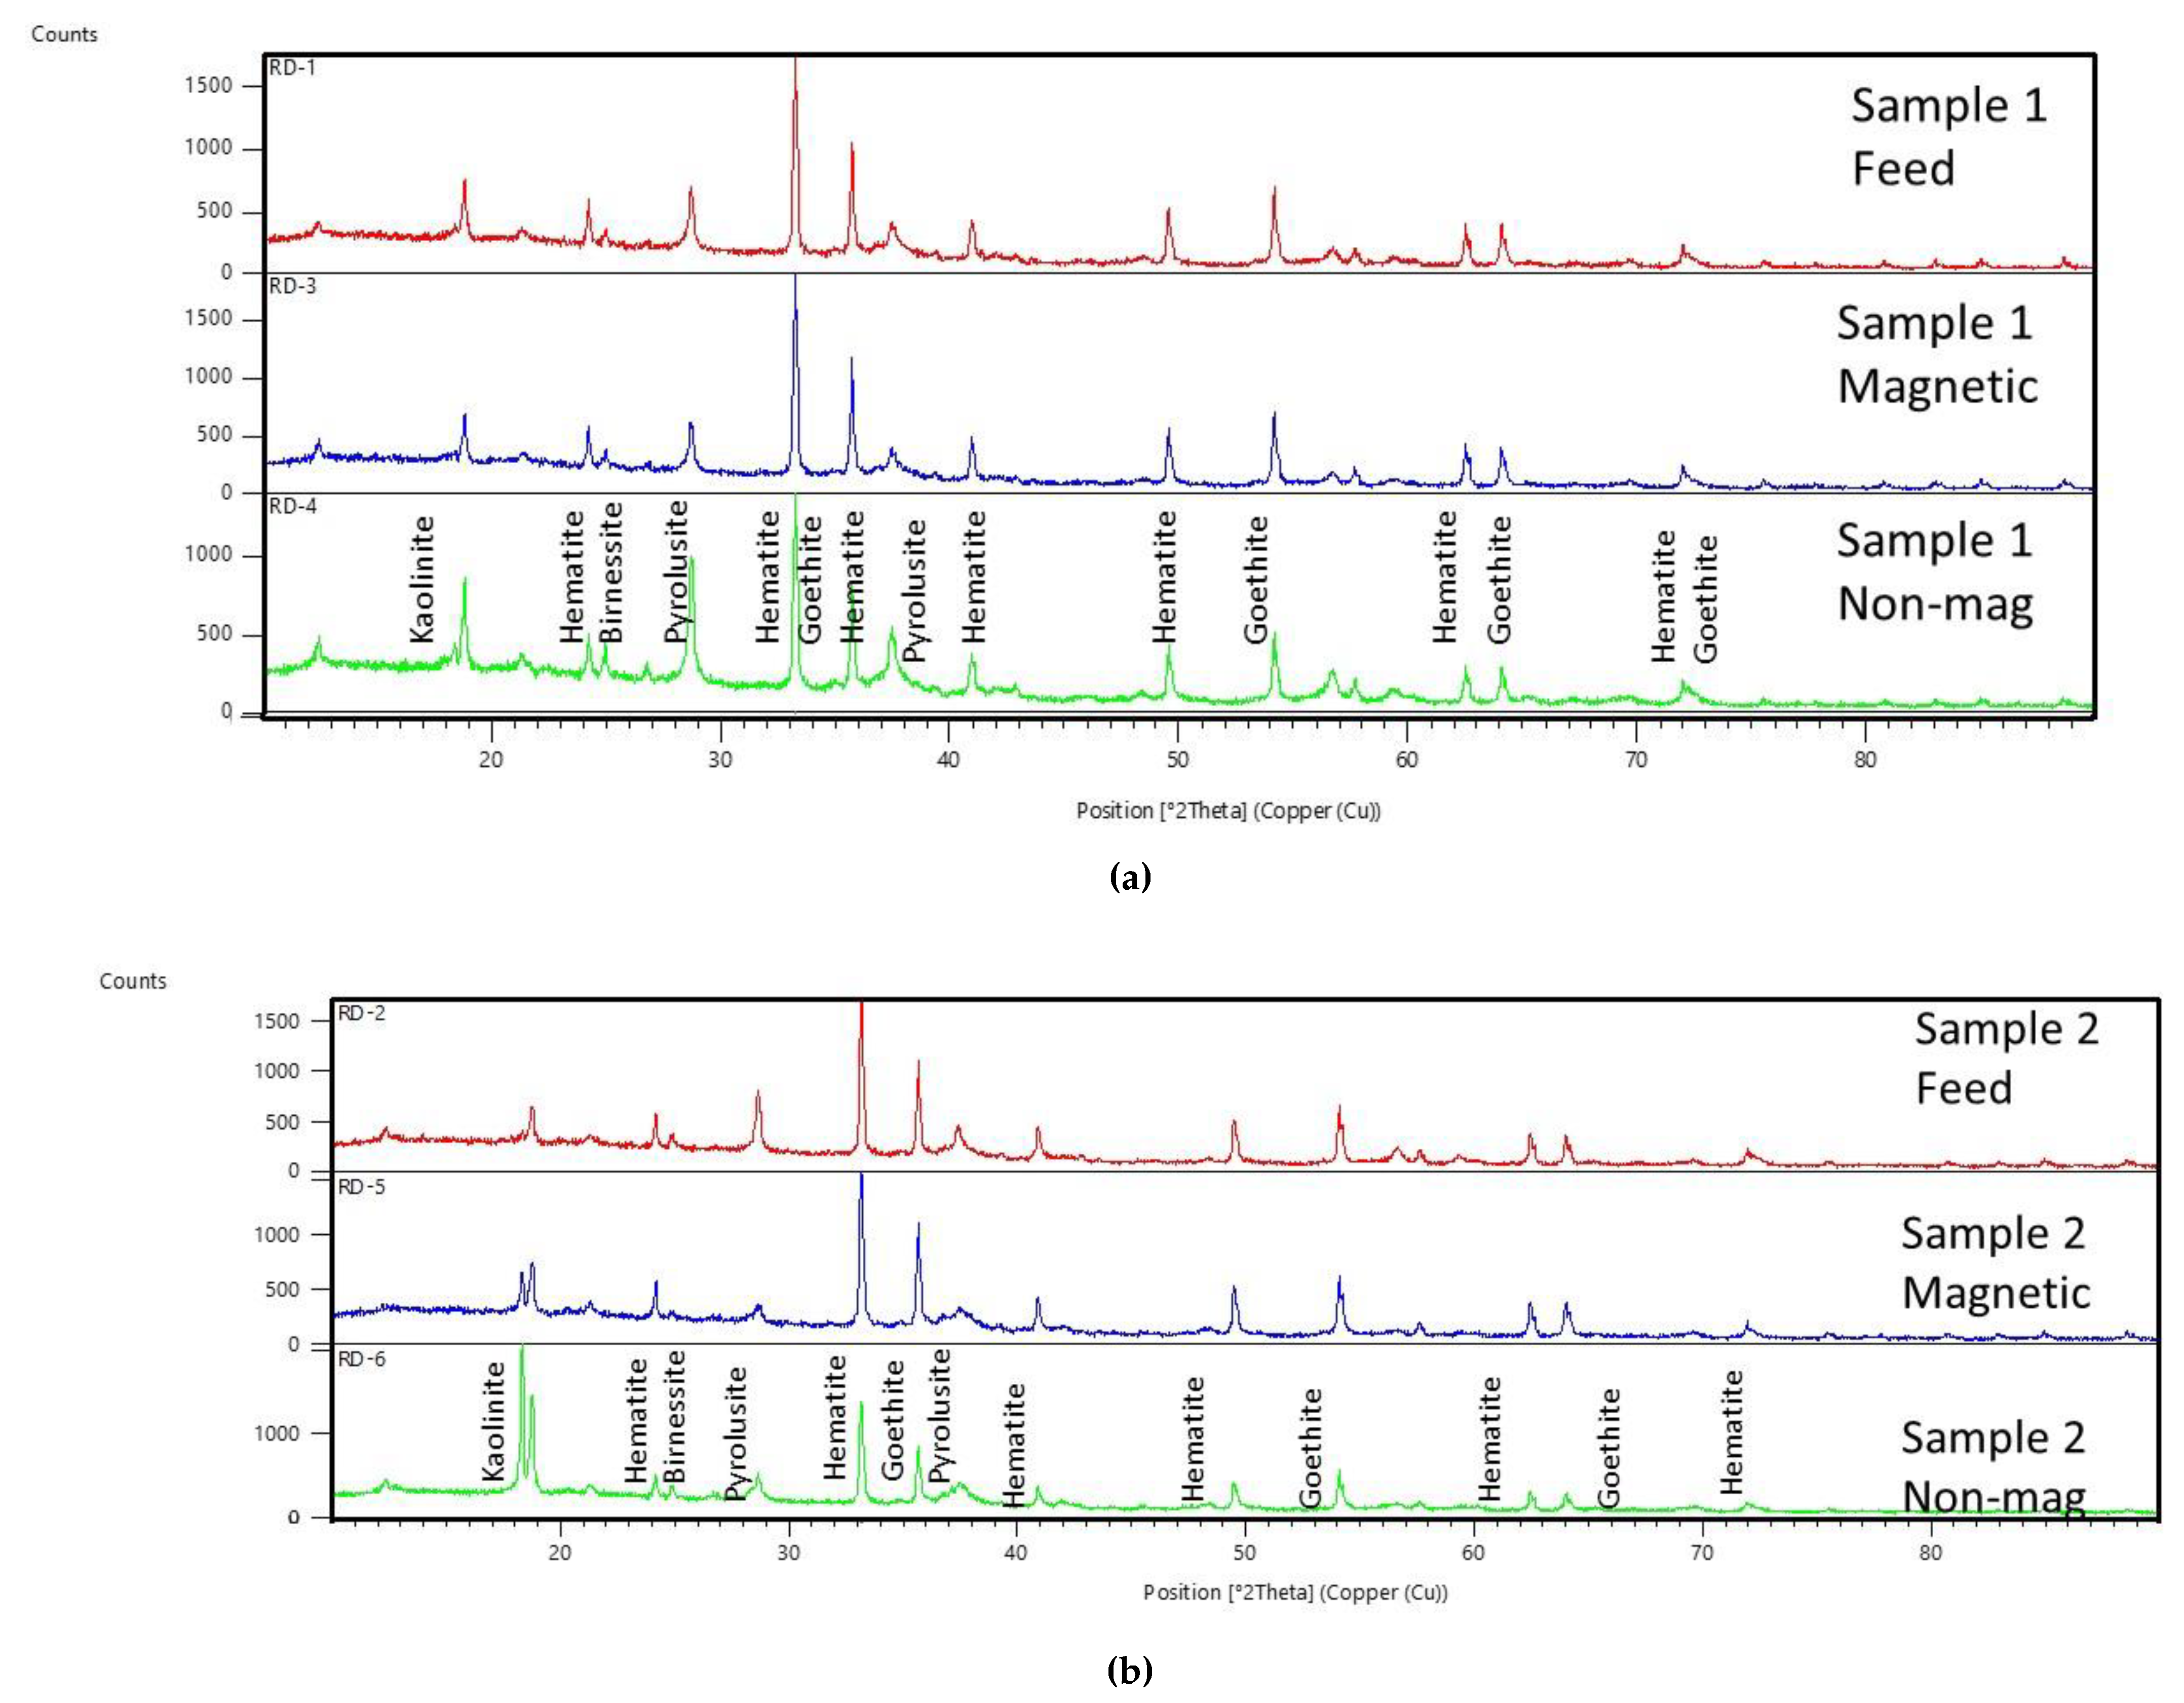
The partial elemental analysis of both the samples is tabulated in Table 4. Sample 1 contained lower Al2O3 and LOI (i.e., 7.85% and 2.78%, respectively) compared to sample 2 (i.e., 10.45% and 5.87%, respectively). Furthermore, both the samples moisture content was in the range of 6 to 7%. The visual examination also revealed that sample 2 was more lateritic compared to sample 1. The particle size distribution of the two samples is depicted in Figure 3. It can be seen from Figure 3 that sample 2 is narrowly distributed, with an average particle size of 285 µm, and with d80 size of 580 µm, while the average size of sample 1 is 200 µm, with d80 size of 400 µm.

4.1.1. XRD Studies

The XRD analysis of both the samples was carried for qualitative phase estimation, and is depicted in Figure 4. Figure 4a,b show that both the samples comprised the major iron-bearing mineral phase, hematite (Fe2O3), and the significant manganese bearing mineral phase was pyrolusite (MnO2). The minor manganese mineral phase was birnessite ((Na0.3Ca0.1K0.1)(Mn4+,Mn3+)2O4·1.5H2O), while the other impurity bearing mineral phase present was stipnomelane (K(Fe2+,Mg,Fe3+)8(Si,Al)12(O,OH)27·n(H2O), however, the proportions of the mineral phases varied. Similar mineral phases were observed by other researchers studying this region [16,21,22,45].

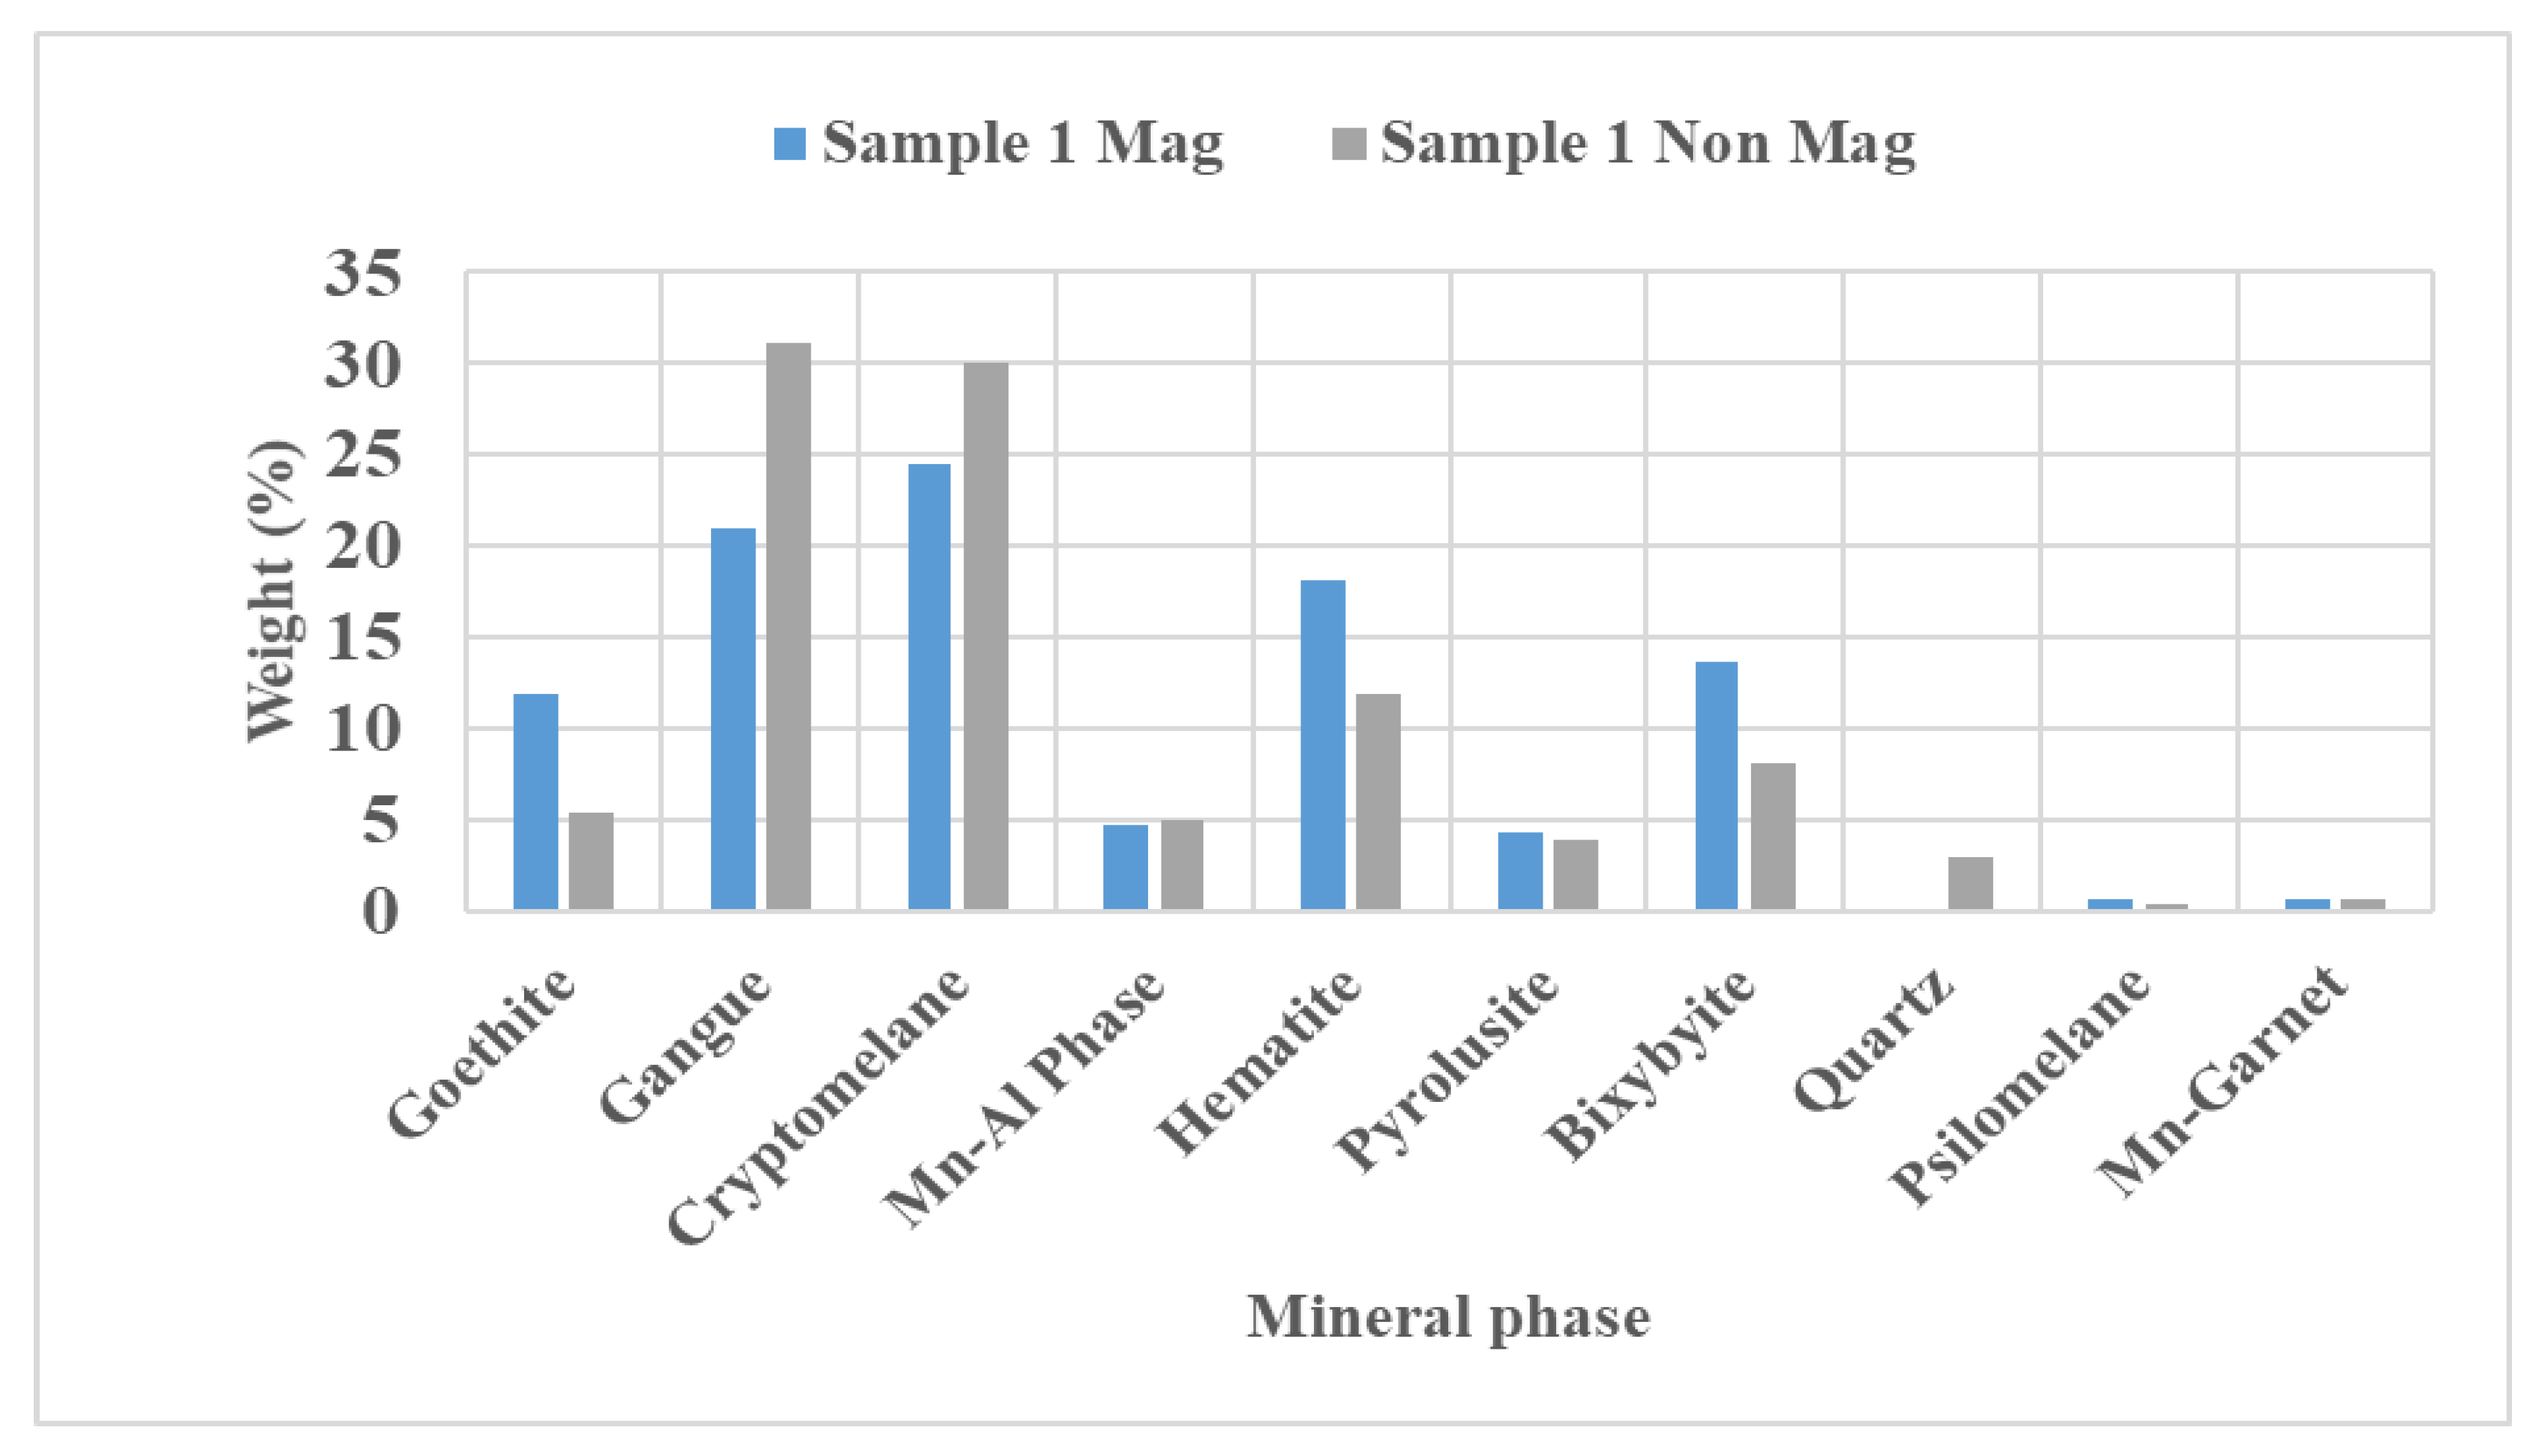
4.1.2. Mineralogical Studies

Mineral liberation studies were carried out for understanding and identifying the associated mineral phases. A mineral liberation analyzer (MLA) is a scanning electron microscope (SEM) equipped with energy dispersive X-ray (EDX) spectrometers, and computer software that automates microscope operation and data acquisition for automated mineralogy. Various quantitative data sets, including modal mineralogy, porosity, grain size and shape, mineral associations, and digital textural maps were collected on the samples’ polished surfaces. MLA measurements were based on backscattered electron (BSE) image analysis, for determining the grain boundaries and locations for X-ray spectral acquisition, and classification of the characteristic X-ray spectra of mineral species by comparison to a library of reference spectra. This data was derived by analyzing >200,000 samples collectively for both samples, and studied for five polished sample surfaces of the feed sample. It was also used to ascertain the mineral contents and the mineral interlocking characteristics of the manganese bearing mineral and gangue bearing mineral. The MLA study provided information on modal mineralogy, mineral grain size distribution, and grain mapping, based on the identified mineral phases, which was used further to comprehend the separation process.
The modal mineralogy data was captured for the two ore samples, and the results are given in Table 5. From Table 5, can be seen the proportion of the various minerals present in the ore, such as goethite (α-FeO·OH), Al-bearing gangues, hematite (Fe2O3), pyrolusite (MnO2), and other mineral phases. Furthermore, both samples were composed of significant manganese bearing mineral phases, such as bixybyite ((Mn, Fe)2O3), cryptomelene (K(Mn4+ Mn2+)8O16), and psilomelane (Ba (H2O)Mn3+5O10). Whereas, the major iron-bearing mineral phases were deported from hematite and goethite. The major manganese bearing mineral phases for sample 1 was pyrolusite, and different from the mineral phases observed in sample 2.

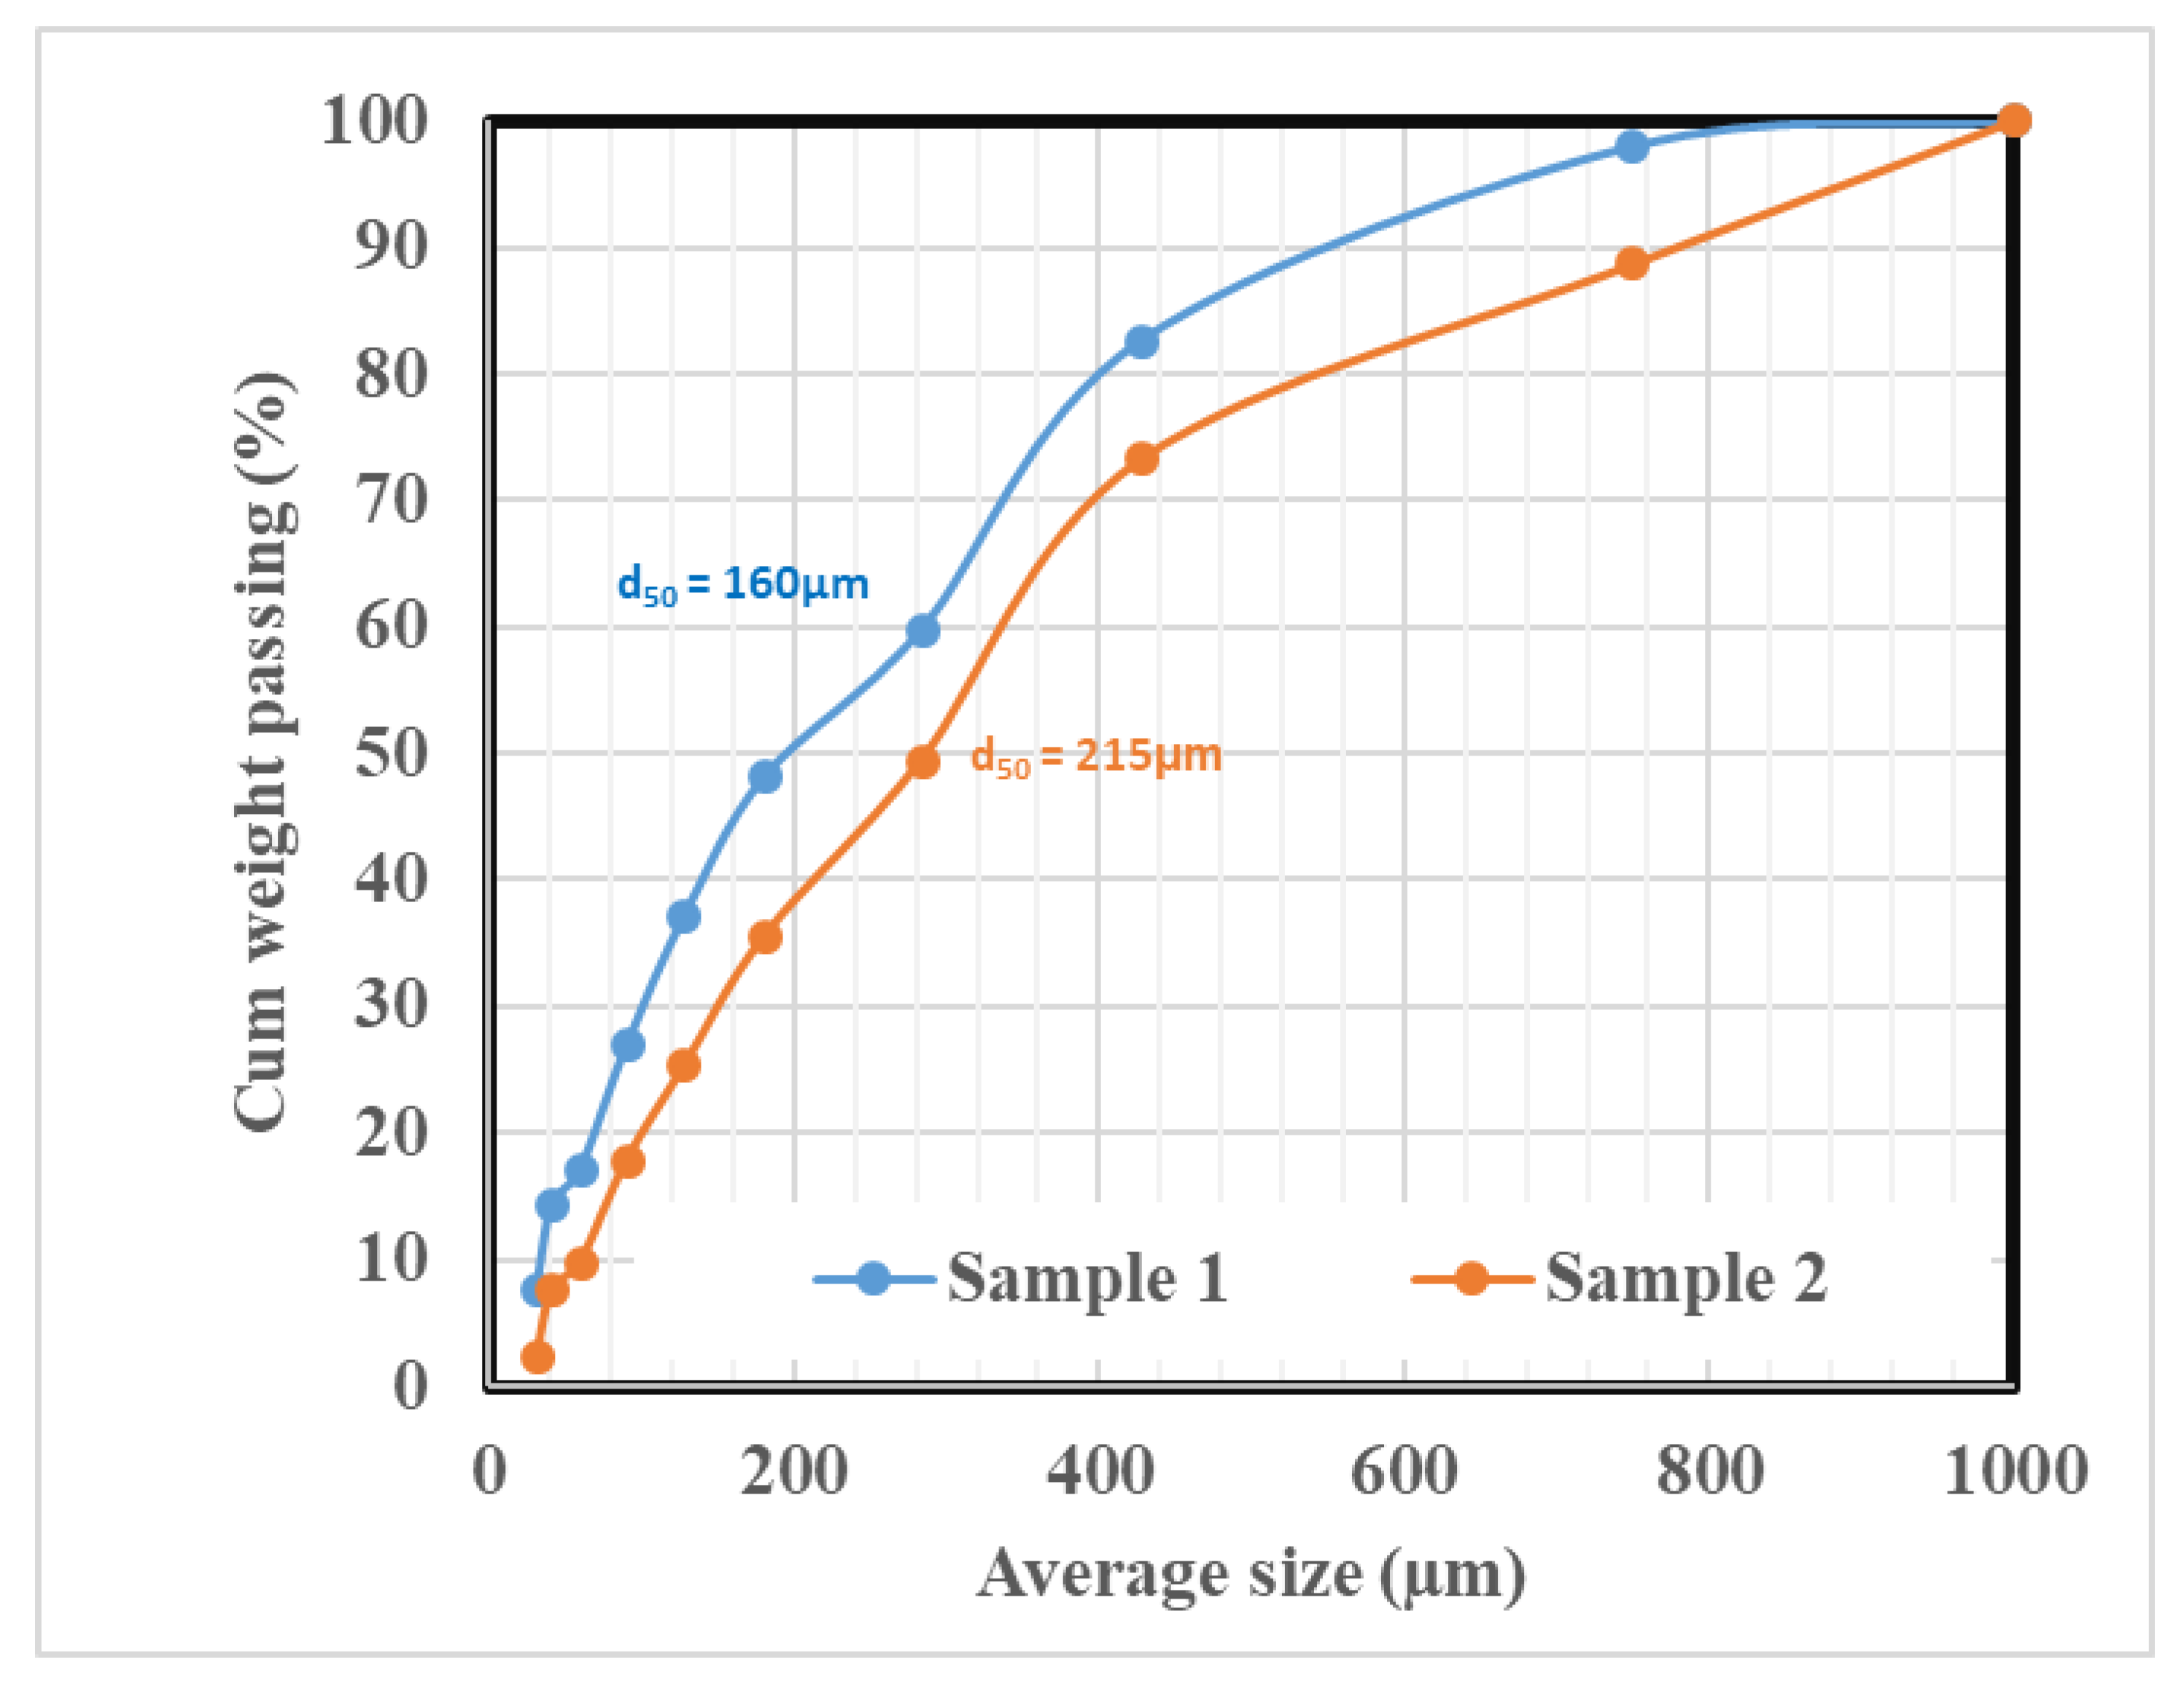
Mineral Grain Size Distribution

The sample 1 grain size distribution obtained from MLA is depicted in Figure 5a. It was observed that the Al-bearing and iron-bearing mineral particles were distributed in a finer size fraction, i.e., around 75 to 80 μm. While the hematite mineral phase was distributed in a coarser size range, i.e., around 160 μm. The manganese mineral phase, the bixybyite and cryptomelene mineral phase grain size distribution, was around 75 and 160 μm, respectively. However, the pyrolusite phase was evenly distributed when compared to the other mineral phases. It was also evident that 80% of the manganese bearing minerals were liberated, at a particle size range between 300 and 400 μm. The quantitative mineralogy revealed that the distribution of significant manganese minerals, such as pyrolusite, cryptomelene, and bixybyite was 5%, 18%, and 11%, respectively. Similarly, the abundance of iron-bearing mineral phases, goethite and hematite, in the ore was 16% and 12%.
Figure 5b shows that the distribution of the alumina bearing minerals and the cryptomelene and hematite was similar to Sample 1. However, the mineral phases like goethite, bixbyite, and pyrolusite were evenly distributed. It was also observed that 80% of manganese bearing minerals were liberated, at particle size between 300 and 425 μm. The association of bixbyite, goethite, and pyrolusite was evenly distributed compared to the other mineral phases present in the sample. The Mn-mineral phases were 25% cryptomelene, 13% bixybyite, and 5% pyrolusite; however, hematite and goethite were 13% and 16%, respectively.
To understand the separation characteristics, Mn and iron-bearing mineral theoretical grade recovery curves for both the samples were plotted in Figure 6a,b. Figure 6a shows that about 80% cryptomelene was recovered, with 75% grade in the product, at a rate of ~35% yield for the sample 1, whereas hematite was recovered. We observed the trend of different minerals. Whereas, in the case of sample 2 it can be seen from Figure 6b that about 80% cryptomelene was recovered with 85% content, for pyrolusite it was ~45%, bixybite ~55%, goethite ~74%, and hematite ~80%. This type of mineralogical assemblage in the ore is complex, and the separation would be difficult considering the interlocking between the Mn- and iron-bearing particles. These theoretical curves will assists us in selecting a suitable upgradation process.

Particle Mapping Using MLA

The mineral phase information was then overlaid on the XBE image to provide the particles’ pictures, as shown in Figure 7 and Figure 8, for samples 1 and 2, respectively. The mineral phase images of both the samples showed that the hematite particles and cryptomelene, even though liberated, were smeared by the alumina bearing gangue phase and finely distributed, and tended to smear on the coarser particle. The complex association of bixybyite and alumina bearing minerals, hematite and pyrolusite was observed at intermediate sizes. The complex interlocking of psilomelane, goethite, bixbyite, and gangue mineral phases was observed at finer size ranges. The results of the grain mapping are synonymous to the size-wise mineral phase distribution. Coarser particles exhibited a complex association of goethite, bixybyite, hematite, and pyrolusite. Though the intermediate size range particles were liberated, and with minimum interlocking. In contrast, the finer particles were synonymous to the coarser particles, exhibiting a complex interlocking of bixybyite, goethite, psilomelane, and gangue.

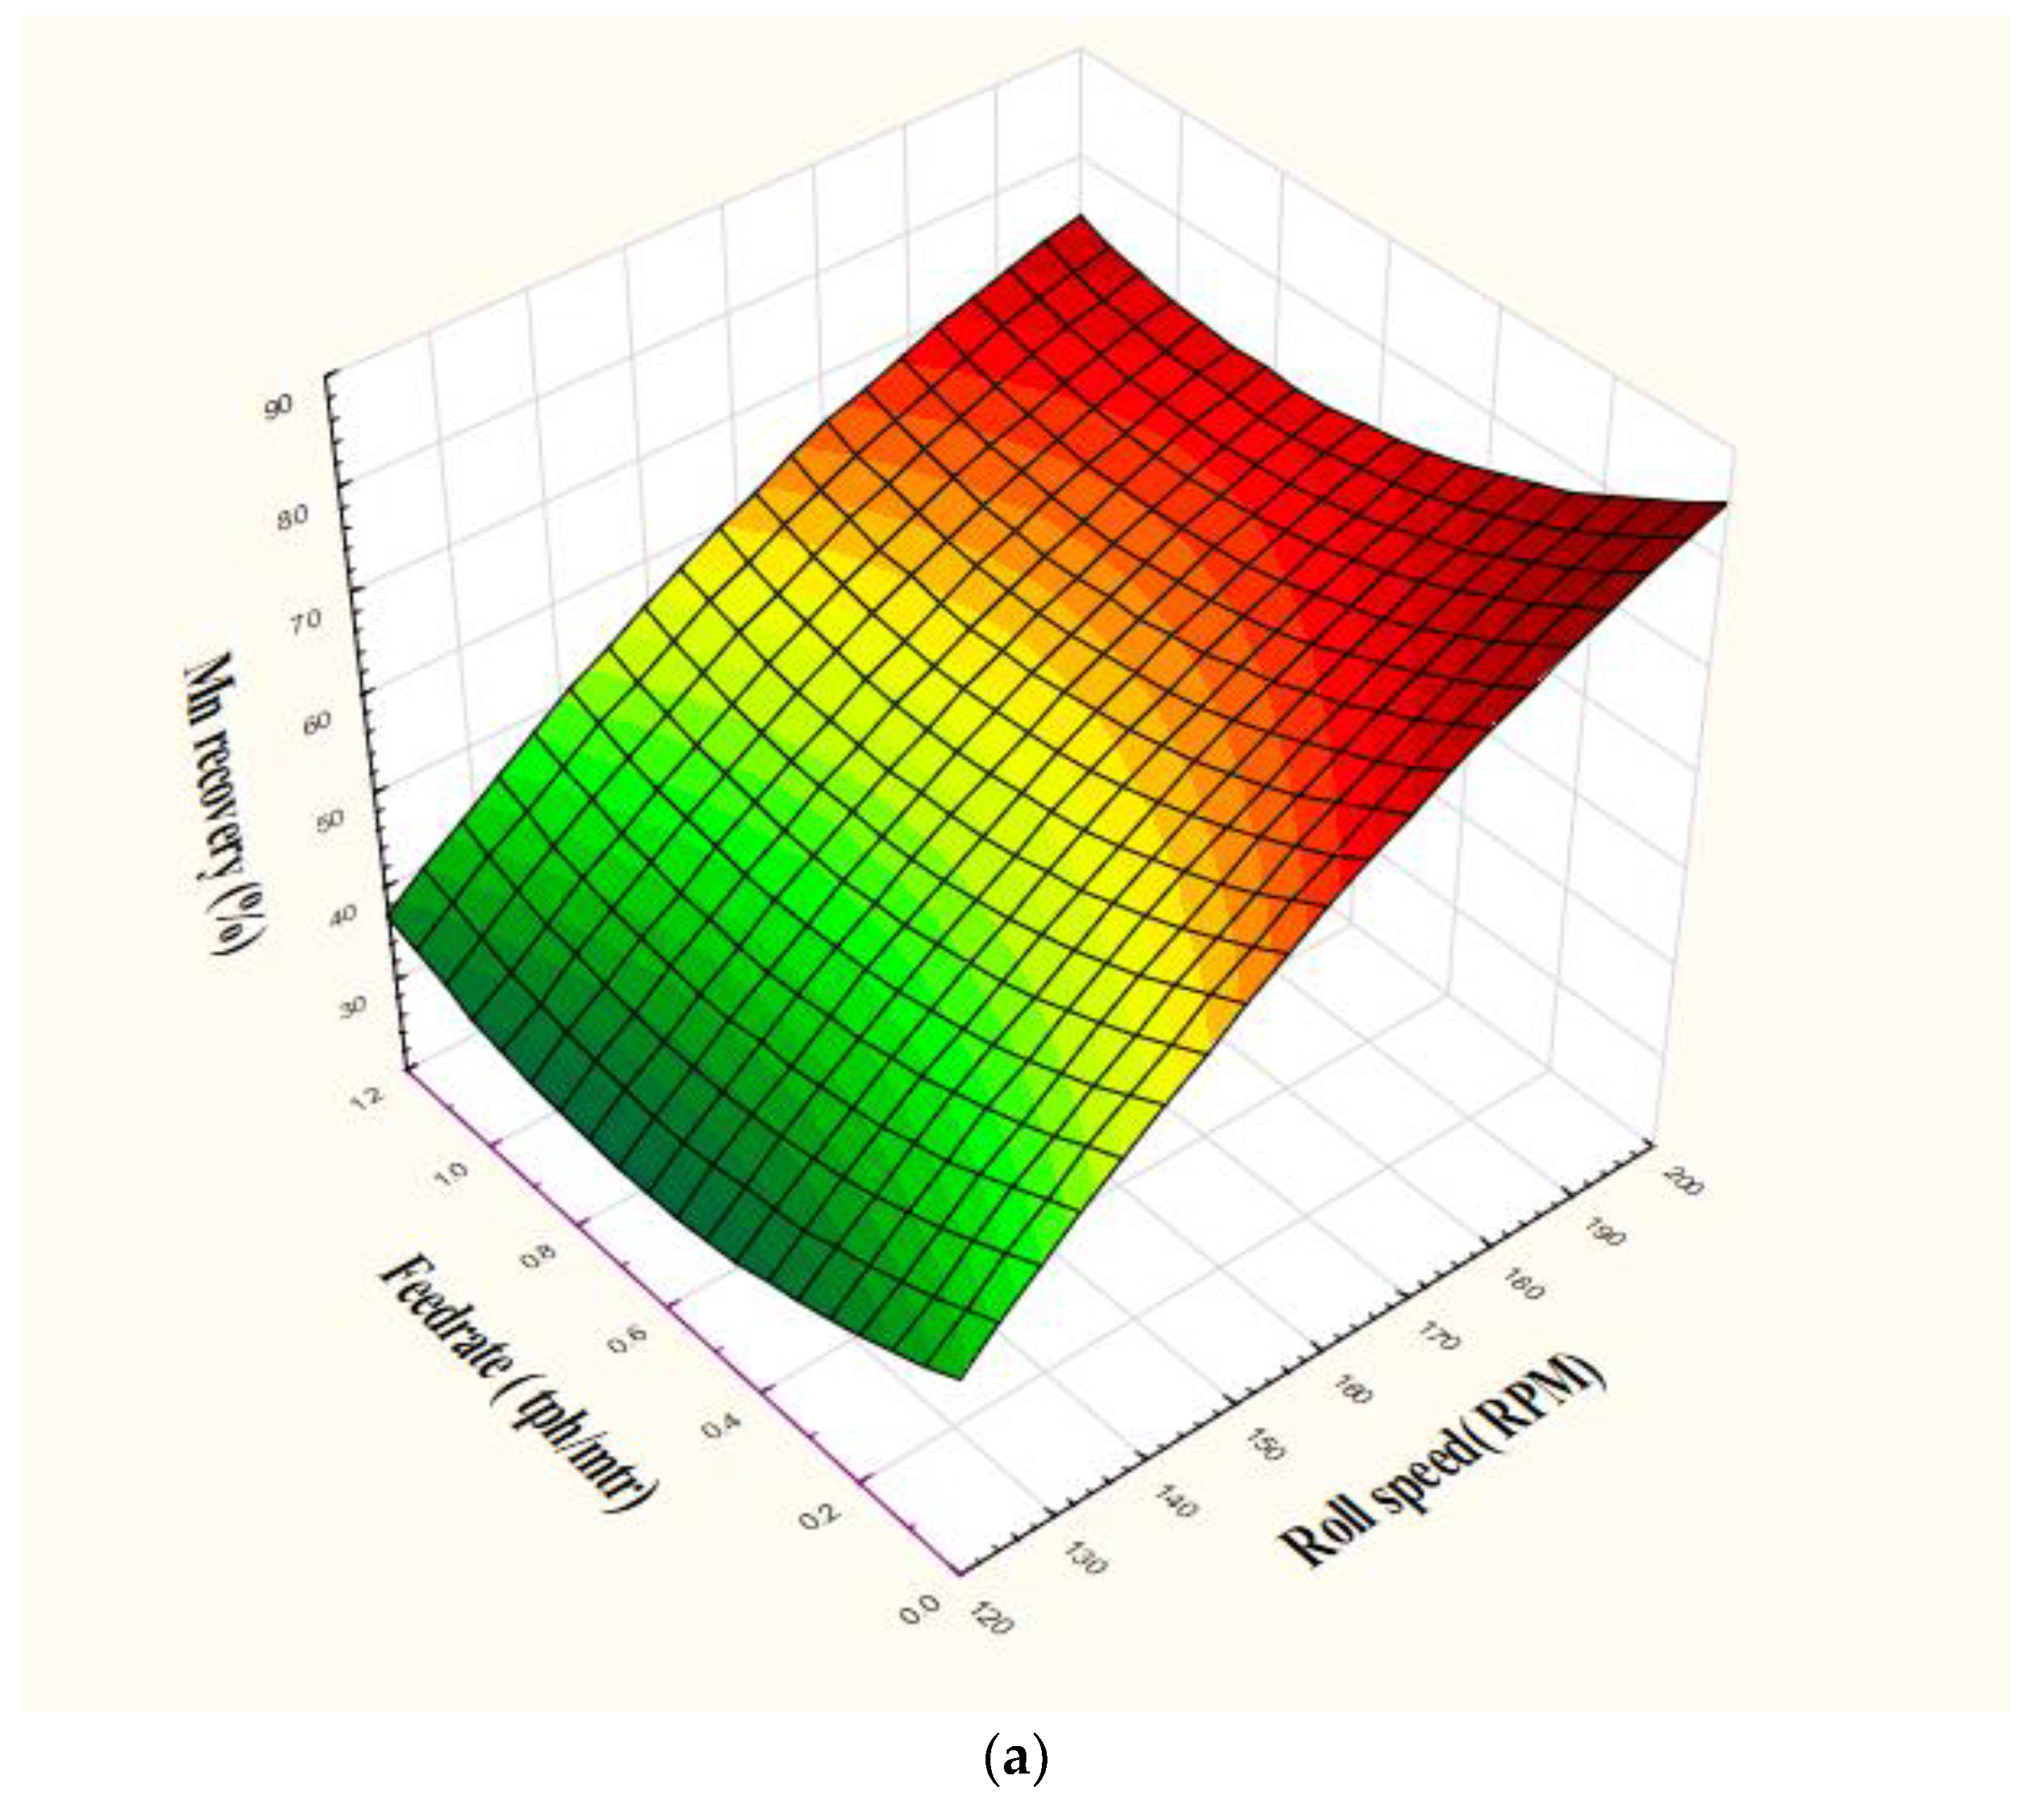
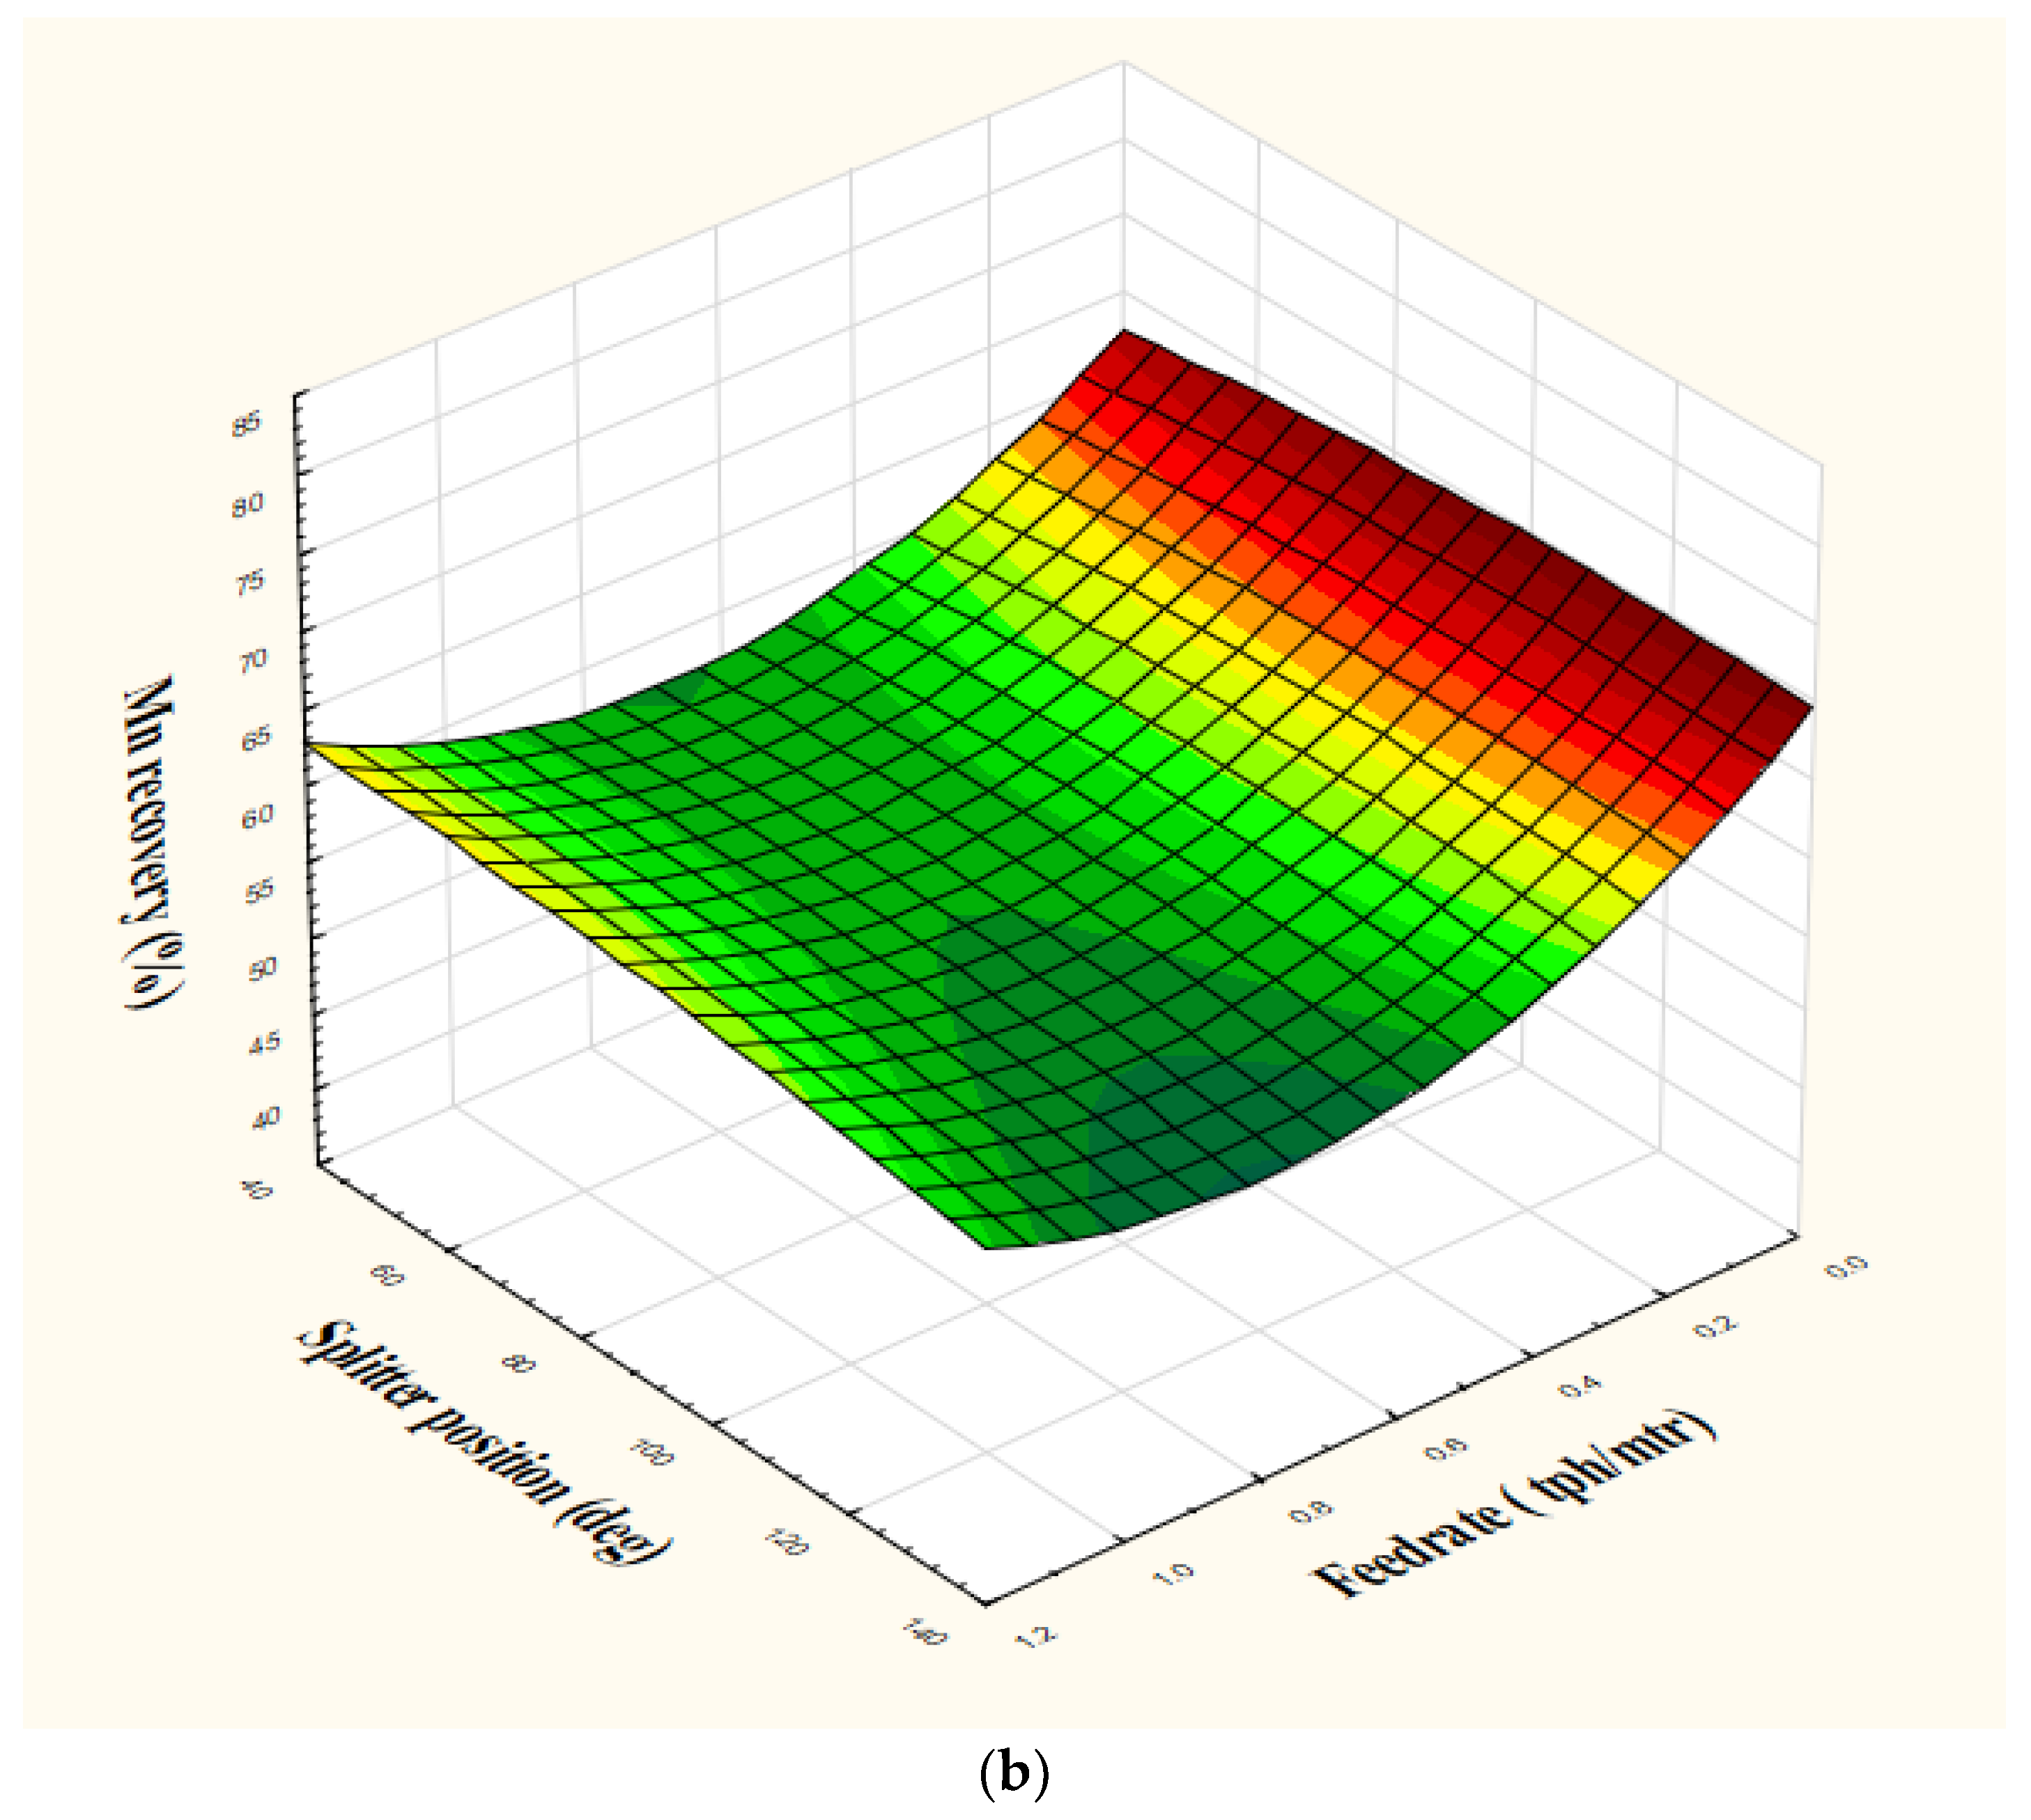
4.2. Magnetic Separation Results

Magnetic separation test results for both the ore samples are given in Table 6. From the test results of sample 1, it can be observed that the maximum Mn content of 35.52% in the non-magnetic fraction was obtained at a medium roll speed, with a lower feed rate and positive splitter position. However, the recovery of manganese at this maximum grade was 69.2%, with a 1.77 Mn:Fe ratio. Similarly, the maximum manganese recovery of 81.2% was obtained at (experiment 2) a higher roll speed, with lower feed rate and neutral splitter position. At this level of recovery, the grade and Mn:Fe ratio were found to be minimum. The maximum Mn:Fe ratio of 1.91 was obtained at (experiment 3) a lower roll speed, higher feed rate, and neutral splitter position.
Similarly, from the magnetic separation test results of sample 2, it is observed that a maximum Mn grade of 33.75% with 44.2% Mn recovery and 1.66 Mn:Fe ratio was reported in experiment 5, where a lower roll speed, medium feed rate, and negative splitter position was maintained. A maximum Mn recovery of 80.7% was obtained in experiment 2. A maximum Mn:Fe ratio of 1.72 was obtained in experiment 7 with lower roll speed, medium feed rate, and higher side of the splitter position. It was found that the best grade that can be obtained from single-stage dry magnetic separation is 35.52% Mn, with a Mn:Fe ratio of 1.77, at a recovery of 44% for sample 1, and 33.75% Mn grade with a Mn:Fe ratio of 1.66, at a recovery of 44% for sample 2. Furthermore, to understand the influence of variables and the separation behavior, a statistical analysis, i.e., analysis of variance (ANOVA) was performed. A summary of this analysis is tabulated in Table 7.
In the case of sample 1, roll speed was the most significant parameter which affected the grade, recovery and Mn:Fe ratio, followed by feed rate. A similar observation was also reported in the published literature, while treating low-grade hematite and garnet fines [29,33]. In the case of sample 2, roll speed tended to be the most significant parameter in all cases. The interactional effect between roll speed and splitter position was more pronounced for binary interactions than the other interaction (between feed rate and splitter position). Furthermore, to gain a deeper understanding of the binary effect of the parameters, 3-D response surface plots were generated to explain the interactive effect of the parameters on the performance of magnetic separation.
It can be observed from Figure 9a, that with an increase in roll speed and feed rate, maximum recovery was obtained; however, a decrease in the feed rate, and keeping the roll speed constant marginally affected the Mn recovery, indicating the dominance of roll speed in the interactive effects as well. Roll speed affects the centrifugal force acting on the particle, and thereby controls the separation [33]. Increase in roll speed might decrease the resultant force acting on the particle. Hence, it might have facilitated better segregation of the paramagnetic minerals to a non-mag fraction, thus increasing the Mn recovery. The interactive effect of splitter position and feed rate on recovery is also observed in Figure 9b. Feed rate decides the number of layers of the particle flow on the belt surface, where the number of layers governs the particle exposure to the magnetic field, and its intensity [32]. It is observed that with an increase in feed rate, Mn recovery to non-magnetic fraction increases. Hence, it is opined that manganese bearing minerals, being paramagnetic, get segregated a to non-magnetic fraction, due to experiencing lower magnetic field intensity; or the particle has less opportunity due to multi-layers in the magnetic zone, as well as a lesser residence time. Statistical optimization was also carried out using the Design Experts, (version 6.1.10, Stat-Ease Inc, Minneapolis, MN, USA) tool to find out the optimization range and the optimized parameter range to conduct the second stage magnetic separation test. The obtained results are as depicted in Figure 10a,b. The optimized results are flagged and marked in a yellow color in the graph.
The experimental condition was chosen to reprocess for a cleaning (non-magnetic fraction second stage separation) and scavenging operation (magnetic fraction second stage separation) based on the optimum condition. The results of the non-magnetic fraction cleaning operation are given in Table 8. It can be observed from the re-treatment test results that about 29% (maximum) yield was obtained to the non-magnetic fraction, with a grade of 34.92% Mn, Mn:Fe ratio of 1.7, and 36% Mn recovery. With the option of reprocessing the non-magnetic fraction by decreasing the roll speed, the quality (Mn grade and Mn: Fe ratio) of the non-magnetic fraction was increased. However, the yield and recovery were decreased.
It was also observed from the re-treatment test of magnetic fraction, that there was an increase of manganese content from 24.2% to 29.58%. Thus, the obtained non-magnetic fraction was mixed with the non-magnetic fraction of the first roll (first experiment) and the composite product was analyzed. Similarly, tests were conducted with the other experimental products of tests 5 and 7, and are tabulated in Table 9. From the experimental results (Table 9), it is observed that by retreating the magnetic product, sample 2 was degraded in terms of the Manganese content and the Mn:Fe ratio. This might have been due to the complex association of the iron-bearing and manganese bearing mineral phase, and may also be due to the presence of complex alumina bearing phases at this fines size. However, the separated products were analyzed by carrying out a mineralogical study of the samples.

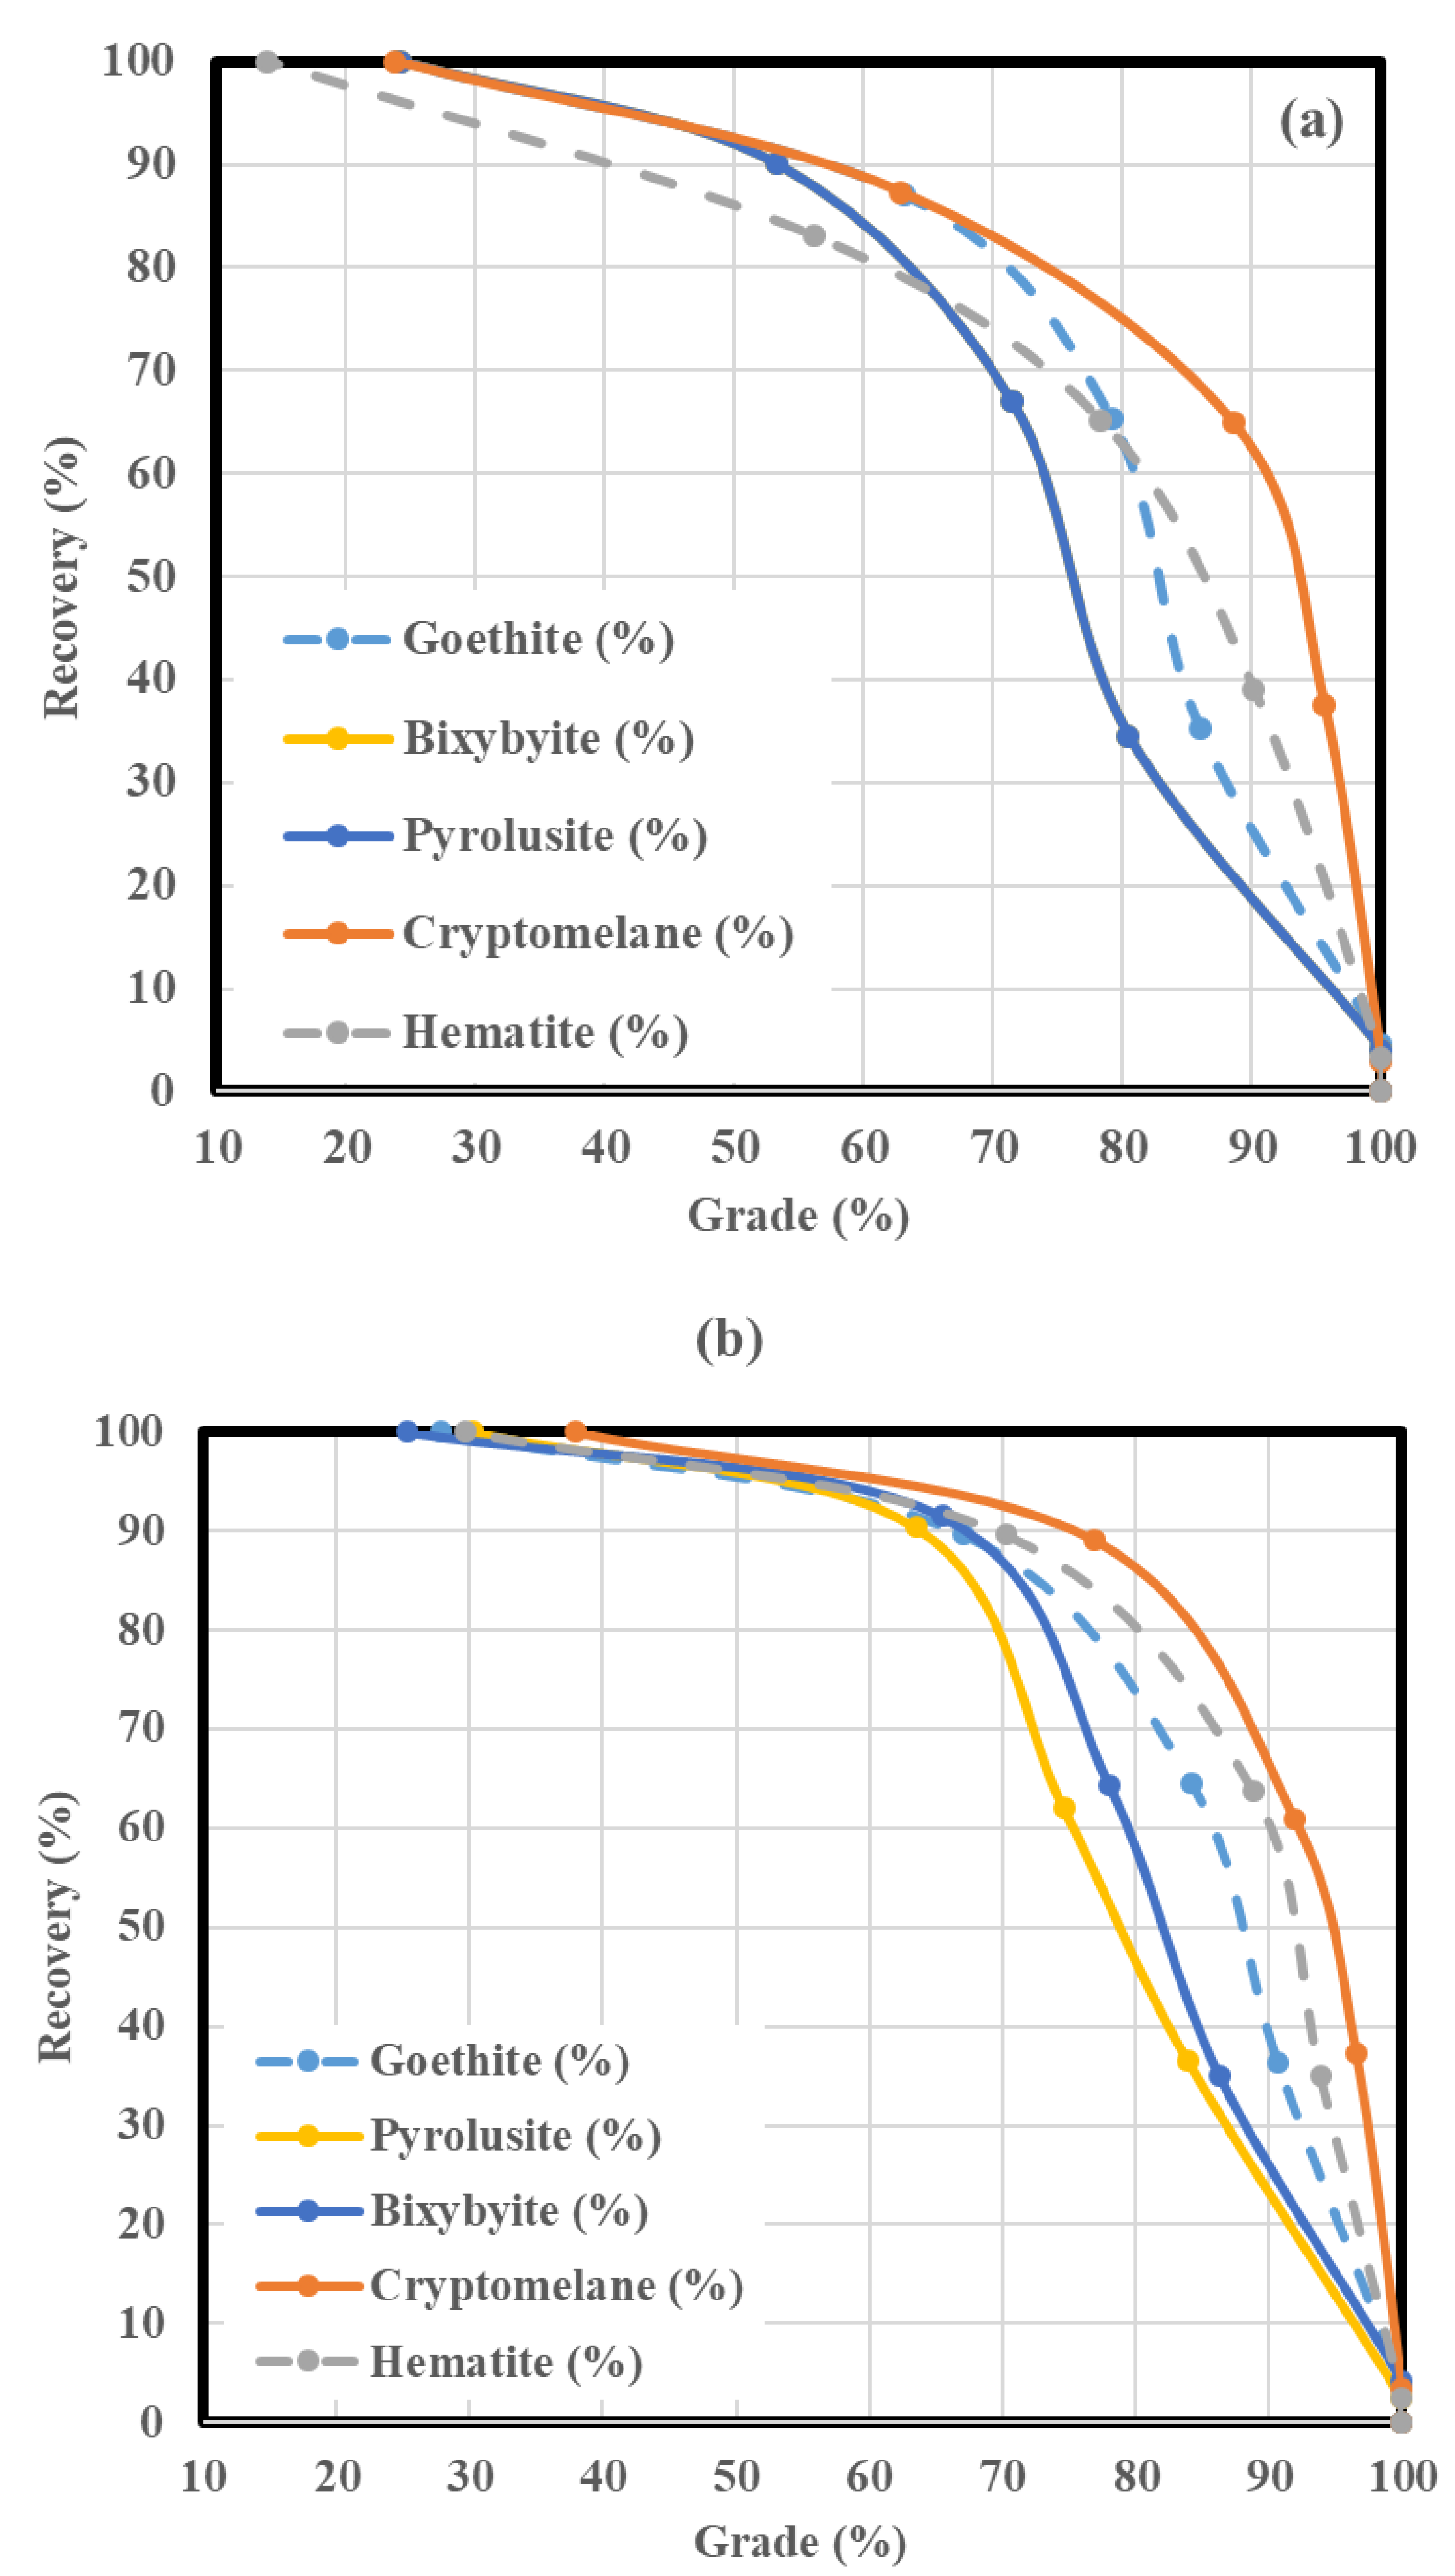
4.3. Mineralogy Interpretation

X-ray diffraction studies of the feed and the products of sample 1 were analyzed to understand the enrichment of the different phases in the concentrated product. Figure 11a shows a change in the peaks against the pyrolusite and the hematite, indicating that the separation was achieved, as observed from the increase and decrease in the counts. However, a similar change in the peaks was not observed for sample 2 (Figure 11b), indicating that separation had not been achieved, which may be due to a higher level of complexity in terms of the mineralogical assemblage.
Furthermore, the separated products were subjected to different mineral identification to understand the separation phenomena. The comparison of the modal mineralogy obtained from the MLA studies was observed for an understanding of the separation characteristics in Test 1 of sample 1. The modal mineralogy of the magnetic and non-magnetic fraction for sample 1 is depicted in Figure 12. Form Figure 12, it is observed that there is a clear trend in the distribution of the minerals. Goethite and hematite phases are reported more in the magnetic fraction, compared to the non-magnetic fraction. Similarly, the cryptomelene, Al-silicate phases (gangue), and quartz are higher in the non-magnetic fraction. However, the proportion of hematite and goethite belonging to the non-magnetic fraction may be due to the particle size effect, and the mineral phase interlocking in the particles.
Comparative analysis was attempted, to understand the actual and theoretical recovery of each mineral phase for sample 1. The findings are plotted in a bar graph in Figure 13. It is observed that there is a considerable gap in the recoveries of the mineral phases in the separated product. We could achieve the desired constituents in the product with higher recoveries, in contrast with the undesired constituents. This may be attributed to the liberation of the mineral phases at finer sizes, where the efficiency of dry magnetic separation is diminished. Additionally, finer manganese particles belonged to the non-magnetic fraction through the smearing effect, which is challenging to address through dry magnetic separation.

5. Conclusions

The influence of mineralogy on magnetic separation for two different ferruginous low-grade manganese ores was studied. Detailed characterization studies concluded that there are distinct characteristics of mineralogy between these ores. In sample 1, bixybyite and goethite have an identical liberation grain size of 75 µm and 80 µm, respectively. Pyrolusite is evenly distributed in all the size fractions compared to the other mineral phases. Similarly, cryptomelene and hematite are distributed at the coarser size of 160 µm and 165 µm, respectively. In the case of sample 2, the goethite, bixbyite and pyrolusite are evenly distributed, unlike in sample 1. It was also found that 80% of manganese bearing minerals are liberated at a particle size between 300 and 425 µm. A distinctive upgradation potential in dry magnetic separation for both the ore types was observed based on the mineralogical change. The best grade that could be obtained from the single-stage dry magnetic separation of sample 1 was 35.52% Mn, and with a 1.77 Mn:Fe ratio, at 44% Mn recovery, whereas in the case of sample 2, a 33.75% Mn grade, with 1.66 Mn:Fe ratio, at 44% Mn recovery was achieved. Mineralogical studies concluded that the complexity of the mineral phases associated in sample 1 was relatively lower compared to sample 2. The liberation characteristics in sample 2 impacted the magnetic separation performance, which was substantiated through XRD and automated mineralogy. A characteristic change in peaks for sample 1 was observed near the pyrolusite and the hematite, indicating that the separation had been achieved. This was confirmed from the increase and decrease in the counts, which were absent in sample 2. The modal mineralogy of the separated products, i.e., the magnetic and non-magnetic fraction for sample 1 indicated the characteristic segregation based on the mineral phases. Goethite and hematite phases were reported more in the magnetic fraction compared to the non-magnetic fraction. Similarly, the cryptomelene, Al-Si phases (gangue), and quartz were higher in the non-magnetic fraction. Furthermore, the concentrate produced from the magnetic separation studies was found to be suitable for a feedstock for silico-manganese production.

Author Contributions

Conceptualizations, S.K.B., S.K.T., C.R.K.; methodology, S.K.B. & S.K.T.; software, S.K.B.; validation, S.K.B. & S.K.T.; formal analysis, S.K.B. & S.K.T.; investigation, T.K.G. & Y.R.M.; resources & C.R.K.; data curations; writing—original draft preparations & S.K.T.; writing—review and editing, S.K.B. & S.K.T.; visualizations: S.K.T.; supervision, C.R.K. & D.P.C. project administration, S.K.B. & S.K.T.; All authors have read and agreed to the published version of the manuscript.

Funding

This research received no external funding.

Institutional Review Board Statement

Not applicable.

Informed Consent Statement

Not applicable.

Data Availability Statement

Not applicable.

Acknowledgments

The authors are thankful to the management of Tata Steel Ltd. for the support and permission to publish this study. The author wishes to express the gratitude for timely support by Balaji and Satish of the Eriez India Ltd. for the support extended during the trials. Authors also acknowledge the efforts of Rishikant Maurya, who extended the help during the sample collection at mines. SKT would like to acknowledge Labex Resources 21 supported by the French National Research Agency through the national program “Investissements d’Avenir” [reference ANR–10–LABX–21] for his fellowship.

Conflicts of Interest

The authors declare no conflict of interest.

References

  1. Araujo, A.C.; Amarante, S.C.; Souza, C.C.; Silva, R.R.R. Ore mineralogy and its relevance for selection of concentration methods in processing of Brazilian iron ores. Miner. Process. Extr. Metall. 2003, 112, 54–64. [Google Scholar] [CrossRef]
  2. Upadhyay, R.K.; Roy, S.; Venkatesh, A.S.; Rao, M.V.S.; Banerjee, P.K. Relevance of geological aspects and ore mineralogy in selecting beneficiation methods for processing of eastern Indian iron ores. Miner. Process. Extr. Metall. 2009, 118, 49–59. [Google Scholar] [CrossRef]
  3. Dwivedy, K.K. The role of process mineralogy in mineral beneficiation. Met. Mater. Process. 1998, 10, 1–12. [Google Scholar]
  4. Mishra, S.; Mohapatra, B.K.; Dash, N.; Rao, D.S. Ore petrography of low-grade siliceous manganese ores from the Bonai-Keonjhar belt, Orissa, India: The influence of mineral-fabric on their beneficiation. Min. Sci. Technol. China 2011, 21, 803–808. [Google Scholar] [CrossRef]
  5. Ahmed, Y. Role of ore mineralogy in selecting beneficiation route for magnesite-dolomite separation. Phys. Chem. Probl. Miner. Process. 2013, 49, 525–534. [Google Scholar]
  6. Bradshaw, D. The role of “process mineralogy”. Improving the process performance of complex sulphide ores. In Proceedings of the XXVII International Mineral Processing Congress, Santiago, Chile, 20–24 October 2014. [Google Scholar]
  7. Celik, I.B.; Can, N.M.; Sherazadishvili, J. Influence of process mineralogy on improving metallurgical performance of a flotation plant. Miner. Process. Extr. Metall. Rev. 2010, 32, 30–46. [Google Scholar] [CrossRef]
  8. Evans, C.L.; Wightman, E.M.; Manlapig, E.V.; Coulter, B.L. Application of process mineralogy as a tool in sustainable processing. Spec. Issue Process Mineral. 2011, 24, 1242–1248. [Google Scholar] [CrossRef]
  9. Lotter, N.O. Modern process mineralogy: An integrated multi-disciplined approach to flowsheeting. Spec. Issue Process Mineral. 2011, 24, 1229–1237. [Google Scholar] [CrossRef]
  10. Can, N.M.; Celik, I.B.; Bicak, O.; Altun, O. Mass balance and quantitative mineralogy studies for circuit modification. Miner. Process. Extr. Metall. Rev. 2013, 34, 348–365. [Google Scholar] [CrossRef]
  11. Mohanan, S.; Bhoja, S.K.; Kumar, C.R.; Kumar, A.; Venugopalan, T. Estimation of ore mineralogy from analytical analysis of iron ore. Miner. Metall. Process. 2015, 32, 97–101. [Google Scholar] [CrossRef]
  12. Grammatikopoulos, T.; Downing, S. The disruptive role of process mineralogy in geology and mineral processing industry. Asp. Min. Miner. Sci. 2020, 5, 571–579. [Google Scholar] [CrossRef]
  13. Roskill Information Services. Manganese: Global Industry Markets & Outlook to 2020; Roskill Information Services: London, UK, 2015. [Google Scholar]
  14. Hund, K.; Porta, D.L.; Fabregas, T.P.; Laing, T.; Drexhage, J. The Mineral Intensity of the Clean Energy Transition; The World Bank: Washington, DC, USA, 2020. [Google Scholar]
  15. Grieco, G.; Kastrati, S.; Pedrotti, M. Magnetic enrichment of braunite-rich manganese ore at different grain sizes. Miner. Process. Extr. Metall. Rev. 2014, 35, 257–265. [Google Scholar] [CrossRef]
  16. Singh, V.; Chakraborty, T.; Tripathy, S.K. A Review of low grade manganese ore upgradation processes. Miner. Process. Extr. Metall. Rev. 2020, 41, 417–438. [Google Scholar] [CrossRef]
  17. Tripathy, S.K.; Banerjee, P.K.; Suresh, N.; Murthy, Y.R.; Singh, V. Dry high-intensity magnetic separation in mineral industry—A review of present status and future prospects. Miner. Process. Extr. Metall. Rev. 2017, 38, 339–365. [Google Scholar] [CrossRef]
  18. Nunna, V.; Hapugoda, S.; Pownceby, M.I. Dry Beneficiation of Low-Grade Goethite-Rich Iron Ore Fines by Air Classification, Reduction Roasting and Magnetic Separation; Institute of Mining Engineers: Perth, WA, Australia, 2019. [Google Scholar]
  19. Gill, C.B. Magnetic separation. In Materials Beneficiation; Materials Research and Engineering; Gill, C.B., Ed.; Springer: New York, NY, USA, 1991; pp. 128–140. ISBN 978-1-4612-3020-5. [Google Scholar]
  20. Elliott, R.; Barati, M. A review of the beneficiation of low-grade manganese ores by magnetic separation. Can. Metall. Q. 2020, 59, 1–16. [Google Scholar] [CrossRef]
  21. Singh, V.; Ghosh, T.K.; Ramamurthy, Y.; Tathavadkar, V. Beneficiation and agglomeration process to utilize low-grade ferruginous manganese ore fines. Int. J. Miner. Process. 2011, 99, 84–86. [Google Scholar] [CrossRef]
  22. Tripathy, S.K.; Banerjee, P.K.; Suresh, N. Effect of desliming on the magnetic separation of low-grade ferruginous manganese ore. Int. J. Miner. Metall. Mater. 2015, 22, 661. [Google Scholar] [CrossRef]
  23. Sharath, K.B.; Sunil, K.T.; Veerender, S.; Raghu, K.C.; Chakraborty, D.P. Beneficiation Studies of Manganese ore Fines Using Dry Magnetic Separation; IIT-Indian School of Mines: Dhanbad, India, 2018. [Google Scholar]
  24. Liu, B.; Zhang, Y.; Lu, M.; Su, Z.; Li, G.; Jiang, T. Extraction and separation of manganese and iron from ferruginous manganese ores: A review. Miner. Eng. 2019, 131, 286–303. [Google Scholar] [CrossRef]
  25. Gao, L.; Liu, Z.; Chu, M.; Wang, R.; Wang, Z.; Feng, C. Upgrading of low-grade manganese ore based on reduction roasting and magnetic separation technique. Sep. Sci. Technol. 2019, 54, 195–206. [Google Scholar] [CrossRef]
  26. Mohapatra, B.K.; Rao, D.S.; Sahu, R.K. Characterisation and magnetic separation studies on chikla manganese ore, Maharastra. Ind. Miner. Eng. 1995, 3, 37–41. [Google Scholar]
  27. Rao, G.V.; Acharya, B.C.; Murty, B.V.R.; Mohanty, J.N.; Swamy, Y.V.; Chattopadhay, P.; Tripathy, A.K. Removal of phosphorus and enrichment of manganese from a complex ferruginous manganese ore. Magn. Electr. Sep. 1998, 9, 095128. [Google Scholar] [CrossRef]
  28. Mishra, P.; Mohapatra, B.K.; Pradeep, K.M.; Khageswar, M. Influence of microstructure on beneficiation of low-grade siliceous manganese ore from Orissa, India. J. Miner. Mater. Charact. Eng. 2013, 1, 80–84. [Google Scholar] [CrossRef] [Green Version]
  29. Mishra, P.; Mohapatra, B.; Mahanta, K. Upgradation of low-grade siliceous manganese ore from Bonai-Keonjhar Belt, Orissa, India. J. Miner. Mater. Charact. Eng. 2009, 8, 47–56. [Google Scholar] [CrossRef]
  30. Kanungo, S.B.; Mishra, S.K.; Biswal, D. Beneficiation of low-grade, high-phosphorus manganese ores of Andhra Pradesh, India, by wet high-intensity magnetic separation. Min. Met. Explor. 2000, 17, 181–185. [Google Scholar] [CrossRef]
  31. Binta, H.; Yaro, S.A.; Thomas, D.; Dodo, R. Beneficiation of low grade manganese ore from Wasagu, Kebbi State, Nigeria. J. Raw Mater. Res. Raw Mater. Res. Dev. Counc. Niger. 2016, 10, 63–73. [Google Scholar]
  32. Güven, O.; Burat, F.; Kangal, O.; Acarkan, N. Beneficiation of low-grade Turkish manganese ore. In Proceedings of the XXVI nternational Mineral Processing Congress, New Delhi, India, 24–28 September 2012. [Google Scholar]
  33. Mehdilo, A.; Irannajad, M.; Hojjati-Rad, M.R. Characterization and beneficiation of Iranian low-grade manganese ore. Physicochem. Probl. Miner. Process. 2013, 49, 725–741. [Google Scholar] [CrossRef]
  34. Wu, Y.; Shi, B.; Ge, W.; Yan, C.J.; Yang, X. Magnetic separation and magnetic properties of low-grade manganese carbonate ore. JOM 2015, 67, 361–368. [Google Scholar] [CrossRef]
  35. Mpho, M.; Samson, B.; Ayo, A. Evaluation of reduction roasting and magnetic separation for upgrading Mn/Fe ratio of fine ferromanganese. Int. J. Min. Sci. Technol. 2013, 23, 537–541. [Google Scholar] [CrossRef]
  36. Tripathy, S.K.; Suresh, N. Influence of particle size on dry high-intensity magnetic separation of paramagnetic mineral. Adv. Powder Technol. 2017, 28, 1092–1102. [Google Scholar] [CrossRef]
  37. Turkenich, A.M. A continuous barrier magnetic separator for the treatment of weakly magnetic ores. Magn. Electr. Sep. 1900, 10, 052860. [Google Scholar] [CrossRef]
  38. Svoboda, J. Magnetic Techniques for the Treatment of Materials; Kluwer Academic Publishers: New York, NY, USA, 2004; ISBN 1-4020-2038-4. [Google Scholar]
  39. Zhang, X.; Tan, X.; Yi, Y.; Liu, W.; Li, C. Recovery of manganese ore tailings by high-gradient magnetic separation and hydrometallurgical method. JOM 2017, 69, 2352–2357. [Google Scholar] [CrossRef]
  40. Supriya, R. Ancient manganese deposits. In Handbook of Strata-Bound and Stratiform Ore Deposits; Elsevier Scientific Publishing Company: Amsterdam, The Netherlands, 1976. [Google Scholar]
  41. Mishra, P.; Mvohapatra, B.K.; Singh, P.P. Mode of occurrence and characteristics of Mn-ore bodies in iron ore group of rocks, NORTH Orissa, India and its significance in resource evaluation. Resour. Geol. 2006, 56, 55–64. [Google Scholar] [CrossRef]
  42. Devasahayam, S. Predicting the liberation of sulfide minerals using the breakage distribution function. Miner. Process. Extr. Metall. Rev. 2015, 36, 136–144. [Google Scholar] [CrossRef]
  43. Tripathy, S.K.; Singh, V.; Murthy, Y.R.; Banerjee, P.K.; Suresh, N. Influence of process parameters of dry high intensity magnetic separators on separation of hematite. Int. J. Miner. Process. 2017, 160, 16–31. [Google Scholar] [CrossRef]
  44. Tripathy, S.K.; Murthy, Y.R.; Singh, V.; Suresh, N. Processing of ferruginous chromite ore by dry high- intensity magnetic separation. Miner. Process. Extr. Metall. Rev. 2016, 37, 196–210. [Google Scholar] [CrossRef]
  45. Singh, V.; Biswas, A. Physicochemical processing of low grade ferruginous manganese ores. Int. J. Miner. Process. 2017, 158, 35–44. [Google Scholar] [CrossRef]
Figure 1. Geological setting of the area under study [37].
Minerals 11 00150 g001
Figure 2. Schematic of rare earth roll magnetic separator.
Minerals 11 00150 g002
Figure 3. Particle size distribution of as-received manganese fines (samples 1 and 2).
Minerals 11 00150 g003
Figure 4. XRD diffractogram of the as-received manganese ore ((a). Sample 1, and (b) sample 2).
Minerals 11 00150 g004
Figure 5. Size-wise mineral grain distribution for manganese fines derived from the liberation data ((a) Sample 1 and (b) Sample 2).
Minerals 11 00150 g005aMinerals 11 00150 g005b
Figure 6. Theoretical grade recovery curves for Mn bearing minerals and Iron bearing minerals for sample 1 (a), and sample 2 (b).
Minerals 11 00150 g006
Figure 7. Grain mapping of manganese ore (for sample 1) based on MLA.
Minerals 11 00150 g007
Figure 8. Grain mapping of manganese ore (for sample 2) based on MLA.
Minerals 11 00150 g008
Figure 9. Response surface plots depicting the effect of (a) roll speed and feed rate, and (b) feed rate and splitter position on recovery for sample 1.
Minerals 11 00150 g009aMinerals 11 00150 g009b
Figure 10. Optimization results for sample 1 (a) and sample 2 (b) indicating the optimized range.
Minerals 11 00150 g010aMinerals 11 00150 g010b
Figure 11. (a) Comparison of XRD diffractogram of feed and product of sample 1; (b) Comparison of XRD diffractogram of feed and product of sample 2.
Minerals 11 00150 g011
Figure 12. Comparison of the modal mineralogy data to ascertain the separation.
Minerals 11 00150 g012
Figure 13. Mineral phase recoveries of the product.
Minerals 11 00150 g013
Table 1. Magnetic susceptibilities of manganese minerals and their associated major gangue bearing minerals [16].
Mineral NameElemental CompositionDensity
(Kg/m3)
Specific Magnetic Susceptibility
(10−8 m3/Kg)
Relative Magnetism
Major manganese minerals
Birnessite(NaO0.3CaO0.1KO0.1) (Mn, Fe)2O4 1.5H2O310P
Bixbyite(Mn, Fe)2O35.120.0002P
Braunite3(Mn, Fe)2O3·MnSiO34.720.01P
CryptomeleneKMn8O164.110.004P
Hausmanite(Mn, Fe)3O44.760.006P
JacobsiteMnFe2O44.99500F
ManganiteMnO·OH4.380.003P
PsilomelaneBaMn8O16(OH)45.140.004P
PyrolusiteMnO24.730.004P
RhodochrositeMnCO33.69100P
Todorokite(Na, Ca, K, Ba, Sr) (Mn, Mg, Al)6O123H2O3.660.003P
Major gangue bearing minerals
AluminaAl2O33.95−0.04d
CalciteCaCO32.83−0.3–1.4d/p
GoethiteFeO·OH4.2726–280F
HematiteFe2O35.2610–760F
KaoliniteAl2(Si2O5) (OH)42.65−2d
LimoniteFeO·OH nH2O4.266–74P
QuartzSiO22.65−0.5–0.6D
(Legend: p—paramagnetic, d—diamagnetic, f—ferromagnetic).
Table 2. Summary of prior research on magnetic separation of different manganese ores.
Ore Deposit NameOre TypeDry/WetType of SeparatorProcess ConditionFeed QualityProduct Quality and PerformanceReferences
Chikla, Maharastra IndiaSiliceousDWHIMSMfi:1.2–1.8 teslaMn:44% Fe: 7.8%,Mn: 51%, Mn recovery: 95%[18,19]
Bonai-Keonjhar, Odisha, IndiaSiliceousDDBMSMfi: 0.73–1.2 teslaMn: 26%, SiO2: 32–34%,
Fe: 2.98–7.7%
Mn: 49%, Mn Recovery: 69%[20]
Bonai-Keonjhar, Odisha, IndiaSiliceousWWHIMSMfi: 0.73–1.2 teslaMn: 25%, SiO2: 34%, Fe: 3–8%Mn: 42%, Mn recovery: 56%[21]
Garividi-Garnham, Andraparadesh, IndiaSiliceousWWHIMSMfi:1.3–1.75 tesla, Size −200 µmMn: 26.71%, SiO2: 18.3%, Fe: 12.2%Mn: 33.71, Mn Recovery: ~52.74–80.94%[22]
Wasagu, Kebbi, Nigeria-DDBMSSize 80 % passing −355 + 250 μm,Mn: 38%Mn: 52%, Mn Recovery: 77%[23]
Kilis region, TurkeySiliceousDIRMSSize: −9 + 2 mmMn: 13.8%, SiO2: 70.59%, Fe: 0.98Mn: 49.51%, Mn recovery: 68.5%[24]
Charagah, Tabriz, IranCalciticWWHIMSMfi: 1.2 to 1.7 tesla,Mn: 15.4%, SiO2: 3%, CaO: 46%Mn: 44%, Mn Recovery: 52.2%[25]
Xialei, Guangxi, ChinaSiliceousWHGMSMfi: 1.25 teslaMn: 21.53%, SiO2: 33.47%, Fe: 8.87%Mn: 30%, Mn recovery; 64%[26]
Marganetzk, RussiaSiliceousWIRMSMfi: 0.85 tesla, −10 + 6 mmMn: 33.1%, SiO2: 31.9%Mn: 42.3%, Mn recovery: 97.6%[27]
Eskişehir, TurkeySiliceousDRERMSMfi: 0.9 teslaMn: 41.12%, SiO2: 36.4%, Fe: 3.75Mn: 46.7%, Mn recovery: 69.2%[13]
Joda, Odisha, IndiaFerruginousDIRMSMfi: 0.7–1.9 tesla, −3 mmMn: 32.4%, SiO2: 20.7%, Mn: Fe: 2.3Mn: 42%, Mn recovery: 47–49%[28]
Joda, Odisha, IndiaFerruginousDIRMSMfi: 0.9–1.6 tesla,Mn: 22.4%, SiO2: 35.9%, Fe: 14.5%Mn: 27%,[29]
Hunan province, ChinaCarbonateDHIMSMfi: 0.3–1.6 teslaMn: 10%, SiO2: 39.07%, Fe: 2%Mn: 25.4%, Mn recovery: 55.6%[30]
Northern Cape, South AfricaFerruginousDIRMSMfi: 1.1–1.6 teslaMn: 29.8%, Fe: 19.22, Mn: Fe: 1.55Mn: 29.7%, Mn recovery: 59.9%[31]
(Legend: D—dry, W—wet, WHIMS—wet high-intensity magnetic separator, DBMS—dry belt magnetic separator, IRMS—induces magnetic roll separator, HGMS—high gradient magnetic separator, RERMS—rare earth roll magnetic separator, HIMS—high-intensity magnetic separator, Mfi—magnetic field intensity).
Table 3. Actual and coded levels considered for the design of experiments.
ParametersCoded LevelsActual Levels
Roll speed (rpm)10−1195165132
Feed rate (tph/m)10−11.10.430.11
Splitter position (deg)10−145°90°135°
Table 4. Elemental analysis of samples 1 and 2.
SampleAssay Value (%)
MnFeSiO2Al2O3PK2OMgOCaOTiO2%SLOIMn:Fe Ratio
Sample 127.3324.625.557.850.0970.760.433.310.820.012.781.11
Sample 226.6625.394.3410.450.090.210.211.20.230.075.871.05
(LOI: Loss on ignition at 850 °C).
Table 5. Modal mineralogy of the manganese fines analyzed by mineral liberation analysis (MLA).
Mineral Weight Fraction (%)
Chemical FormulaSample 1Sample 2
Cryptomelene(K(Mn4+, Mn2+)8O1611.413.8
Bixybyite(Mn, Fe)2O312.313.2
HematiteFe2O316.816.4
GoethiteFeO·OH29.018.9
GangueAl-silicates5.75.5
PyrolusiteMnO24.15.5
Mn-Al PhaseMn spinel’s1.50.1
QuartzSiO20.30.7
PsilomelaneBaMn8O16(OH)40.91.2
Others 11.413.8
(Average standard deviation δ = 1.3).
Table 6. Magnetic separation results for sample 1 (with single-stage separation). The bold values indicate the highest values that were achieved in the respective results.
TestProcess ParametersSample 1Sample 2
Roll Speed
(rpm)
Feed Rate
(tph/mtr)
Splitter Position
(deg)
Mn Grade (%)Mn Recovery (%)Mn: Fe RatioMn Grade (%)Mn Recovery (%)Mn: Fe Ratio
11320.119034.1847.61.5232.352.91.43
21950.119031.7181.81.430.580.71.32
31321.19036.3643.21.9130.045.71.23
41951.19033.372.01.5628.672.51.17
51320.434535.1344.71.7933.844.21.66
61950.43−4531.4171.11.4327.671.01.2
71320.4313533.8238.41.6631.440.81.72
81950.4313532.5472.11.5227.571.21.35
91650.114532.5764.61.5129.667.91.46
101651.14533.5662.11.5829.659.41.48
111650.1113535.5269.21.7730.164.51.46
121651.113534.1460.11.6730.061.51.39
131650.439034.1761.81.6830.665.51.44
141650.439033.8160.91.6129.164.11.39
151650.439034.9162.21.7131.165.81.49
Table 7. Significance parameters affecting individual response, along with the order of significance.
SampleSample 1Sample 2
ResponsePrimary EffectBinary Interactive EffectTernary Interactive EffectPrimary Effect
Grade (%)RS > FR--RS
Recovery (%)RSRS × SP > FR × SPRS × FR × SPRS
Mn: Fe ratioRS > FR--RS
(Legend: RS—Rolls speed, FR—Feed rate, SP—Splitter position).
Table 8. Summary of the results of non-magnetic fraction after re-treatment (for sample 1).
Single-Stage SeparationNon-Magnetic Fraction Recleaning
Sample 1 Non-magnetic cleaningTest No.Mn Grade (%)Mn: Fe
Ratio
Yield (%)Mn Recovery (%)Mn Grade (%)Mn: Fe
Ratio
Yield (%)Mn Recovery (%)
Exp 231.711.471.48234.921.692936
Exp 433.31.5660.17136.81.82027
Exp 832.541.52727233.651.873644
Table 9. Summary of magnetic fraction re-treatment of tests 3, 5, and 7.
Roll 1Roll 2
Sample 2 Non-magnetic cleaning Mn Grade (%)Mn: FeYield (%)Mn Recovery (%)Mn Grade (%)Mn: FeYield (%)Mn Recovery (%)
Exp 330.011.2340.94629.981.244249
Exp 533.751.66364432.521.5950.160
Exp 731.371.7133.74129.631.436574
Publisher’s Note: MDPI stays neutral with regard to jurisdictional claims in published maps and institutional affiliations.

