
Past and Trends in Cough Sound Acquisition, Automatic Detection and Automatic Classification: A Comparative Review


Abstract
:1. Introduction
2. Background
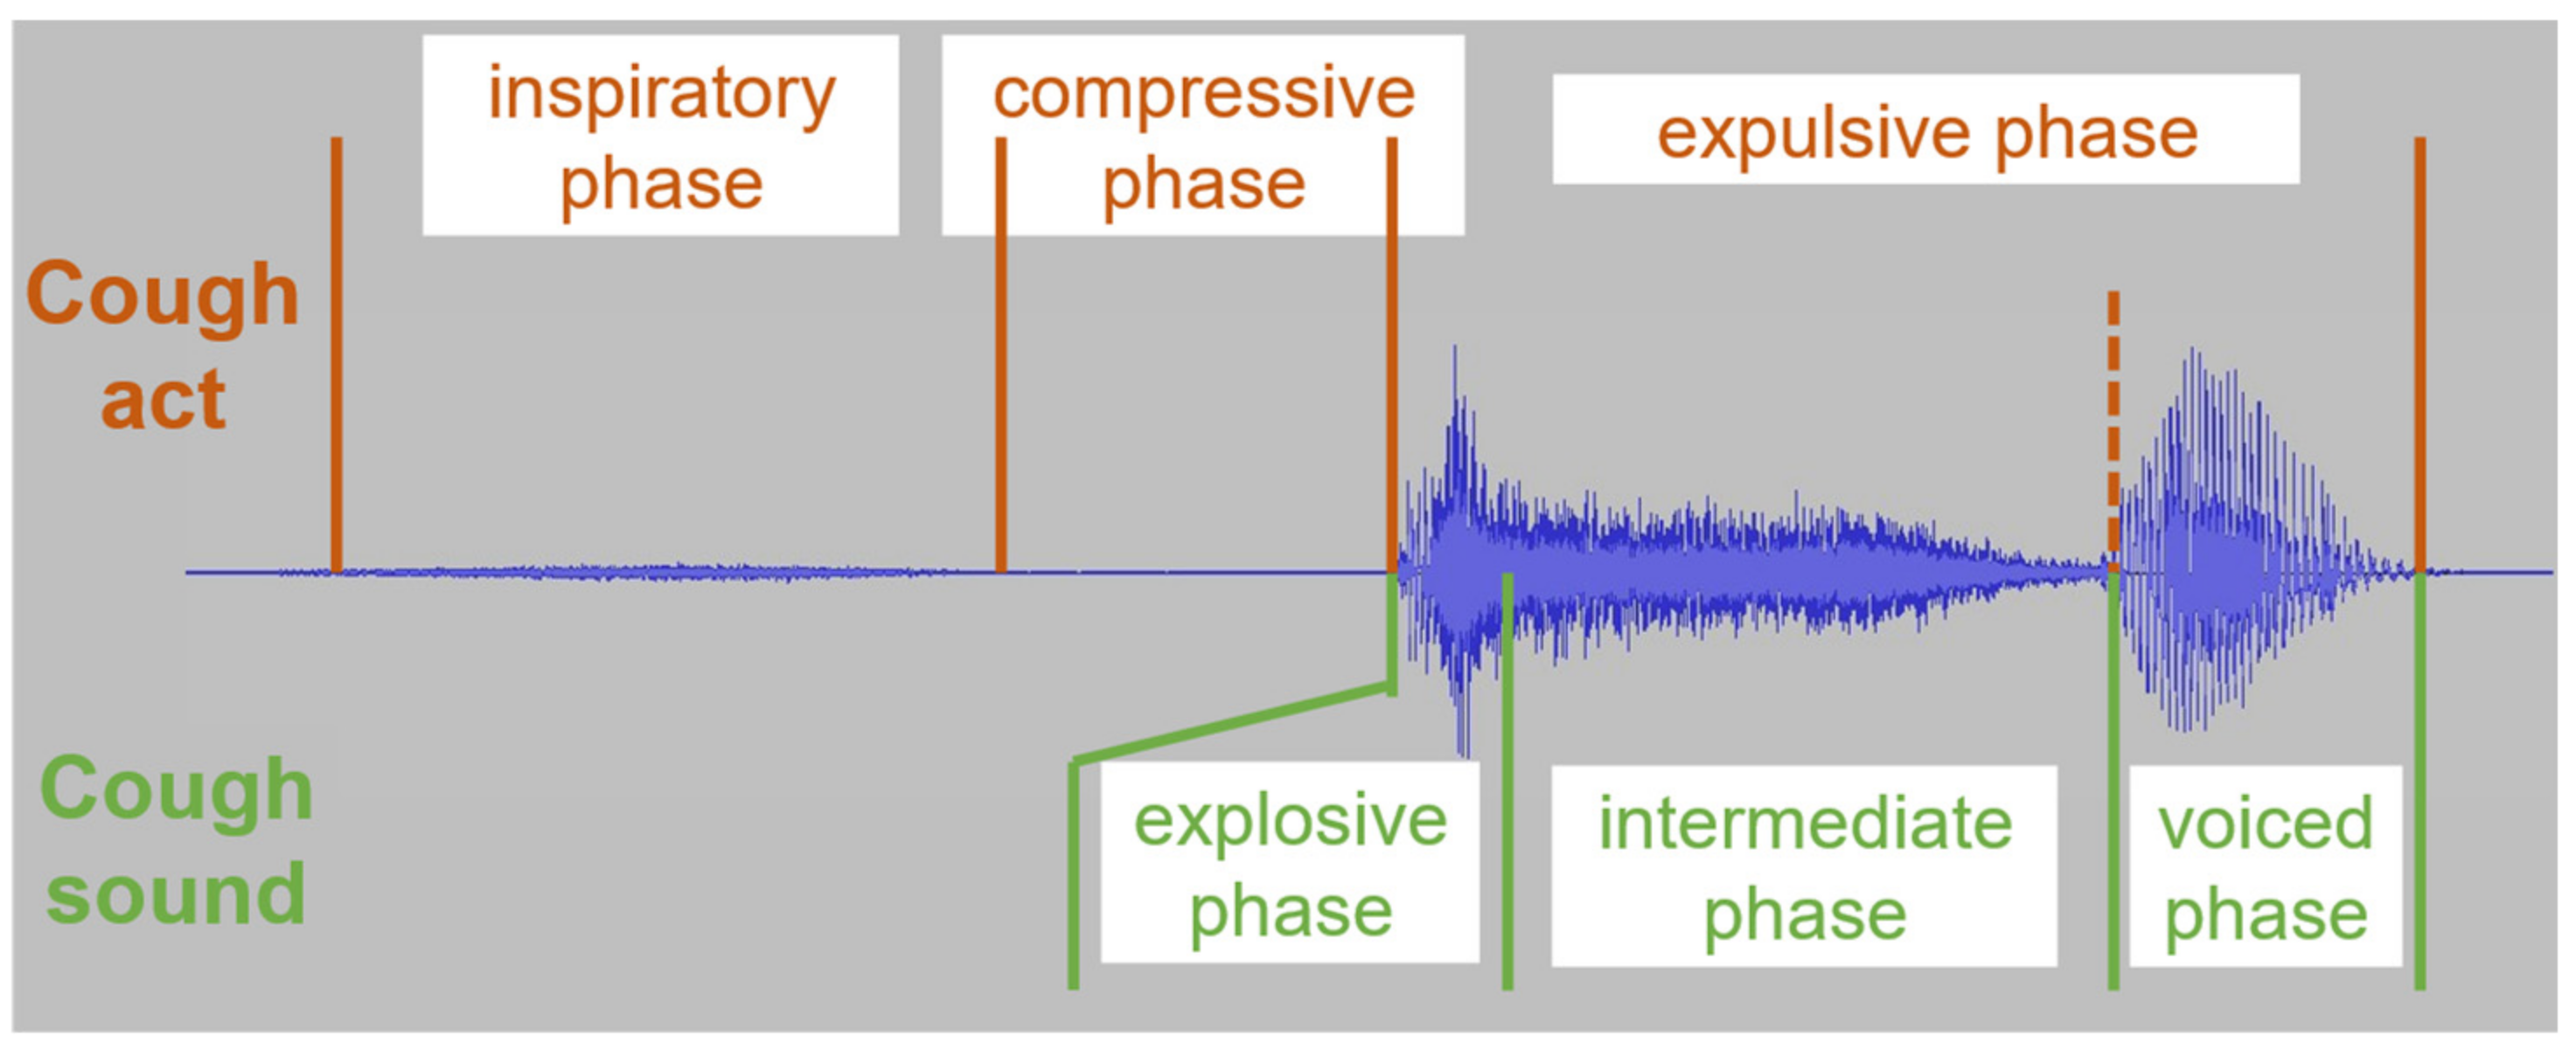
2.1. Cough Physiology and Acoustic Properties
2.2. Detection vs. Classification
3. Method
4. Results
4.1. Referenced Studies
4.1.1. Cough Classification Studies
4.1.2. Cough Detection Studies

| Motivation | References | Number |
|---|---|---|
| Objective monitoring | [17,22,28,74,75,76,78,80,88,133,140,141,142,143,144,145,146,147,148,149,150,151,152,153,154,155,156,157,158,159,160,161,162,163] | 34 |
| Remote/self/lab-free monitoring | [119,120,121,122,123,124,125,126,127,128,129,130,131,134,135,138,164,165,166,167,168,169,170,171,172] | 25 |
| Disease assessment | [14,27,69,73,132,137,139,173,174,175,176,177,178,179,180,181,182] | 17 |
| Disease diagnosis | [49,54,83,84,85,86,87,183,184,185] | 10 |
| Methodology | [68,77,136,186,187] | 5 |
4.1.3. Other Studies
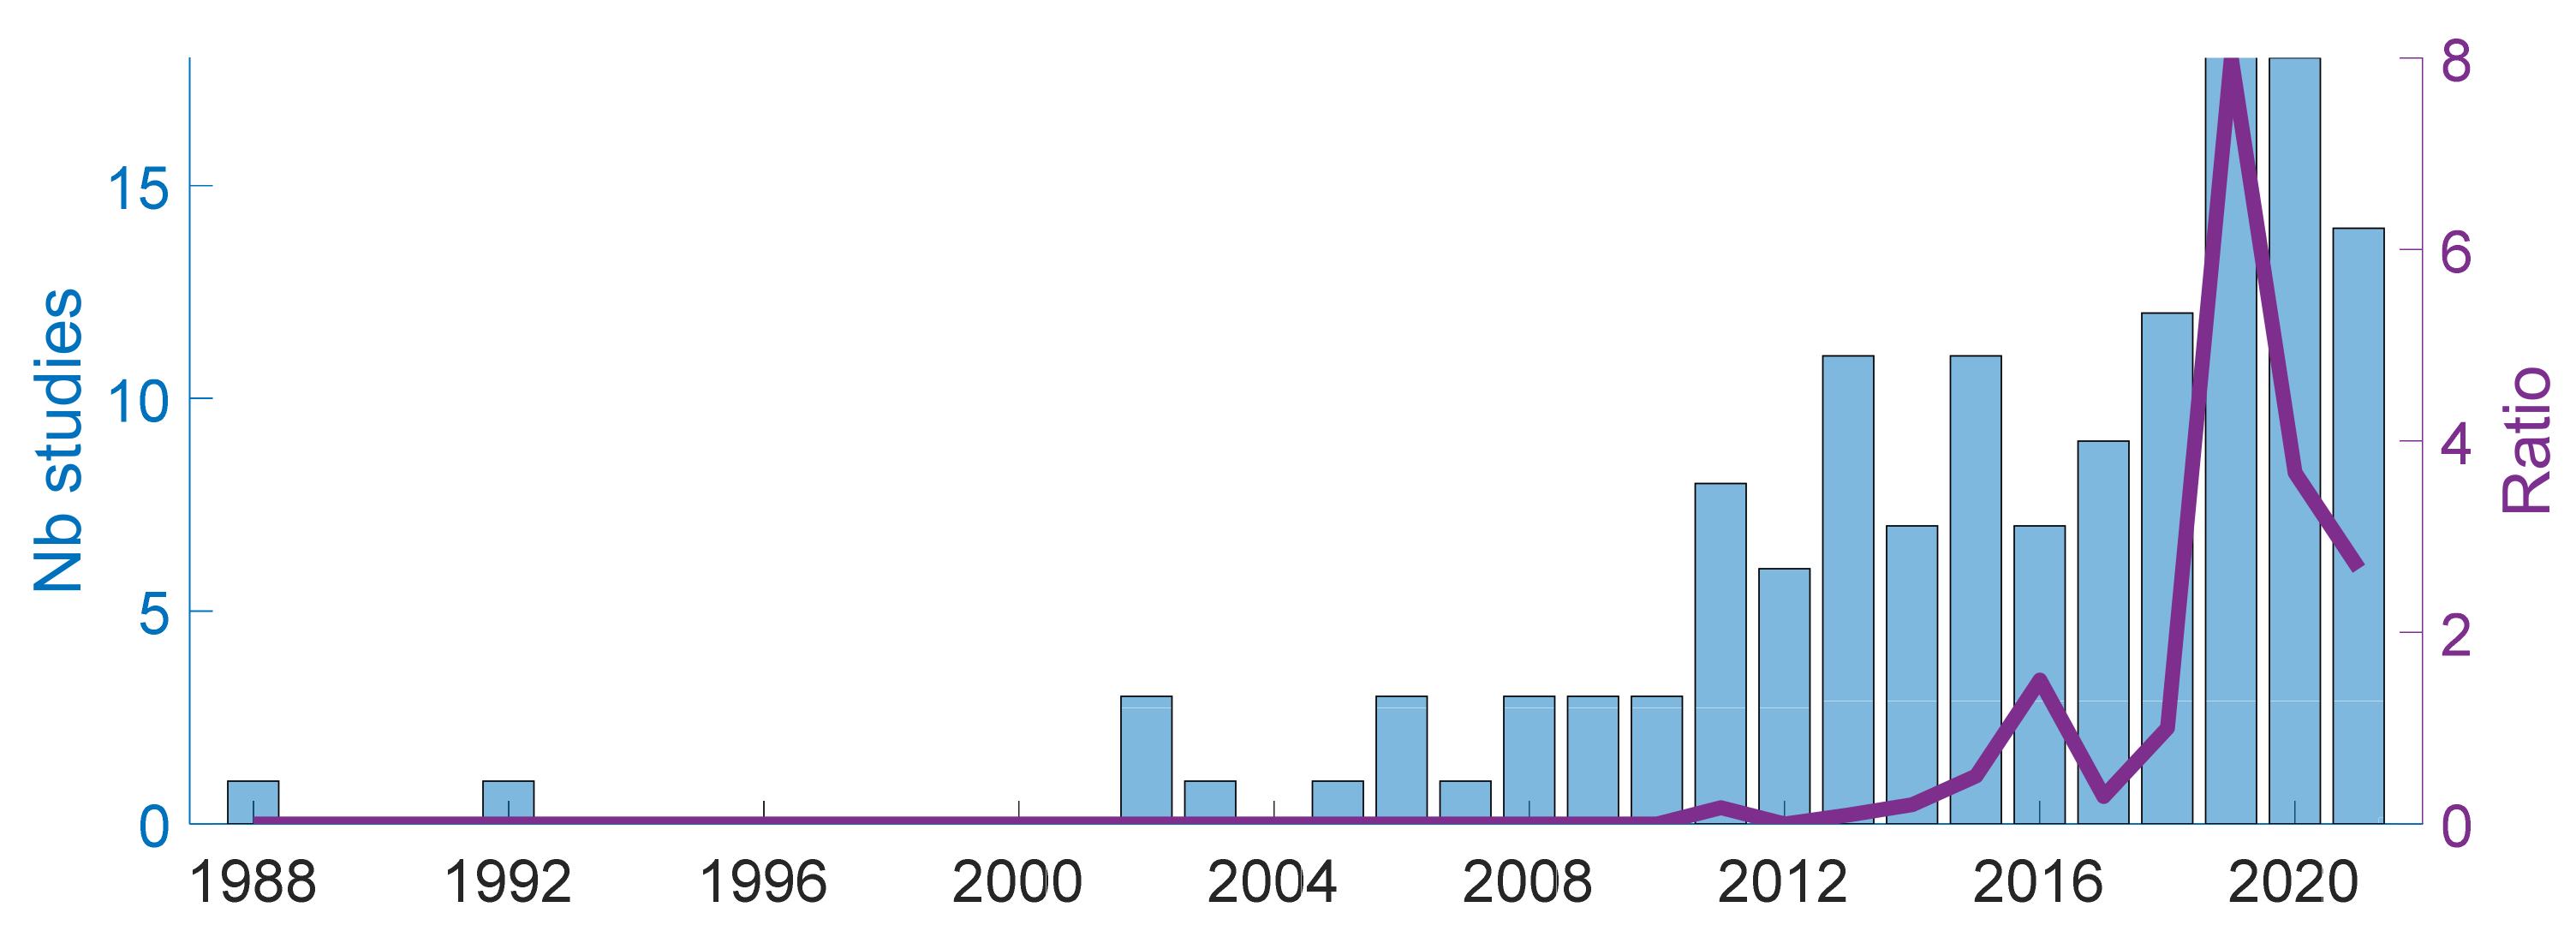
4.1.4. Publication Years
4.2. Data and Subjects
4.2.1. Sensors and Acquisition Systems
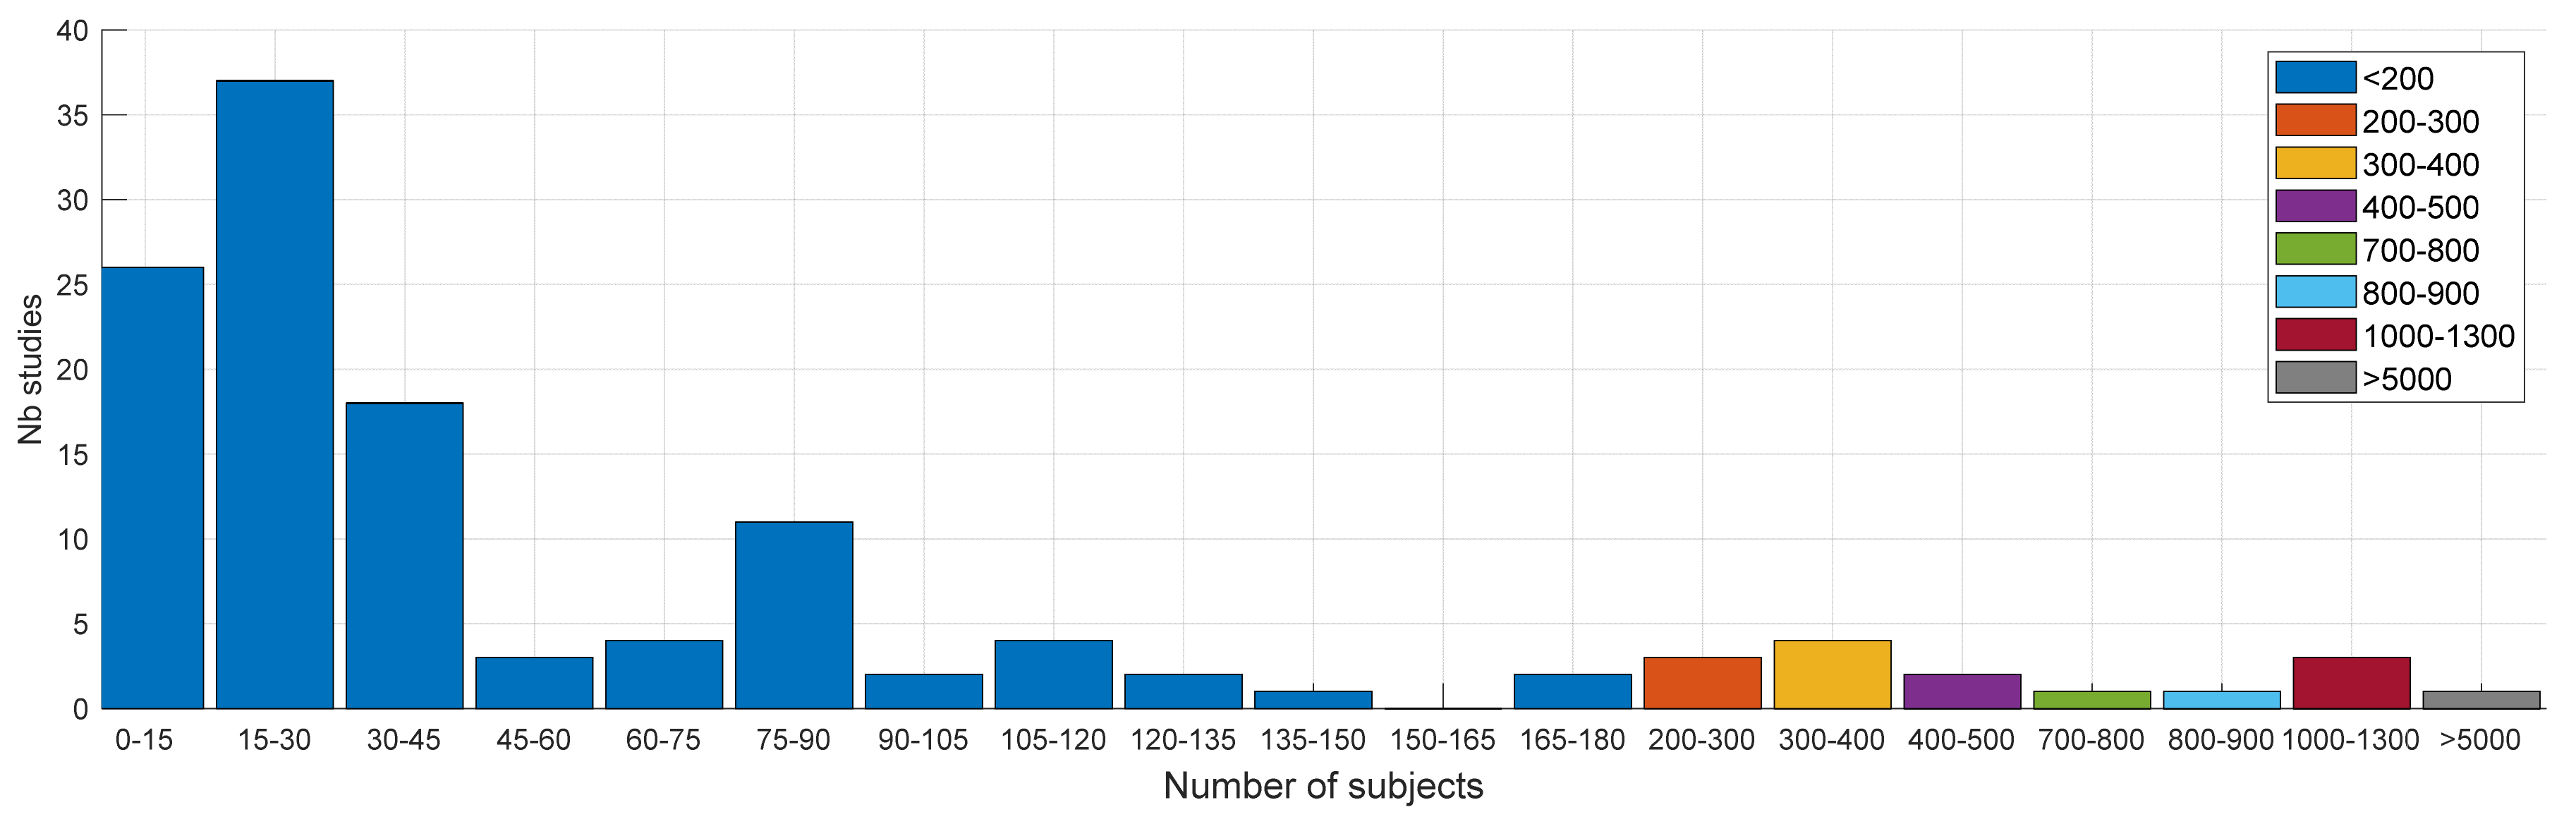
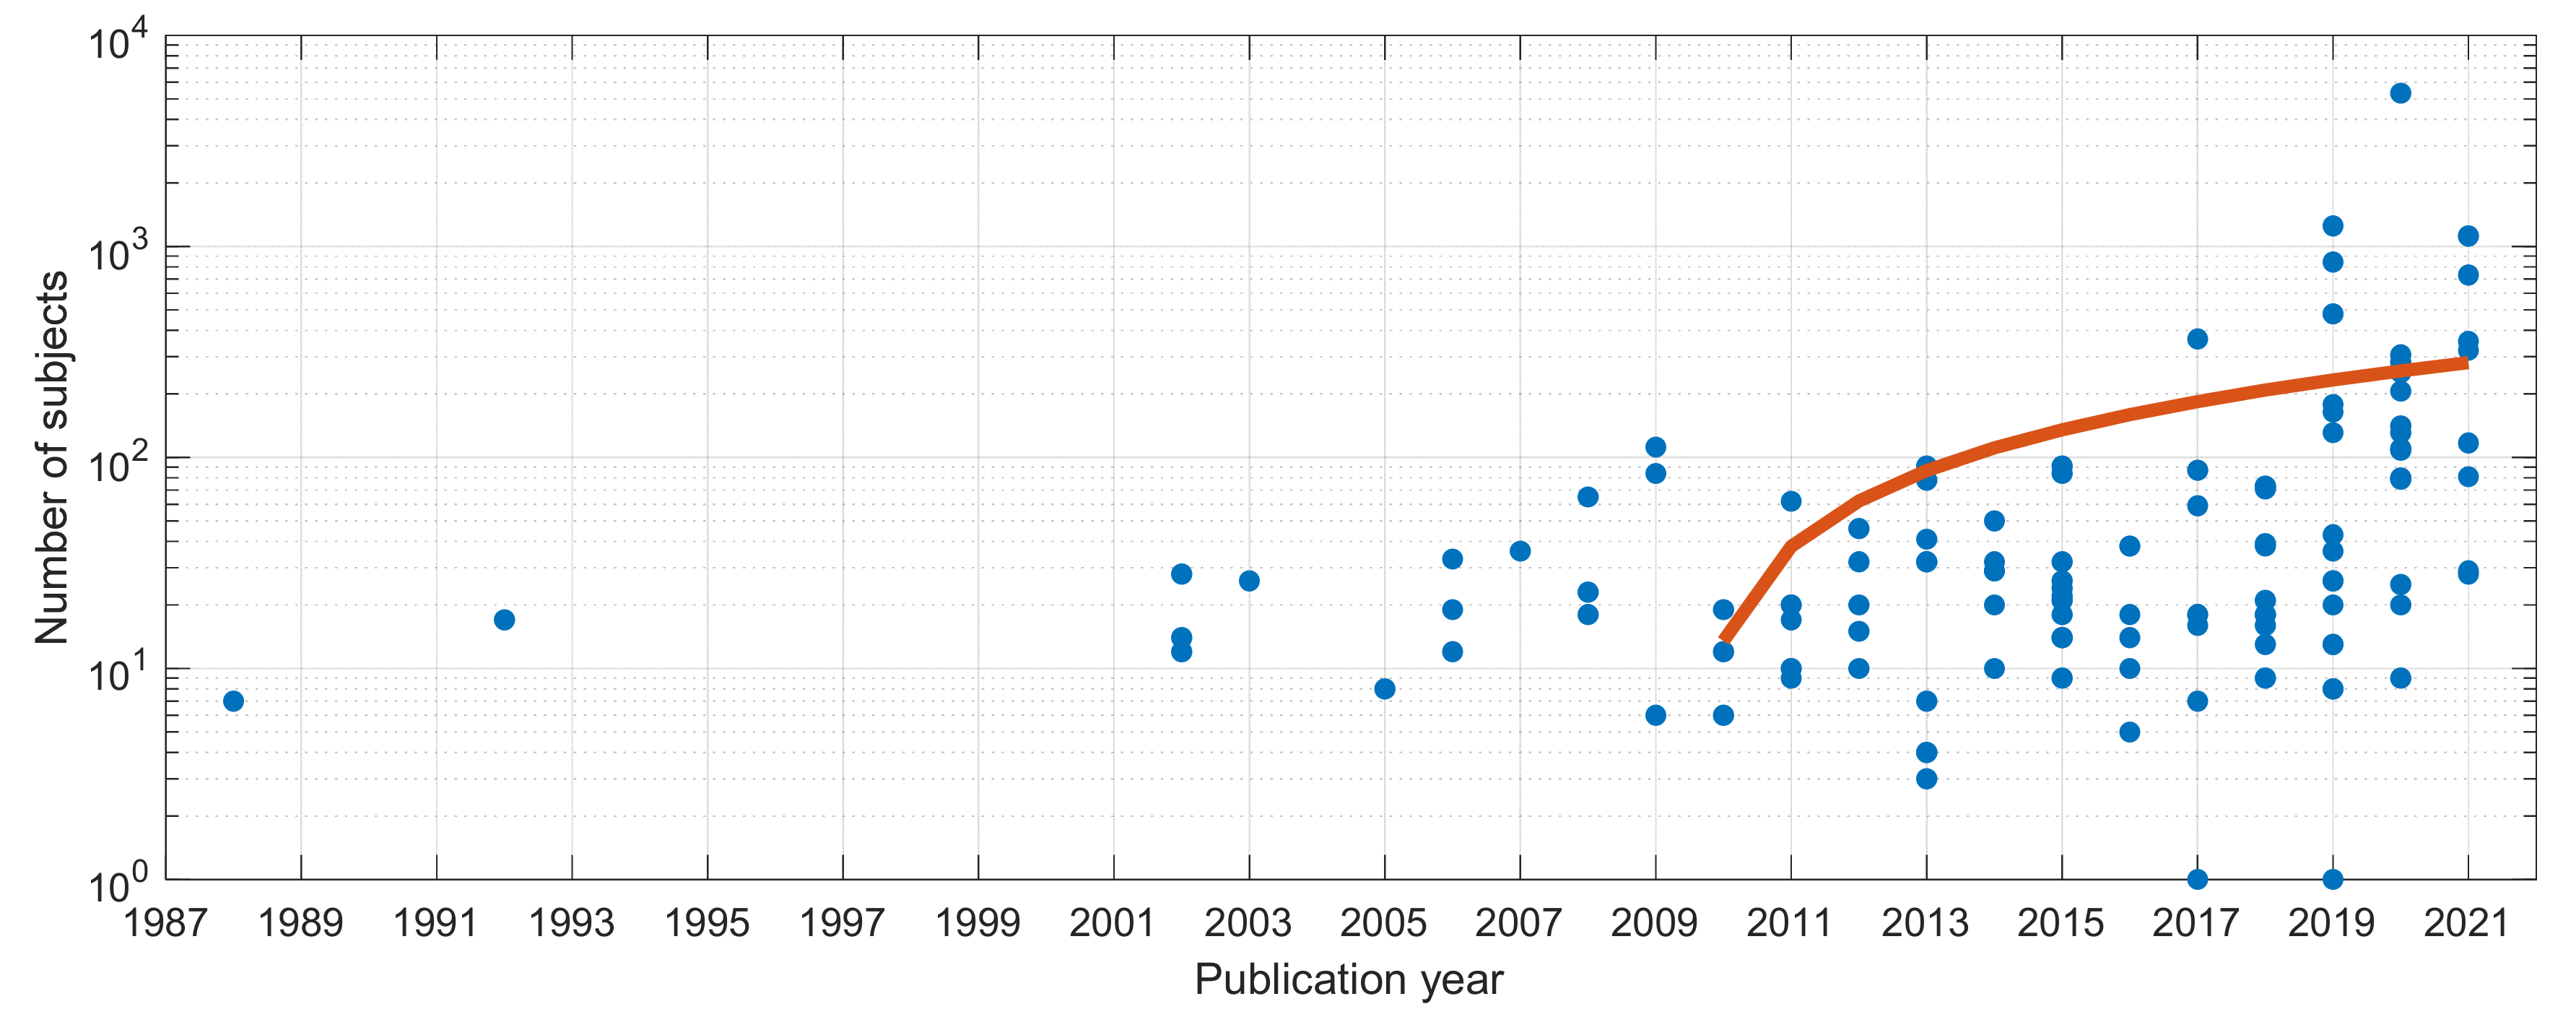
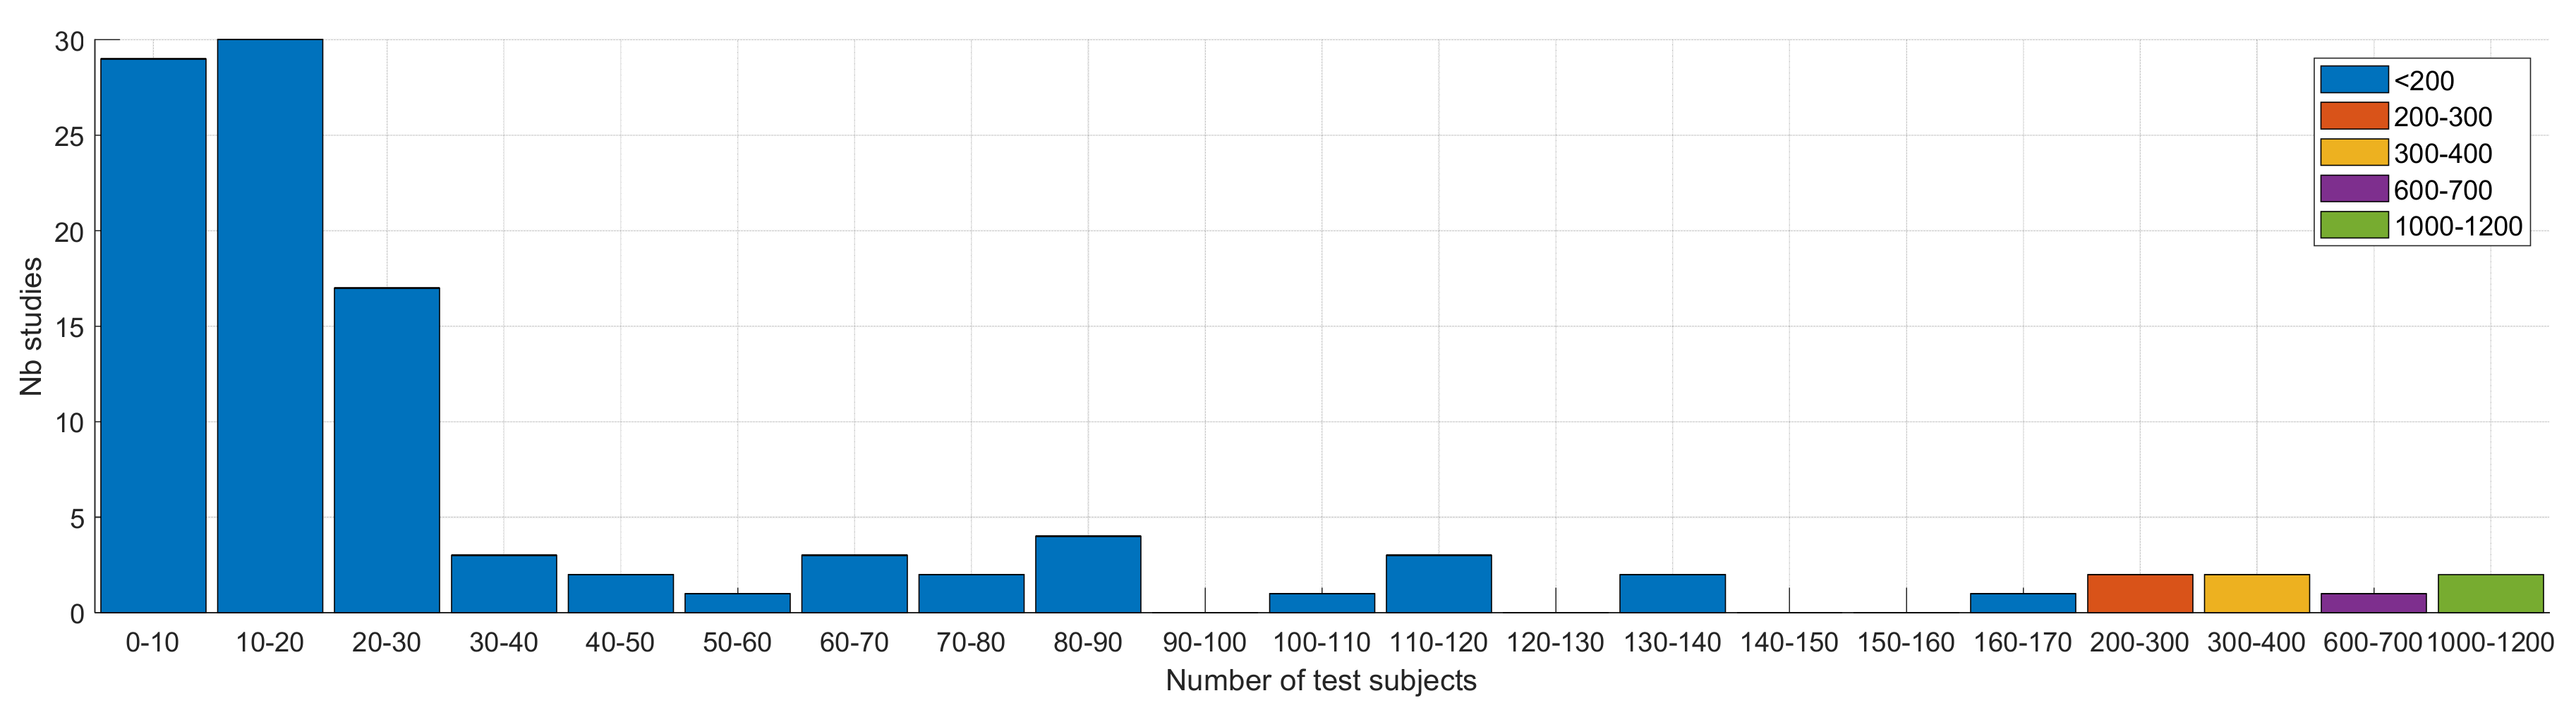
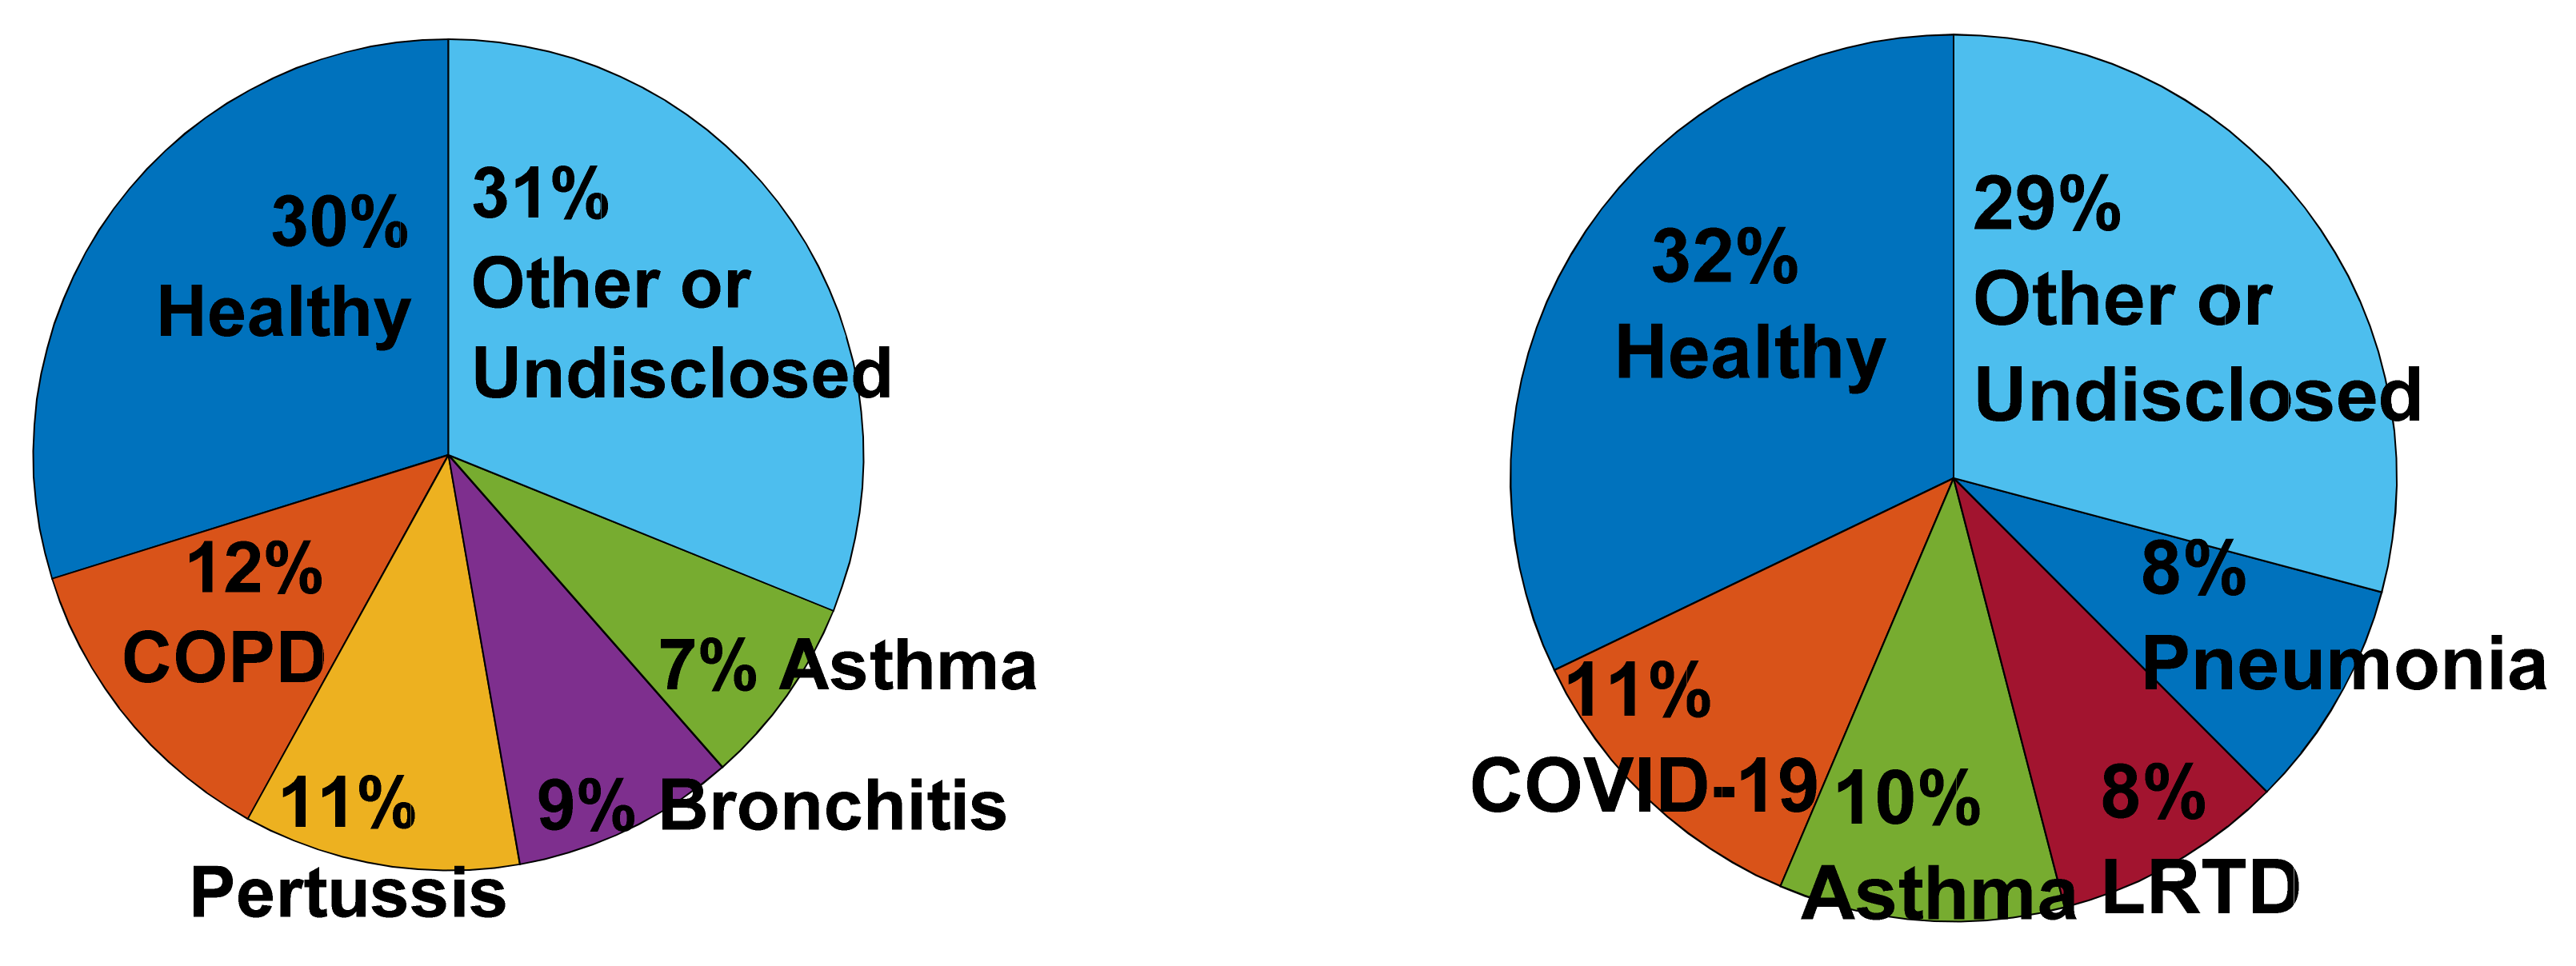
4.2.2. Subjects and Protocol
4.3. Methods
4.3.1. Approach
4.3.2. Features
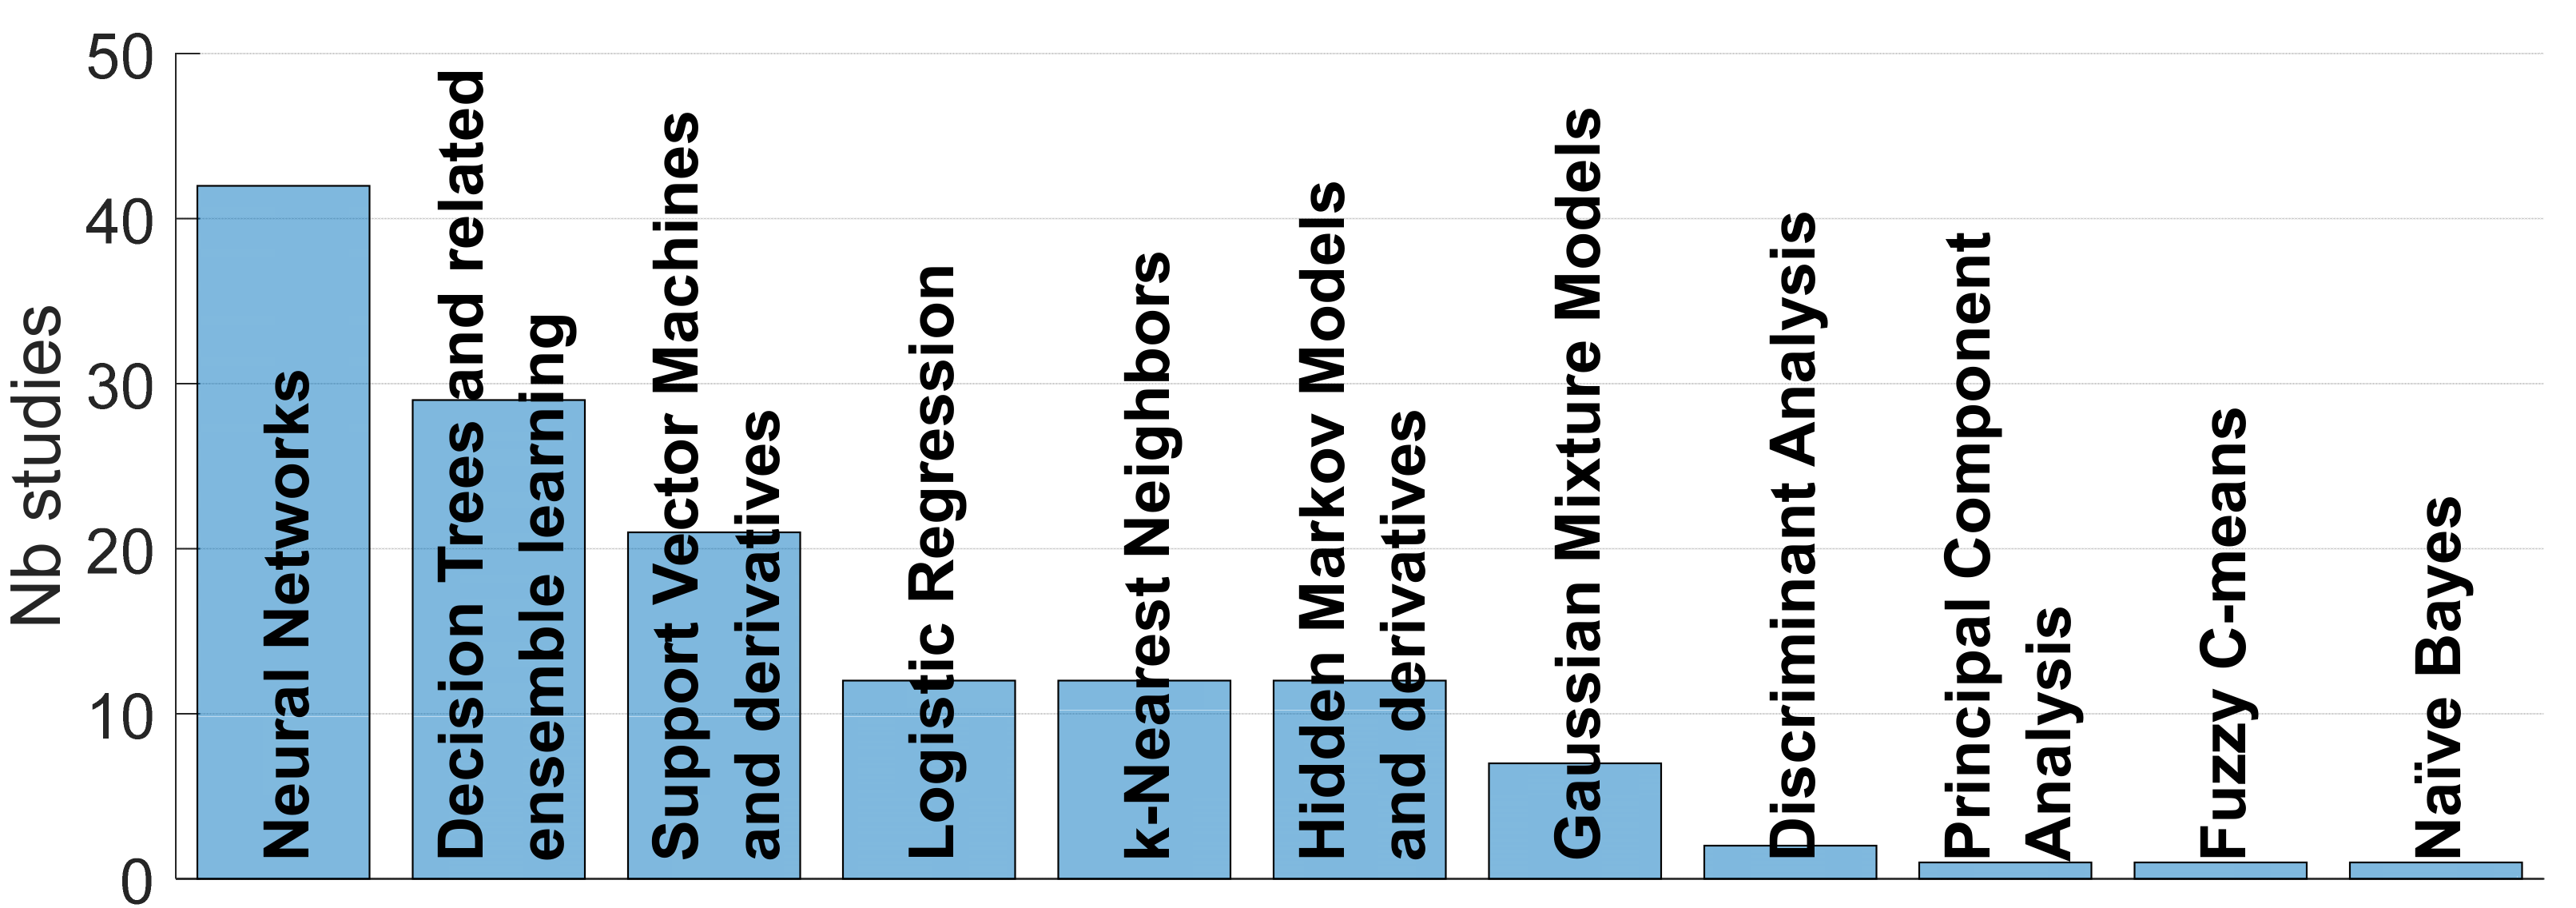
4.3.3. Classifiers
4.4. Validation
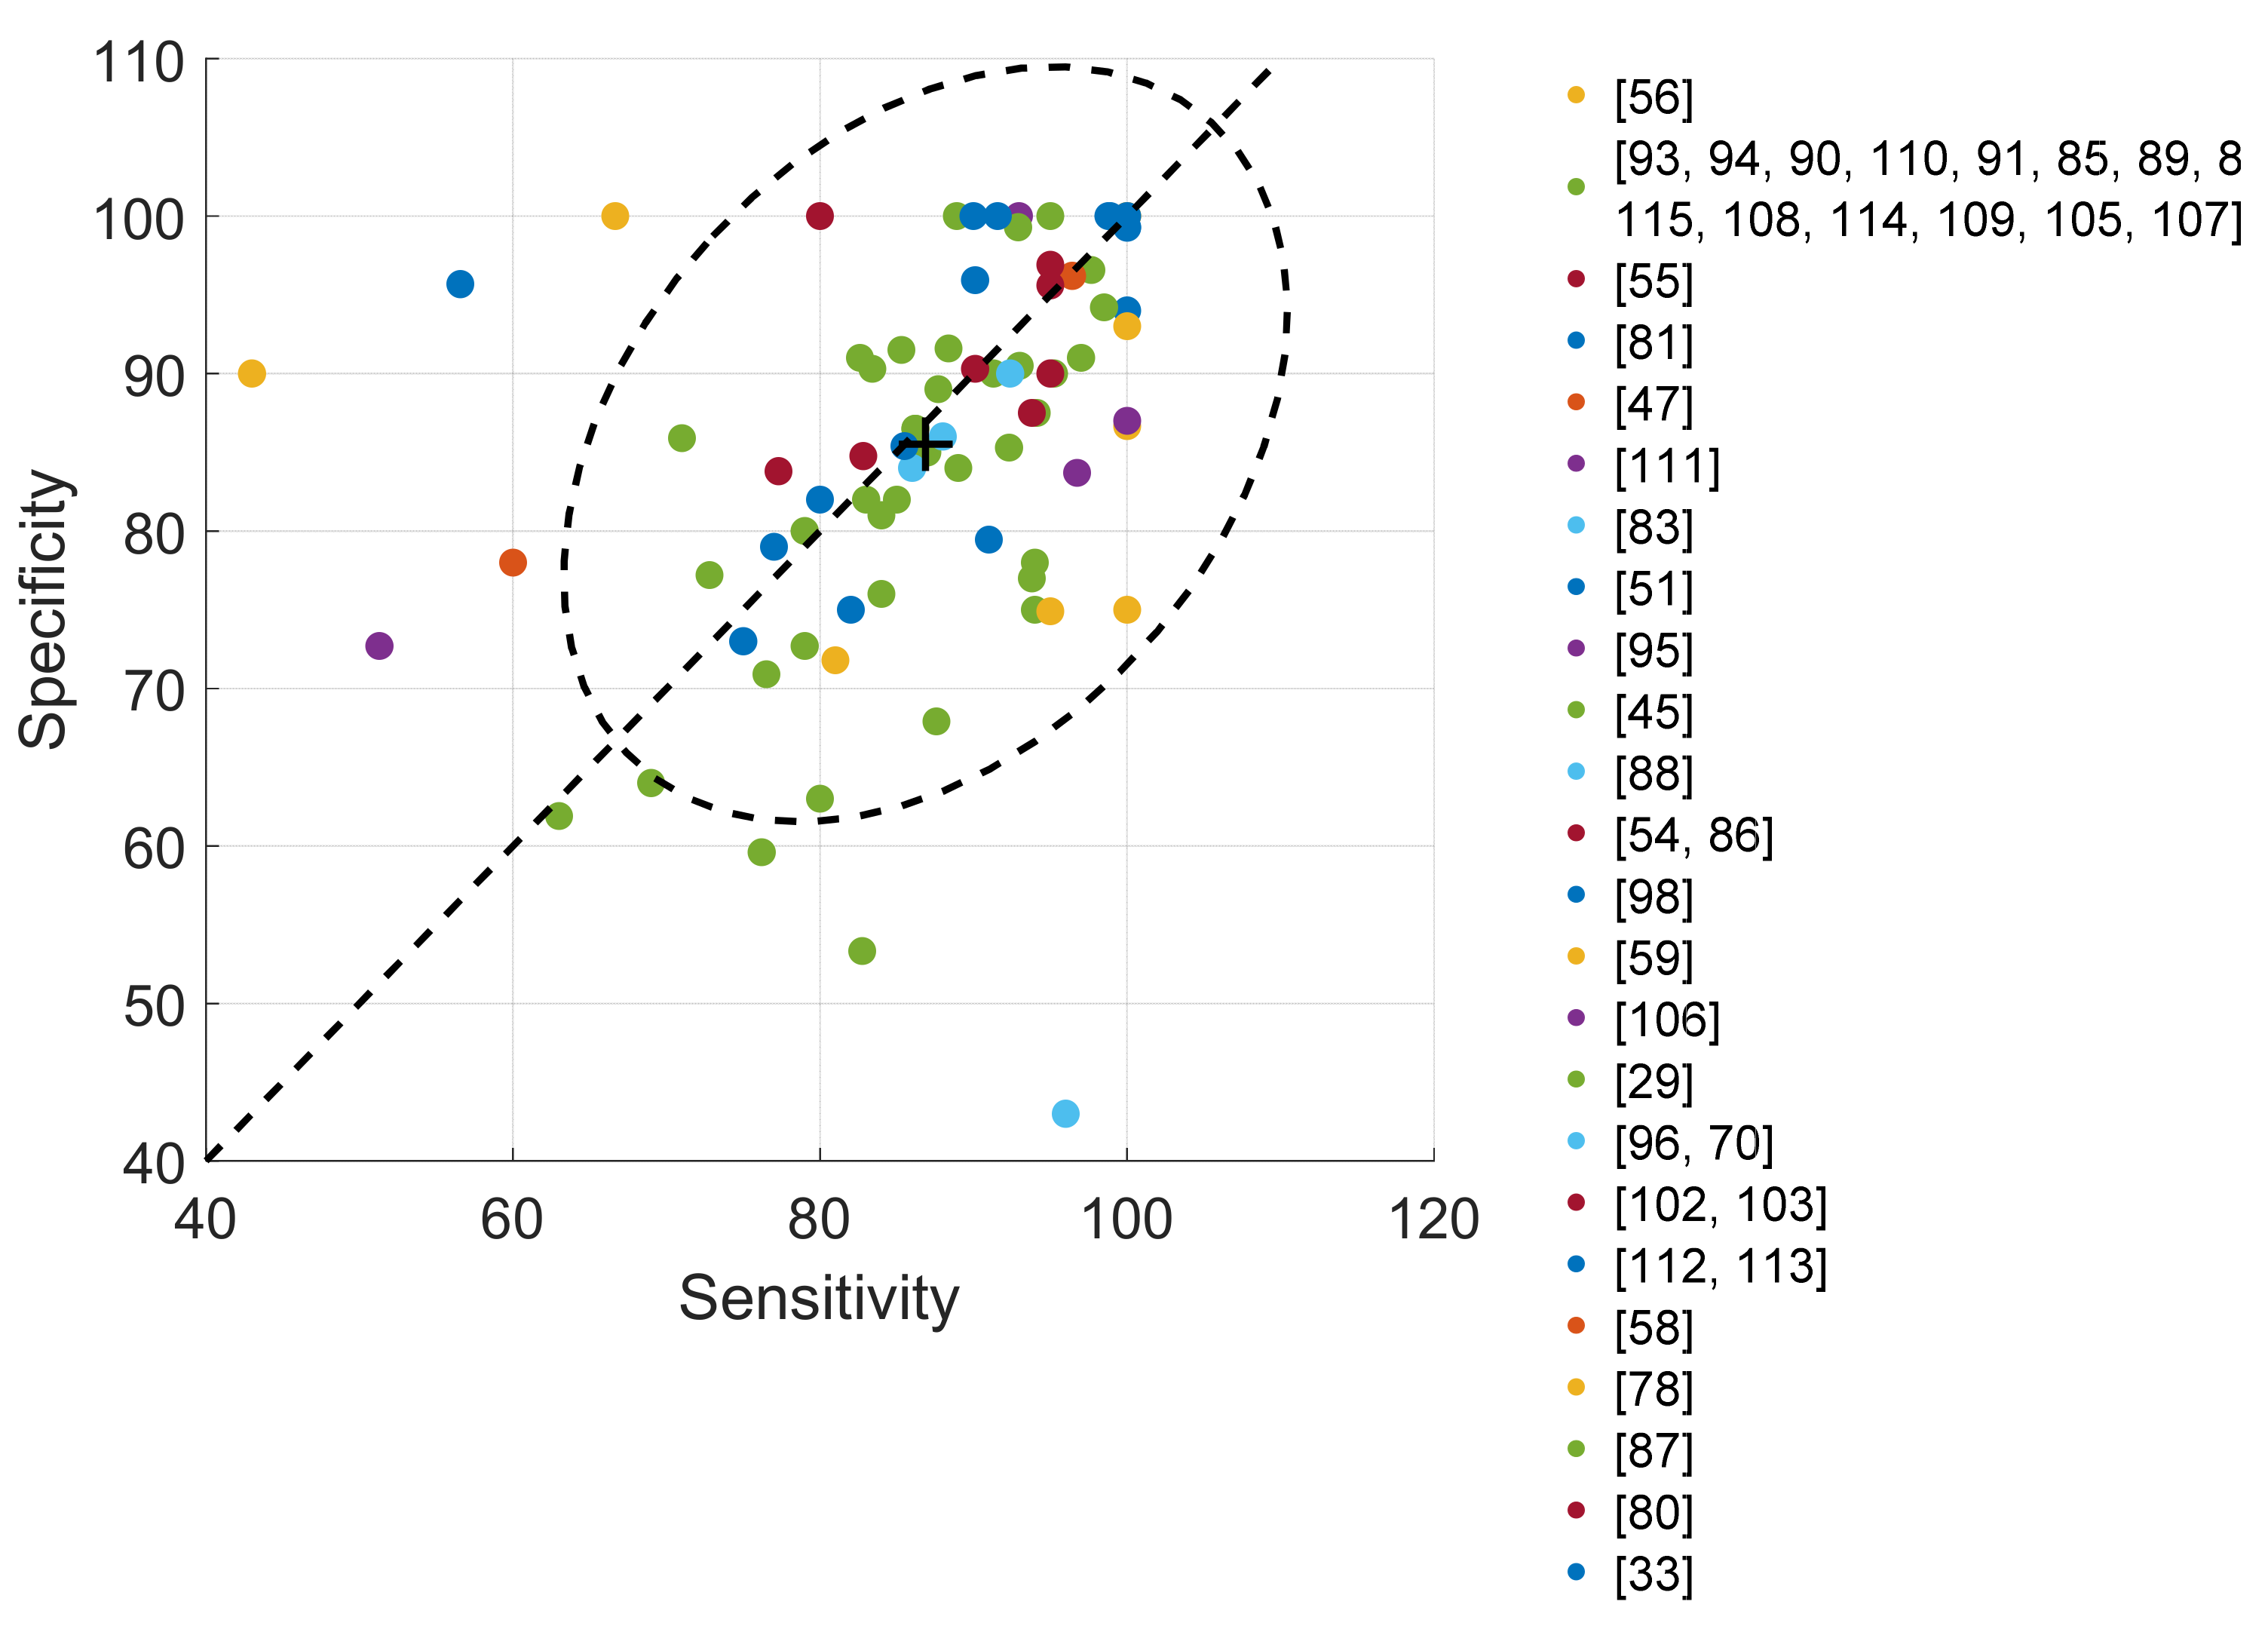
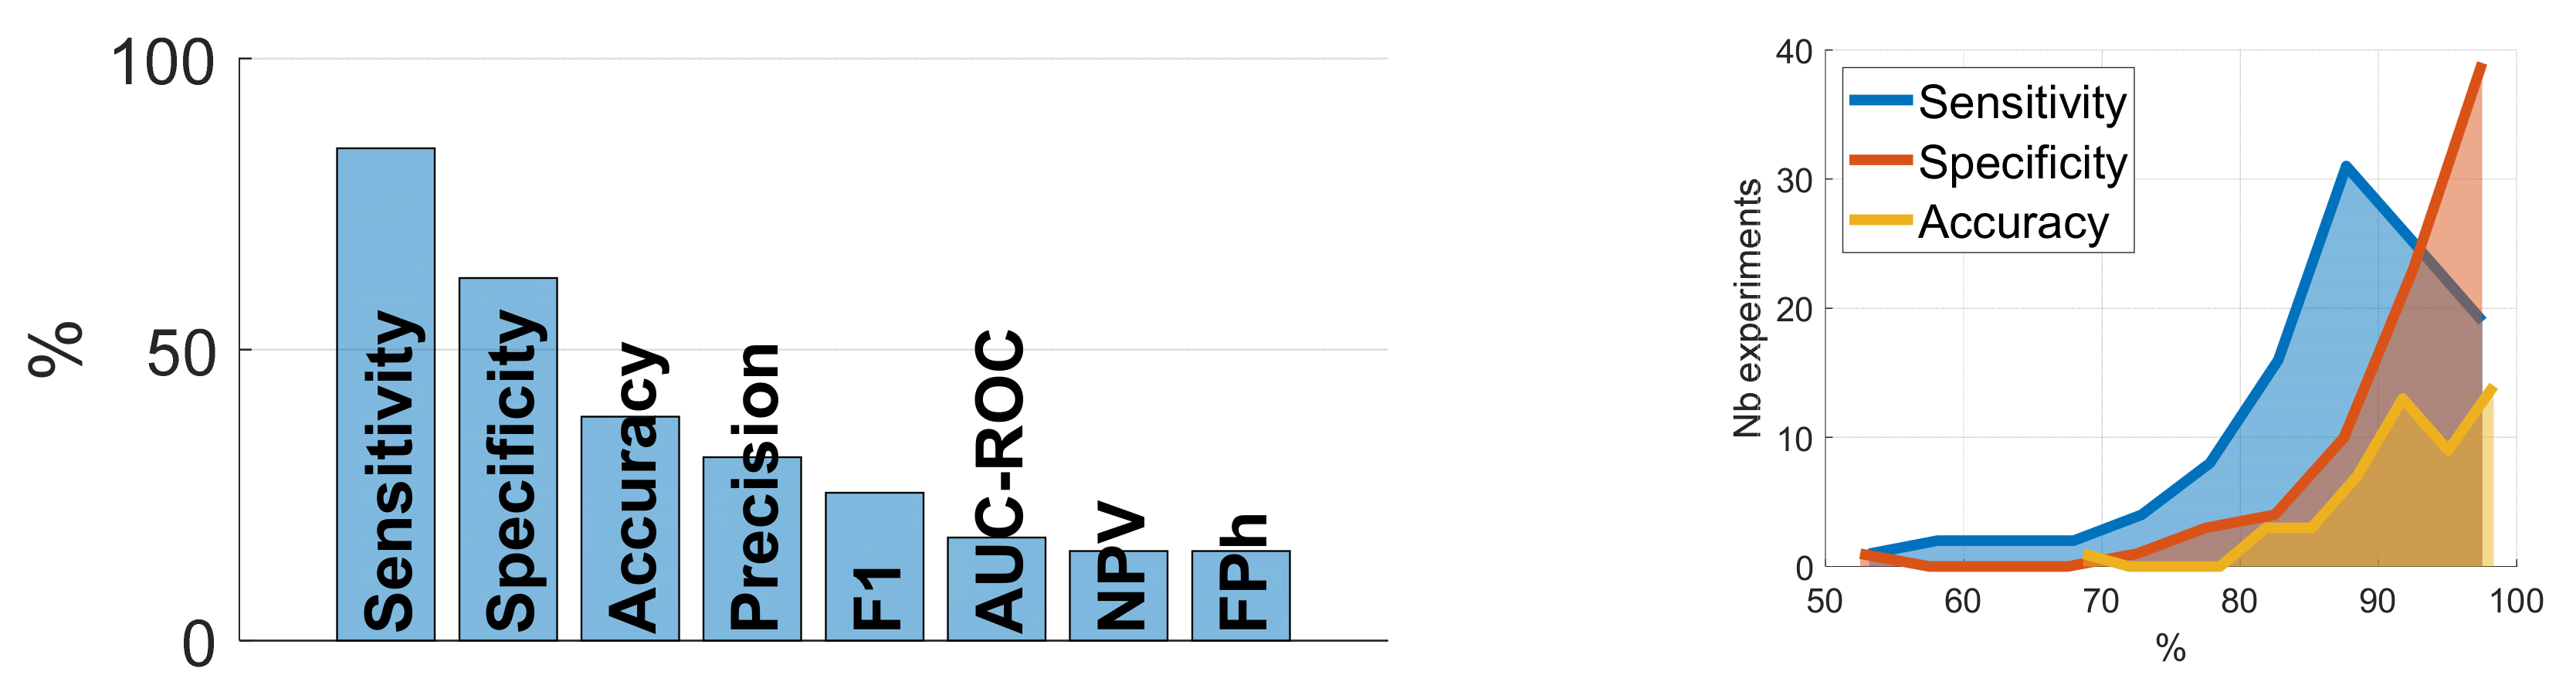
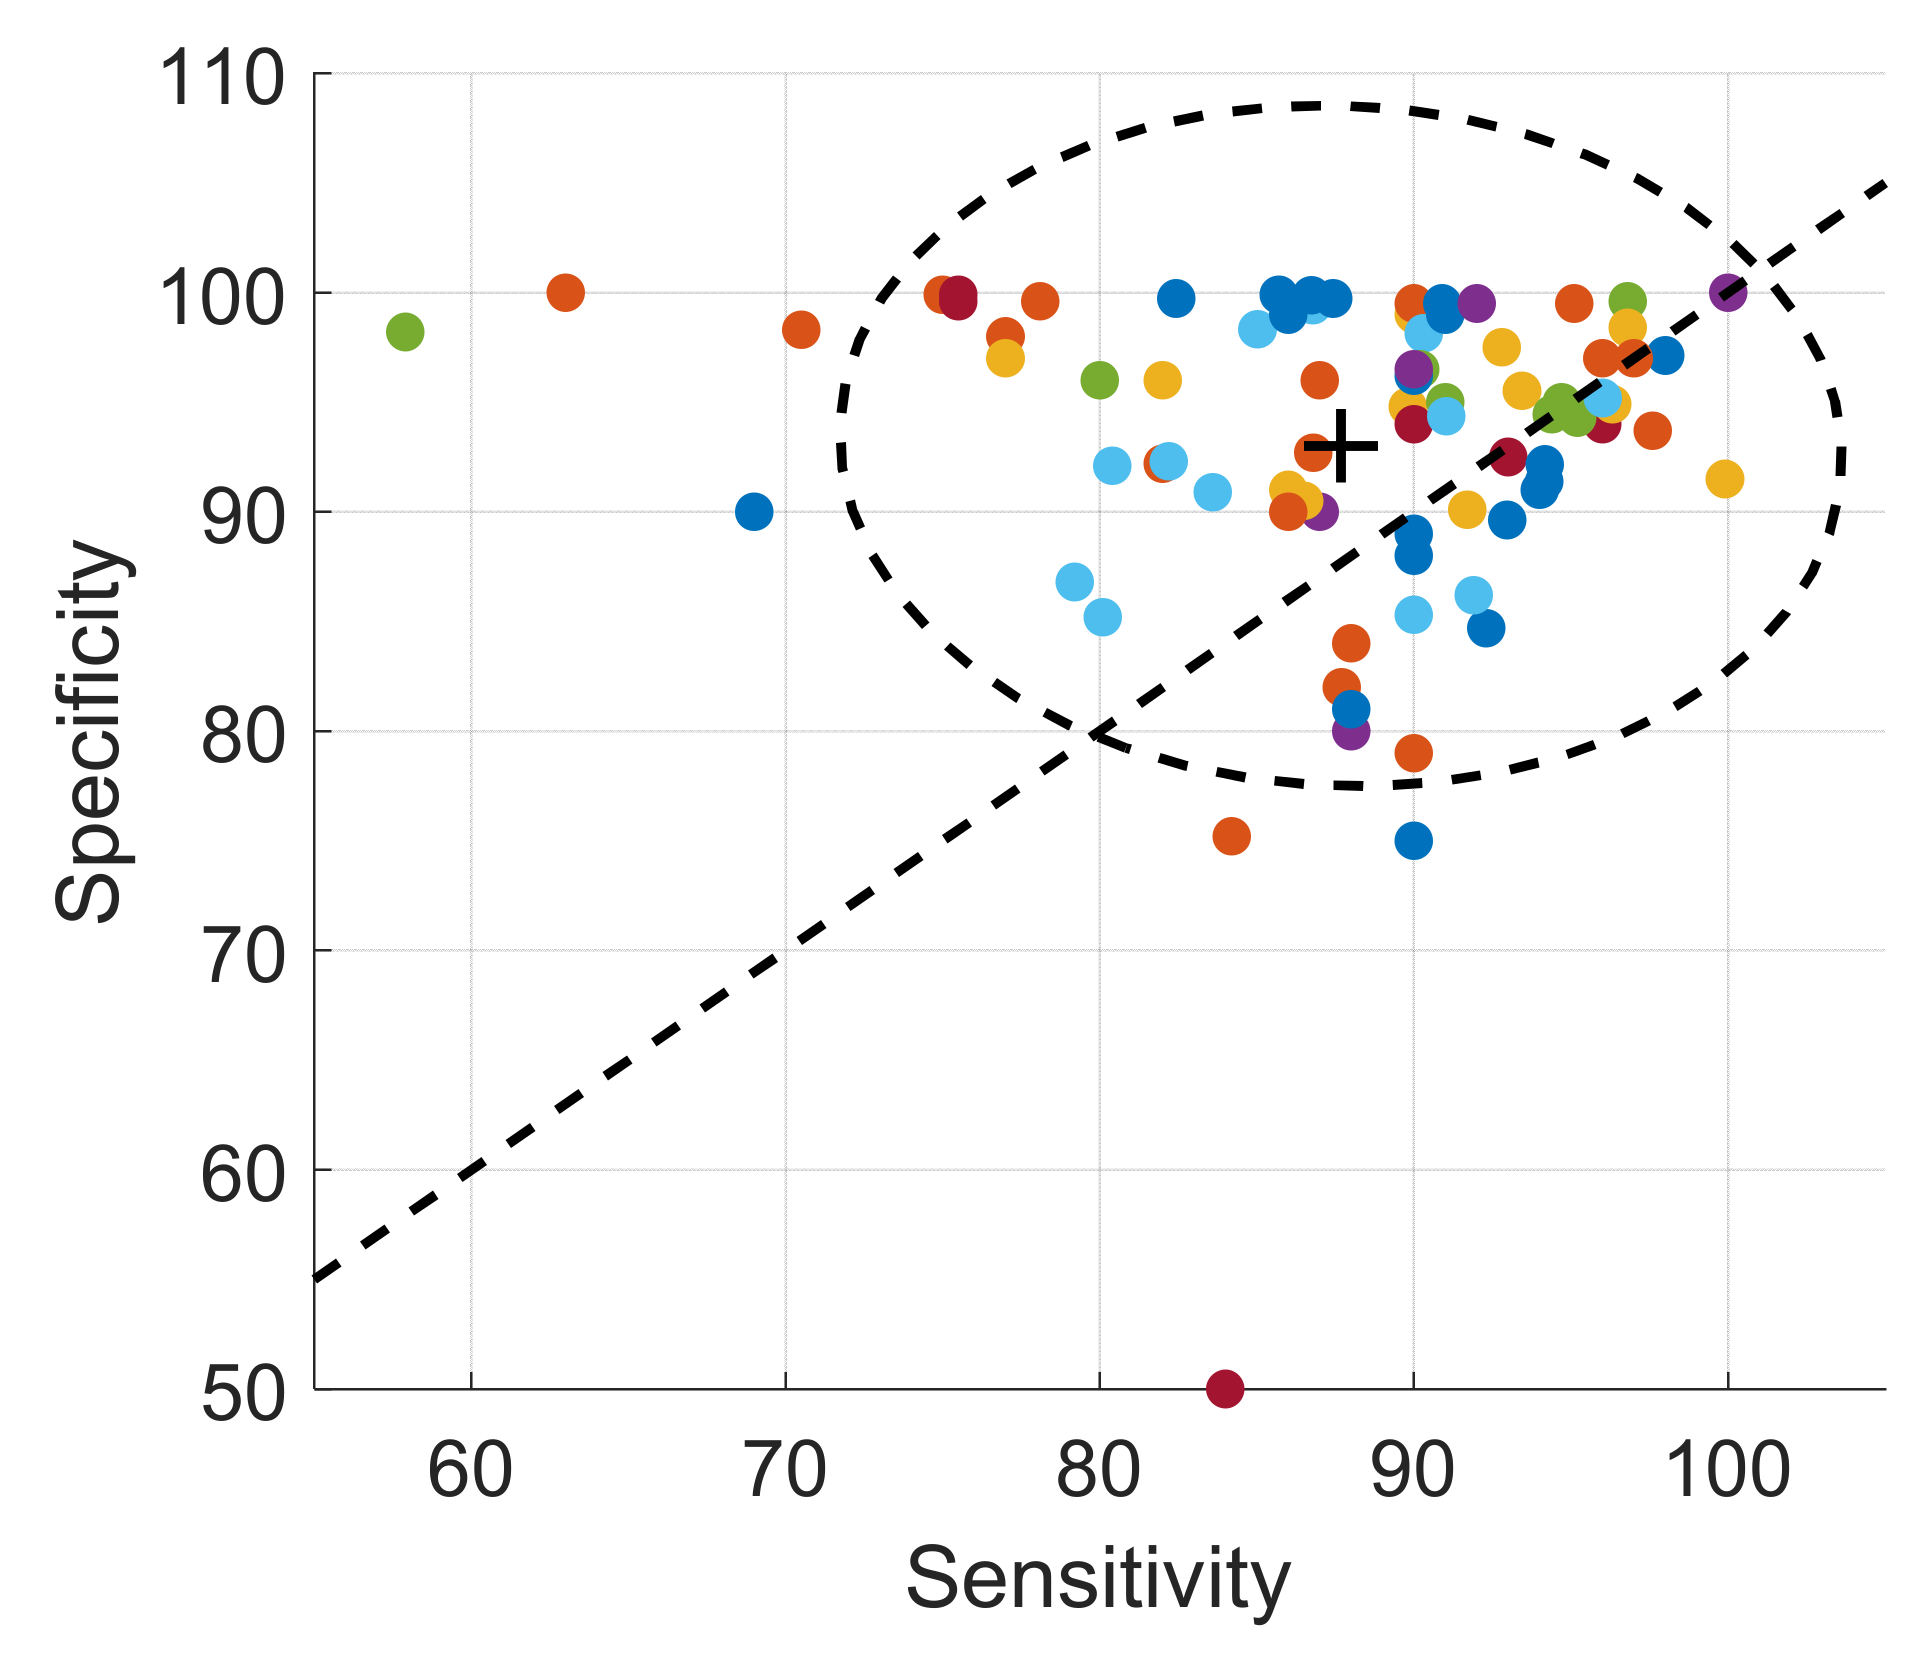
4.4.1. Cough Classification
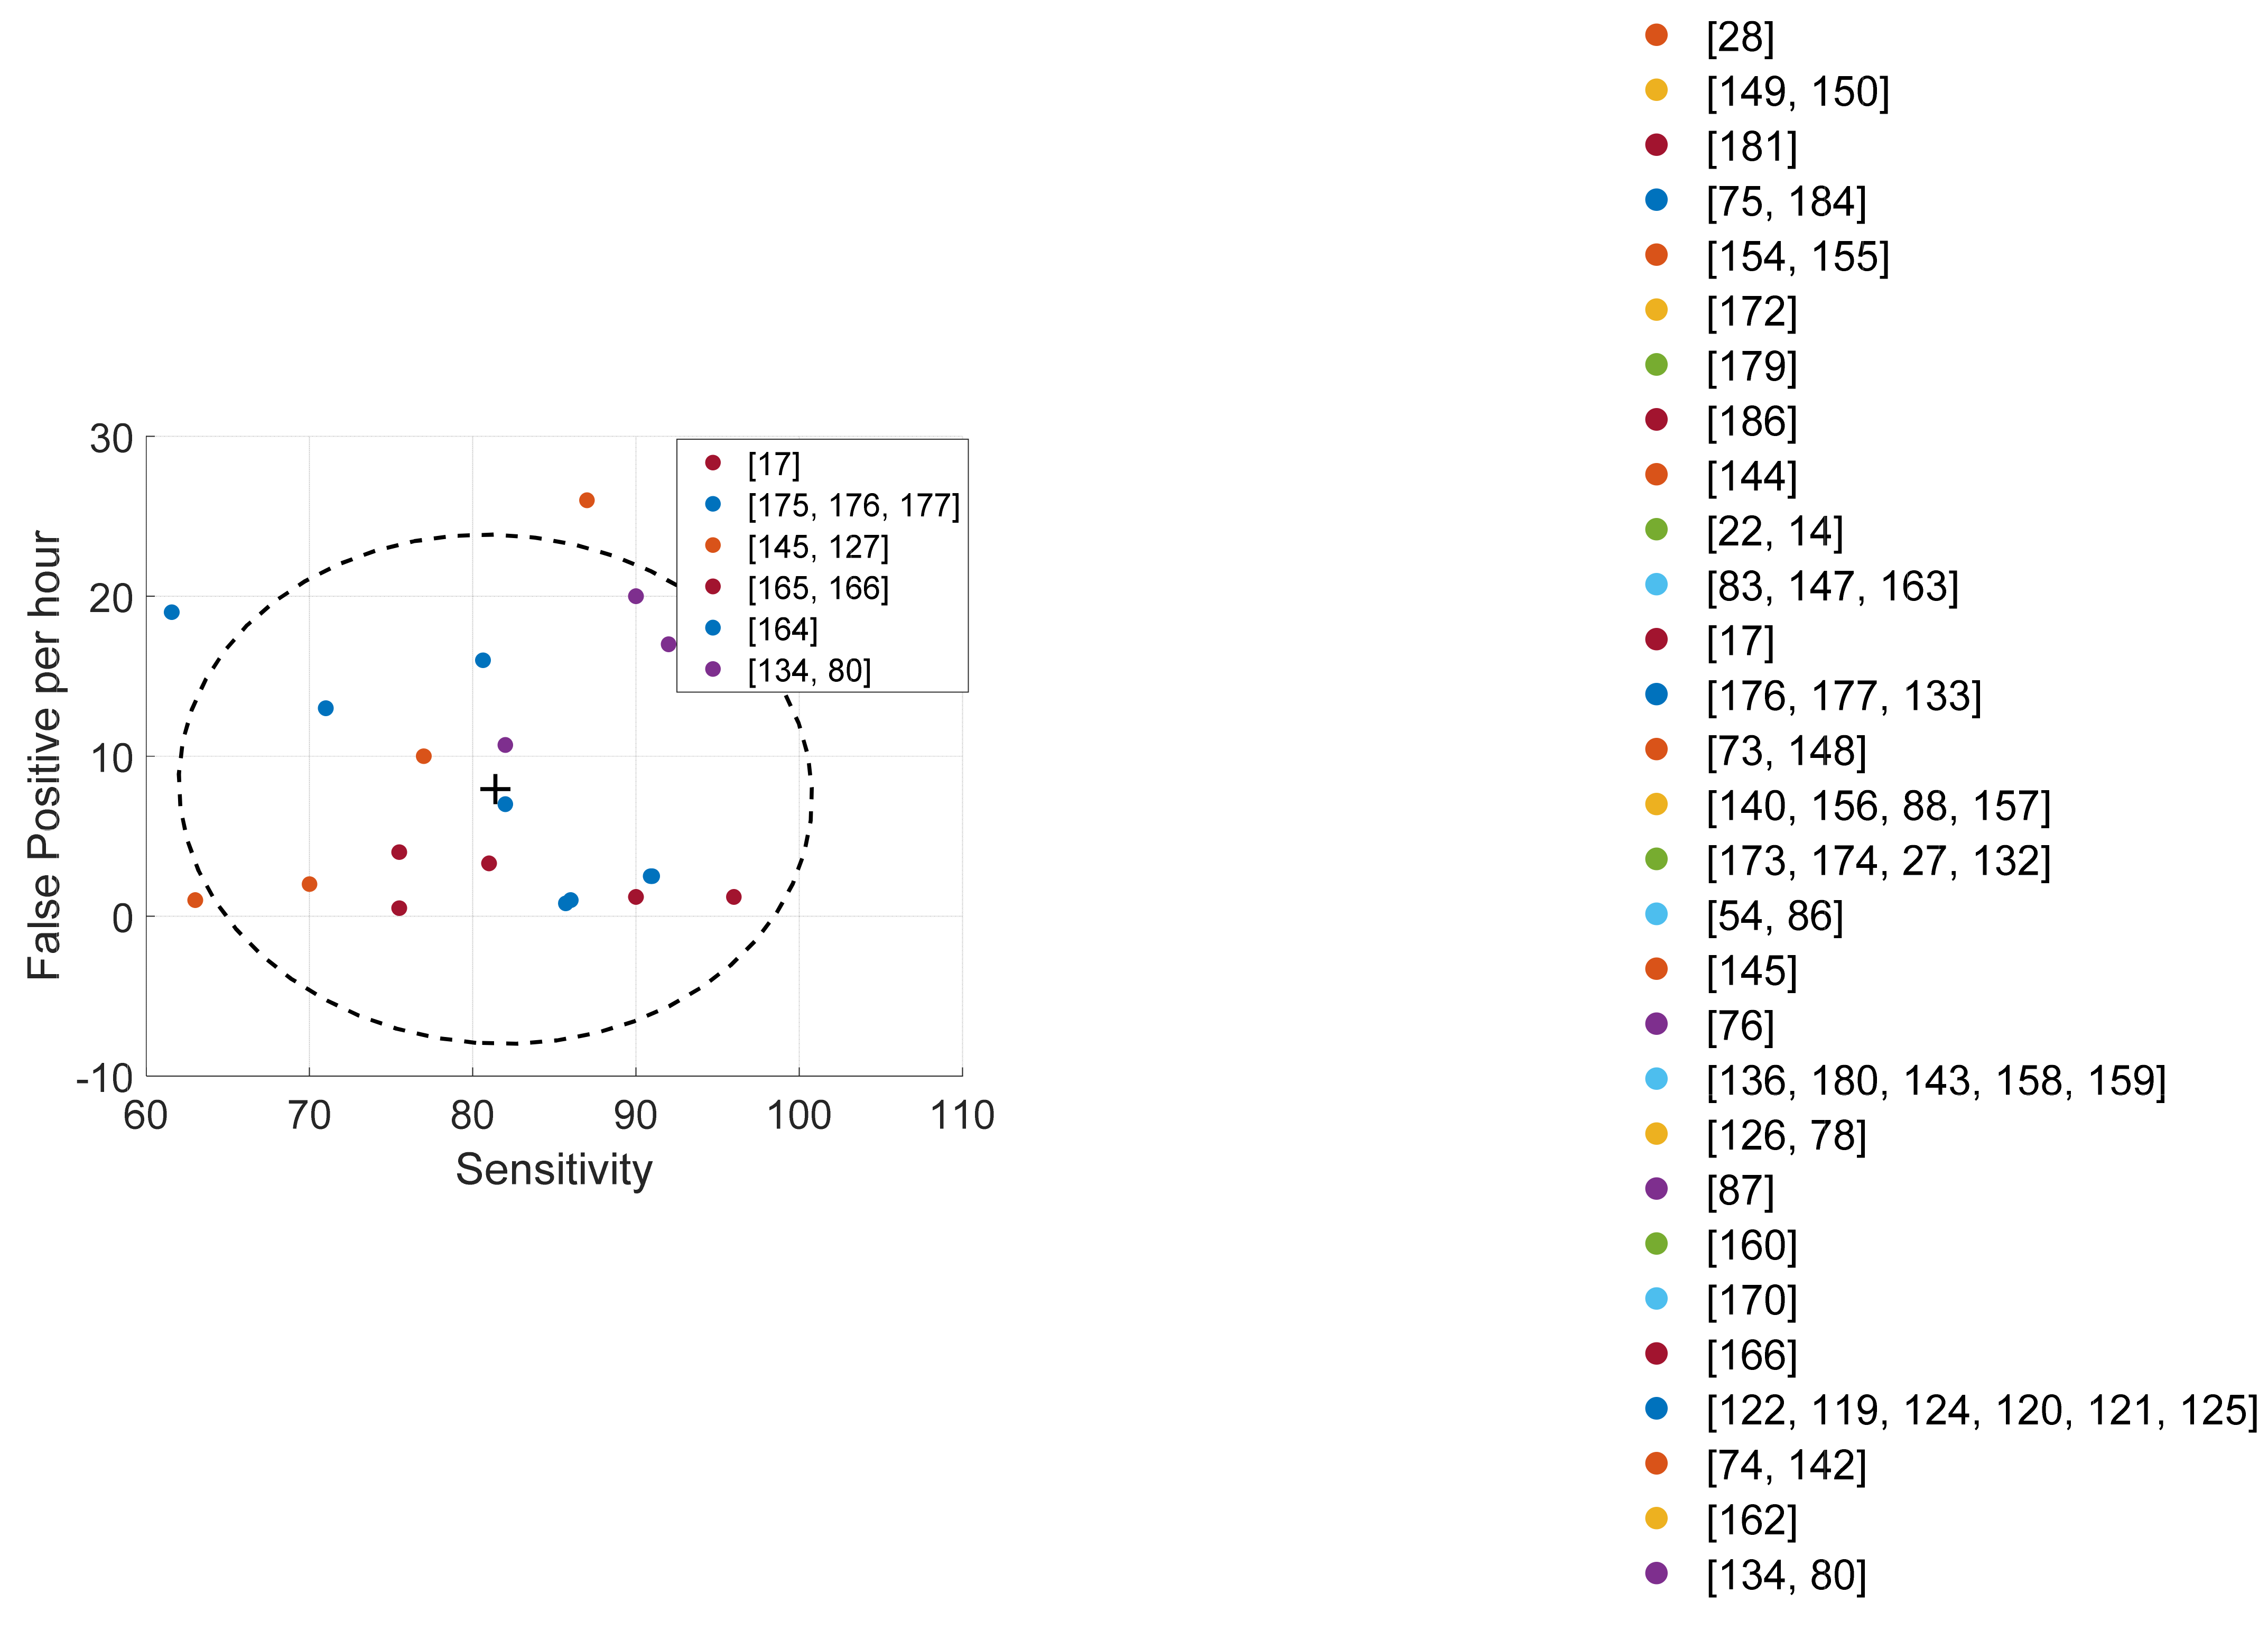
4.4.2. Cough Detection
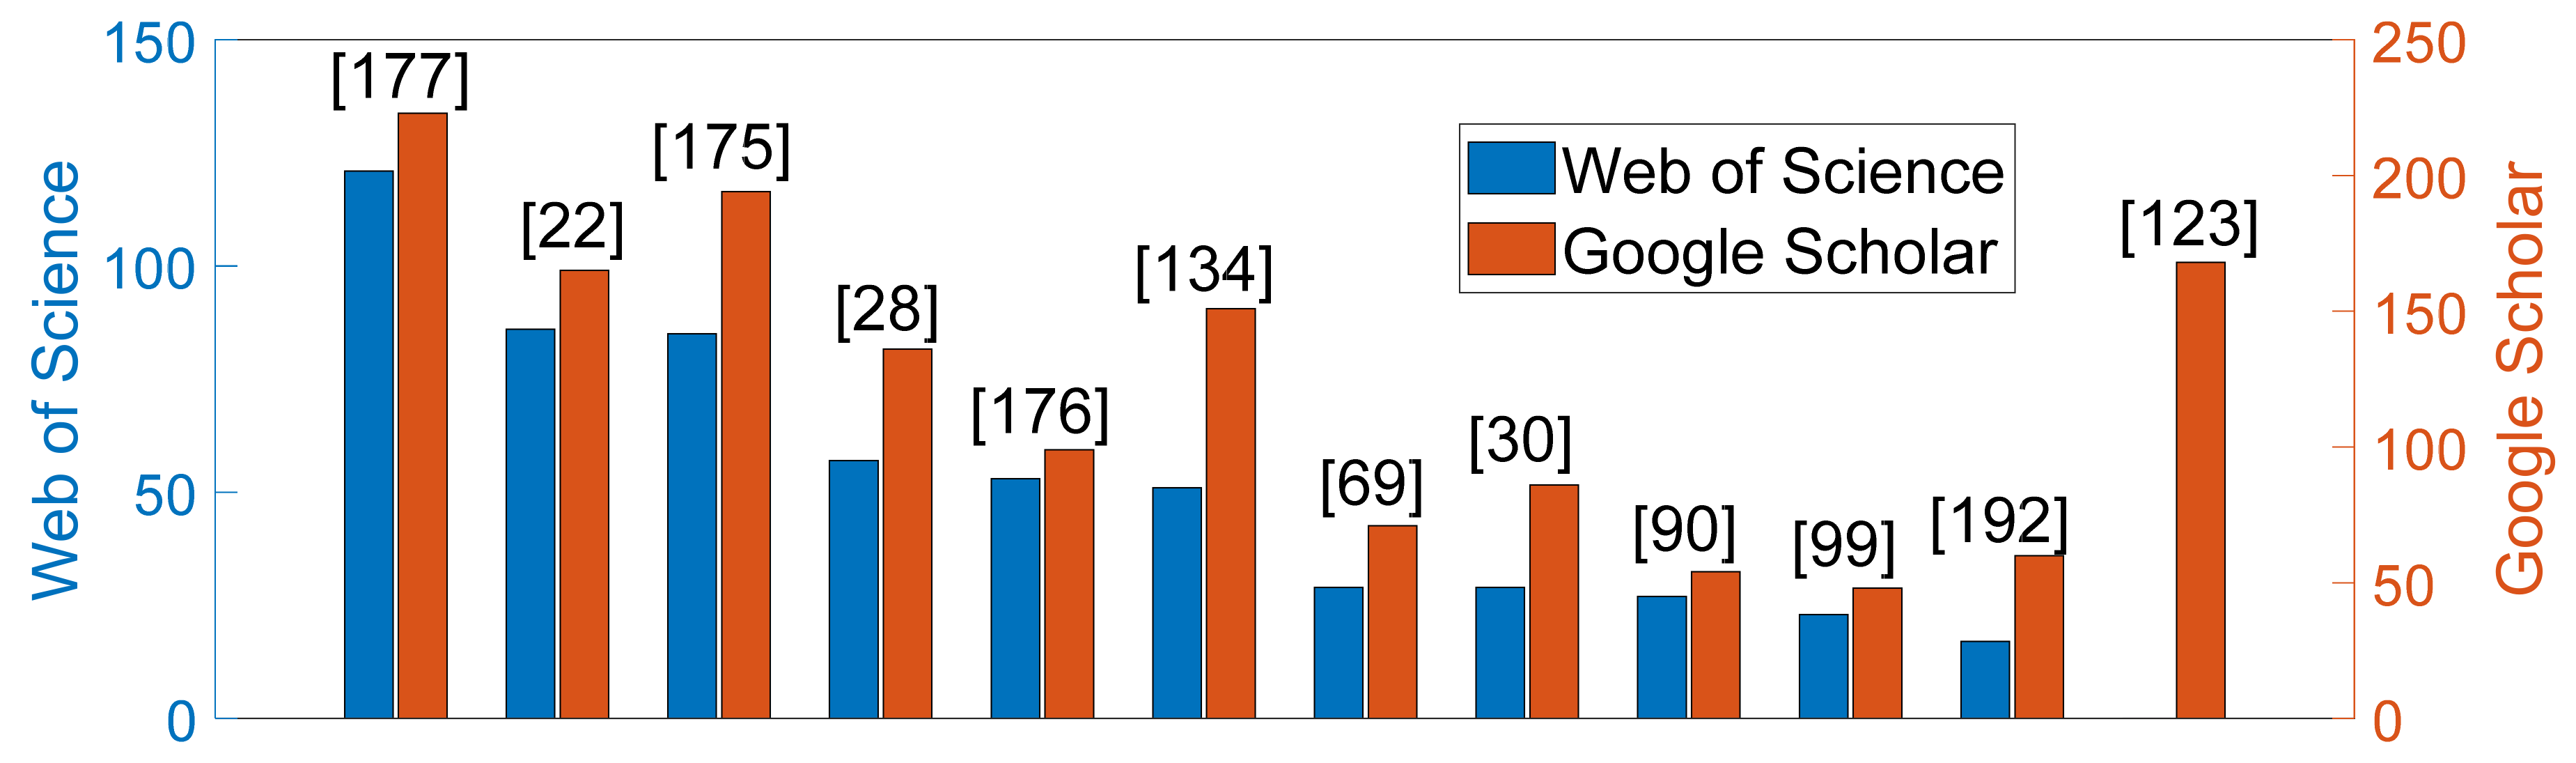
4.5. Citations
4.6. Most Complete Detection Studies
5. Discussion and Conclusions
Author Contributions
Funding
Institutional Review Board Statement
Informed Consent Statement
Data Availability Statement
Conflicts of Interest
References
- Chung, K.F.; Pavord, I.D. Prevalence, Pathogenesis, and Causes of Chronic Cough. Lancet 2008, 371, 1364–1374. [Google Scholar] [CrossRef]
- Smith, J. Ambulatory Methods for Recording Cough. Pulm. Pharmacol. Ther. 2007, 20, 313–318. [Google Scholar] [CrossRef] [PubMed]
- Chung, K.F. Assessment and Measurement of Cough: The Value of New Tools. Pulm. Pharmacol. Ther. 2002, 15, 267–272. [Google Scholar] [CrossRef] [PubMed]
- Arinze, J.T.; de Roos, E.W.; Karimi, L.; Verhamme, K.M.C.; Stricker, B.H.; Brusselle, G.G. Prevalence and Incidence of, and Risk Factors for Chronic Cough in the Adult Population: The Rotterdam Study. ERJ Open Res. 2020, 6, 1–10. [Google Scholar] [CrossRef]
- Shi, Y.; Liu, H.; Wang, Y.; Cai, M.; Xu, W. Theory and Application of Audio-Based Assessment of Cough. J. Sens. 2018, 2018, 9845321. [Google Scholar] [CrossRef] [Green Version]
- Morice, A.H.; Fontana, G.A.; Belvisi, M.G.; Birring, S.S.; Chung, K.F.; Dicpinigaitis, P.V.; Kastelik, J.A.; McGarvey, L.P.; Smith, J.A.; Tatar, M.; et al. ERS Guidelines on the Assessment of Cough. Eur. Respir. J. 2007, 29, 1256–1276. [Google Scholar] [CrossRef]
- Irwin, R.S.; French, C.L.; Chang, A.B.; Altman, K.W.; Adams, T.M.; Altman, K.W.; Azoulay, E.; Barker, A.F.; Birring, S.S.; Blackhall, F.; et al. Classification of Cough as a Symptom in Adults and Management Algorithms: CHEST Guideline and Expert Panel Report. Chest 2018, 153, 196–209. [Google Scholar] [CrossRef] [Green Version]
- Amoh, J.; Odame, K. Technologies for Developing Ambulatory Cough Monitoring Devices. Crit. Rev. Biomed. Engineering 2013, 41, 457–468. [Google Scholar] [CrossRef] [Green Version]
- Spinou, A.; Birring, S.S. An Update on Measurement and Monitoring of Cough: What Are the Important Study Endpoints? J. Thorac. Dis. 2014, 6, S728–S734. [Google Scholar] [CrossRef]
- Birring, S.S.; Spinou, A. How Best to Measure Cough Clinically. Curr. Opin. Pharmacol. 2015, 22, 37–40. [Google Scholar] [CrossRef] [Green Version]
- French, C.T.; Irwin, R.S.; Fletcher, K.E.; Adams, T.M. Evaluation of a Cough-Specific Quality-of-Life Questionnaire. Chest 2002, 121, 1123–1131. [Google Scholar] [CrossRef] [PubMed] [Green Version]
- Birring, S.S.; Prudon, B.; Carr, A.J.; Singh, S.J.; Morgan, M.D.L.; Pavord, I.D. Development of a Symptom Specific Health Status Measure for Patients with Chronic Cough: Leicester Cough Questionnaire (LCQ). Thorax 2003, 58, 339–343. [Google Scholar] [CrossRef] [PubMed] [Green Version]
- Marsden, P.A.; Smith, J.A.; Kelsall, A.A.; Owen, E.; Naylor, J.R.; Webster, D.; Sumner, H.; Alam, U.; McGuinness, K.; Woodcock, A.A. A Comparison of Objective and Subjective Measures of Cough in Asthma. J. Allergy Clin. Immunol. 2008, 122, 903–907. [Google Scholar] [CrossRef] [PubMed]
- Crooks, M.G.; Hayman, Y.; Innes, A.; Williamson, J.; Wright, C.E.; Morice, A.H. Objective Measurement of Cough Frequency During COPD Exacerbation Convalescence. Lung 2016, 194, 117–120. [Google Scholar] [CrossRef]
- Clare Decalmer, S.; Webster, D.; Alice Kelsall, A.; McGuinness, K.; Arthur Woodcock, A.; Ann Smith, J. Chronic Cough: How Do Cough Reflex Sensitivity and Subjective Assessments Correlate with Objective Cough Counts during Ambulatory Monitoring? Thorax 2007, 62, 329–334. [Google Scholar] [CrossRef] [Green Version]
- Kelsall, A.; Houghton, L.A.; Jones, H.; Decalmer, S.; McGuinness, K.; Smith, J.A. A Novel Approach to Studying the Relationship Between Subjective and Objective Measures of Cough. Chest 2011, 139, 569–575. [Google Scholar] [CrossRef]
- Vizel, E.; Yigla, M.; Goryachev, Y.; Dekel, E.; Felis, V.; Levi, H.; Kroin, I.; Godfrey, S.; Gavriely, N. Validation of an Ambulatory Cough Detection and Counting Application Using Voluntary Cough under Different Conditions. Cough 2010, 6, 3. [Google Scholar] [CrossRef] [Green Version]
- Reece, C.A.; Cherry, A.C., Jr.; Arthur, C.; Reece, T.; Hatcher, T.B.; Diehl, A.M. Tape Recorder for Evaluation of Coughs in Children: Evaluation of Antitussive Agents. Am. J. Dis. Child. 1966, 112, 124–128. [Google Scholar] [CrossRef]
- Smith, J. Monitoring Chronic Cough: Current and Future Techniques. Expert Rev. Respir. Med. 2010, 4, 673–683. [Google Scholar] [CrossRef]
- Loudon, R.G.; Brown, L.C. Cough Frequency in Patients with Respiratory Disease. Am. Rev. Respir. Dis. 1967, 96, 1137–1143. [Google Scholar] [CrossRef]
- Woolf, C.R.; Rosenberg, A. Objective Assessment of Cough Suppressants under Clinical Conditions Using a Tape Recorder System. Thorax 1964, 19, 125–130. [Google Scholar] [CrossRef] [PubMed] [Green Version]
- Barry, S.J.; Dane, A.D.; Morice, A.; Walmsley, A.D. The Automatic Recognition and Counting of Cough. Cough 2006, 2, 1–9. [Google Scholar] [CrossRef] [PubMed] [Green Version]
- Munyard, P.; Busst, C.; Logan-Sinclair, R.; Bush, A. A New Device for Ambulatory Cough Recording. Pediatric Pulmonol. 1994, 18, 178–186. [Google Scholar] [CrossRef]
- Coryllos, P.N. Action of the Diaphragm in Cough: Experimental and Clinical Study on the Human. Am. J. Med. Sci. 1937, 194, 523–535. [Google Scholar] [CrossRef]
- Piirilä, P.; Sovijärvi, A.R.A. Objective Assessment of Cough. Eur. Respir. J. 1995, 8, 1949–1956. [Google Scholar] [CrossRef]
- Hoglund, N.; Michaelsson, M. A Method for Determining the Cough Threshold with Some Preliminary Experiments on the Effect of Codeine. Acta Physiol. Scand. 1950, 21, 168–173. [Google Scholar] [CrossRef] [PubMed]
- Drugman, T.; Urbain, J.; Bauwens, N.; Chessini, R.; Valderrama, C.; Lebecque, P.; Dutoit, T. Objective Study of Sensor Relevance for Automatic Cough Detection. IEEE J. Biomed. Health Inform. 2013, 17, 699–707. [Google Scholar] [CrossRef] [Green Version]
- Coyle, M.A.; Keenan, D.B.; Henderson, L.S.; Watkins, M.L.; Haumann, B.K.; Mayleben, D.W.; Wilson, M.G. Evaluation of an Ambulatory System for the Quantification of Cough Frequency in Patients with Chronic Obstructive Pulmonary Disease. Cough 2005, 1, 1–7. [Google Scholar] [CrossRef] [Green Version]
- Rudraraju, G.; Palreddy, S.; Mamidgi, B.; Sripada, N.R.; Sai, Y.P.; Vodnala, N.K.; Haranath, S.P. Cough Sound Analysis and Objective Correlation with Spirometry and Clinical Diagnosis. Inform. Med. Unlocked 2020, 19, 100319. [Google Scholar] [CrossRef]
- Thorpe, C.; Toop, L.; Dawson, K. Towards a Quantitative Description of Asthmatic Cough Sounds. Eur. Respir. J. 1992, 5, 685–692. [Google Scholar]
- Goldsmith, W.T.; Mahmoud, A.M.; Reynolds, J.S.; McKinney, W.G.; Afshari, A.; Abaza, A.A.; Frazer, D. A System for Recording High Fidelity Cough Sound and Airflow Characteristics. Ann. Biomed. Eng. 2010, 38, 469–477. [Google Scholar] [CrossRef] [PubMed]
- Feinstein, A.J.; Zhang, Z.; Chhetri, D.K.; Long, J. Measurement of Cough Aerodynamics in Healthy Adults. Ann. Otol. Rhinol. Laryngol. 2017, 126, 396–400. [Google Scholar] [CrossRef] [PubMed]
- Abaza, A.A.; Day, J.B.; Reynolds, J.S.; Mahmoud, A.M.; Goldsmith, W.T.; McKinney, W.G.; Petsonk, E.L.; Frazer, D.G. Classification of Voluntary Cough Sound and Airflow Patterns for Detecting Abnormal Pulmonary Function. Cough 2009, 5, 8. [Google Scholar] [CrossRef] [PubMed] [Green Version]
- Solinski, M.; Lepek, M.; Koltowski, L. Automatic Cough Detection Based on Airflow Signals for Portable Spirometry System. Inform. Med. Unlocked 2020, 18, 100313. [Google Scholar] [CrossRef]
- Hsu, J.; Stone, R.; Logan-Sinclair, R.; Worsdell, M.; Busst, C.; Chung, K. Coughing Frequency in Patients with Persistent Cough: Assessment Using a 24 Hour Ambulatory Recorder. Eur. Respir. J. 1994, 7, 1246–1253. [Google Scholar] [CrossRef] [Green Version]
- Chang, A.; Newman, R.; Phelan, P.; Robertson, C. A New Use for an Old Holter Monitor: An Ambulatory Cough Meter. Eur. Respir. J. 1997, 10, 1637–1639. [Google Scholar] [CrossRef] [Green Version]
- Iwahashi, T.; Ogawa, M.; Hosokawa, K.; Kato, C.; Inohara, H. Measurement of the Maximum Frequency of Electroglottographic Fluctuations in the Expiration Phase of Volitional Cough as a Functional Test for Cough Efficiency. Dysphagia 2017, 32, 691–702. [Google Scholar] [CrossRef]
- Pahar, M.; Miranda, I.; Diacon, A.; Niesler, T. Deep Neural Network Based Cough Detection Using Bed-Mounted Accelerometer Measurements. In Proceedings of the IEEE International Conference on Acoustics, Speech and Signal Processing (ICASSP), Toronto, ON, Canada, 6–11 June 2021; pp. 8002–8006. [Google Scholar]
- Gavriely, N. Phonopneumograph System. U.S. Patent 6168568B1, 2 January 2001. [Google Scholar]
- Coyle, M.; Keenan, D.B.; Derchak, P.A.; Sackner, M.; Wilhelm, F.; Gilroy, K.; Gummels, E.M.; Inman, D.M.; Kennedy, P.; Mitchnick, M.; et al. Systems and Methods for Respiratory Event Detection. U.S. Patent 7,267,652, 11 September 2007. [Google Scholar]
- Woodcock, A.A.; Smith, J.A.; McGuinness, K. Method for Generating Output Data. U.S. Patent US7761302B2, 20 July 2010. [Google Scholar]
- MacAuslan, J. Cough Analysis. U.S. Patent US2017/0055879A1, 2 March 2017. [Google Scholar]
- Patel, S.N.; Larson, E.C.; Lee, T.-J. Cough Detecting Methods and Devices for Detecting Coughs. U.S. Patent 10,448,920, 22 October 2019. [Google Scholar]
- Peltonen, V.T.K.; Keating, A.J.; Partridge, N.K. Methods and Apparatus for Cough Detection in Background Noise Environ-ments. U.S. Patent US2020/0015709A1, 16 January 2020. [Google Scholar]
- Laguarta, J.; Hueto, F.; Subirana, B. COVID-19 Artificial Intelligence Diagnosis Using Only Cough Recordings. IEEE Open J. Engineering Med. Biology 2020, 1, 275–281. [Google Scholar] [CrossRef]
- Bansal, V.; Pahwa, G.; Kannan, N. Cough Classification for COVID-19 Based on Audio Mfcc Features Using Convolutional Neural Networks. In Proceedings of the IEEE International Conference on Computing, Power and Communication Technologies, Kuala Lumpur, Malaysia, 24–26 September 2020; pp. 604–608. [Google Scholar]
- Andreu-Perez, J.; Perez-Espinosa, H.; Timonet, E.; Kiani, M.; Giron-Perez, M.I.; Benitez-Trinidad, A.B.; Jarchi, D.; Rosales, A.; Gkatzoulis, N.; Reyes-Galaviz, O.F.; et al. A Generic Deep Learning Based Cough Analysis System from Clinically Validated Samples for Point-of-Need Covid-19 Test and Severity Levels. IEEE Trans. Serv. Comput. 2021, 1–13. [Google Scholar] [CrossRef]
- Brown, C.; Chauhan, J.; Grammenos, A.; Han, J.; Hasthanasombat, A.; Spathis, D.; Xia, T.; Cicuta, P.; Mascolo, C. Exploring Automatic Diagnosis of COVID-19 from Crowdsourced Respiratory Sound Data. In Proceedings of the 26th ACM SIGKDD International Conference on Knowledge Discovery & Data Mining, Virtual Event, 6–10 July 2020; Association for Computing Machinery: New York, NY, USA, 2020; pp. 3474–3484. [Google Scholar]
- Feng, K.; He, F.; Steinmann, J.; Demirkiran, I. Deep-Learning Based Approach to Identify COVID-19. In Proceedings of the SoutheastCon 2021, Virtual Event, 10–14 March 2021; pp. 1–4. [Google Scholar]
- Hassan, A.; Shahin, I.; Alsabek, M.B. COVID-19 Detection System Using Recurrent Neural Networks. In Proceedings of the International Conference on Communications, Computing, Cybersecurity, and Informatics (CCCI), Beijing, China,, 15–17 October 2020; pp. 1–5. [Google Scholar]
- Mouawad, P.; Dubnov, T.; Dubnov, S. Robust Detection of COVID-19 in Cough Sounds. SN Comput. Sci. 2021, 2, 1–13. [Google Scholar] [CrossRef]
- Coppock, H.; Gaskell, A.; Tzirakis, P.; Baird, A.; Jones, L.; Schuller, B. End-to-End Convolutional Neural Network Enables COVID-19 Detection from Breath and Cough Audio: A Pilot Study. BMJ Innov. 2021, 7, 356–362. [Google Scholar] [CrossRef]
- Vrindavanam, J.; Srinath, R.; Shankar, H.H.; Nagesh, G. Machine Learning Based COVID-19 Cough Classification Models—A Comparative Analysis. In Proceedings of the 5th International Conference on Computing Methodologies and Communication (ICCMC), Tamil Nadu, India, 8–10 April 2021; pp. 420–426. [Google Scholar]
- Imran, A.; Posokhova, I.; Qureshi, H.N.; Masood, U.; Riaz, M.S.; Ali, K.; John, C.N.; Hussain, M.I.; Nabeel, M. AI4COVID-19: AI Enabled Preliminary Diagnosis for COVID-19 from Cough Samples via an App. Inform. Med. Unlocked 2020, 20, 100378. [Google Scholar] [CrossRef] [PubMed]
- Pal, A.; Sankarasubbu, M. Pay Attention to the Cough: Early Diagnosis of COVID-19 Using Interpretable Symptoms Embeddings with Cough Sound Signal Processing. In Proceedings of the 36th Annual ACM Symposium on Applied Computing, New York, NY, USA, 22–26 March 2021; Association for Computing Machinery: New York, NY, USA, 2021; pp. 620–628. [Google Scholar]
- Vijayakumar, D.S.; Sneha, M. Low Cost Covid-19 Preliminary Diagnosis Utilizing Cough Samples and Keenly Intellective Deep Learning Approaches. Alex. Engineering J. 2021, 60, 549–557. [Google Scholar] [CrossRef]
- Lella, K.K.; Alphonse, P. A Literature Review on COVID-19 Disease Diagnosis from Respiratory Sound Data. AIMS BioEngineering 2021, 8, 140–153. [Google Scholar] [CrossRef]
- Botha, G.H.R.; Theron, G.; Warren, R.M.; Klopper, M.; Dheda, K.; van Helden, P.D.; Niesler, T.R. Detection of Tuberculosis by Automatic Cough Sound Analysis. Physiol. Meas. 2018, 39, 045005. [Google Scholar] [CrossRef]
- Kumar, A.; Abhishek, K.; Ghalib, M.R.; Nerurkar, P.; Shah, K.; Chandane, M.; Bhirud, S.; Patel, D.; Busnel, Y. Towards Cough Sound Analysis Using the Internet of Things and Deep Learning for Pulmonary Disease Prediction. Trans. Emerg. Telecommun. Technol. 2020, e4184. [Google Scholar] [CrossRef]
- Smith, J.; Woodcock, A. New Developments in the Objective Assessment of Cough. Lung 2008, 186 (Suppl. S1), S48–S54. [Google Scholar] [CrossRef]
- Pramono, R.X.A.; Bowyer, S.; Rodriguez-Villegas, E. Automatic Adventitious Respiratory Sound Analysis: A Systematic Review. PLoS ONE 2017, 12, 1–43. [Google Scholar] [CrossRef] [Green Version]
- Tabatabaei, S.A.H.; Fischer, P.; Schneider, H.; Koehler, U.; Gross, V.; Sohrabi, K. Methods for Adventitious Respiratory Sound Analyzing Applications Based on Smartphones: A Survey. IEEE Rev. Biomed. Engineering 2020, 14, 98–115. [Google Scholar] [CrossRef]
- Hall, J.I.; Lozano, M.; Estrada-Petrocelli, L.; Birring, S.; Turner, R. The Present and Future of Cough Counting Tools. J. Thorac. Dis. 2020, 12, 5207–5223. [Google Scholar] [CrossRef]
- Korpás, J.; Sadlonová, J.; Vrabec, M. Analysis of the Cough Sound: An Overview. Pulm. Pharmacol. 1996, 9, 261–268. [Google Scholar] [CrossRef] [PubMed]
- Murata, A.; Taniguchi, Y.; Hashimoto, Y.; Kaneko, Y.; Takasaki, Y.; Kudoh, S. Discrimination of Productive and Non-Productive Cough by Sound Analysis. Intern. Med. 1998, 37, 732–735. [Google Scholar] [CrossRef] [PubMed] [Green Version]
- Thorpe, W.; Kurver, M.; King, G.; Salome, C. Acoustic Analysis of Cough. In Proceedings of the 7th Australian and New Zealand Intelligent Information Systems Conference, Perth, Australia, 18–21 November 2001; pp. 391–394. [Google Scholar]
- Olia, P.M.; Sestini, P.; Vagliasindi, M. Acoustic Parameters of Voluntary Cough in Healthy Non-Smoking Subjects. Respirology 2000, 5, 271–275. [Google Scholar] [CrossRef] [PubMed]
- Zhu, C.; Tian, L.; Li, X.; Mo, H.; Zheng, Z. Recognition of Cough Using Features Improved by Sub-Band Energy Transformation. In Proceedings of the 6th International Conference on Biomedical Engineering and Informatics, Hangzhou, China, 16–18 December 2013; pp. 251–255. [Google Scholar]
- Shin, S.; Hashimoto, T.; Hatano, S. Automatic Detection System for Cough Sounds as a Symptom of Abnormal Health Condition. IEEE Trans. Inf. Technol. Biomed. 2009, 13, 486–493. [Google Scholar] [CrossRef] [PubMed]
- Nemati, E.; Rahman, M.M.; Nathan, V.; Vatanparvar, K.; Kuang, J. A Comprehensive Approach for Classification of the Cough Type. In Proceedings of the 42nd Annual International Conference of the IEEE Engineering in Medicine & Biology Society (EMBC), Montreal, QC, Canada, 20–24 July 2020; pp. 208–212. [Google Scholar]
- Walke, S.A.; Thool, V.R. Differentiating Nature of Cough Sounds in Time Domain Analysis. In Proceedings of the International Conference on Industrial Instrumentation and Control, Pune, India, 28–30 May 2015; pp. 1022–1026. [Google Scholar]
- Piirilä, P.; Sovijärvi, A.R.A. Differences in Acoustic and Dynamic Characteristics of Spontaneous Cough in Pulmonary Diseases. Chest 1989, 96, 46–53. [Google Scholar] [CrossRef]
- Hiew, Y.H.; Smith, J.A.; Earis, J.E.; Cheetham, B.M.G.; Woodcock, A.A. DSP Algorithm for Cough Identification and Counting. In Proceedings of the IEEE International Conference on Acoustics, Speech, and Signal Processing, Orlando, FL, USA, 13–17 May 2002; Volume 4, pp. IV-3888–IV–3891. [Google Scholar]
- Vhaduri, S. Nocturnal Cough and Snore Detection Using Smartphones in Presence of Multiple Background-Noises. In Proceedings of the 3rd ACM SIGCAS Conference on Computing and Sustainable Societies, New York, NY, USA, 15–17 June 2020; Association for Computing Machinery: New York, NY, USA, 2020; pp. 174–186. [Google Scholar]
- Rocha, B.M.; Mendes, L.; Couceiro, R.; Henriques, J.; Carvalho, P.; Paiva, R.P. Detection of Explosive Cough Events in Audio Recordings by Internal Sound Analysis. In Proceedings of the 39th Annual International Conference of the IEEE Engineering in Medicine and Biology Society (EMBC), Jeju Island, Korea, 11–15 July 2017; pp. 2761–2764. [Google Scholar]
- Teyhouee, A.; Osgood, N.D. Cough Detection Using Hidden Markov Models. In Proceedings of the International Conference on Social Computing, Behavioral-Cultural Modeling & Prediction and Behavior Representation in Modeling and Simulation; Thomson, Washington, DC, USA, 9–12 July 2019; Thomson, R., Bisgin, H., Dancy, C., Hyder, A., Eds.; Springer International Publishing: Cham, Switzerland, 2019; pp. 266–276. [Google Scholar]
- Hoa, H.T.; Tran, A.V.; Dat, T.H. Semi-Supervised Tree Support Vector Machine for Online Cough Recognition. In Proceedings of the INTERSPEECH, Florence, Italy, 27–31 August 2011; pp. 1637–1640. [Google Scholar]
- Barata, F.; Tinschert, P.; Rassouli, F.; Steurer-Stey, C.; Fleisch, E.; Puhan, M.A.; Brutsche, M.; Kotz, D.; Kowatsch, T. Automatic Recognition, Segmentation, and Sex Assignment of Nocturnal Asthmatic Coughs and Cough Epochs in Smartphone Audio Recordings: Observational Field Study. J. Med. Internet Res. 2020, 22, e18082. [Google Scholar] [CrossRef]
- Chatrzarrin, H.; Arcelus, A.; Goubran, R.; Knoefel, F. Feature Extraction for the Differentiation of Dry and Wet Cough Sounds. In Proceedings of the IEEE International Symposium on Medical Measurements and Applications, Bari, Italy, 30–31 May 2011; pp. 162–166. [Google Scholar]
- Saba, E. Techniques for Cough Sound Analysis. Ph.D. Thesis, University of Washington, Seattle, WA, USA, 2018. [Google Scholar]
- Kobat, M.A.; Kivrak, T.; Barua, P.D.; Tuncer, T.; Dogan, S.; Tan, R.-S.; Ciaccio, E.J.; Acharya, U.R. Automated COVID-19 and Heart Failure Detection Using DNA Pattern Technique with Cough Sounds. Diagnostics 2021, 11, 1962. [Google Scholar] [CrossRef]
- Bramer, W.M.; Rethlefsen, M.L.; Kleijnen, J.; Franco, O.H. Optimal Database Combinations for Literature Searches in Systematic Reviews: A Prospective Exploratory Study. Syst. Rev. 2017, 6, 245. [Google Scholar] [CrossRef]
- Pramono, R.X.A.; Imtiaz, S.A.; Rodriguez-Villegas, E. A Cough-Based Algorithm for Automatic Diagnosis of Pertussis. PLoS ONE 2016, 11, 1–20. [Google Scholar] [CrossRef] [Green Version]
- Sharan, R.V.; Abeyratne, U.R.; Swarnkar, V.R.; Porter, P. Automatic Croup Diagnosis Using Cough Sound Recognition. IEEE Trans. Biomed. Eng. 2019, 66, 485–495. [Google Scholar] [CrossRef]
- Porter, P.; Abeyratne, U.; Swarnkar, V.; Tan, J.; Ng, T.; Brisbane, J.M.; Speldewinde, D.; Choveaux, J.; Sharan, R.; Kosasih, K.; et al. A Prospective Multicentre Study Testing the Diagnostic Accuracy of an Automated Cough Sound Centred Analytic System for the Identification of Common Respiratory Disorders in Children. Respir. Res. 2019, 20, 81. [Google Scholar] [CrossRef]
- Bales, C.; Nabeel, M.; John, C.N.; Masood, U.; Qureshi, H.N.; Farooq, H.; Posokhova, I.; Imran, A. Can Machine Learning Be Used to Recognize and Diagnose Coughs? In Proceedings of the IEEE International Conference on E-Health and Bioengineering—EHB, Iasi, Romania, 29–30 October 2020. [Google Scholar]
- Khomsay, S.; Vanijjirattikhan, R.; Suwatthikul, J. Cough Detection Using PCA and Deep Learning. In Proceedings of the International Conference Information Communication Technology Convergence (ICTC), Jeju Island, Korea, 16–18 October 2019; pp. 101–106. [Google Scholar]
- Martinek, J.; Zatko, T.; Tatar, M.; Javorka, M. Distinction of Cough from Other Sounds Produced by Daily Activities in the Upper Airways. Bratisl. Lek. Listy 2011, 112, 120–124. [Google Scholar] [PubMed]
- Sharan, R.V.; Abeyratne, U.R.; Swarnkar, V.R.; Porter, P. Cough Sound Analysis for Diagnosing Croup in Pediatric Patients Using Biologically Inspired Features. In Proceedings of the 39th Annual International Conference IEEE Engineering Medicine Biology Society (EMBC), Jeju Island, Korea, 11–15 July 2017; pp. 4578–4581. [Google Scholar]
- Abeyratne, U.R.; Swarnkar, V.; Setyati, A.; Triasih, R. Cough Sound Analysis Can Rapidly Diagnose Childhood Pneumonia. Ann. Biomed. Eng. 2013, 41, 2448–2462. [Google Scholar] [CrossRef]
- Kosasih, K.; Abeyratne, U.R.; Swarnkar, V.; Triasih, R. Wavelet Augmented Cough Analysis for Rapid Childhood Pneumonia Diagnosis. IEEE Trans. Biomed. Eng. 2015, 62, 1185–1194. [Google Scholar] [CrossRef]
- Moradshahi, P.; Chatrzarrin, H.; Goubran, R. Improving the Performance of Cough Sound Discriminator in Reverberant Environments Using Microphone Array. In Proceedings of the IEEE Instrumentation and Measurement Technology Conference, Graz, Austria, 13–16 May 2012; pp. 20–23. [Google Scholar]
- Swarnkar, V.; Abeyratne, U.R.; Amrulloh, Y.A.; Chang, A. Automated Algorithm for Wet/Dry Cough Sounds Classification. In Proceedings of the Annu. International Conference IEEE Engineering Medicine Biology Society (EMBC), San Diego, CA, USA, 28 August–1 September 2012; pp. 3147–3150. [Google Scholar]
- Swarnkar, V.; Abeyratne, U.R.; Chang, A.B.; Amrulloh, Y.A.; Setyati, A.; Triasih, R. Automatic Identification of Wet and Dry Cough in Pediatric Patients with Respiratory Diseases. Ann. Biomed. Eng. 2013, 41, 1016–1028. [Google Scholar] [CrossRef] [PubMed]
- Infante, C.; Chamberlain, D.B.; Kodgule, R.; Fletcher, R.R. Classification of Voluntary Coughs Applied to the Screening of Respiratory Disease. In Proceedings of the 39th Annu. International Conference IEEE Engineering Medicine Biology Society (EMBC), Jeju Island, Korea, 11–15 July 2017; pp. 1413–1416. [Google Scholar]
- Nemati, E.; Rahman, M.M.; Nathan, V.; Vatanparvar, K.; Kuang, J. Poster Abstract: A Comprehensive Approach for Cough Type Detection. In Proceedings of the Second IEEE/ACM International Conference on Connected Health: Applications, Systems and Engineering Technologies (CHASE), Philadelphia, PA, USA, 17–19 July 2017; pp. 15–16. [Google Scholar]
- Moradshahi, P.; Chatrzarrin, H.; Goubran, R. Cough Sound Discrimination in Noisy Environments Using Microphone Array. In Proceedings of the IEEE International Instrumentation and Measurement Technology Conference (I2MTC), Minneapolis, MN, USA, 6–9 May 2013; pp. 431–434. [Google Scholar]
- Schröder, J.; Anemuller, J.; Goetze, S. Classification of Human Cough Signals Using Spectro-Temporal Gabor Filterbank Features. In Proceedings of the IEEE International Conference Acoust. Speech Signal Processing (ICASSP), Shanghai, China, 20–25 March 2016; pp. 6455–6459. [Google Scholar]
- Hirtum, A.V.; Berckmans, D. Automated Recognition of Spontaneous versus Voluntary Cough. Med. Eng. Phys. 2002, 24, 541–545. [Google Scholar] [CrossRef]
- Infante, C.; Chamberlain, D.; Fletcher, R.; Thorat, Y.; Kodgule, R. Use of Cough Sounds for Diagnosis and Screening of Pulmonary Disease. In Proceedings of the IEEE Global Humanitarian Technology Conference (GHTC), San Jose, CA, USA, 19–22 October 2017; pp. 1–10. [Google Scholar]
- Yadav, S.; NK, K.; Gope, D.; Krishnaswamy, U.M.; Ghosh, P.K. Comparison of Cough, Wheeze and Sustained Phonations for Automatic Classification Between Healthy Subjects and Asthmatic Patients. In Proceedings of the 40th Annual International Conference IEEE Engineering Medicine Biology Society (EMBC), Honolulu, HI, USA, 17–21 July 2018; pp. 1400–1403. [Google Scholar]
- BT, B.; Hee, H.I.; Teoh, O.H.; Lee, K.P.; Kapoor, S.; Herremans, D.; Chen, J.-M. Asthmatic versus Healthy Child Classification Based on Cough and Vocalised /a:/ Sounds. J. Acoust. Society Am. 2020, 148, EL253–EL259. [Google Scholar] [CrossRef]
- Hee, H.I.; Balamurali, B.; Karunakaran, A.; Herremans, D.; Teoh, O.H.; Lee, K.P.; Teng, S.S.; Lui, S.; Chen, J.M. Development of Machine Learning for Asthmatic and Healthy Voluntary Cough Sounds: A Proof of Concept Study. Appl. Sci. 2019, 9, 2833. [Google Scholar] [CrossRef] [Green Version]
- Al-Khassaweneh, M.; Abdelrahman, R.B. A Signal Processing Approach for the Diagnosis of Asthma from Cough Sounds. J. Med. Engineering Technol. 2013, 37, 165–171. [Google Scholar] [CrossRef]
- Moschovis, P.P.; Sampayo, E.M.; Porter, P.; Abeyratne, U.; Doros, G.; Swarnkar, V.; Sharan, R.; Carl, J.C. A Cough Analysis Smartphone Application for Diagnosis of Acute Respiratory Illnesses in Children. In Proceedings of the A27. Pediatric Lung Infection and Critical Care Around the World, Dallas, TX, USA, 17–22 May 2019; American Thoracic Society: New York, NY, USA. [Google Scholar]
- Rhee, H.; Belyea, M.J.; Sterling, M.; Bocko, M.F. Evaluating the Validity of an Automated Device for Asthma Monitoring for Adolescents: Correlational Design. J. Med. Internet Res. 2015, 17, e234. [Google Scholar] [CrossRef] [Green Version]
- Claxton, S.; Porter, P.; Brisbane, J.; Bear, N.; Peltonin; Woods, J.; Smith, C.; Purdie, F.; Abeyratne, U. Detection of Asthma Exacerbation in Adolescent and Adult Subjects with Chronic Asthma Using a Cough- Centred, Smartphone-Based Algorithm. Respirology 2020, 25, 115. [Google Scholar] [CrossRef]
- Porter, P.; Brisbane, J.; Abeyratne, U.; Bear, N.; Wood, J.; Peltonen, V.; Della, P.; Smith, C.; Claxton, S. Diagnosing Community-Acquired Pneumonia via a Smartphone-Based Algorithm: A Prospective Cohort Study in Primary and Acute-Care Consultations. Br. J. Gen. Pract. 2021, 71, e258–e265. [Google Scholar] [CrossRef] [PubMed]
- Porter, P.; Claxton, S.; Brisbane, J.; Purdie, F.; Smith, C.; Wood, J.; Peltonen, V.; Bear, N.; Abeyratne, U. Diagnosis of Lower Respiratory Tract Disease (LRTD) and Pneumonia Using a Smartphone-Based Cough-Centred Algorithm in an Adolescent and Adult Acute-Care Cohort. Respirology 2019, 24, 23. [Google Scholar] [CrossRef]
- Amrulloh, Y.; Abeyratne, U.; Swarnkar, V.; Triasih, R. Cough Sound Analysis for Pneumonia and Asthma Classification in Pediatric Population. In Proceedings of the 6th International Conference on Intelligent Systems, Modelling and Simulation, Kuala Lumpur, Malaysia, 9–12 February 2015; pp. 127–131. [Google Scholar]
- Parker, D.; Picone, J.; Harati, A.; Lu, S.; Jenkyns, M.H.; Polgreen, P.M. Detecting Paroxysmal Coughing from Pertussis Cases Using Voice Recognition Technology. PLoS ONE 2014, 8, 1–5. [Google Scholar] [CrossRef] [Green Version]
- Windmon, A.; Minakshi, M.; Bharti, P.; Chellappan, S.; Johansson, M.; Jenkins, B.A.; Athilingam, P.R. TussisWatch: A Smart-Phone System to Identify Cough Episodes as Early Symptoms of Chronic Obstructive Pulmonary Disease and Congestive Heart Failure. IEEE J. Biomed. Health Inform. 2019, 23, 1566–1573. [Google Scholar] [CrossRef] [PubMed]
- Windmon, A.; Minakshi, M.; Chellappan, S.; Athilingam, P.; Johansson, M.; Jenkins, B.A. On Detecting Chronic Obstructive Pulmonary Disease (COPD) Cough Using Audio Signals Recorded from Smart-Phones. In Proceedings of the 11th International Joint Conference Biomedical Engineering Systems and Technologies (HEALTHINF), Funchal, Portugal, 19ߝ21 January 2018; SciTePress: Funchal, Portugal, 2018; pp. 329–338. [Google Scholar]
- Porter, P.; Claxton, S.; Wood, J.; Peltonen, V.; Brisbane, J.; Purdie, F.; Smith, C.; Bear, N.; Abeyratne, U. Late Breaking Abstract—Diagnosis of Chronic Obstructive Pulmonary Disease (COPD) Exacerbations Using a Smartphone-Based, Cough-Centred Algorithm. Eur. Respir. J. 2019, 54, PA4278. [Google Scholar] [CrossRef]
- Porter, P.; Claxton, S.; Brisbane, J.; Bear, N.; Wood, J.; Peltonen, V.; Della, P.; Purdie, F.; Smith, C.; Abeyratne, U. Diagnosing Chronic Obstructive Airway Disease on a Smartphone Using Patient-Reported Symptoms and Cough Analysis: Diagnostic Accuracy Study. JMIR Res. 2020, 4, e24587. [Google Scholar] [CrossRef] [PubMed]
- Knocikova, J.; Korpas, J.; Vrabec, M.; Javorka, M. Wavelet Analysis of Voluntary Cough Sound in Patients with Respiratory Diseases. J. Physiol. Pharmacol. 2008, 59 (Suppl. S6), 331–340. [Google Scholar] [PubMed]
- Bhateja, V.; Taquee, A.; Sharma, D.K. Pre-Processing and Classification of Cough Sounds in Noisy Environment Using SVM. In Proceedings of the 4th International Conference on Information Systems and Computer Networks (ISCON), Mathura, India, 21–22 November 2019; pp. 822–826. [Google Scholar]
- Taquee, A.; Bhateja, V. Cough Sound Analysis in Transform Domain for Classification of Respiratory Disorders. In Proceedings of the Intelligent System Design; Satapathy, S.C., Bhateja, V., Janakiramaiah, B., Chen, Y.-W., Eds.; Springer Singapore: Singapore, 2020; pp. 865–872. [Google Scholar]
- Monge-Álvarez, J.; Hoyos-Barceló, C.; Lesso, P.; Escudero, J.; Dahal, K.; Casaseca-de-la-Higuera, P. Effect of Importance Sampling on Robust Segmentation of Audio-Cough Events in Noisy Environments. In Proceedings of the 38th Annual International Conference IEEE Engineering Medicine Biology Society (EMBC), Orlando, FL, USA, 16–20 August 2016; pp. 3740–3744. [Google Scholar]
- Monge-Álvarez, J.; Hoyos-Barceló, C.; Lesso, P.; Casaseca-de-la-Higuera, P. Robust Detection of Audio-Cough Events Using Local Hu Moments. IEEE J. Biomed. Health Inform. 2019, 23, 184–196. [Google Scholar] [CrossRef] [Green Version]
- Monge-Álvarez, J.; Hoyos-Barceló, C.; San-é-Revuelta, L.M.; Casaseca-de-la-Higuera, P. A Machine Hearing System for Robust Cough Detection Based on a High-Level Representation of Band-Specific Audio Features. IEEE Trans. Biomed. Eng. 2019, 66, 2319–2330. [Google Scholar] [CrossRef] [Green Version]
- Casaseca-de-la-Higuera, P.; Lesso, P.; McKinstry, B.; Pinnock, H.; Rabinovich, R.; McCloughan, L.; Monge-Álvarez, J. Effect of Downsampling and Compressive Sensing on Audio-Based Continuous Cough Monitoring. In Proceedings of the 37th Annual International Conference IEEE Engineering Medicine Biology Society (EMBC), Orlando, FL, USA, 16–20 August 2016; pp. 6231–6235. [Google Scholar]
- Hao, T.; Xing, G.; Zhou, G. ISleep: Unobtrusive Sleep Quality Monitoring Using Smartphones. In Proceedings of the 11th ACM Conference Embedded Networked Sensor Systems, Rome, Italy, 11–15 November 2013; Association for Computing Machinery: Roma, Italy, 2013; p. 14. [Google Scholar]
- Hoyos-Barceló, C.; Monge-Álvarez, J.; Shakir, M.Z.; Alcaraz-Calero, J.-M.; Casaseca-de-la-Higuera, P. Efficient K-NN Implementation for Real-Time Detection of Cough Events in Smartphones. IEEE J. Biomed. Health Inform. 2018, 22, 1662–1671. [Google Scholar] [CrossRef] [PubMed] [Green Version]
- Hoyos-Barceló, C.; Monge-Álvarez, J.; Pervez, Z.; San-José-Revuelta, L.M.; Casaseca-de-la-Higuera, P. Efficient Computation of Image Moments for Robust Cough Detection Using Smartphones. Comput. Biology Med. 2018, 100, 176–185. [Google Scholar] [CrossRef] [PubMed] [Green Version]
- Barata, F.; Kipfer, K.; Weber, M.; Tinschert, P.; Fleisch, E.; Kowatsch, T. Towards Device-Agnostic Mobile Cough Detection with Convolutional Neural Networks. In Proceedings of the IEEE International Conference Healthcare Informatics (ICHI), Xi’an, China, 10–13 June 2019; pp. 1–11. [Google Scholar]
- Rhee, H.; Miner, S.; Sterling, M.; Halterman, J.S.; Fairbanks, E. The Development of an Automated Device for Asthma Monitoring for Adolescents: Methodologic Approach and User Acceptability. JMIR Mhealth Uhealth 2014, 2, e27. [Google Scholar] [CrossRef] [PubMed]
- Sun, Z.; Purohit, A.; Yang, K.; Pattan, N.; Siewiorek, D.; Lane, I.; Zhang, P. Coughloc: Location-Aware Indoor Acoustic Sensing for Non-Intrusive Cough Detection. In Proceedings of the International Workshop on Emerging Mobile Sensing Technologies, San Francisco, CA, USA, 12–15 June 2011; Systems, and Applications: San Francisco, CA, USA. [Google Scholar]
- Den Brinker, A.C.; Coman, M.; Ouweltjes, O.; Crooks, M.G.; Thackray-Nocera, S.; Morice, A.H. Performance Requirements for Cough Classifiers in Real-World Applications. In Proceedings of the 28th European Signal Processing Conference (EUSIPCO), Dublin, Ireland, 23–27 August 2021; pp. 96–100. [Google Scholar]
- Elfaramawy, T.; Fall, C.L.; Morissette, M.; Lellouche, F.; Gosselin, B. Wireless Respiratory Monitoring and Coughing Detection Using a Wearable Patch Sensor Network. In Proceedings of the 15th IEEE International New Circuits Systems Conference (NEWCAS), Strasbourg, France, 25–28 June 2017; pp. 197–200. [Google Scholar]
- Elfaramawy, T.; Fall, C.L.; Arab, S.; Morissette, M.; Lellouche, F.; Gosselin, B. A Wireless Respiratory Monitoring System Using a Wearable Patch Sensor Network. IEEE Sens. J. 2019, 19, 650–657. [Google Scholar] [CrossRef]
- Drugman, T. Using Mutual Information in Supervised Temporal Event Detection: Application to Cough Detection. Biomed. Signal Processing Control. 2014, 10, 50–57. [Google Scholar] [CrossRef]
- Kulnik, S.T.; Williams, N.M.; Kalra, L.; Moxham, J.; Birring, S.S. Cough Frequency Monitors: Can They Discriminate Patient from Environmental Coughs? J. Thorac. Dis. 2016, 8, 3152–3159. [Google Scholar] [CrossRef] [PubMed] [Green Version]
- Larson, E.C.; Lee, T.; Liu, S.; Rosenfeld, M.; Patel, S.N. Accurate and Privacy Preserving Cough Sensing Using a Low-Cost Microphone. In Proceedings of the 13th International Conference Ubiquitous Computing, Beijing, China, 17–21 September 2011; Association for Computing Machinery: New York, NY, USA, 2011; pp. 375–384. [Google Scholar]
- Nemati, E.; Rahman, M.M.; Nathan, V.; Kuang, J. Private Audio-Based Cough Sensing for In-Home Pulmonary Assessment Using Mobile Devices. In Proceedings of the 13th EAI International Conference on Body Area Networks, Oulu, Finland, 2–3 October 2018; Sugimoto, C., Farhadi, H., Hämäläinen, M., Eds.; Springer International Publishing: Cham, Switzerland, 2018; pp. 221–232. [Google Scholar]
- Liu, J.; You, M.; Li, G.; Wang, Z.; Xu, X.; Qiu, Z.; Xie, W.; An, C.; Chen, S. Cough Signal Recognition with Gammatone Cepstral Coefficients. In Proceedings of the IEEE China Summit International Conference Signal Information Processing, Beijing, China, 6–10 July 2013; pp. 160–164. [Google Scholar]
- Miranda, I.D.S.; Diacon, A.H.; Niesler, T.R. A Comparative Study of Features for Acoustic Cough Detection Using Deep Architectures*. In Proceedings of the 41st Annual International Conference IEEE Engineering Medicine Biology Society (EMBC), Berlin, Germany, 23–27 July 2019; pp. 2601–2605. [Google Scholar]
- Nguyen, K.A.; Luo, Z. Cover Your Cough: Detection of Respiratory Events with Confidence Using a Smartwatch. In Proceedings of the 7th Workshop Conformal and Probabilistic Prediction and Applications, Maastricht, The Netherlands, 11–13 June 2018; 2018; Volume 91, pp. 114–131. [Google Scholar]
- Crooks, M.G.; den Brinker, A.; Hayman, Y.; Williamson, J.D.; Innes, A.; Wright, C.E.; Hill, P.; Morice, A.H. Continuous Cough Monitoring Using Ambient Sound Recording During Convalescence from a COPD Exacerbation. Lung 2017, 195, 289–294. [Google Scholar] [CrossRef]
- Martinek, J.; Tatar, M.; Javorka, M. Distinction between Voluntary Cough Sound and Speech in Volunteers by Spectral and Complexity Analysis. J. Physiol. Pharmacol. Off. J. Pol. Physiol. Society 2008, 59 (Suppl. S6), 433–440. [Google Scholar]
- Vhaduri, S.; Brunschwiler, T. Towards Automatic Cough and Snore Detection. In Proceedings of the IEEE International Conference Healthcare Inform. (ICHI), Xi’an, China, 10–13 June 2019; p. 1. [Google Scholar]
- Vhaduri, S.; Kessel, T.V.; Ko, B.; Wood, D.; Wang, S.; Brunschwiler, T. Nocturnal Cough and Snore Detection in Noisy Environments Using Smartphone-Microphones. In Proceedings of the IEEE International Conference Healthcare Informatics (ICHI), Xi’an, China, 10–13 June 2019; pp. 1–7. [Google Scholar]
- Liu, J.-M.; You, M.; Wang, Z.; Li, G.-Z.; Xu, X.; Qiu, Z. Cough Event Classification by Pretrained Deep Neural Network. BMC Med. Inform. Decis. Mak. 2015, 15, S2. [Google Scholar] [CrossRef]
- Kvapilova, L.; Boza, V.; Dubec, P.; Majernik, M.; Bogar, J.; Jamison, J.; Goldsack, J.; Kimmel, D.; Karlin, D. Continuous Sound Collection Using Smartphones and Machine Learning to Measure Cough. Digit. Biomark. 2019, 3, 166–175. [Google Scholar] [CrossRef]
- Sterling, M.; Rhee, H.; Bocko, M. Automated Cough Assessment on a Mobile Platform. J. Med. Engineering 2014, 2014, 951621. [Google Scholar] [CrossRef] [PubMed]
- Lúcio, C.; Teixeira, C.; Henriques, J.; de Carvalho, P.; Paiva, R.P. Voluntary Cough Detection by Internal Sound Analysis. In Proceedings of the 7th International Conference Biomed. Engineering Informatics, Dalian, China, 14–16 October 2014; pp. 405–409. [Google Scholar]
- Pramono, R.X.A.; Imtiaz, S.A.; Rodriguez-Villegas, E. Automatic Cough Detection in Acoustic Signal Using Spectral Features. In Proceedings of the 41st Annual International Conference IEEE Engineering Medicine Biology Society (EMBC), Berlin, Germany, 23–27 July 2019; pp. 7153–7156. [Google Scholar]
- Kadambi, P.; Mohanty, A.; Ren, H.; Smith, J.; McGuinnes, K.; Holt, K.; Furtwaengler, A.; Slepetys, R.; Yang, Z.; Seo, J.; et al. Towards a Wearable Cough Detector Based on Neural Networks. In Proceedings of the IEEE International Conference Acoustics Speech Signal Processing (ICASSP), Calgary, Canada, 15–20 April 2018; pp. 2161–2165. [Google Scholar]
- Swarnkar, V.; Abeyratne, U.R.; Amrulloh, Y.; Hukins, C.; Triasih, R.; Setyati, A. Neural Network Based Algorithm for Automatic Identification of Cough Sounds. In Proceedings of the 35th Annual International Conference IEEE Engineering Medicine Biology Society (EMBC), Osaka, Japan, 3–7 July 2013; pp. 1764–1767. [Google Scholar]
- Amrulloh, Y.A.; Abeyratne, U.R.; Swarnkar, V.; Triasih, R.; Setyati, A. Automatic Cough Segmentation from Non-Contact Sound Recordings in Pediatric Wards. Biomed. Signal Processing Control. 2015, 21, 126–136. [Google Scholar] [CrossRef] [Green Version]
- Corrigan, D.L.; Paton, J.Y. Pilot Study of Objective Cough Monitoring in Infants. Pediatric Pulmonol. 2003, 35, 350–357. [Google Scholar] [CrossRef] [PubMed]
- Leconte, S.; Liistro, G.; Lebecque, P.; Degryse, J.-M. The Objective Assessment of Cough Frequency: Accuracy of the LR102 Device. Cough 2011, 7, 11. [Google Scholar] [CrossRef] [PubMed] [Green Version]
- Rocha, B.M.; Pessoa, D.; Marques, A.; Carvalho, P.; Paiva, R.P. Personalized Detection of Explosive Cough Events in Patients with Pulmonary Disease. In Proceedings of the IEEE 20th Mediterranean Electrotec. Conference (MELECON), Palermo, Italy, 16–18 June 2020; pp. 249–301. [Google Scholar]
- Amoh, J.; Odame, K. DeepCough: A Deep Convolutional Neural Network in a Wearable Cough Detection System. In Proceedings of the IEEE Biomedical Circuits and Systems Conference (BioCAS), Atlanta, GA, USA, 22–24 October 2015; pp. 1–4. [Google Scholar]
- Amoh, J.; Odame, K. Deep Neural Networks for Identifying Cough Sounds. IEEE Trans. Biomed. Circuits Syst. 2016, 10, 1003–1011. [Google Scholar] [CrossRef] [PubMed]
- Martinek, J.; Klvco, P.; Vrabec, M.; Zatko, T.; Tatar, M.; Javorka, M. Cough Sound Analysis. Acta Med. Martiniana 2013, 13, 15–20. [Google Scholar] [CrossRef] [Green Version]
- Klco, P.; Kollarik, M.; Tatar, M. Novel Computer Algorithm for Cough Monitoring Based on Octonions. Respir. Physiol. NeuroBiology 2018, 257, 36–41. [Google Scholar] [CrossRef]
- You, M.; Wang, H.; Liu, Z.; Chen, C.; Liu, J.; Xu, X.; Qiu, Z. Novel Feature Extraction Method for Cough Detection Using NMF. IET Signal. Process. 2017, 11, 515–520. [Google Scholar] [CrossRef]
- You, M.; Liu, Z.; Chen, C.; Liu, J.; Xu, X.-H.; Qiu, Z.-M. Cough Detection by Ensembling Multiple Frequency Subband Features. Biomed. Signal Process. Control. 2017, 33, 132–140. [Google Scholar] [CrossRef]
- Murata, A.; Ohota, N.; Shibuya, A.; Ono, H.; Kudoh, S. New Non-Invasive Automatic Cough Counting Program Based on 6 Types of Classified Cough Sounds. Intern. Med. 2006, 45, 391–397. [Google Scholar] [CrossRef] [Green Version]
- Salmi, T.; Sovijärvi, A.R.A.; Brander, P.; Piirilä, P. Long-Term Recording and Automatic Analysis of Cough Using Filtered Acoustic Signals and Movements on Static Charge Sensitive Bed. Chest 1988, 94, 970–975. [Google Scholar] [CrossRef] [PubMed] [Green Version]
- Mlynczak, M.; Pariaszewska, K.; Cybulski, G. Automatic Cough Episode Detection Using a Vibroacoustic Sensor. In Proceedings of the 37th Annual International Conference IEEE Engineering Medicine Biology Society (EMBC), Milan, Italy, 25–29 August 2015; pp. 2808–2811. [Google Scholar]
- Adhi Pramono, R.X.; Anas Imtiaz, S.; Rodriguez-Villegas, E. Automatic Identification of Cough Events from Acoustic Signals. In Proceedings of the 41st Annual International Conference of the IEEE Engineering in Medicine and Biology Society (EMBC), Berlin, Germany, 23–27 July 2019; pp. 217–220. [Google Scholar]
- Hoyos-Barceló, C.; Garmendia-Leiza, J.R.; Aguilar-García, M.D.; Monge-Álvarez, J.; Pérez-Alonso, D.A.; Alberola-López, C.; Casaseca-de-la-Higuera, P. Evaluation in a Real Environment of a Trainable Cough Monitoring App for Smartphones. In Proceedings of the 15th Mediterranean Conference Medical Biology Engineering Computing (MEDICON), Coimbra, Portugal, 26–28 September 2019; Henriques, J., Neves, N., de Carvalho, P., Eds.; Springer International Publishing: Cham, Switzerland, 2019; pp. 1175–1180. [Google Scholar]
- Tracey, B.H.; Comina, G.; Larson, S.; Bravard, M.; López, J.W.; Gilman, R.H. Cough Detection Algorithm for Monitoring Patient Recovery from Pulmonary Tuberculosis. In Proceedings of the Annual International Conference IEEE Engineering Medicine Biology Society, Boston, MA, USA, 30 August–3 September 2011; pp. 6017–6020. [Google Scholar]
- Larson, S.; Comina, G.; Gilman, R.H.; Tracey, B.H.; Bravard, M.; López, J.W. Validation of an Automated Cough Detection Algorithm for Tracking Recovery of Pulmonary Tuberculosis Patients. PLoS ONE 2012, 7, 1–10. [Google Scholar] [CrossRef] [PubMed] [Green Version]
- Fan, J.; Comina, G.; Gilman, R.; Lopez, J.; Tracey, B.H. Cough Monitoring for Pulmonary Tuberculosis Using Combined Microphone/Accelerometer Measurements. J. Acoust. Society Am. 2014, 135, 2268. [Google Scholar] [CrossRef]
- Pham, C. MobiCough: Real-Time Cough Detection and Monitoring Using Low-Cost Mobile Devices. In Proceedings of the Intelligent Information and Database Systems, Da Nang, Vietnam, 14–16 March 2016; Nguyen, N.T., Trawiński, B., Fujita, H., Hong, T.-P., Eds.; Springer: Berlin/Heidelberg, Germany, 2016; pp. 300–309. [Google Scholar]
- Perna, L.D.; Spina, G.; Thackray-Nocera, S.; Crooks, M.G.; Morice, A.H.; Soda, P.; Brinker, A.C. den An Automated and Unobtrusive System for Cough Detection. In Proceedings of the IEEE Life Science Conference (LSC), Sydney, Australia, 13–15 December 2017; pp. 190–193. [Google Scholar]
- Liaqat, D.; Wu, R.; Son, T.; Gershon, A.; Alshaer, H.; de Lara, E.; Rudzicz, F. Towards Ambulatory Cough Monitoring Using Smartwatches. In Proceedings of the American Thoracic Society International Conference, San Diego, CA, USA, 18–23 May 2018. [Google Scholar]
- Liaqat, D.; Liaqat, S.; Chen, J.L.; Sedaghat, T.; Gabel, M.; Rudzicz, F.; de Lara, E. Coughwatch: Real-World Cough Detection Using Smartwatches. In Proceedings of the IEEE International Conference on Acoustics, Speech and Signal Processing (ICASSP), Toronto, ON, Canada, 6–11 June 2021; pp. 8333–8337. [Google Scholar]
- Simou, N.; Stefanakis, N.; Zervas, P. A Universal System for Cough Detection in Domestic Acoustic Environments. In Proceedings of the 28th European Signal Processing Conference (EUSIPCO), Dublin, Ireland, 23–27 August 2021; pp. 111–115. [Google Scholar]
- Drugman, T.; Urbain, J.; Dutoit, T. Assessment of Audio Features for Automatic Cough Detection. In Proceedings of the 19th European Signal Processing Conference, Barcelona, Spain, 29 August–2 September 2011; pp. 1289–1293. [Google Scholar]
- Drugman, T.; Urbain, J.; Bauwens, N.; Chessini, R.; Aubriot, A.-S.; Lebecque, P.; Dutoit, T. Audio and Contact Microphones for Cough Detection. In Proceedings of the 13th Annual Conference International Speech Communication AsSociety (INTERSPEECH), Portland, OR, USA, 9–13 September 2012; Volume 2, pp. 1303–1306. [Google Scholar]
- Matos, S.; Birring, S.S.; Pavord, I.D.; Evans, H. Detection of Cough Signals in Continuous Audio Recordings Using Hidden Markov Models. IEEE Trans. Biomed. Engineering 2006, 53, 1078–1083. [Google Scholar] [CrossRef] [PubMed]
- Matos, S.; Birring, S.S.; Pavord, I.D.; Evans, D.H. An Automated System for 24-h Monitoring of Cough Frequency: The Leicester Cough Monitor. IEEE Trans. Biomed. Engineering 2007, 54, 1472–1479. [Google Scholar] [CrossRef]
- Birring, S.S.; Fleming, T.; Matos, S.; Raj, A.A.; Evans, D.H.; Pavord, I.D. The Leicester Cough Monitor: Preliminary Validation of an Automated Cough Detection System in Chronic Cough. Eur. Respir. J. 2008, 31, 1013–1018. [Google Scholar] [CrossRef] [Green Version]
- Hata, Y.; Kobashi, S.; Yamaguchi, H.; Ishikawa, O.; Tsuchiya, N.; Nakajima, H. Human Health Monitoring System of Systems by Non-Contacted Senors. In Proceedings of the IEEE International Conference System of Systems Engineering (SoSE), Albuquerque, NM, USA, 30 May–3 June 2009; pp. 1–5. [Google Scholar]
- Krajnik, M.; Damps-Konstanska, I.; Gorska, L.; Jassem, E. A Portable Automatic Cough Analyser in the Ambulatory Assessment of Cough. Biomed. Eng. Online 2010, 9, 17. [Google Scholar] [CrossRef] [Green Version]
- Liu, J.; You, M.; Wang, Z.; Li, G.; Xu, X.; Qiu, Z. Cough Detection Using Deep Neural Networks. In Proceedings of the IEEE International Conference BioInformation Biomedicine (BIBM), Houston, TX, USA, 9–12 December 2021; pp. 560–563. [Google Scholar]
- Xiao, Y.; Carson, D.; Boris, L.; Mabary, J.; Lin, Z.; Nicodème, F.; Cuttica, M.; Kahrilas, P.J.; Pandolfino, J.E. The Acoustic Cough Monitoring and Manometric Profile of Cough and Throat Clearing. Dis. Esophagus 2014, 27, 5–12. [Google Scholar] [CrossRef] [Green Version]
- Mahmoudi, S.A.; Da Cunha Possa, P.; Ravet, T.; Drugman, T.; Chessini, R.; Dutoit, T.; Valderrama, C. Sensor-Based System for Automatic Cough Detection and Classiffication. ICT Innov. 2015, 2015, 270–280. [Google Scholar]
- Pop, G.; Cucu, H.; Burileanu, D.; Burileanu, C. Cough Sound Recognition in Respiratory Disease Epidemics. Rom. J. Information Sci. Technol. 2020, 23, 77–88. [Google Scholar]
- Rocha, B.M.; Mendes, L.; Chouvarda, I.; Carvalho, P.; Paiva, R.P. Detection of Cough and Adventitious Respiratory Sounds in Audio Recordings by Internal Sound Analysis. In Proceedings of the International Conference Biomed. Health Information (ICBHI), Thesaloniki, Greece, 18–21 November 2017; Maglaveras, N., Chouvarda, I., de Carvalho, P., Guo-Zheng, L., Eds.; Springer Singapore: Singapore , 2017; pp. 51–55. [Google Scholar]
- Hui-Hui, W.; Jia-Ming, L.; Mingyu, Y.; Guo-Zheng, L. Audio Signals Encoding for Cough Classification Using Convolutional Neural Networks: A Comparative Study. In Proceedings of the IEEE International Conference BioInformation Biomed, Washington, DC, USA, 9–12 November 2015; pp. 442–445. [Google Scholar]
- Cai, Y.; Xu, W. The Best Input Feature When Using Convolutional Neural Network for Cough Recognition. J. Phys. Conference Ser. 2021, 1865, 042111. [Google Scholar] [CrossRef]
- Zhou, Q.; Shan, J.; Ding, W.; Wang, C.; Yuan, S.; Sun, F.; Li, H.; Fang, B. Cough Recognition Based on Mel-Spectrogram and Convolutional Neural Network. Front. Robot. AI 2021, 8, 112. [Google Scholar] [CrossRef] [PubMed]
- Sumner, H.; Kelsall, A.; Woodcock, A.A.; Smith, J.; McGuinness, K. A Semi Automatic Method to Reduce the Time Taken for Manual Cough Counting. In D28. Itching and Twitching in the Airways: Nerves and Cough; American Thoracic Society: New York, NY, USA, 2010; p. A5555. [Google Scholar]
- McGuinness, K.; Holt, K.; Dockry, R.; Smith, J. P159 Validation of the VitaloJAKTM 24 Hour Ambulatory Cough Monitor. Thorax 2012, 67, A131. [Google Scholar] [CrossRef] [Green Version]
- Hamutcu, R.; Francis, J.; Karakoc, F.; Bush, A. Objective Monitoring of Cough in Children with Cystic Fibrosis. Pediatric Pulmonol. 2002, 34, 331–335. [Google Scholar] [CrossRef] [PubMed]
- Barton, A.; Gaydecki, P.; Holt, K.; Smith, J.A. Data Reduction for Cough Studies Using Distribution of Audio Frequency Content. Cough 2012, 8, 12. [Google Scholar] [CrossRef] [PubMed] [Green Version]
- Sun, X.; Lu, Z.; Hu, W.; Cao, G. SymDetector: Detecting Sound-Related Respiratory Symptoms Using Smartphones. In Proceedings of the ACM International Joint Conference Pervasive Ubiquitous Computing (UbiComp), Osaka, Japan, 7–11 September 2015; Association for Computing Machinery, Inc.: New York, NY, USA, 2015; pp. 97–108. [Google Scholar]
- Temko, A.; Macho, D.; Nadeu, C. Fuzzy Integral Based Information Fusion for Classification of Highly Confusable Non-Speech Sounds. Pattern Recognit. 2008, 41, 1814–1823. [Google Scholar] [CrossRef] [Green Version]
- Yatani, K.; Truong, K.N. BodyScope: A Wearable Acoustic Sensor for Activity Recognition. In Proceedings of the ACM Conference Ubiquitous Computing, Pittsburgh, PA, USA, 5–8 September 2012; Association for Computing Machinery: New York, NY, USA, 2012; pp. 341–350. [Google Scholar]
- Subburaj, S.; Parvez, L.; Rajagopalan, T.G. Methods of Recording and Analysing Cough Sounds. Pulm. Pharmacol. 1996, 9, 269–279. [Google Scholar] [CrossRef]
- Gross, V.; Reinke, C.; Dette, F.; Koch, R.; Vasilescu, D.; Penzel, T.; Koehler, U. Mobile Nocturnal Long-Term Monitoring of Wheezing and Cough. Biomed. Engineering Biomed. Tech. 2007, 52, 73–76. [Google Scholar] [CrossRef]
- Davis, S.; Mermelstein, P. Comparison of Parametric Representations for Monosyllabic Word Recognition in Continuously Spoken Sentences. IEEE Trans. Acoust. Speech Signal Processing 1980, 28, 357–366. [Google Scholar] [CrossRef] [Green Version]
- Orlandic, L.; Teijeiro, T.; Atienza, D. The COUGHVID Crowdsourcing Dataset: A Corpus for the Study of Large-Scale Cough Analysis Algorithms. arxiv 2020. [Google Scholar] [CrossRef]
- Sharma, N.; Krishnan, P.; Kumar, R.; Ramoji, S.; Chetupalli, S.R.; R, N.; Ghosh, P.K.; Ganapathy, S. Coswara—A Database of Breathing, Cough, and Voice Sounds for COVID-19 Diagnosis. In Proceedings of the Interspeech 2020, Shanghai, China, 25–29 October 2020; pp. 4811–4815. [Google Scholar]


| Ref. | Cough Type | Subject Characteristics | Lung Condition | Disease | ||||||||||||||||||||||||
|---|---|---|---|---|---|---|---|---|---|---|---|---|---|---|---|---|---|---|---|---|---|---|---|---|---|---|---|---|
| Wet | Dry | Productive | Non-Productive | Spontaneous | Voluntary | Induced | Healthy | Unhealthy | Male | Female | Obstructive | Restrictive | Normal | Croup | Pneumonia | Asthma | Pertussis | COPD | Heart Failure | Tuberculosis | Bronchitis | Bronchiolitis | COVID-19 | Cold | LRTD | Upper RespiratoryTract Disease | n/a | |
| [70,79,92,93,94,95,96,97] | X | X | ||||||||||||||||||||||||||
| [98] | X | X | ||||||||||||||||||||||||||
| [87] | X | X | ||||||||||||||||||||||||||
| [99] | X | X | ||||||||||||||||||||||||||
| [88] | X | X | ||||||||||||||||||||||||||
| [33,100] | X | X | ||||||||||||||||||||||||||
| [100] | X | X | ||||||||||||||||||||||||||
| [29] | X | X | X | |||||||||||||||||||||||||
| [30,101,102,103,104,105,106] | X | X | ||||||||||||||||||||||||||
| [59,85,107] | X | |||||||||||||||||||||||||||
| [59,84,85,89] | X | |||||||||||||||||||||||||||
| [85,90,91,108] | X | |||||||||||||||||||||||||||
| [105,109] | X | X | ||||||||||||||||||||||||||
| [110] | X | X | ||||||||||||||||||||||||||
| [83,111] | X | |||||||||||||||||||||||||||
| [112] | X | X | X | |||||||||||||||||||||||||
| [81] | X | X | ||||||||||||||||||||||||||
| [113,114,115] | X | X | ||||||||||||||||||||||||||
| [80] | X | |||||||||||||||||||||||||||
| [58] | X | X | ||||||||||||||||||||||||||
| [116] | X | X | X | |||||||||||||||||||||||||
| [100] | X | X | ||||||||||||||||||||||||||
| [86] | X | X | X | |||||||||||||||||||||||||
| [105] | X | X | ||||||||||||||||||||||||||
| [59] | X | |||||||||||||||||||||||||||
| [85] | X | |||||||||||||||||||||||||||
| [105,109] | X | X | ||||||||||||||||||||||||||
| [85] | X | |||||||||||||||||||||||||||
| [105] | X | X | ||||||||||||||||||||||||||
| [85] | X | |||||||||||||||||||||||||||
| [45,46,47,48,49,50,51,52,53,81] | X | X | ||||||||||||||||||||||||||
| [48,52,54,55] | X | |||||||||||||||||||||||||||
| [52] | X | X | ||||||||||||||||||||||||||
| [54] | X | X | X | X | ||||||||||||||||||||||||
| [56] | X | X | X | X | ||||||||||||||||||||||||
| [81] | X | X | X | |||||||||||||||||||||||||
| [78] | X | X | ||||||||||||||||||||||||||
| [117,118] | X | |||||||||||||||||||||||||||
| Group and Description | Examples |
|---|---|
| A—Cepstral coefficients: Coefficients obtained from cepstral analysis. | MFCC [145], improved MFCC [68], Gammatone Frequency Cepstral Coefficients [158] |
| B—Timedomain distribution and regularity: Characterization of the time domain distribution. | ZCR [83], Shannon Entropy [150], Variance [100], Skewness [33], Kurtosis [94], Crest Factor [83] |
| C—Total energy and power: Overall energy or power values, for which the explosive phase is supposed to present a sudden rise. | Total Energy [33], Log-Energy [68], Total Power [156], Average Power [33], Loudness [27] |
| D—Pitch, prosody, formants and harmonics: Speech-related characteristics, supposed to detect voicing activity. | F0 [174], Pitch Standard Deviation [75], Pitch Coverage [75], Formant Frequencies [94] |
| E—Spectral distribution and regularity: Characterization of the spectrum distribution. | Spectral Centroid [29], Spectral Bandwidth [121], Spectral Flatness [112], Skewness [70] |
| F—Frequencies: Peculiar frequencies of the spectrum. | Spectral Rolloff [192], Dominant Frequency [83] |
| G—Energy and power in specific bands: Energy or power values in specific frequency bands. | Power [30], Loudness [27], Log Spectral Energies [58], Octave Analysis [33] |
| H—Energy and power ratios: Ratios of energy or power between different frequency bands. | Power Ratio [79], Relative Energy [132], Relative Power [121] |
| I—Time, duration and rates: Duration and time dynamics values. | Duration [116], Slope [140], L-ratio [33], Left to Right Ratio [192], Rising Envelope Gradient [160] |
| J—Frequency domain general: General spectrum characterization. | Power Spectral Density [99], Spectral Distances [99] |
| K—Spectrogram images, moments and filterbanks: Overall spectrogram images, image moments and outputs of filterbanks. | Local Hu Moments [124], Cochleagram moments [84], Gabor Filterbank [98] |
| L—Deep learning raw data: Input data for deep neural networks. | Mel-Spectrogram [54], Mel-Scaled Filter Banks [137] |
| M—Time domain envelope: Characterization of the time domain envelope shape, capturing typically characteristic peaks in the explosive phase. | Filtered Envelope [69], Peak Number [79], Peak Location [160], Rate of Decay [100] |
| N—Frequency domain ratios: Ratios between different characteristic of the spectrum. | Harmonic to Noise Ratio [132], High-Frequency Content [147], Low quantile ratio [147] |
| O—Spectral variations: Time variation measures of the spectrum. | Spectral Variation [132], Spectral Flux [132], Evo [146] |
| P—Time domain amplitude: Characterization of the time domain amplitude. | Maximum Value [113], Minimum Value [113], Amplitude [160] |
| Q—Other | Wavelet [91], Katz Fractal Dimension [184], DeoxyriboNucleic Acid [81] |
| Study and System | # Test Subjects (Cough Events) | Feature Groups (as in Table 3) + Classifiers | Results | Description |
|---|---|---|---|---|
| [121] | 13 (1309) | A − E − F − H − J − N + SVM | SE = 88–90, SP = 81–75 | Robust smartphone-based cough detection |
| [22] HACC | 10 (237) | A + Probabilistic Neural Network | SE = 80, SP = 96 | Cough detection over long periods of time for objective monitoring |
| [14] HACC-LCM | 18 | A + GMM-HMM | SE = 57.9, SP = 98.2, PREC = 80.9 | Objective cough monitoring for COPD patients |
| [175] LCM | 9 (2151/1338) | A + GMM-HMM | SE = 71–82, FPh = 13–7 | Continuous cough detection for ambulatory patients |
| [176] LCM | 26/9 | A + GMM-HMM | SE = 85.7–90.9, SP = 99.9–99.5, PREC = 94.7, FPh = 0.8–2.5 | Continuous cough detection over long periods of time for ambulatory patients |
| [177] LCM | 23/9 | A + GMM-HMM | SE = 86–91, SP = 99, FPh = 1–2.5 | Continuous cough detection over long periods of time for ambulatory patients |
| [150] | 10/14 (656/1434) | A − B − D + TDNN | SE = 89.8–92.8, SP = 94.8-97.5, ACC = 93.9-97.4 | Cough detection for pediatric population |
| [28] LifeShirt | 8 (3645) | SE = 78.1, SP = 99.6, ACC = 99, PREC = 84.6 | Cough detection over long periods of time for ambulatory COPD patients | |
| [160] | 10 (1019) | I − M − P + Decision Tree | SE = 90.2, SP = 96.5, ACC = 93.1, PREC = 96.7, F1 = 93.3 | Cough characterization and detection |
| [17] KarmelSonix | 12 | SE = 96–90, SP = 94, PREC = 90–93, FPh = 1.2–1.2 | Objective cough monitoring for realistic ambulatory situations | |
| [181] | 10 (50) | SE = 84, SP = 50, ACC = 67, PREC = 62.7, F1 = 71.8 | Separation of cough and throat clearing sounds | |
| [78] | 15 (5489) | A − B − L + CNN | SE = 99.9, SP = 91.5, ACC = 99.8 | Overnight smartphone-based cough monitoring for asthma patients |
Publisher’s Note: MDPI stays neutral with regard to jurisdictional claims in published maps and institutional affiliations. |
© 2022 by the authors. Licensee MDPI, Basel, Switzerland. This article is an open access article distributed under the terms and conditions of the Creative Commons Attribution (CC BY) license (https://creativecommons.org/licenses/by/4.0/).
Share and Cite
Serrurier, A.; Neuschaefer-Rube, C.; Röhrig, R. Past and Trends in Cough Sound Acquisition, Automatic Detection and Automatic Classification: A Comparative Review. Sensors 2022, 22, 2896. https://doi.org/10.3390/s22082896
Serrurier A, Neuschaefer-Rube C, Röhrig R. Past and Trends in Cough Sound Acquisition, Automatic Detection and Automatic Classification: A Comparative Review. Sensors. 2022; 22(8):2896. https://doi.org/10.3390/s22082896
Chicago/Turabian StyleSerrurier, Antoine, Christiane Neuschaefer-Rube, and Rainer Röhrig. 2022. "Past and Trends in Cough Sound Acquisition, Automatic Detection and Automatic Classification: A Comparative Review" Sensors 22, no. 8: 2896. https://doi.org/10.3390/s22082896
APA StyleSerrurier, A., Neuschaefer-Rube, C., & Röhrig, R. (2022). Past and Trends in Cough Sound Acquisition, Automatic Detection and Automatic Classification: A Comparative Review. Sensors, 22(8), 2896. https://doi.org/10.3390/s22082896