Energy-Efficient Wireless Multimedia Sensor Nodes for Plant Proximal Monitoring

 ,
,  , ,
, , 
Abstract
1. Introduction
2. State of the Art
- High bandwidth demand to transmit multimedia files;
- Need for efficient multimedia coding techniques to manage and compress data;
- Application-specific Quality-of-Service (QoS) requirements to ensure reliable and timely data transmission;
- Resource constraints, including limited battery life, energy harvesting, memory and processing power;
- In several countries, duty-cycle limitations in the sub-GHz radio-frequency (RF) band, as defined in ERC Recommendation 70-03 [25].
3. Materials and Methods
- Control phase (C-phase): device management from remote;
- Multimedia phase (MM-phase): picture shooting and transmission.
- Active PDP context request by the MT to the Serving GPRS Support Node (SGSN);
- Creation of the PDP context between the SGSN and the GGSN;
- Active Basic Service Set (BSS) packet flow context procedure management between the SGSN and the Base Station Controller (BSC);
- Update of the PDP context between the SGSN and the GGSN;
- Active PDP context acceptance by the SGSN to the MT.
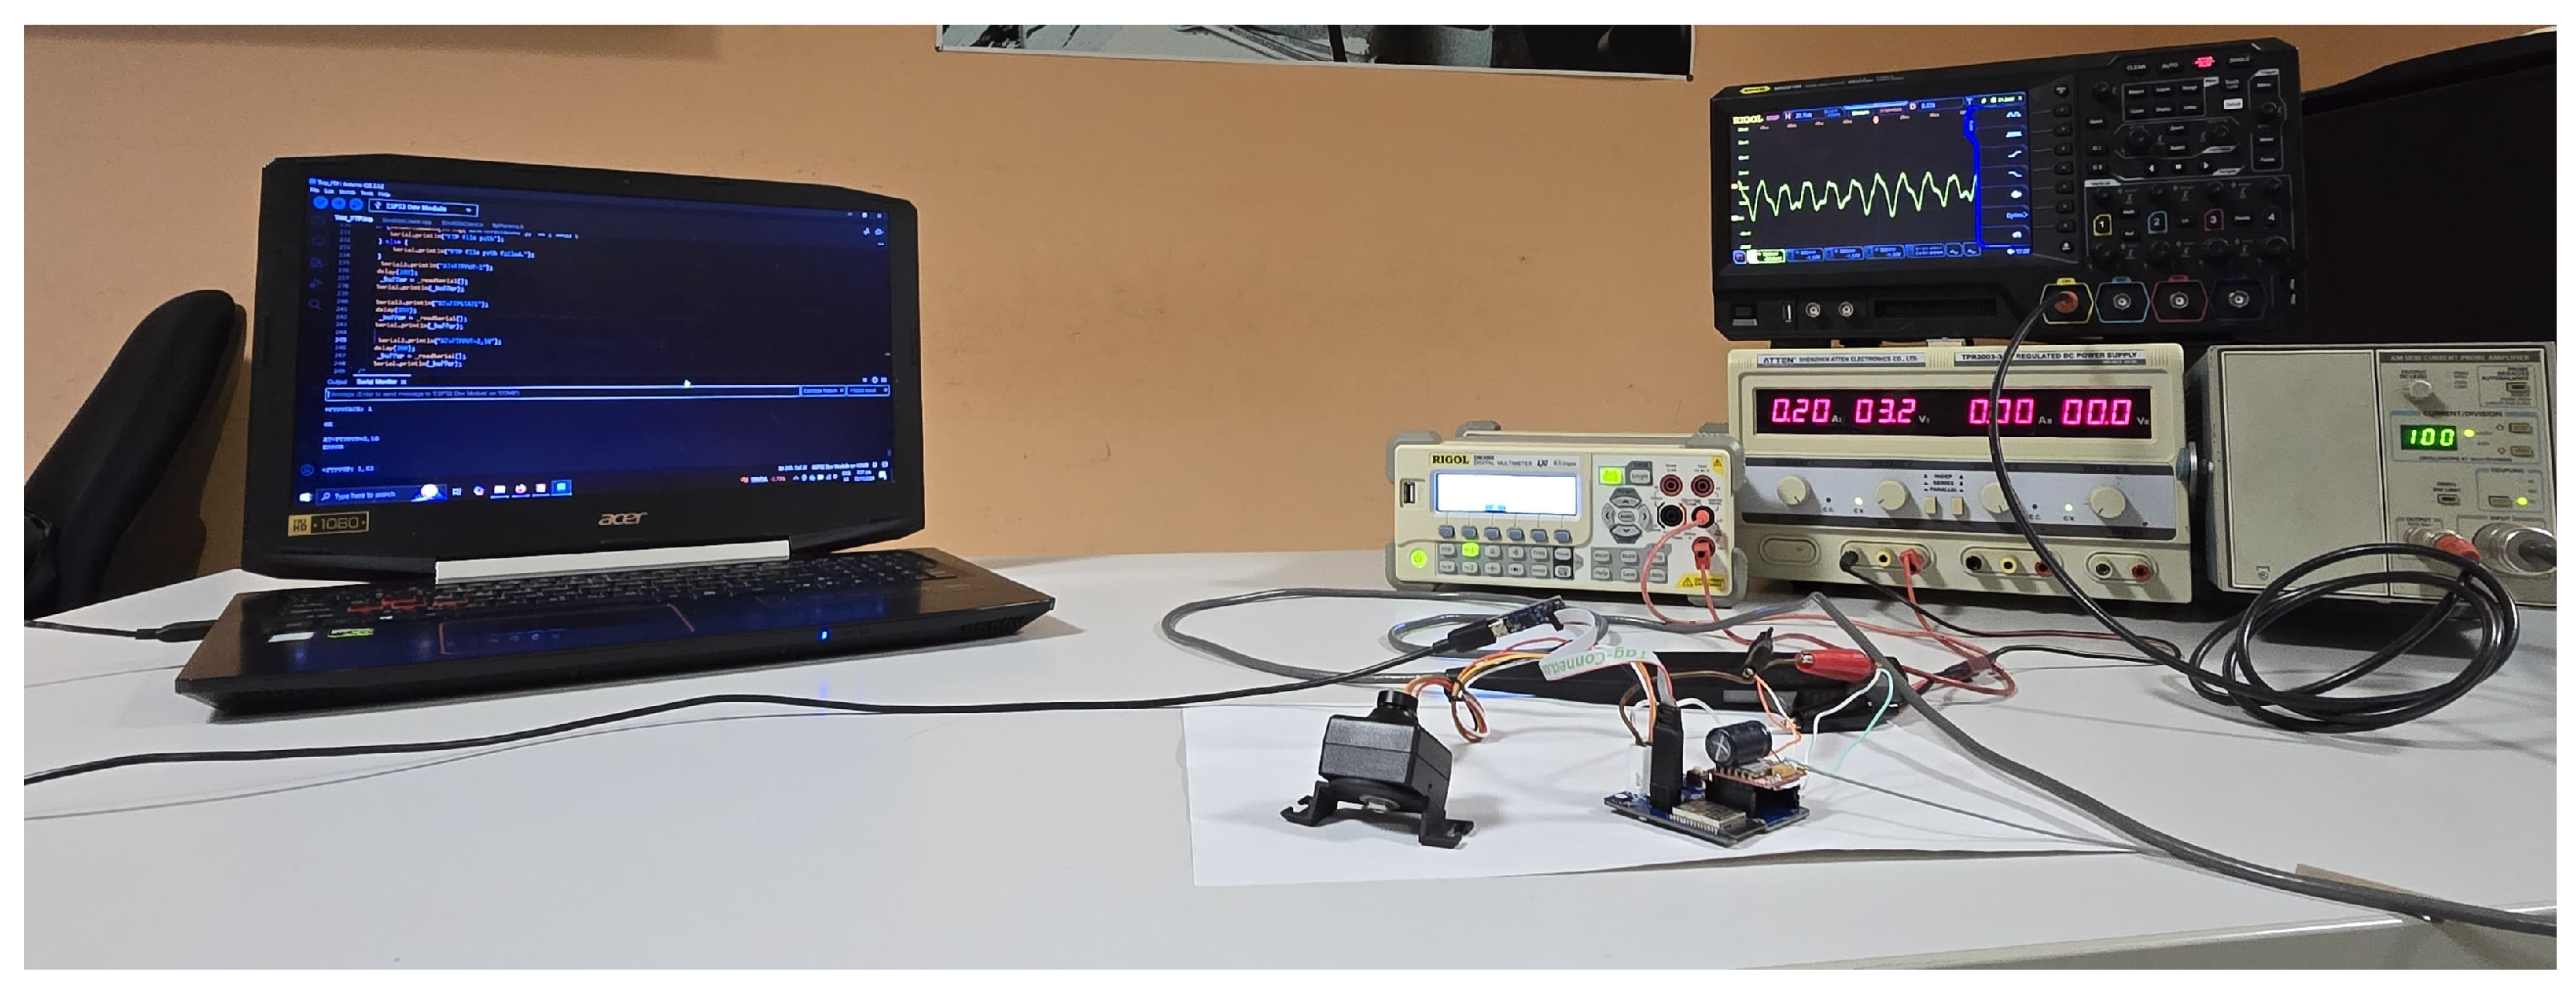
4. Results
4.1. Energy Consumption
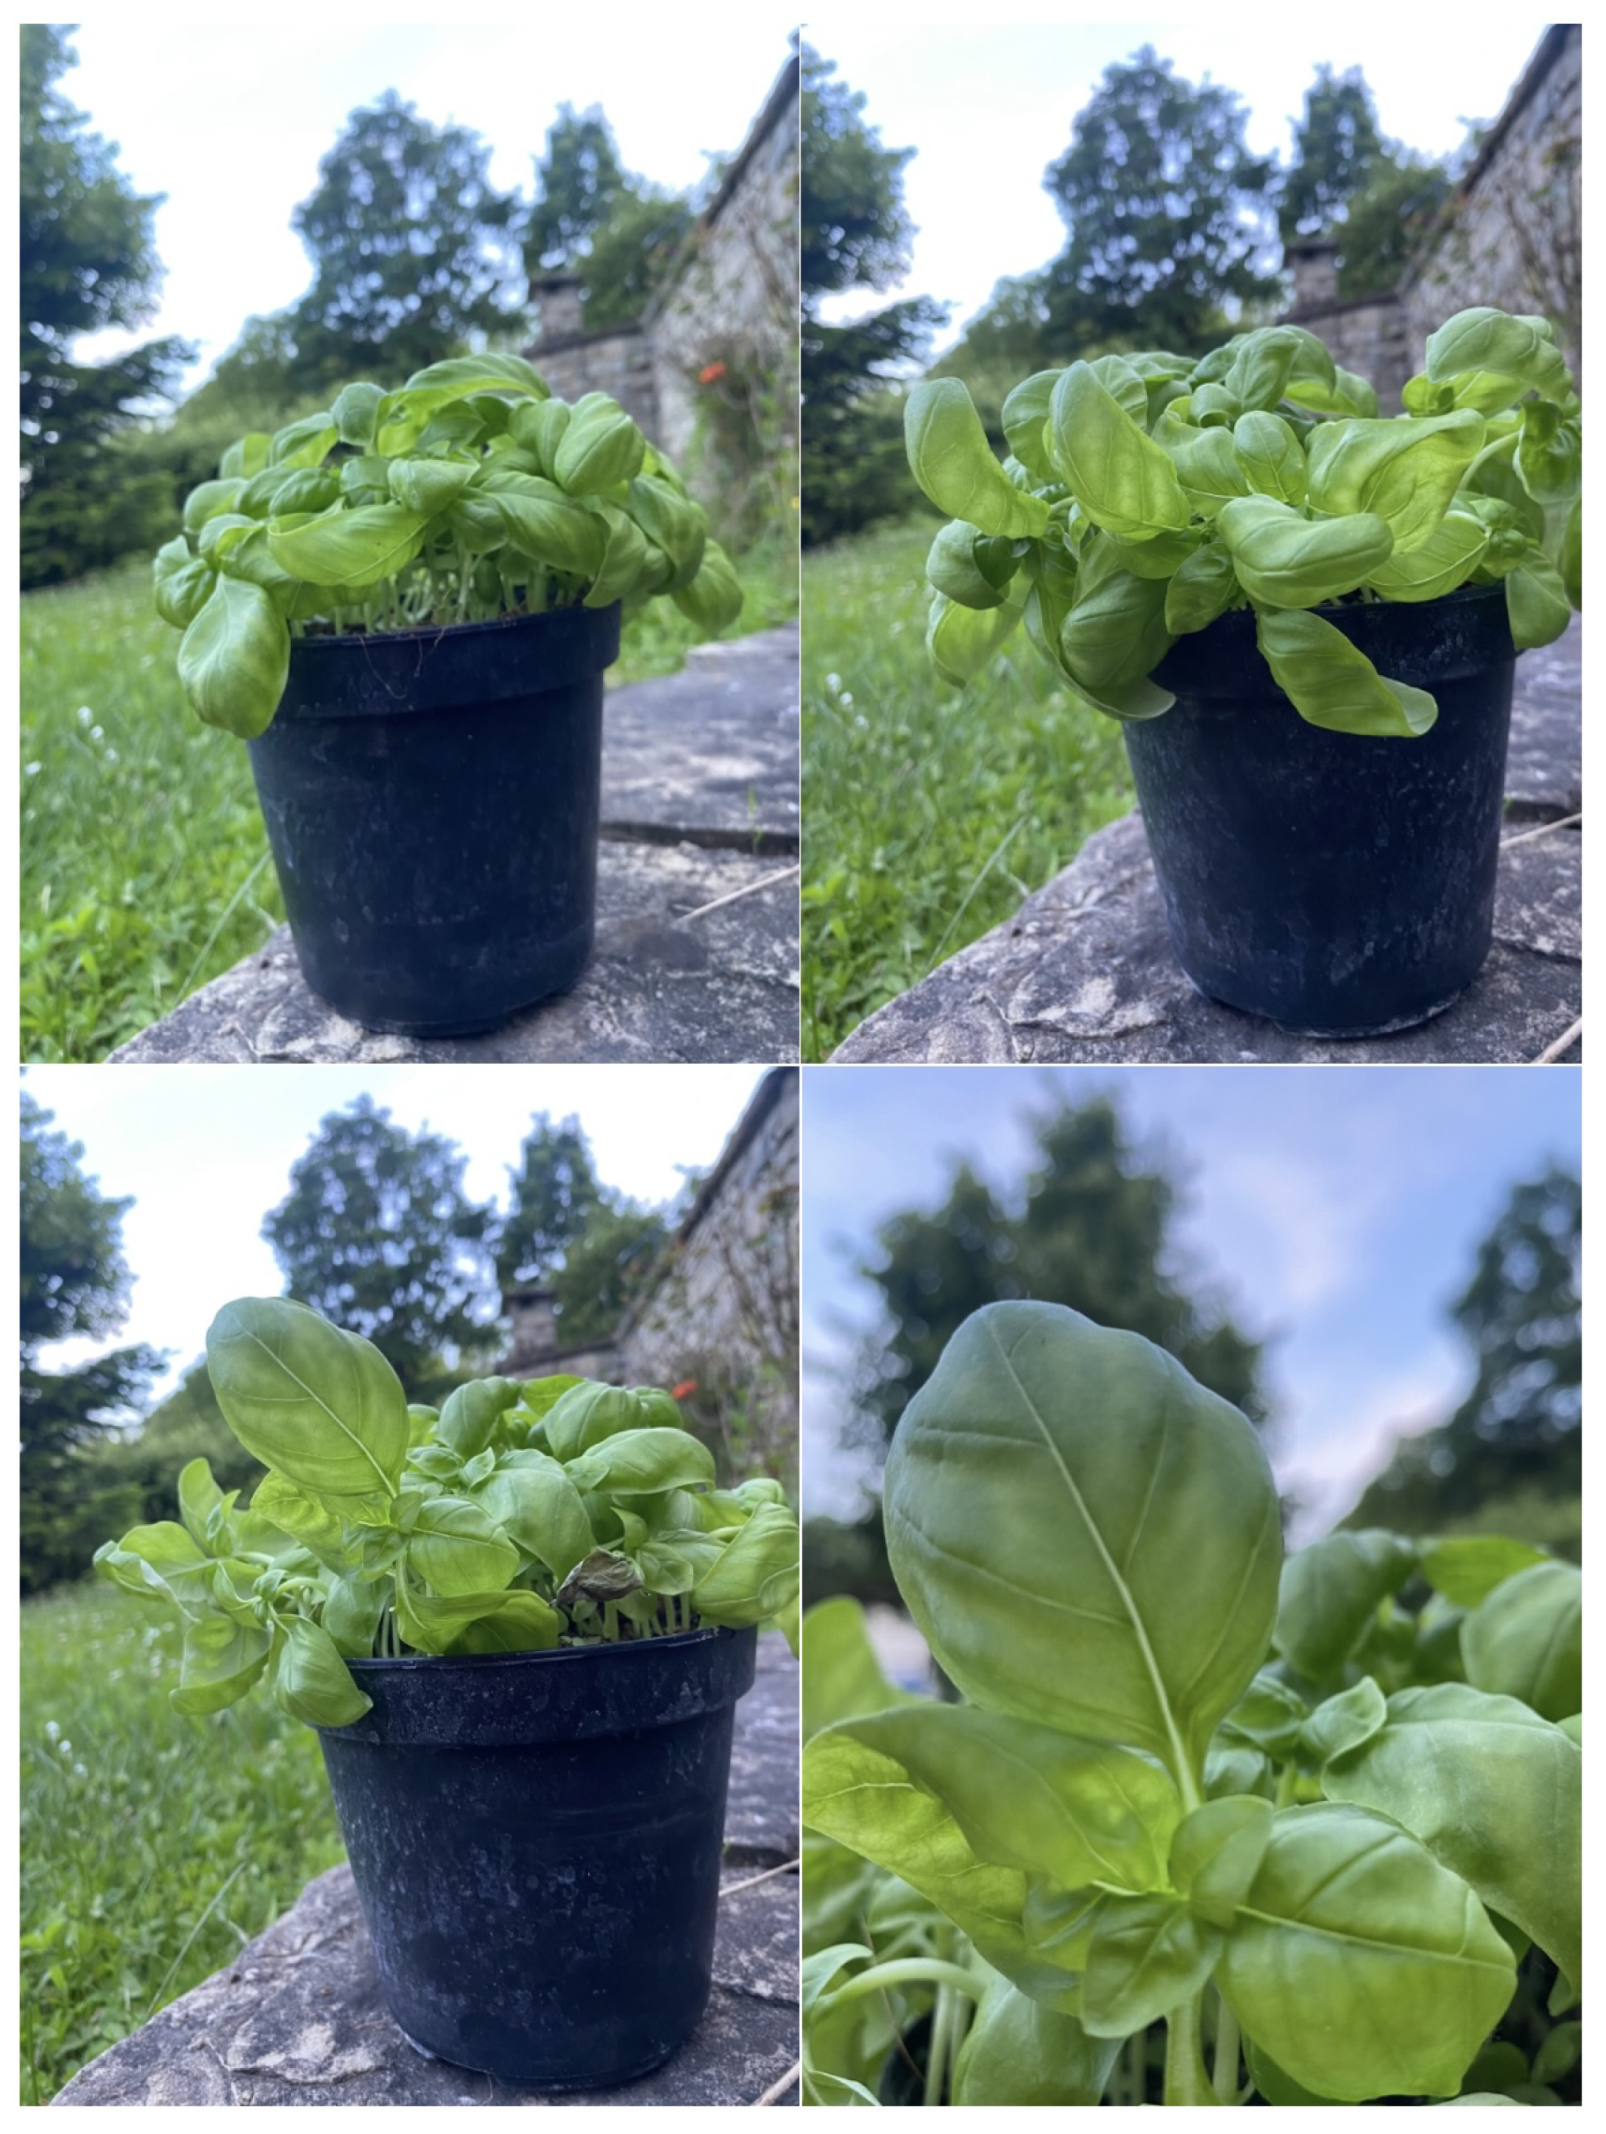
4.2. Field Validation
5. Conclusions
Author Contributions
Funding
Institutional Review Board Statement
Informed Consent Statement
Data Availability Statement
Conflicts of Interest
Abbreviations
| UAV | Unnamed Aerial Vehicle |
| WMSN | Wireless Multimedia Sensor Network |
| QoS | Quality of Service |
| RF | Radio Frequency |
| ERC | European Radiocommunication Committee |
| IoT | Internet of Things |
| LoRaWAN | Long-Range Wide-Area Network |
| LP-WAN | Low-Power Wide-Area Network |
| LoRa | Long Range |
| GPRS | General Packet Radio Service |
| LTE | Long-Term Evolution |
| BLE | Bluetooth Low Energy |
| C-phase | Control phase |
| MM-phase | Multimedia phase |
| RSSI | Received Signal Strength Indicator |
| SNR | Signal-to-Noise Ratio |
| TCP | Transmission Control Protocol |
| MCU | MicroController Unit |
| UART | Universal Asynchronous Receiver-Transmitter |
| AT | ATtention |
| SPI | Serial Peripheral Interface |
| PDP | Packet Data Protocol |
| MT | Mobile Terminal |
| PDN | Packet Data Network |
| GGSN | Gateway GPRS Support Node |
| SGSN | Serving GPRS Support Node |
| BSS | Basic Service Set |
| BSC | Base Station Controller |
| FTPS | File Transfer Protocol Secure |
| TLS | Transport Layer Security |
| PCB | Printed Circuit Board |
| HFoV | Horizontal Field of View |
| FoV | Field of View |
References
- Mutka, A.M.; Bart, R.S. Image-based phenotyping of plant disease symptoms. Front. Plant Sci. 2015, 5, 734. [Google Scholar] [CrossRef]
- Barzman, M.; Bàrberi, P.; Birch, A.N.E.; Boonekamp, P.; Dachbrodt-Saaydeh, S.; Graf, B.; Hommel, B.; Jensen, J.E.; Kiss, J.; Kudsk, P.; et al. Eight principles of integrated pest management. Agron. Sustain. Dev. 2015, 35, 1199–1215. [Google Scholar] [CrossRef]
- European Union. Directive 2009/136/EC of the European Parliament and of the Council of 25 November 2009 Amending Directive 2002/22/EC on Universal Service and Users’ Rights Relating to Electronic Communications Networks and Services, Directive 2002/58/EC Concerning the Processing of Personal Data and the Protection of Privacy in the Electronic Communications Sector and Regulation (EC) No 2006/2004 on Cooperation Between National Authorities Responsible for the Enforcement of Consumer Protection Laws. 2009. Available online: https://eur-lex.europa.eu/LexUriServ/LexUriServ.do?uri=OJ:L:2009:309:0071:0086:en:PDF (accessed on 14 October 2024).
- Kamilaris, A.; Prenafeta-Boldú, F.X. Deep learning in agriculture: A survey. Comput. Electron. Agric. 2018, 147, 70–90. [Google Scholar] [CrossRef]
- Karthikeyan, L.; Chawla, I.; Mishra, A.K. A review of remote sensing applications in agriculture for food security: Crop growth and yield, irrigation, and crop losses. J. Hydrol. 2020, 586, 124905. [Google Scholar] [CrossRef]
- Sishodia, R.P.; Ray, R.L.; Singh, S.K. Applications of Remote Sensing in Precision Agriculture: A Review. Remote Sens. 2020, 12, 3136. [Google Scholar] [CrossRef]
- Segarra, J.; Buchaillot, M.L.; Araus, J.L.; Kefauver, S.C. Remote Sensing for Precision Agriculture: Sentinel-2 Improved Features and Applications. Agronomy 2020, 10, 641. [Google Scholar] [CrossRef]
- Tsouros, D.C.; Bibi, S.; Sarigiannidis, P.G. A Review on UAV-Based Applications for Precision Agriculture. Information 2019, 10, 349. [Google Scholar] [CrossRef]
- Velusamy, P.; Rajendran, S.; Mahendran, R.K.; Naseer, S.; Shafiq, M.; Choi, J.G. Unmanned Aerial Vehicles (UAV) in Precision Agriculture: Applications and Challenges. Energies 2022, 15, 217. [Google Scholar] [CrossRef]
- Bock, C.; Poole, G.; Parker, P.; Gottwald, T. Plant disease severity estimated visually, by digital photography and image analysis, and by hyperspectral imaging. Crit. Rev. Plant Sci. 2010, 29, 59–107. [Google Scholar] [CrossRef]
- Zaineldin, H.; Elhosseini, M.; Ali, H. Image compression algorithms in wireless multimedia sensor networks: A survey. Ain Shams Eng. J. 2014, 6, 481–490. [Google Scholar] [CrossRef]
- Barbedo, J.G.A. A review on the main challenges in automatic plant disease identification based on visible range images. Biosyst. Eng. 2016, 144, 52–60. [Google Scholar] [CrossRef]
- Abade, A.; Ferreira, P.A.; de Barros Vidal, F. Plant diseases recognition on images using convolutional neural networks: A systematic review. Comput. Electron. Agric. 2021, 185, 106125. [Google Scholar] [CrossRef]
- Correa, E.S.; Calderon, F.C.; Colorado, J.D. A Novel Multi-camera Fusion Approach at Plant Scale: From 2D to 3D. SN Comput. Sci. 2024, 5, 582. [Google Scholar] [CrossRef]
- Wang, Y.; Rajkumar Dhamodharan, U.S.; Sarwar, N.; Almalki, F.A.; Naith, Q.H.; R, S.; D, M. A Hybrid Approach for Rice Crop Disease Detection in Agricultural IoT System. Discov. Sustain. 2024, 5, 99. [Google Scholar] [CrossRef]
- Kondaparthi, A.K.; Lee, W.S.; Peres, N.A. Utilizing High-Resolution Imaging and Artificial Intelligence for Accurate Leaf Wetness Detection for the Strawberry Advisory System (SAS). Sensors 2024, 24, 4836. [Google Scholar] [CrossRef] [PubMed]
- Surige, Y.; Perera, W.; Gunarathna, P.; Ariyarathna, K.; Gamage, N.; Nawinna, D. IoT-Based Monitoring System for Oyster Mushroom Farming. In Proceedings of the 2021 3rd International Conference on Advancements in Computing (ICAC), Colombo, Sri Lanka, 9–11 December 2021; pp. 79–84. [Google Scholar]
- Nguyen, H.H.; Shin, D.Y.; Jung, W.S.; Kim, T.Y.; Lee, D.H. An Integrated IoT Sensor-Camera System toward Leveraging Edge Computing for Smart Greenhouse Mushroom Cultivation. Agriculture 2024, 14, 489. [Google Scholar] [CrossRef]
- Lovell, D.; Powers, S.; Welham, S.; Parker, S. A perspective on the measurement of time in plant disease epidemiology. Plant Pathol. 2004, 53, 705–712. [Google Scholar] [CrossRef]
- Gordy, J.W.; Seiter, N.J.; Kerns, D.L.; Reay-Jones, F.P.F.; Bowling, R.D.; Way, M.O.; Brewer, M.J. Field Assessment of Aphid Doubling Time and Yield of Sorghum Susceptible and Partially Resistant to Sugarcane Aphid (Hemiptera: Aphididae). J. Econ. Entomol. 2021, 114, 2076–2087. [Google Scholar] [CrossRef] [PubMed]
- Aldarkazali, M.; Rihan, H.Z.; Carne, D.; Fuller, M.P. The Growth and Development of Sweet Basil (Ocimum basilicum) and Bush Basil (Ocimum minimum) Grown under Three Light Regimes in a Controlled Environment. Agronomy 2019, 9, 743. [Google Scholar] [CrossRef]
- Cohen, Y.; Ben Naim, Y.; Falach, L.; Rubin, A.E. Epidemiology of basil downy mildew. Phytopathology 2017, 107, 1149–1160. [Google Scholar] [CrossRef] [PubMed]
- Prathibha, S.R.; Hongal, A.; Jyothi, M.P. IOT Based Monitoring System in Smart Agriculture. In Proceedings of the 2017 International Conference on Recent Advances in Electronics and Communication Technology (ICRAECT), Bangalore, India, 16–17 March 2017; pp. 81–84. [Google Scholar] [CrossRef]
- Al Nuaimi, M.; Sallabi, F.; Shuaib, K. A survey of Wireless Multimedia Sensor Networks Challenges and Solutions. In Proceedings of the 2011 International Conference on Innovations in Information Technology, Abu Dhabi, United Arab Emirates, 25–27 April 2011; pp. 191–196. [Google Scholar] [CrossRef]
- ERC Recommendation 70-03; Relating to the Use of Short Range Devices (SRD). European Radiocommunications Committee (ERC): Brussels, Belgium, 2022; Edition of February 2022. Available online: https://docdb.cept.org/download/3700 (accessed on 19 November 2024).
- Akyildiz, I.F.; Melodia, T.; Chowdhury, K.R. A survey on wireless multimedia sensor networks. Comput. Netw. 2007, 51, 921–960. [Google Scholar] [CrossRef]
- Campbell, J.; Gibbons, P.B.; Nath, S.; Pillai, P.; Seshan, S.; Sukthankar, R. IrisNet: An Internet-Scale Architecture for Multimedia Sensors. In Proceedings of the 13th Annual ACM International Conference on Multimedia, New York, NY, USA, 6–11 November 2005; MULTIMEDIA ’05. pp. 81–88. [Google Scholar] [CrossRef]
- Feng, W.C.; Kaiser, E.; Feng, W.C.; Baillif, M.L. Panoptes: Scalable low-power video sensor networking technologies. ACM Trans. Multimed. Comput. Commun. Appl. 2005, 1, 151–167. [Google Scholar] [CrossRef]
- Zhang, Q.Y.; Huang, H.P.; Sha, C. An Energy Efficient Image Transmission Scheme for Wireless Multimedia Sensor Networks. In Proceedings of the 2012 Fourth International Conference on Computational and Information Sciences, Chongqing, China, 17–19 August 2012; pp. 841–844. [Google Scholar] [CrossRef]
- Savin, I.Y.; Blokhin, Y.I.; Chinilin, A.V. Methodology of Real-time Monitoring of the Crop Status Based on Internet of Things Technologies. Russ. Agric. Sci. 2024, 50, 59–63. [Google Scholar] [CrossRef]
- Chamara, N.; Bai, G.F.; Ge, Y. AICropCAM: Deploying classification, segmentation, detection, and counting deep-learning models for crop monitoring on the edge. Comput. Electron. Agric. 2023, 215, 108420. [Google Scholar] [CrossRef]
- Baronti, P.; Pillai, P.; Chook, V.W.; Chessa, S.; Gotta, A.; Hu, Y.F. Wireless sensor networks: A survey on the state of the art and the 802.15.4 and ZigBee standards. Comput. Commun. 2007, 30, 1655–1695. [Google Scholar] [CrossRef]
- Garcia-Sanchez, A.J.; Garcia-Sanchez, F.; Garcia-Haro, J. Wireless sensor network deployment for integrating video-surveillance and data-monitoring in precision agriculture over distributed crops. Comput. Electron. Agric. 2011, 75, 288–303. [Google Scholar] [CrossRef]
- Liya, M.; Aswathy, M. LoRa Technology for Internet of Things(IoT):A Brief Survey. In Proceedings of the 2020 Fourth International Conference on I-SMAC (IoT in Social, Mobile, Analytics and Cloud) (I-SMAC), Palladam, India, 7–9 October 2020; pp. 8–13. [Google Scholar] [CrossRef]
- Almuhaya, M.A.M.; Jabbar, W.A.; Sulaiman, N.; Abdulmalek, S. A Survey on LoRaWAN Technology: Recent Trends, Opportunities, Simulation Tools and Future Directions. Electronics 2022, 11, 164. [Google Scholar] [CrossRef]
- Chochul, M.; Ševčík, P. A Survey of Low Power Wide Area Network Technologies. In Proceedings of the 2020 18th International Conference on Emerging eLearning Technologies and Applications (ICETA), Kosice, Slovenia, 12–13 November 2020; pp. 69–73. [Google Scholar] [CrossRef]
- Wei, C.C.; Chen, S.T.; Su, P.Y. Image Transmission Using LoRa Technology with Various Spreading Factors. In Proceedings of the 2019 2nd World Symposium on Communication Engineering (WSCE), Nagoya, Japan, 20–23 December 2019; pp. 48–52. [Google Scholar] [CrossRef]
- Zhang, Z.; Wu, P.; Han, W.; Yu, X. Remote monitoring system for agricultural information based on wireless sensor network. J. Chin. Inst. Eng. 2017, 40, 75–81. [Google Scholar] [CrossRef]
- Lloret, J.; Garcia, M.; Bri, D.; Sendra, S. A Wireless Sensor Network Deployment for Rural and Forest Fire Detection and Verification. Sensors 2009, 9, 8722–8747. [Google Scholar] [CrossRef] [PubMed]
- Mukherjee, D.; Das, A.; Ghosh, N.; Nanda, S. Real Time Agricultural Monitoring with Deep Learning Using Wireless Sensor Framework. In Proceedings of the 2023 International Conference on Electrical, Electronics, Communication and Computers (ELEXCOM), Roorkee, India, 26–27 August 2023; pp. 1–6. [Google Scholar] [CrossRef]
- Chang, K.C.; Liu, P.K.; Kuo, Z.W.; Liao, S.H. Design of Persimmon Growing Stage Monitoring System Using Image Recognition Technique. In Proceedings of the 2016 IEEE International Conference on Consumer Electronics-Taiwan (ICCE-TW), Nantou County, Taiwan, 27–29 May 2016; pp. 1–2. [Google Scholar] [CrossRef]
- Murata. Type 1SJ LPWA Modules. Available online: https://www.murata.com/en-eu/products/connectivitymodule/lpwa/overview/lineup/type-1sj (accessed on 19 November 2024).
- Adafruit Industries LLC. SIM800 Series AT Command Manual. 2013. Available online: https://www.digikey.jp/htmldatasheets/production/1833952/0/0/1/sim800-series-at-command-manual.html#pfdf (accessed on 19 November 2024).
- 3rd Generation Partnership Project (3GPP). 3GPP TS 24.008 V13.7.0 (2016-10): Mobile Radio Interface Layer 3 Specification; Core Network Protocols; Stage 3. Technical Specification 3GPP TS 24.008, 3rd Generation Partnership Project (3GPP), 2016, ETSI, Sophia Antipolis Cedex, France.
- Telit Communications 2G/3G/4G Registration Process. Application Note Revision 3, Telit Communications, London, UK, 2021. Available online: https://sixfab.com/wp-content/uploads/2022/01/Telit_2G_3G_4G_Registration_Process_Application_Note_r3.pdf (accessed on 19 November 2024).
- Tunccekic, Y.; Dincer, K. Mobile Mapping Applications over J2ME Enabled Phones. IJCSNS Int. J. Comput. Sci. Netw. Secur. 2007, 7, 316–322. [Google Scholar]
- Tektronix. AM 503B & AM 5030 AC/DC Current Probe Amplifiers; Instruction Manual; Tektronix: Beaverton, OR, USA, 1994. [Google Scholar]
- RIGOL Technologies EU GmbH. RIGOL MSO5104 User Guide. 2020. Available online: https://rigolshop.eu/product-oscilloscope-mso5000-mso5104.html#amcustomtabs_tabs_10 (accessed on 15 October 2024).


| Technology | Key Advantages | Limitations |
|---|---|---|
| ZigBee/6LowPAN | Low power | Not suitable for multimedia data transmission |
| LoRa/Sigfox | Wide coverage and ultra-low power | Low data rates, not suitable for multimedia data transmission |
| GPRS | Extensive coverage in rural areas | High energy consumption |
| BLE/Wi-Fi | High data rate | Requires a dense receiver network, unsuitable for outdoor deployment |
| Proposed Device | Low power, high data rate | Requires GPRS coverage |
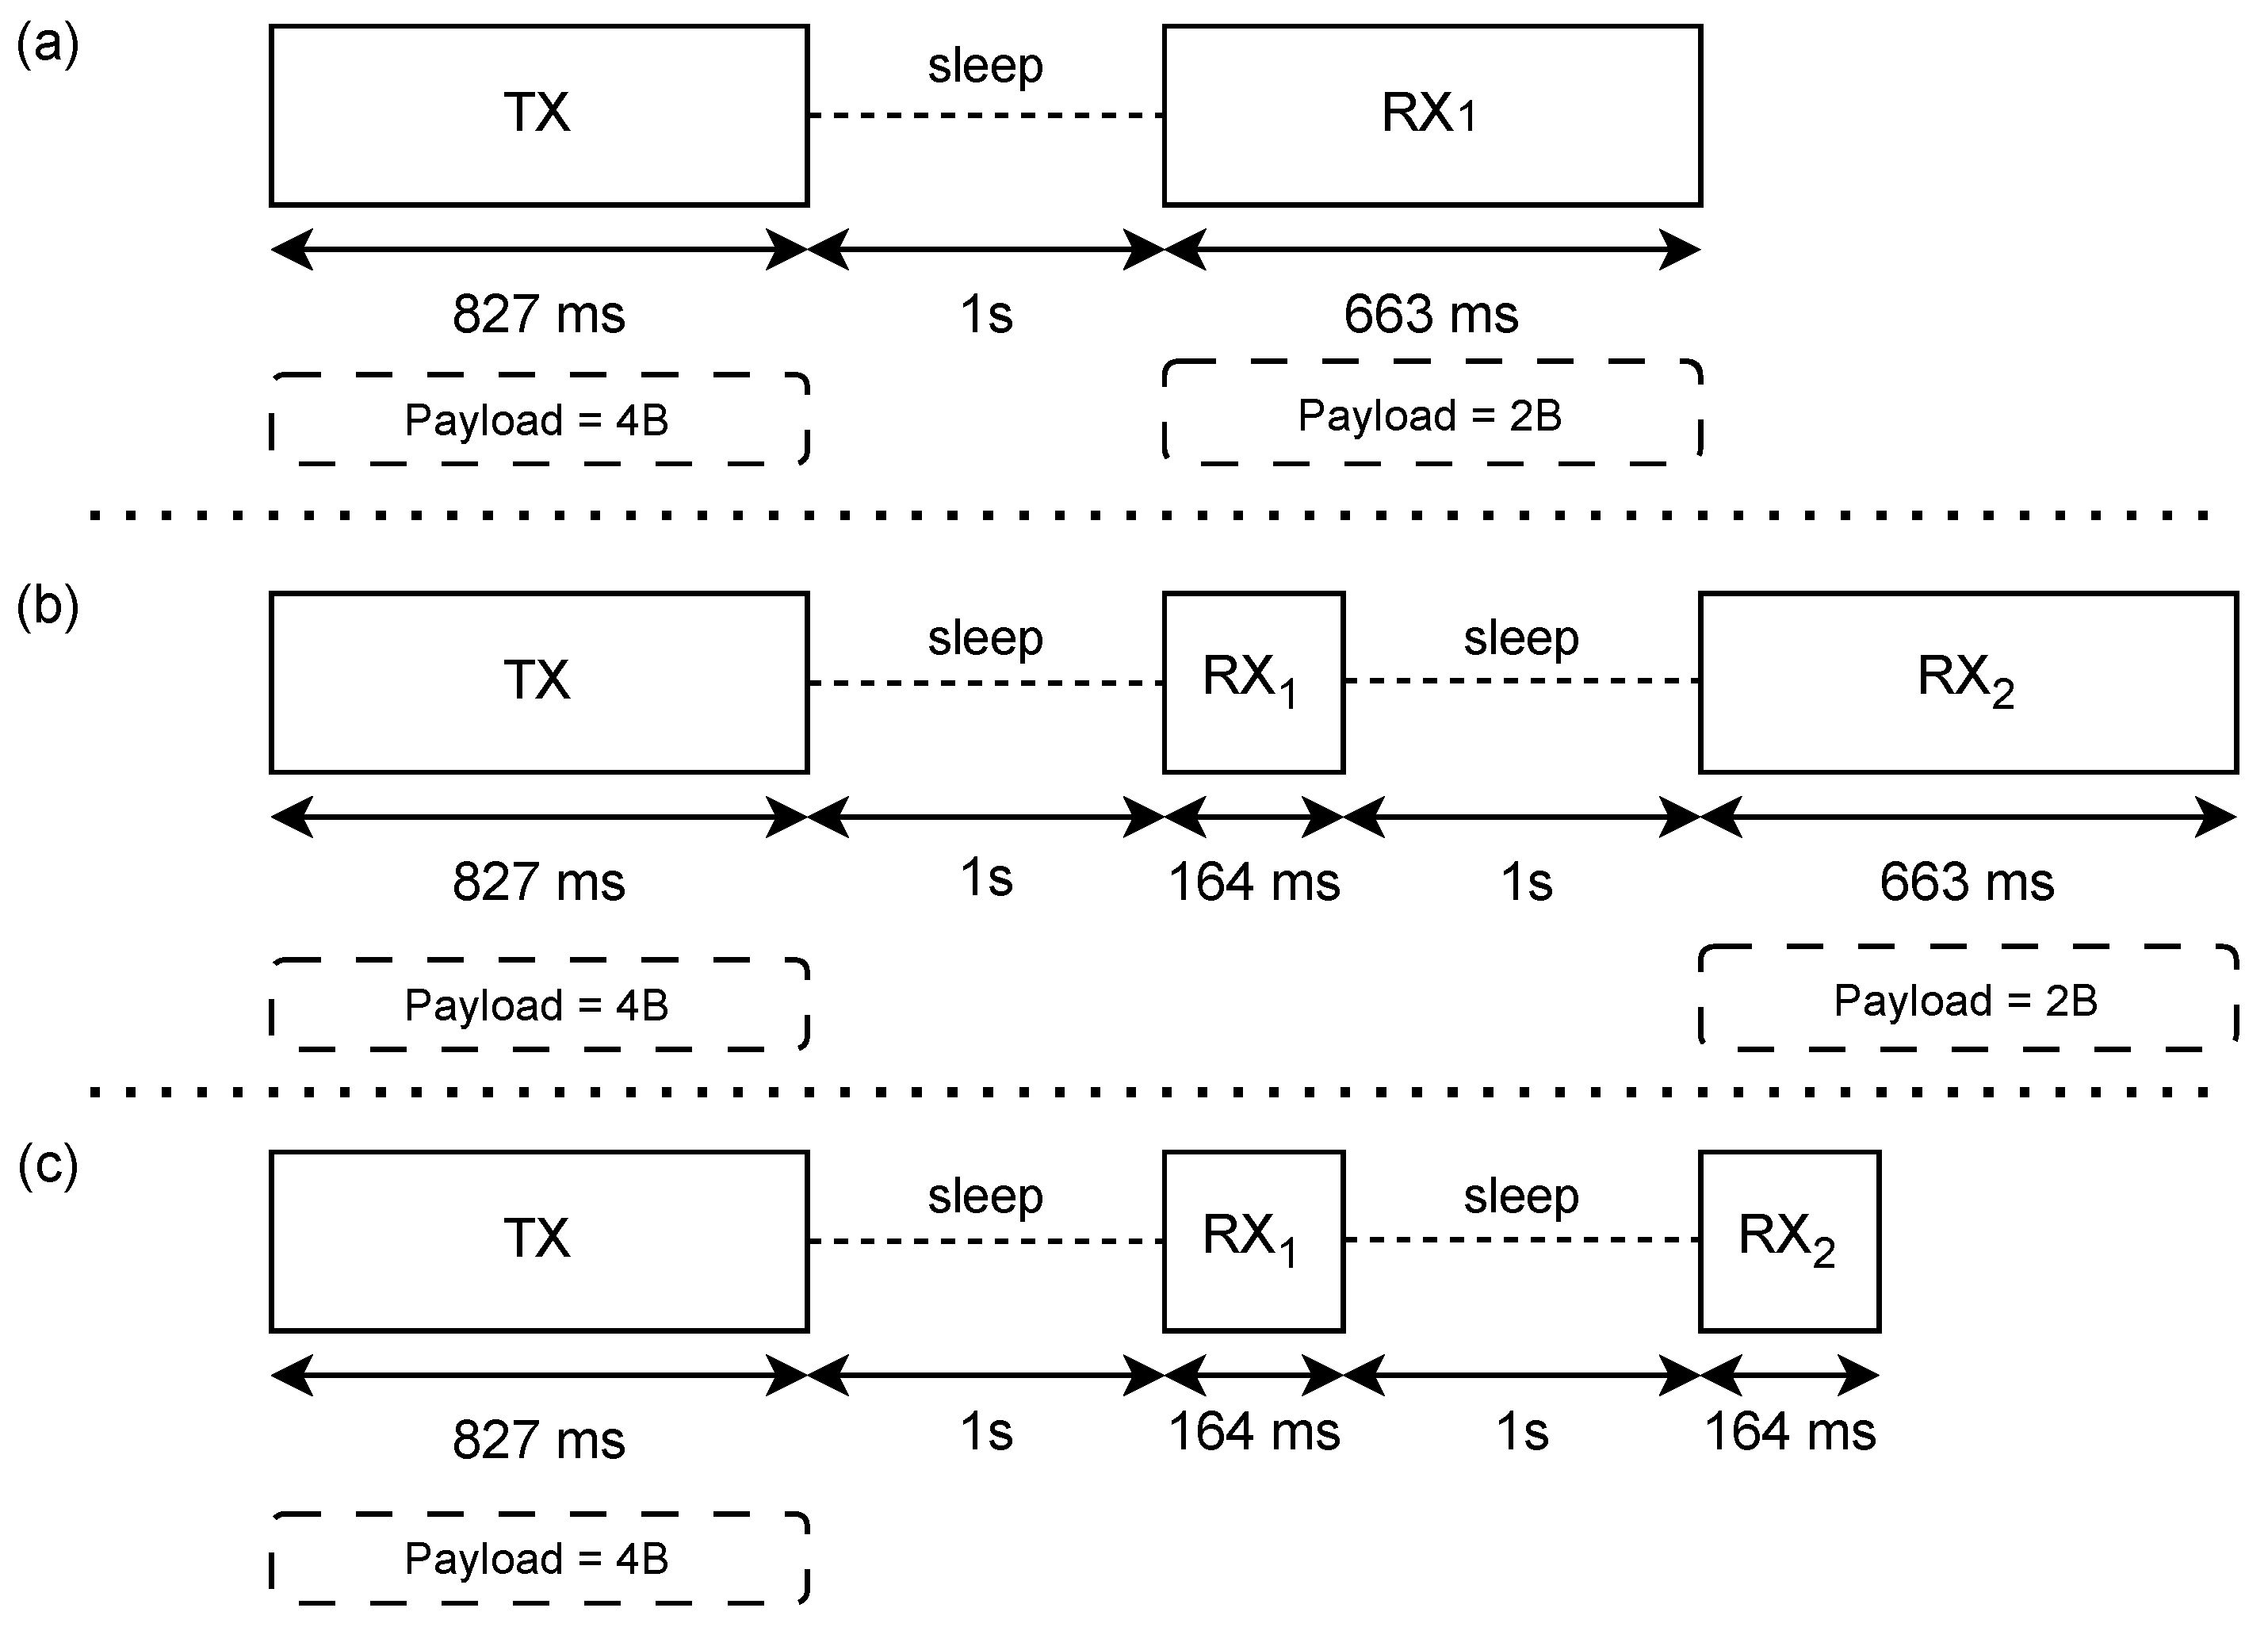
| Average Current (mA) | Time (s) | Total Energy Consumption (mA h) | |
|---|---|---|---|
| Uplink | 90.2 | 0.827 | 0.0207 |
| Short Receive Window | 10.1 | 0.164 | 0.00046 |
| Long Receive Window | 10.1 | 0.663 | 0.00186 |
| GPRS | 95.0 | 20.000 | 0.53 |
| Average Current (mA) | Average Time (s) | Total Energy Consumption (mA h) | |
|---|---|---|---|
| MCU activation | 87.3 | 0.003 | ∼0 |
| Modem activation and network connection | 98.0 | 15.000 | 0.4 |
| Picture shooting | 571.8 | 0.066 | 0.0096 |
| Picture transmission | 503.9 | 25.000 | 3.125 |
| Feedback transmission | 87.3 | 0.010 | ∼0 |
| Device | C-Phase (mA h) | MM-Phase (mA h) | Deep Sleep (mA h) | Total (mA h) | Days |
|---|---|---|---|---|---|
| Proposed device | 3.12 | 4 | 1.2 | 8.31 | 300 |
| GPRS | 76.08 | 4 | 11.6 | 91.59 | 27 |
Disclaimer/Publisher’s Note: The statements, opinions and data contained in all publications are solely those of the individual author(s) and contributor(s) and not of MDPI and/or the editor(s). MDPI and/or the editor(s) disclaim responsibility for any injury to people or property resulting from any ideas, methods, instructions or products referred to in the content. |
© 2024 by the authors. Licensee MDPI, Basel, Switzerland. This article is an open access article distributed under the terms and conditions of the Creative Commons Attribution (CC BY) license (https://creativecommons.org/licenses/by/4.0/).
Share and Cite
Trinchero, D.; Colucci, G.P.; Filipescu, E.; Zafar, U.S.M.; Battilani, P. Energy-Efficient Wireless Multimedia Sensor Nodes for Plant Proximal Monitoring. Sensors 2024, 24, 8088. https://doi.org/10.3390/s24248088
Trinchero D, Colucci GP, Filipescu E, Zafar USM, Battilani P. Energy-Efficient Wireless Multimedia Sensor Nodes for Plant Proximal Monitoring. Sensors. 2024; 24(24):8088. https://doi.org/10.3390/s24248088
Chicago/Turabian StyleTrinchero, Daniele, Giovanni Paolo Colucci, Elena Filipescu, Ussama Syed Muhammad Zafar, and Paola Battilani. 2024. "Energy-Efficient Wireless Multimedia Sensor Nodes for Plant Proximal Monitoring" Sensors 24, no. 24: 8088. https://doi.org/10.3390/s24248088
APA StyleTrinchero, D., Colucci, G. P., Filipescu, E., Zafar, U. S. M., & Battilani, P. (2024). Energy-Efficient Wireless Multimedia Sensor Nodes for Plant Proximal Monitoring. Sensors, 24(24), 8088. https://doi.org/10.3390/s24248088