Article

Does Experience Matter? Unraveling the Drivers of Expert and Non-Expert Mobile Consumers

by
Simona Vinerean
1,
Dan-Cristian Dabija
2 and
Gandolfo Dominici
3,*
1
Department of Management, Marketing and Business Administration, Lucian Blaga University of Sibiu, 550024 Sibiu, Romania
2
Department of Marketing, Faculty of Economics and Business Administration, Babeș-Bolyai University, 400591 Cluj-Napoca, Romania
3
Department of Economics, Business and Statistical Science, University of Palermo, 90128 Palermo, Italy
*
Author to whom correspondence should be addressed.
J. Theor. Appl. Electron. Commer. Res. 2024, 19(2), 958-974; https://doi.org/10.3390/jtaer19020050
Submission received: 4 March 2024 / Revised: 9 April 2024 / Accepted: 18 April 2024 / Published: 22 April 2024

Abstract

:
The surge in mobile shopping faces a challenge as not all potential consumers are comfortable with this mode. Retailers need a deeper understanding of factors influencing user experience to enhance marketing strategies. Despite extensive research, a gap remains in comprehending this aspect. Using a statistical PLS-SEM-ANN approach, this research aims to explore the psychological dimensions of expert and non-expert mobile shoppers for establishing better targeted marketing strategies in m-commerce settings. Analyzing experience levels in mobile commerce (m-commerce), key drivers like enjoyment, usefulness, subjective norms, and trust were scrutinized as interaction settings for consumers using mobile technologies. The findings reveal that, for less experienced m-shoppers, trust is the most significant driver of attitude and satisfaction, while, for experienced users, trust and usefulness are the primary antecedents. This research provides novel insights, aiding mobile marketers in refining targeting strategies based on consumer experience levels, emphasizing the importance of usefulness and trustworthiness for a seamless m-shopping experience.

1. Introduction

In 2023, the global consumption of mobile apps reached a staggering 257 billion downloads on consumer devices [1]. This surge in app adoption owes much to widespread Internet access and the ubiquity of mobile devices, paving the way for the ascendancy of mobile commerce (m-commerce or m-retailing). Easily accessible via mobile devices [2,3], m-commerce has emerged as the preferred medium for consumers in the rapidly evolving landscape of human–computer interactions.
Unlike its counterpart, e-commerce, m-commerce has witnessed substantial growth in recent years [4,5,6], allowing consumers to make purchases conveniently with apps literally “on the palm of their hands” [7]. The next five years are poised to see a significant uptick in mobile purchases, with six in ten buyers expressing their intention to increase such transactions [8]. The global m-retail sales forecast stands at a staggering 4.5 trillion US Dollars by 2024 [9].
While m-commerce has garnered attention from both scholars and professionals, theoretical frameworks such as TAM, UTAUT, and ECT have dominated the academic discourse. However, there remains a gap in research, particularly concerning multi-sample studies. Such investigations are crucial for gaining key insights into consumer behaviors on m-commerce apps and devising effective marketing strategies. Although some studies have delved into multi-group analysis for occasional and regular users [10], others have explored clusters based on cultural perspectives [11] or shopping motives [12].
This study aims to contribute to the advancement of research on m-commerce attitude and satisfaction by examining consumers with varying levels of m-shopping familiarity and knowledge. Previous experiences play a pivotal role in shaping learning abilities [13], and recognizing consumers’ m-commerce skill level is crucial for influencing their perceptions of this shopping format [14]. The paper seeks to fill the research gap by conducting multi-sample empirical studies on m-commerce, offering a comprehensive understanding of the key psychological dimensions in interactions with digital consumer behavior. A notable contribution lies in proposing and validating a new attitude and satisfaction m-commerce model, employing a multi-sample approach that distinguishes between less and more experienced m-shoppers. This innovative conceptual model incorporates key drivers—enjoyment, usefulness, subjective norms, and trust—to explore m-shoppers’ attitude and satisfaction with m-commerce.

2. Literature Review

M-shopping presents numerous advantages, including immediate and seamless acquisitions, access to a broad range of products, and enjoyable shopping experiences [15,16]. Additionally, it provides personalized services, special promotions [17], and the ability to review product information and read reviews. M-commerce facilitates a “hyper-context of customer information” [18] and encourages “customer–brand interactions” [19].
From a theoretical standpoint, research in m-retailing has embraced various frameworks, such as the theory of reasoned action (TRA, [20]), theory of planned behavior (TPB, [21]), technology acceptance model (TAM, [22]), unified theory of acceptance and the usage of technology (UTAUT, [23]), and expectation confirmation theory (ECT, [24]). TAM, as an extension of TRA, has played a crucial role in predicting the adoption of information systems [22,25], including m-commerce contexts [11,26,27]. UTAUT and UTAUT2 [23,28] explore consumers’ behavioral intentions in using new technologies, incorporating m-commerce [19,29]. ECT, popularized by Bhattacherjee [24], is widely employed in comprehending continued technology use with implications for human–computer interactions [16,30,31,32]. In this context, motivation describes individuals’ attitudes and behaviors, considering categories of motivational value (extrinsic, intrinsic, and social value) granted by e-commerce/m-commerce [11,16]. While m-commerce studies have adapted these theories, they have predominantly focused on single samples from different countries [16,33].
Examining m-shoppers as single groups limits researchers’ and m-retailers’ ability to define successful strategies [10]. M-commerce offers the potential for personalization and targeting based on customers’ profiles, increasing the efficiency of marketing strategies. Notably, m-commerce studies have increasingly incorporated the level of experience as a moderator [13,14]. While these studies are important, multi-sample studies could provide deeper insights into consumers’ behaviors on m-commerce apps and offer practical solutions. However, there are limited perspectives on multi-sample model validation in m-shopping contexts. For instance, Hu et al. [11] validated an m-commerce model in two countries and their respective cultures (China and Italy), and Groß [12] validated a model based on three clusters of consumers identified by shopping motives: motivated m-shoppers; thoughtful utilitarian-oriented m-shoppers; and satisfied convenience-conscious m-shoppers. Considering multi-group SEM, San-Martín et al. [34] explored experienced and non-experienced m-commerce users and found a more relevant model for skillful m-shoppers; however, non-experienced users reflected higher scores for satisfaction. De Canio et al. [10] validated a multi-group analysis of regular and occasional shoppers, showing that less experienced users had a lower likelihood of purchasing due to transaction unsafety perceptions. However, limited attention has been given to multi-sample model validation in m-shopping contexts. This study extends previous empirical multi-sample investigations [10,11] by specifically focusing on m-shoppers’ skills, considering both less and more experienced users of m-commerce. Recognizing that experience with a particular technology or app develops learning abilities [13], the paper explores how consumers’ levels of knowledge, skill, and experience with m-commerce influence their perceptions and overall interactions with this shopping format [14]. Building on the current state of the art in m-shopping literature, this research makes a significant contribution by employing a multi-sample and multi-analytic approach, encompassing both expert and non-expert mobile shoppers.

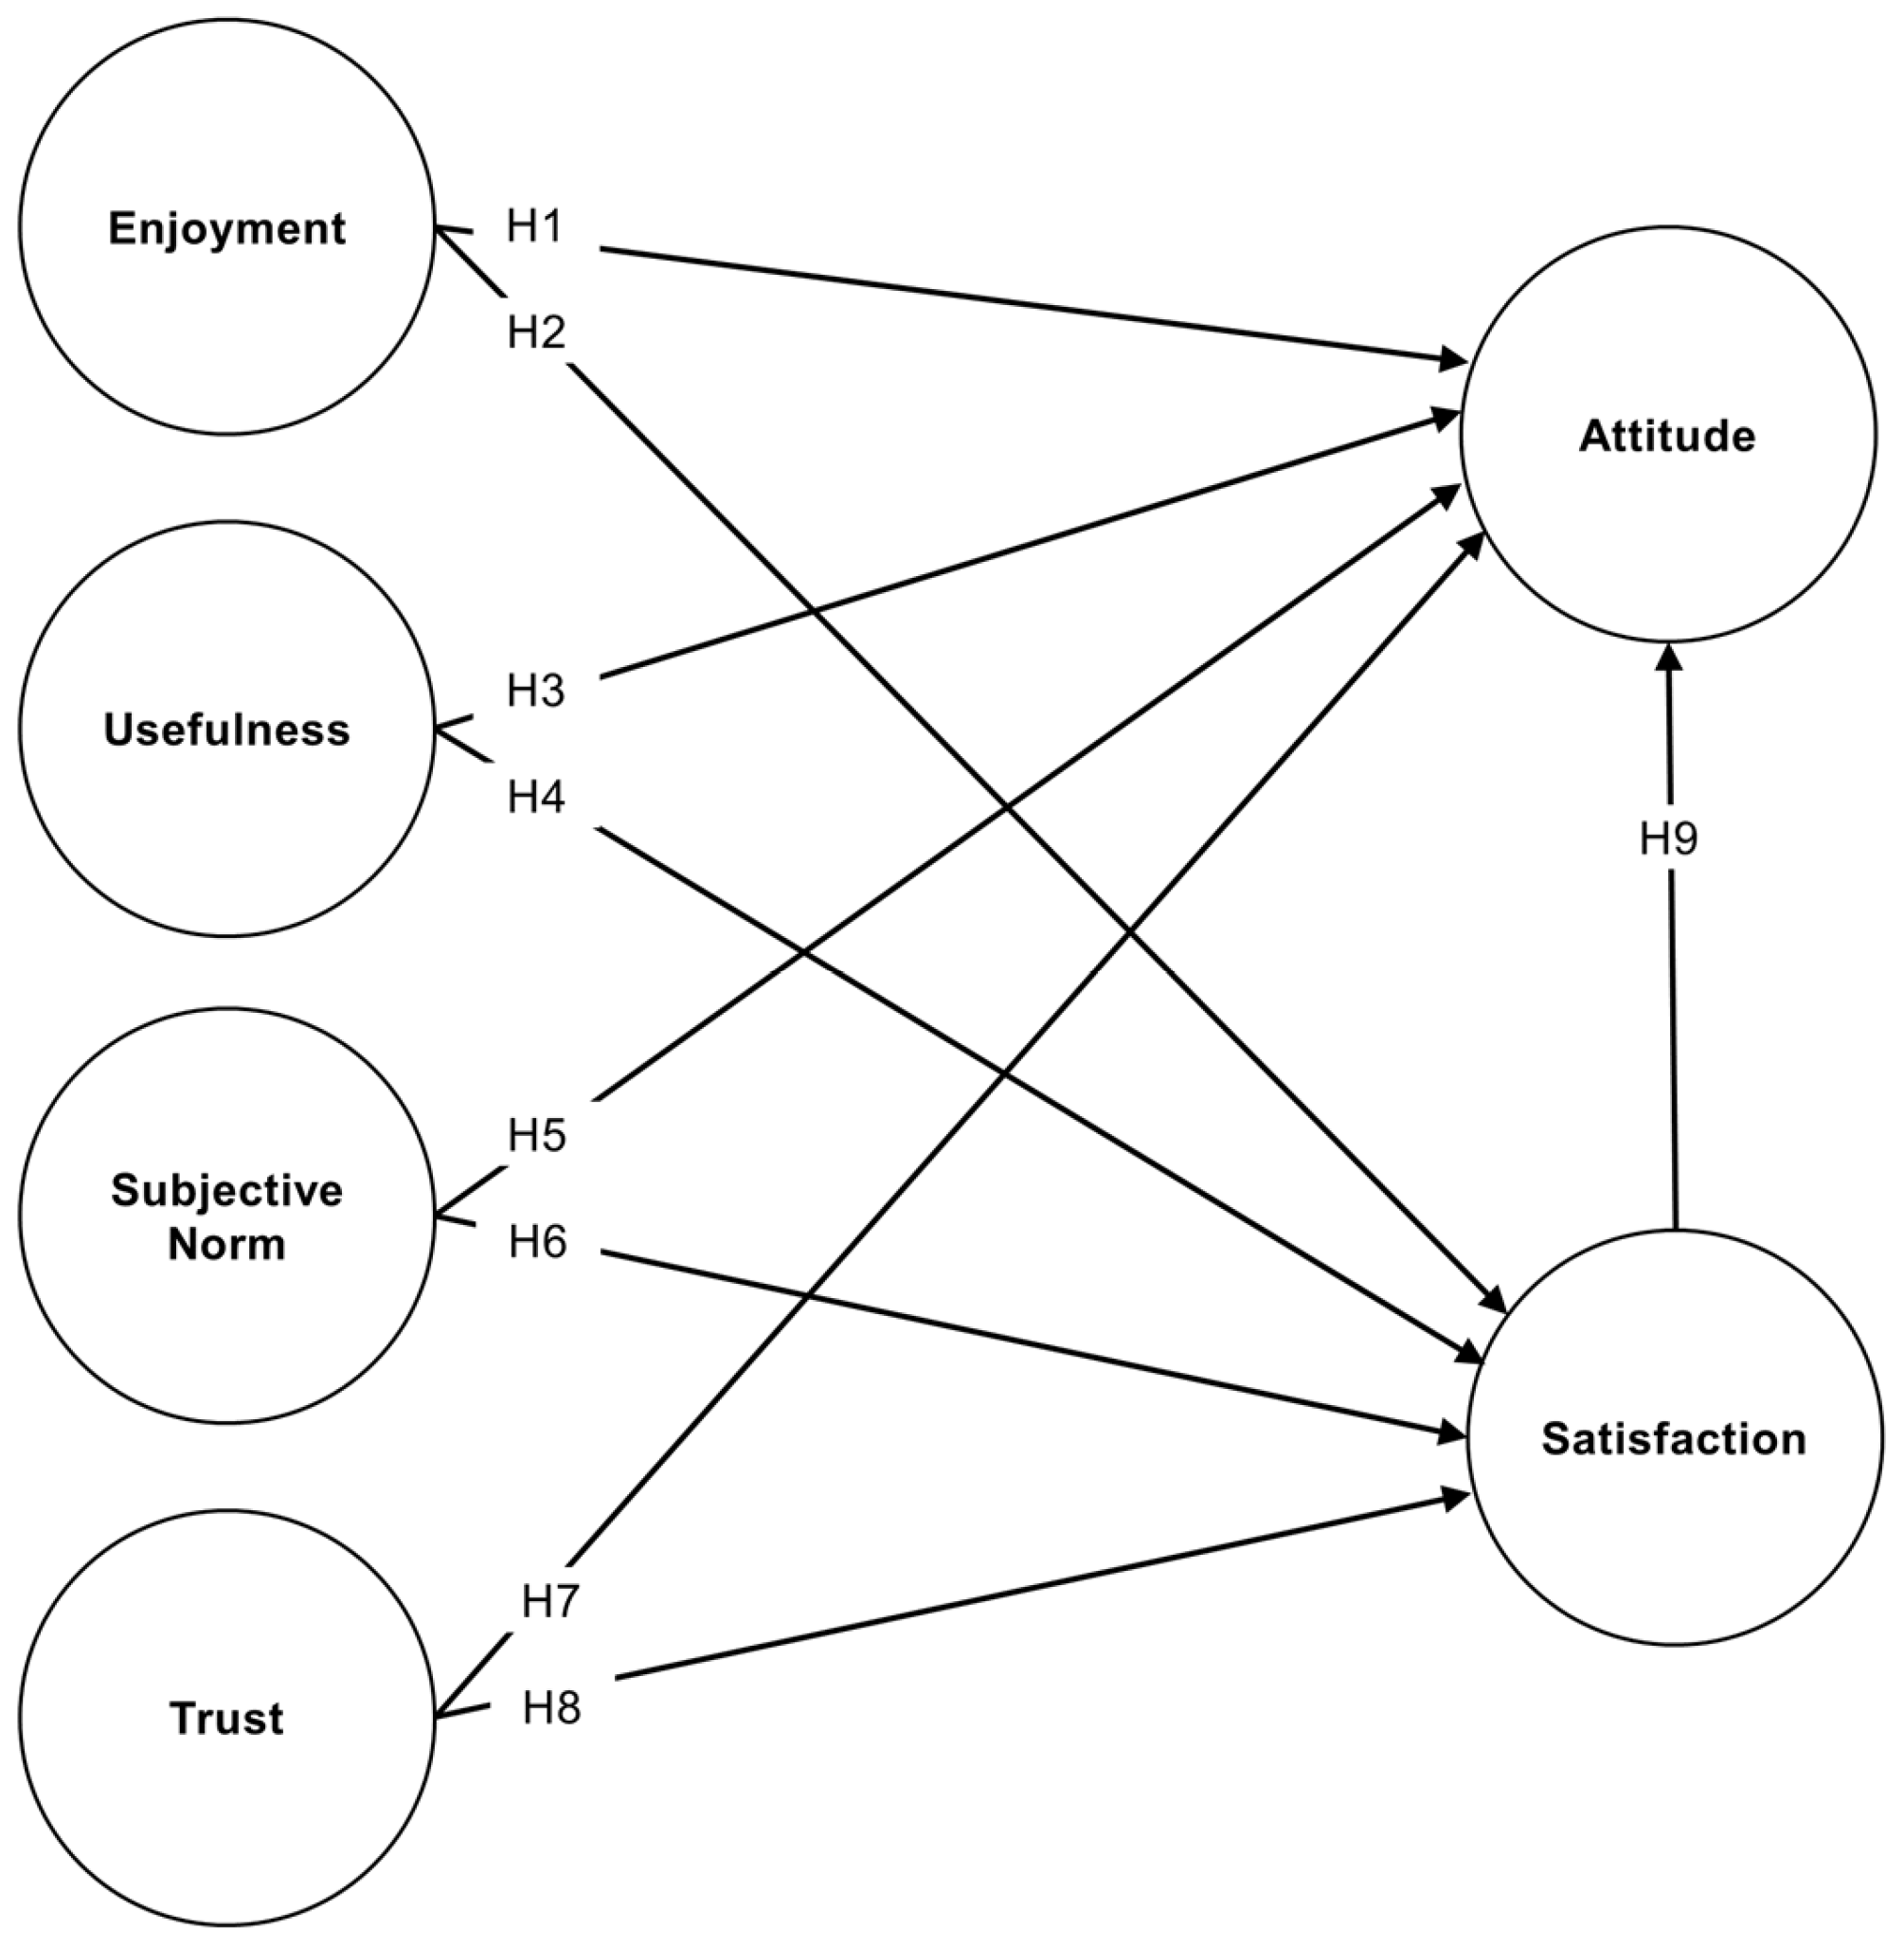
3. Hypotheses Development

M-commerce is inherently emotional, driven by entertainment and enjoyment, with consumers choosing it for “fun, excitement, and leisure activities” [11]. In a study focused on initial vs. continued m-commerce use, McLean et al. [26] uncovered that enjoyment associated with m-commerce apps is more impactful on consumers’ attitudes within the usage phase, compared to initial adoption. Thus, as a hedonic factor, enjoyment can act as an antecedent of m-commerce attitude [14,26].
Other studies emphasized the positive connection between enjoyment and satisfaction [33,34]. When m-commerce generates pleasure, fun, and enjoyment, consumers’ emotional conditions may alter and positive emotions arise, heightening satisfaction (Akdim et al., 2022) [13]. Thus, the fun enjoyment dimension of an app can impact both attitude and satisfaction [26,31,33,35,36,37]. Therefore, we propose the following:
H1: 
Enjoyment has a direct and significant impact on attitude for both less (H1a) and more experienced m-shoppers (H1b).
H2: 
Enjoyment has a direct and significant impact on satisfaction for both less (H2a) and more experienced m-shoppers (H2b).
However, enjoyment is not the sole factor influencing m-commerce adoption. People consider adopting new technologies if they perceive greater performance [2,4] and have a favorable attitude towards an app based on its “advantages, functionality, utility, and helpfulness” [38]. The relationship between usefulness and m-commerce attitude has been supported by prior studies [2,4,26,27,39,40]. Usefulness directly impacts system satisfaction according to Expectation Confirmation Theory (ECT) premises [24]. Customers display higher levels of m-shopping satisfaction “if they find it helpful” [34], as usefulness is viewed as an ‘innovation use’ prerequisite [41]. Thus, “efficiency and convenience of mobile shopping” amplify consumer satisfaction [11]. Other studies have examined the effect of usefulness on satisfaction in m-commerce contexts [35], confirming the positive relationship between these two concepts [13,31,36,37,41,42,43]. Thus, we propose the following:
H3: 
Usefulness has a direct and significant impact on attitude for both less (H3a) and more experienced m-shoppers (H3b).
H4: 
Usefulness has a direct and significant impact on satisfaction for both less (H4a) and more experienced m-shoppers (H4b).
When people decide whether to accept or reject an m-commerce app, they consider how their decision would impact their interpersonal ties [38]. In other words, consumers’ thoughts and attitudes towards m-commerce are likely to be impacted by their subjective connections with key people [2,21,44]. Viewing m-commerce, consumers can obtain advice from family, friends, and acquaintances because subjective norms reflect the extent to which individuals feel pressure from their peers to use or refrain from using a particular technology [21,27]. With mobile technologies, this positive relationship was confirmed for mobile grocery shopping applications [27], m-retail apps [26], and AR-mediated m-commerce [45].
Moreover, subjective norms or social influences have been examined as predictors of satisfaction with apps and m-commerce [46]. Marinković et al. [47] altered UTAUT to validate that social influences have an impact on consumers’ satisfaction with mobile technology. The positive role of subjective norms as drivers of satisfaction was explored in terms of various settings with a commercial component, such as food-delivery apps [48], ride-hailing apps [49], and mobile social apps [36]. Considering previous theoretical underpinnings, we propose the following:
H5: 
Subjective norms have a direct and significant impact on attitude for both less (H5a) and more experienced m-shoppers (H5b).
H6: 
Subjective norms have a direct and significant impact on satisfaction for both less (H6a) and more experienced m-shoppers (H6b).
Trust is a key influencer in “human–machine interactions” [50]. Established as the “individual willingness to depend based on the beliefs in ability, benevolence, and integrity” [51], trustworthiness is essential for m-commerce [52,53]. To use m-commerce, consumers have to download the app, initiate an account, and offer private details (including personal and financial information). Therefore, trust in m-commerce platforms is reflected in the belief that their data will not be mishandled [54,55]. Several studies emphasized the trust–attitude relationship considering m-commerce’s specific features [48,56], as prior research confirmed the role of trust in developing favorable attitudes [44,57].
Additionally, considering financial transactions and the sharing of personal data with unknown sellers, trust is also essential for customer satisfaction. Particularly, Amin et al. [41] uncovered a significant relationship between trust and satisfaction in mobile technology settings. Kalinc et al. [29] concluded that the satisfaction level associated with mobile applications (with a transaction component) significantly depends on the trust that customers have in these digital platforms. Thus, when assessing the degree of satisfaction, trust in m-commerce has a key role [4] and serves as a key predictor [48]. Previous m-commerce research asserted the impact of trust on consumer satisfaction [4,31,57,58]. Considering trust’s compelling role in m-commerce, this research focuses on expanding the theoretical framework by proposing the following:
H7: 
Trust has a direct and significant impact on attitude for both less (H7a) and more experienced m-shoppers (H7b).
H8: 
Trust has a direct and significant impact on satisfaction for both less (H8a) and more experienced m-shoppers (H8b).
Attitude, as a fundamental consumer behavior construct, reflects a positive or negative assessment of m-commerce actions or behaviors. Satisfaction, representing the evaluation of consumers’ overall experience with an m-shopping app, has a direct impact on attitude [37,59]. Positive evaluations of satisfaction can lead to favorable attitudes toward m-commerce. Therefore, we propose the following:
H9: 
Satisfaction has a direct and significant impact on attitude for both less (H9a) and more experienced m-shoppers (H9b).
Figure 1 highlights the proposed model of hypotheses.

4. Methodology

Structural equation modelling (SEM) is a widely applied technique in mobile commerce research, noted for its efficacy in hypothesis testing. However, the inherent linearity of SEM may impede the comprehensive analysis of complex human decision-making processes [35]. In this context, partial least squares SEM (PLS-SEM) is recognized for its robustness in hypothesis examination, yet it shares the linear constraints of traditional SEM methods. Conversely, artificial neural networks (ANNs), capable of delineating both linear and nonlinear relationships, offer a nuanced approach to modelling intricate behaviors but are not suitable for theory testing [29,35,60]. To address these methodological constraints, our study adopts a hybrid multi-analytic PLS-SEM-ANN framework. This integration aims to harness the strength of ANNs in capturing non-linear dynamics and generating “higher prediction accuracy compared to conventional linear techniques” [35], thereby mitigating the above-mentioned linear limitations of PLS-SEM. Notably, ANNs excel in handling complex variable interactions without the drawbacks of multicollinearity [61], enriching the analytical depth of our research. This innovative amalgamation not only enhances the predictive power but also underscores the methodological originality and applicability in scrutinizing the evolving paradigms of m-commerce research. Furthermore, the resemblance of ANNs’ operational mechanism to human neural processing amplifies their capacity in decoding intricate interactions between inputs and outputs in consumer behavior modelling [29,35,56], thereby contributing significantly to the domain of behavioral analytics in consumer behavior [62,63].

4.1. Measurement and Respondents’ Profile

This study aims to explore the impact of various drivers of satisfaction and attitude in m-commerce, focusing on active m-retail Romanian customers with different levels of experience in this shopping medium. Romania is selected as a suitable sample for m-commerce research due to its high Internet speed (100.66 Mbps) and widespread Internet access (89% of Romanians) [64,65]. Romanians also exhibit active m-shopping behavior, with an average m-commerce acquisition value of 46.48 Euro in 2022 [66], providing substantial commercial value for both domestic and international m-commerce businesses operating in this Central European economy.
Data were collected through a voluntary and anonymous web-based survey. The questionnaire underwent evaluation by professionals and pretesting to ensure clarity. To reflect varying levels of skills and experience with m-commerce, screening questions were included. Initially, data collection involved 217 respondents with less experience and 165 respondents with more experience in m-commerce. After applying screening questions and data inspection procedures to remove unengaged responses [67], the final qualified datasets for less and more experienced m-shoppers consisted of 214 and 158 observations, respectively. Table 1 presents the respondents’ profile, revealing distinctions between less and more experienced m-shoppers in terms of demographics, favorite m-commerce apps, and personal monthly income. For instance, less experienced m-shoppers had an average age of 26.43 years, while more experienced ones averaged 30.15 years old. Additionally, the distribution of favorite m-commerce apps and personal monthly income also exhibited notable differences between the two groups. Table 1 provides a comprehensive overview of the respondents’ profiles, shedding light on the diversity within the sample. The questionnaire items were extracted from relevant literature (Table 2) and measured using five-point Likert scales.

4.2. Data Analysis

The empirical data analysis for this research involved the use of IBM SPSS and SmartPLS v.4, employing measurement models, partial least squares modeling (PLS-SEM), and artificial neural networks (ANNs) as the primary methods. Partial least squares structural equation modeling (PLS-SEM) was chosen due to the study’s emphasis on theory-building and its exploratory nature [68,69]. Considering the multi-sample approach for less and more skillful m-shoppers, PLS-SEM was preferred due to its suitability for limited sample sizes and flexible data distribution [67,68]. The PLS algorithm was employed for the measurement models, and PLS-SEM facilitated the exploration of the conceptual model. The ‘path-based weighting scheme’ was utilized, and bootstrapping with 5000 subsamples, along with “bias-corrected and accelerated (BCa) bootstrap as confidence interval”, was applied [67,68,69]. The analysis was conducted separately for the two samples of respondents, representing those with more or less experience in m-commerce, utilizing both PLS-SEM and ANN methodologies. This approach aimed to provide a comprehensive understanding of the distinct segments within the dataset and ensure the robustness of the findings across different analytical techniques.

5. Results

The empirical analysis addressed the issue of common method bias [70] in various ways. First, a priori measures to minimize potential bias were considered in the data collection process, i.e., structuring the questionnaire in sections, scattering items of related constructs throughout the questionnaire [71], assuring respondents of the privacy and anonymity of their answers [70], and enabling respondents to select their preferred m-commerce apps to prevent unconscious bias. Second, the variance inflation factor (VIF) analysis was used to assess the multicollinearity condition [71] and all VIFs were lower than the 3.3 threshold [68]. Specifically, for less experienced m-shoppers, VIFs ranged from 1.463–2.888, and, for more experienced users, VIFs were between 1.388–2.727. Thus, the common method bias was not a prominent concern [68].
The measurement model implied convergent and discriminant validity examinations. Convergent validity involved the assessment of outer-loadings (Table 2), composite reliability (CR), average variance extracted (AVE), and Cronbach’s alpha for internal consistency. For both samples loadings, AVEs, CRs, and Cronbach’s alpha coefficients (α) were higher than the proposed values of 0.6, 0.5, 0.7, and 0.7, respectively (Table 2) [68]. The bootstrapping procedure revealed the significance for all loadings (p < 0.001). Discriminant validity (Table 3) was tested considering Fornell and Larcker’s [67,68] criterion and the heterotrait–monotrait ratio of correlations (HTMT) [67]). AVEs’ square roots (bolded values in Table 3) were higher than the pairwise correlations of the latent variables [67,72]; thus, the Fornell–Larcker criterion was met for both samples (Table 3). Moreover, the HTMT values were below the 0.9 threshold [67].
As we can see in Table 4, overall, the structural models developed for less and more experienced m-shoppers showed contrasting results among the two samples. H1 examined the positive connection between enjoyment and users’ attitude for m-commerce. This hypothesis was confirmed only for the less experienced m-shoppers (H1a: β = 0.098, p = 0.033 < 0.05), but not for more experienced users (H1b-rejected). Nonetheless, H2 and H3 were confirmed in both samples of respondents, showcasing significant results between enjoyment and consumers’ satisfaction with m-commerce (H2, H2a: Less experienced β = 0.265, p < 0.001; H2b: More experienced β = 0.186, p = 0.016 < 0.05) and usefulness and attitude towards m-commerce (H3, H3a: Less experienced β = 0.289, p < 0.001; H3b: More experienced β = 0.301, p < 0.001). H4 showed conflicting results: the relationship between usefulness and satisfaction was rejected for less-experienced m-shoppers (H4a), but it was confirmed for more experienced users (H4b: β = 0.378, p < 0.001). H5 explored the impact of the subjective norm on m-shoppers’ attitude; however, this hypothesis was rejected for both samples. Further, subjective norms had a positive and significant effect on the satisfaction of less experienced consumers (H6a: β = 0.173, p = 0.001); however, this relationship was rejected for more knowledgeable users. Thus, H6 was partially confirmed. H7 and H8 were supported for both samples, highlighting significant results for the key impact of trust on attitude (H7, H7a: Less experienced β = 0.356, p < 0.001; H7b: More experienced β = 0.389, p < 0.001) and on satisfaction (H8, H8a: Less experienced β = 0.289, p < 0.001; H8b: More experienced β = 0.357, p < 0.001). Finally, a consequential result was discovered for the relationship between satisfaction and attitude towards m-commerce (H9, H9a: Less experienced β = 0.438, p = 0.012 < 0.05; H2b: More experienced β = 0.238, p = 0.028 < 0.05), leading to H9 confirmation for both samples.
As we can see in Table 4, overall, the structural models developed for less and more experienced m-shoppers showed contrasting results among the two samples. H1 examined the positive connection between enjoyment and users’ attitude for m-commerce. This hypothesis was confirmed only for the less experienced m-shoppers (H1a: β = 0.098, p = 0.033 < 0.05), but not for more experienced users (H1b-rejected). Nonetheless, H2 and H3 were confirmed in both samples of respondents, showcasing significant results between enjoyment and consumers’ satisfaction with m-commerce (H2, H2a: Less experienced β = 0.265, p < 0.001; H2b: More experienced β = 0.186, p = 0.016 < 0.05) and usefulness and attitude towards m-commerce (H3, H3a: Less experienced β = 0.289, p < 0.001; H3b: More experienced β = 0.301, p < 0.001). H4 showed conflicting results: the relationship between usefulness and satisfaction was rejected for less-experienced m-shoppers (H4a), but it was confirmed for more experienced users (H4b: β = 0.378, p < 0.001). H5 explored the impact of the subjective norm on m-shoppers’ attitude; however, this hypothesis was rejected for both samples. Further, subjective norms had a positive and significant effect on satisfaction of less experienced consumers (H6a: β = 0.173, p = 0.001); however, this relationship was rejected for more knowledgeable users. Thus, H6 was partially confirmed. H7 and H8 were supported for both samples, highlighting significant results for the key impact of trust on attitude (H7, H7a: Less experienced β = 0.356, p < 0.001; H7b: More experienced β = 0.389, p < 0.001) and on satisfaction (H8, H8a: Less experienced β = 0.289, p < 0.001; H8b: More experienced β = 0.357, p < 0.001). Finally, a consequential result was discovered for the relationship between satisfaction and attitude towards m-commerce (H9, H9a: Less experienced β = 0.438, p = 0.012 < 0.05; H2b: More experienced β = 0.238, p = 0.028 < 0.05), leading to H9 confirmation for both samples. Figure 2 highlights the model results.
For both samples, the models’ quality was evaluated based on explained variance (R2) and predictive relevance (Q2). R2 highlighted high values for both dependent constructs examined for less (Attitude: R2 = 0.705; Satisfaction: R2 = 0.671) and more experienced m-shoppers (Attitude: R2 = 0.711; Satisfaction: R2 = 0.708). Similarly, the Q2 predicted relevance for less experienced (Attitude: Q2 = 0.674; Satisfaction: Q2 = 0.654) and more skillful m-shoppers (Attitude: Q2 = 0.674; Satisfaction: Q2 = 0.680) exceeded zero [67,73], supporting the predictive accuracy of both models. Additionally, significant results reflected notable effect sizes f2 [67,68] in both samples, as the highest effects were established for the ‘Trust->Satisfaction’ relationship for less experienced m-shoppers, and the ‘Usefulness->Satisfaction’ relationship for more experienced users. The standardized root mean square residual (SRMR) met the required threshold of <0.08, for both models of less (0.065) and more experienced (0.075) m-shoppers.
ANN modeling focused only on attitude’s significant predictors established by PLS-SEM [29,35,74]; thus, two ANN models were developed: ANN for less experienced m-shoppers included Enjoyment, Satisfaction, Trust, and Usefulness, whereas ANN for more experienced m-shoppers encompassed Satisfaction, Trust, and Usefulness. ANN modeling involved a multilayer perceptron with a feedforward backpropagation algorithm and a Sigmoid activation function (hidden and output layer) [35,75]. A ten-fold cross-validation approach was utilized to avoid overfitting, with 90% of the data used for training and 10% for testing. The Root Mean Square Error (RMSE) was used for model accuracy and indicated a good predictive precision due to low RMSEs and average RMSEs [29,60,62,63,76] (Table 5).
Furthermore, the performance of the ANN models was examined based on the R2 coefficient [35,61,63]. The ANN model for less experienced m-shoppers explains 70.41% of the variance in consumers’ attitudes towards m-commerce, whereas the corresponding value was 69.52% for m-shoppers with more experience. These values reconfirm the PLS-SEM results, offering additional support for model validation. Additionally, neural network modeling assessed the ranking of attitude’s drivers based on a sensitivity analysis of normalized variables’ importance [63]. Table 6 shows that for both samples and associated models, trust is the most important predictor of attitude, followed by usefulness. Figure 3 highlights the ANN results for the two examined models.
Finally, Table 7 provides a ranking comparison of attitude’s significant drivers in the proposed models. The ranking was established based on the PLS-SEM path coefficients and normalized importance established in ANN [77]. For both samples and associated models of less and more experienced m-shoppers, the ranking of significant predictors was matched, showcasing a congruence of the findings.

6. Discussion

This multi-sample, multi-analytic research has yielded interesting findings, providing insights into the attitudes and satisfaction of m-shoppers with varying levels of experience. Overall, the proposed conceptual model demonstrated a good fit for both less and more experienced m-shoppers.
For less experienced m-shoppers, the study confirmed the influence of fun and exciting shopping experiences on positive attitudes (H1a) and satisfaction (H2a) with m-commerce, aligning with prior research [26,31,33,36]. It suggests that less experienced users appreciate the novelty and enjoyment associated with m-commerce apps, leading to favorable attitudes and satisfaction. However, for more experienced users, the study found that only enjoyment significantly impacted satisfaction (H2b), and its effect on m-commerce attitude was rejected. For this study, the difference in hypothesis confirmation is related to the level of experience, as less experienced m-shoppers appreciate the novelty and fun characteristics of m-commerce apps. This discrepancy warrants further investigation and might be attributed to the evolving expectations and preferences of more experienced users.
In both samples, the research affirmed the importance of the usefulness of m-shopping apps in shaping positive consumer attitudes (H3), consistent with previous findings [26,27,71]. Consumers are more likely to develop positive attitudes toward m-commerce when they perceive it as time-saving, and the usefulness of m-shopping apps extends to the incorporation of helpful wish-lists for consumers (to monitor product availability and prices), expeditious ordering, and payment conveniences (saved card details and delivery preference; [61]). Consequently, customers are more likely to have positive perspectives of m-shopping if the app does not involve a laborious process. In H4, this study examined the impact of usefulness on satisfaction [78], leading to conflicting results: the hypothesis was confirmed for more experienced users but rejected for less experienced ones. This suggests that, as users become more familiar with m-commerce, the utility and convenience aspects play a more significant role in generating satisfaction.
Unexpectedly, subjective norms did not exhibit the anticipated relationship with attitude (H5), and this finding necessitates further exploration in future m-commerce studies. Moreover, the study investigated the role of subjective norms in driving consumer satisfaction with m-commerce (H6) and found confirmation only for less experienced users, aligning with previous research [46,47,48]. It implies that advice and influences from family and friends positively impact the satisfaction levels of less experienced users but may not hold the same weight for more knowledgeable users.
Trust was validated as a significant driver of consumers’ attitudes and satisfaction in the research framework (H7 and H8) by ANN results for both less and more experienced m-shoppers, aligning with previous findings [29,41,44,54]. Before embracing and utilizing technology-based transaction services, consumers must provide personal information to set up a profile on m-shopping apps [54]. In this case, trust must be maintained to guarantee that the m-commerce app will not improperly exploit the data. Furthermore, m-commerce interactions shape users’ satisfaction. Therefore, trust in m-commerce apps reflects a positive role in generating. Trust is crucial in ensuring the proper handling of personal data on m-shopping apps, and its positive impact on satisfaction [58]. Our findings corroborate the positive impact of satisfaction on attitude for both less and more experienced m-shoppers. When users are satisfied with the performance of m-commerce, they are more likely to develop positive attitudes toward this shopping format. This emphasizes the importance of ensuring a satisfying and efficient m-commerce experience to foster positive user attitudes.

7. Practical and Theoretical Implications

7.1. Practical Implications

The empirical findings of this research elucidate the ways mobile marketers can optimize their strategies, taking into account the varied skill and experience levels of consumers in mobile commerce (m-commerce). We identified the following practical implications:
  • Omnichannel Convergence and Personalized Experiences: By integrating seamless experiences across various channels, marketers can harness the power of omnichannel strategies in m-commerce applications to create more engaging and personalized shopping journeys. Tailoring these experiences to align with the user’s proficiency in navigating m-commerce platforms can lead to enhanced user engagement, satisfaction, and, ultimately, loyalty. For instance, novice users could be guided with more intuitive and educational content, while experienced shoppers might appreciate advanced filtering and search capabilities.
  • CRM Customization: It is vital for Customer Relationship Management (CRM) systems to adapt to the diverse spectrum of consumer expertise in m-commerce. By understanding and segmenting users based on their m-shopping experience, retailers can provide more personalized services, from product recommendations to experience-based promotional offerings. This level of customization not only improves the user experience but also strengthens the consumer-brand relationship.
  • Emphasis on Entertainment Value: M-commerce platforms should not only serve as transactional interfaces but also as engaging and entertaining environments. Features that integrate entertainment—such as gamification, interactive content, and personalized storytelling—can transform routine shopping into enjoyable experiences, thus enhancing consumer engagement and cultivating a positive brand image.
  • Security Features and Trust Building: For both less and more experienced m-shoppers, our findings highlight that security is paramount in earning consumer trust, especially in the digital shopping realm where concerns about data privacy and transaction safety prevail. M-retailers need to invest in robust security mechanisms and communicate these features effectively to consumers, highlighting their commitment to safeguarding user data and ensuring transactional integrity. This approach can significantly alleviate consumer apprehensions and bolster trust and confidence in the m-commerce platform.
  • Resource Allocation for Trust Building: Trust is the cornerstone of successful m-commerce ventures. Marketing strategies should, therefore, prioritize establishing and nurturing trust. This includes not just investing in advanced security technologies but also in transparent communication and reliable customer service. These efforts should aim to create a trustworthy brand image that resonates with both novice and experienced shoppers, encouraging repeat business and fostering brand loyalty.
  • Customer Retention Strategies: The research underscores the pivotal role of customer retention in m-commerce success. Strategies should be multifaceted, addressing the specific needs and preferences of different consumer segments. By leveraging data analytics to understand consumer behavior, retailers can deliver personalized and relevant content and offers. Effective use of push notifications and loyalty programs can act as key tools in maintaining ongoing engagement, enhancing the consumer’s shopping experience and, thus, retaining them in the long term.

7.2. Theoretical Implications

This research also contributes to the theoretical landscape of m-commerce by offering several implications:
  • Advanced Model with PLS-SEM and ANN: The hybrid approach using partial least squares structural equation modeling (PLS-SEM) and artificial neural networks (ANNs) presents a novel method for understanding consumer behavior in m-commerce. This approach recognizes the importance of consumers’ experience levels in shaping perceptions.
  • Consumer Segmentation Based on Experience: By examining less and more experienced m-shoppers separately, the research contributes to the literature by highlighting the importance of segmenting consumers based on their technology familiarity. This segmentation enables more accurate and efficient marketing strategies.
  • Identification of Key Drivers of M-Commerce Attitude: The study identifies trust and usefulness as significant antecedents of m-commerce attitude for both less and more experienced users. This insight adds to the existing literature by emphasizing the pivotal role of these factors in shaping consumers’ attitudes.
  • Multi-Sample Modeling Validation: The research extends m-commerce knowledge by employing a multi-sample methodology. This approach, validated through modeling, provides a foundation for developing targeted marketing tactics that consider the psychological dimensions of consumer–technology interactions.
In conclusion, the practical and theoretical implications derived from this research offer valuable guidance for mobile marketers and contribute to advancing the understanding of consumer behavior in the evolving landscape of m-commerce. The study offers valuable insights into the nuanced factors influencing m-shoppers’ attitudes and satisfaction, shedding light on the varying dynamics based on users’ experience levels. The findings contribute to the evolving landscape of m-commerce research, emphasizing the need for personalized strategies based on users’ familiarity with and knowledge of m-shopping.

8. Limitations and Future Research

In delving into the dynamics of mobile commerce and consumer behavior, we have uncovered certain constraints in our study and glimpsed potential avenues for future research. This exploration opens doors to further understanding the intricate interplay between mobile commerce and consumer behavior. Each limitation acts as a springboard, propelling future research endeavors and enriching our comprehension of this ever-evolving domain.
Our study, while insightful, is a snapshot in both time and space. Future investigations could embrace a longitudinal approach, tracing the evolution of consumer behavior in mobile commerce over time. The model we proposed underwent testing in Romania. To gauge its universal applicability, future studies might embark on cross-cultural comparisons, scrutinizing how well the model stands across different regions and cultures.
While we have taken a multi-sample approach based on user skills, there is an expansive landscape to explore regarding other user traits. Future research could delve into aspects like shopping frequency, financial behaviors, and the dynamics of user interactions with artificial intelligence.
The incorporation of artificial neural networks (ANNs) in our study is a step forward, but the journey does not end there. Future studies could unravel different facets of ANNs, delving into nuances like the comparison of results based on various activation functions.

Author Contributions

S.V.: conceptualization, methodology, validation, formal analysis, investigation, writing—original draft, visualization, supervision, and project administration. D.-C.D.: conceptualization, methodology, validation, formal analysis, investigation, writing—original draft, visualization, supervision, and project administration. G.D.: conceptualization, writing—reviewing and editing, investigation, validation, and supervision. All authors have read and agreed to the published version of the manuscript. Authorship is limited to those who have contributed substantially to the work reported.

Funding

The project is financed by Lucian Blaga University of Sibiu through the research grant LBUS-IRG-2022-08 and a project funded by CNCS–UEFISCDI, no. PNIII-RU-TE-2021-0795.

Institutional Review Board Statement

Not applicable.

Informed Consent Statement

Informed consent was obtained from all subjects involved in the study.

Data Availability Statement

The data that have been used are confidential.

Acknowledgments

Project financed by Lucian Blaga University of Sibiu through the research grant LBUS-IRG-2022-08.

Conflicts of Interest

The authors declare no conflicts of interest.

References

  1. Statista.com. Number of Mobile App Downloads Worldwide from 2016 to 2023. 2024. Available online: https://www.statista.com/statistics/271644/worldwide-free-and-paid-mobile-app-store-downloads/ (accessed on 3 February 2024).
  2. Ghazali, E.M.; Mutum, D.S.; Chong, J.H.; Nguyen, B. Do consumers want mobile commerce? A closer look at M-shopping and technology adoption in Malaysia. Asia Pac. J. Mark. Logist. 2018, 30, 1064–1086. [Google Scholar] [CrossRef]
  3. Pop, R.A.; Hlédik, E.; Dabija, D.C. Predicting consumers’ purchase intention through fast fashion mobile apps: The mediating role of attitude and the moderating role of COVID-19. Technol. Forecast. Soc. Chang. 2023, 186, 122111. [Google Scholar] [CrossRef]
  4. Chi, T. Understanding Chinese consumer adoption of apparel mobile commerce: An extended TAM approach. J. Retail. Consum. Serv. 2018, 44, 274–284. [Google Scholar] [CrossRef]
  5. Al-Adwan, A.S.; Al-Debei, M.M.; Dwivedi, Y.K. E-commerce in high uncertainty avoidance cultures: The driving forces of repurchase and word-of-mouth intentions. Technol. Soc. 2022, 71, 102083. [Google Scholar] [CrossRef]
  6. Kao, W.K.; L’Huillier, E.A. The moderating role of social distancing in mobile commerce adoption. Electron. Commer. Res. Appl. 2022, 52, 101116. [Google Scholar] [CrossRef]
  7. Palumbo, F.; Dominici, G.; Basile, G. The Culture on the Palm of Your Hand: How to Design a User Oriented Mobile App for Museums. In Handbook of Research on Management of Cultural Products: E-Relationship Marketing and Accessibility Perspectives; Aiello, L., Ed.; IGI Global: Hersey, NJ, USA, 2014. [Google Scholar]
  8. Statista.com. Share of online shoppers planning to purchase more through mobile in the next five years as of 2021. 2022. Available online: https://www.statista.com/statistics/1314807/mobile-shopping-in-the-next-five-years-by-country/ (accessed on 18 December 2023).
  9. InsiderIntelligence.com. Mobile Trends to Watch in 2024. 2023. Available online: https://www.insiderintelligence.com/content/mobile-trends-watch-2024 (accessed on 4 February 2024).
  10. De Canio, F.; Fuentes-Blasco, M.; Martinelli, E. Extrinsic motivations behind mobile shopping: What drives regular and occasional shoppers? Int. J. Retail. Distrib. Manag. 2022, 50, 962–980. [Google Scholar] [CrossRef]
  11. Hu, L.; Filieri, R.; Acikgoz, F.; Zollo, L.; Rialti, R. The effect of utilitarian and hedonic motivations on mobile shopping outcomes. A cross-cultural analysis. Int. J. Consum. Stud. 2023, 47, 751–766. [Google Scholar] [CrossRef]
  12. Groß, M. Heterogeneity in consumers’ mobile shopping acceptance: A finite mixture partial least squares modelling approach for exploring and characterising different shopper segments. J. Retail. Consum. Serv. 2018, 40, 8–18. [Google Scholar] [CrossRef]
  13. Akdim, K.; Casaló, L.V.; Flavián, C. The role of utilitarian and hedonic aspects in the continuance intention to use social mobile apps. J. Retail. Consum. Serv. 2022, 66, 102888. [Google Scholar] [CrossRef]
  14. Yang, K. Consumer technology traits in determining mobile shopping adoption: An application of the extended theory of planned behavior. J. Retail. Consum. Serv. 2012, 19, 484–491. [Google Scholar] [CrossRef]
  15. Van Heerde, H.J.; Dinner, I.M.; Neslin, S.A. Engaging the unengaged customer: The value of a retailer mobile app. Int. J. Res. Mark. 2019, 36, 420–438. [Google Scholar] [CrossRef]
  16. Wen, C.; Wang, N.; Fang, J.; Huang, M. An Integrated Model of Continued M-Commerce Applications Usage. J. Comput. Inf. Syst. 2023, 63, 632–647. [Google Scholar] [CrossRef]
  17. Molinillo, S.; Aguilar-Illescas, R.; Anaya-Sánchez, R.; Carvajal-Trujillo, E. The customer retail app experience: Implications for customer loyalty. J. Retail. Consum. Serv. 2022, 65, 102842. [Google Scholar] [CrossRef]
  18. Tong, S.; Luo, X.; Xu, B. Personalized mobile marketing strategies. J. Acad. Mark. Sci. 2019, 48, 64–78. [Google Scholar] [CrossRef]
  19. Vinerean, S.; Budac, C.; Baltador, L.A.; Dabija, D.-C. Assessing the Effects of the COVID-19 Pandemic on M-Commerce Adoption: An Adapted UTAUT2 Approach. Electronics 2022, 11, 1269. [Google Scholar] [CrossRef]
  20. Fishbein, M.; Ajzen, I. Belief, Attitude, Intention, and Behavior: An Introduction to Theory and Research; Addison-Wesley: Reading, MA, USA, 1975. [Google Scholar]
  21. Ajzen, I. The Theory of Planned Behavior. Organ. Behav. Hum. Decis. Process. 1991, 50, 179–211. [Google Scholar] [CrossRef]
  22. Davis, F.D. Perceived usefulness, perceived ease of use, and user acceptance of information technology. MIS Q. 1989, 13, 319–340. [Google Scholar] [CrossRef]
  23. Venkatesh, V.; Thong, J.Y.; Xu, X. Consumer acceptance and use of information technology: Extending the unified theory of acceptance and use of technology. MIS Q. 2012, 36, 157–178. [Google Scholar] [CrossRef]
  24. Bhattacherjee, A. Understanding information systems continuance: An expectation-confirmation model. MIS Q. 2001, 25, 351–370. [Google Scholar] [CrossRef]
  25. Murillo Montes de Oca, A.; Nistor, N. Non-significant intention–behavior effects in educational technology acceptance: A case of competing cognitive scripts? Comput. Hum. Behav. 2014, 34, 333–338. [Google Scholar] [CrossRef]
  26. McLean, G.; Osei-Frimpong, K.; Al-Nabhani, K.; Marriott, H. Examining consumer attitudes towards retailers’ m-commerce mobile applications–An initial adoption vs. continuous use perspective. J. Bus. Res. 2020, 106, 139–157. [Google Scholar] [CrossRef]
  27. Al Amin, M.; Arefin, M.S.; Hossain, I.; Islam, M.R.; Sultana, N.; Hossain, M.N. Evaluating the determinants of customers’ mobile grocery shopping application (MGSA) adoption during COVID-19 pandemic. J. Glob. Mark. 2022, 35, 228–247. [Google Scholar] [CrossRef]
  28. González Bravo, L.; Fernández Sagredo, M.; Torres Martínez, P.; Barrios Penna, C.; Fonseca Molina, J.; Stanciu, I.D.; Nistor, N. Psychometric analysis of a measure of acceptance of new technologies (UTAUT), applied to the use of haptic virtual simulators in dental students. Eur. J. Dent. Educ. 2020, 24, 706–714. [Google Scholar] [CrossRef] [PubMed]
  29. Kalinić, Z.; Marinković, V.; Djordjevic, A.; Liebana-Cabanillas, F. What drives customer satisfaction and word of mouth in mobile commerce services? A UTAUT2-based analytical approach. J. Enterp. Inf. Manag. 2019, 33, 71–94. [Google Scholar] [CrossRef]
  30. Tam, C.; Santos, D.; Oliveira, T. Exploring the influential factors of continuance intention to use mobile Apps: Extending the expectation confirmation model. Inf. Syst. Front. 2020, 22, 243–257. [Google Scholar] [CrossRef]
  31. Mishra, A.; Shukla, A.; Rana, N.P.; Currie, W.L.; Dwivedi, Y.K. Re-examining post-acceptance model of information systems continuance: A revised theoretical model using MASEM approach. Int. J. Inf. Manag. 2023, 68, 102571. [Google Scholar] [CrossRef]
  32. Maduku, D.K.; Thusi, P. Understanding consumers’ mobile shopping continuance intention: New perspectives from South Africa. J. Retail. Consum. Serv. 2023, 70, 103185. [Google Scholar] [CrossRef]
  33. Kim, J.; Nam, C. Analyzing continuance intention of recommendation algorithms. In Proceedings of the 30th European Conference of the International Telecommunications Society (ITS): “Towards a Connected and Automated Society”, Helsinki, Finland, 16–19 June 2019. [Google Scholar]
  34. San-Martín, S.; López-Catalán, B.; Ramón-Jerónimo, M.A. Signalling as a means to generate loyalty in m-commerce: Does shopper experience moderate the process? J. Cust. Behav. 2015, 14, 235–256. [Google Scholar] [CrossRef]
  35. Kalinić, Z.; Marinković, V.; Kalinić, L.; Liébana-Cabanillas, F. Neural network modeling of consumer satisfaction in mobile commerce: An empirical analysis. Expert Syst. Appl. 2021, 175, 114803. [Google Scholar] [CrossRef]
  36. Hsiao, C.-H.; Chang, J.-J.; Tang, K.-Y. Exploring the influential factors in continuance usage of mobile social Apps: Satisfaction, habit, and customer value perspectives. Telemat. Inform. 2016, 33, 342–355. [Google Scholar] [CrossRef]
  37. Foroughi, B.; Yadegaridehkordi, E.; Iranmanesh, M.; Sukcharoen, T.; Ghobakhlo, M.; Nilashi, M. Determinants of continuance intention to use food delivery apps: Findings from PLS and fsQCA. Int. J. Contemp. Hosp. Manag. 2023, 36, 1235–1261. [Google Scholar] [CrossRef]
  38. Vahdat, A.; Alizadeh, A.; Quach, S.; Hamelin, N. Would you like to shop via mobile app technology? The technology acceptance model, social factors and purchase intention. Australas. Mark. J. 2020, 29, 187–197. [Google Scholar] [CrossRef]
  39. Lee, E.-Y.; Lee, S.-B.; Jeon, Y.J.J. Factors influencing the behavioral intention to use food delivery apps. Soc. Behav. Personal. Int. J. 2017, 45, 1461–1473. [Google Scholar] [CrossRef]
  40. Min, S.; So, K.K.F.; Jeong, M. Consumer adoption of the Uber mobile application: Insights from diffusion of innovation theory and technology acceptance model. J. Travel Tour. Mark. 2019, 36, 770–783. [Google Scholar] [CrossRef]
  41. Amin, M.; Rezaei, S.; Abolghasemi, M. User satisfaction with mobile websites: The impact of perceived usefulness (PU), perceived ease of use (PEOU) and trust. Nankai Bus. Rev. Int. 2014, 5, 258–274. [Google Scholar] [CrossRef]
  42. Kar, A.K. What affects usage satisfaction in mobile payments? Modelling user generated content to develop the “digital service usage satisfaction model”. Inf. Syst. Front. 2021, 23, 1341–1361. [Google Scholar] [CrossRef] [PubMed]
  43. Foroughi, B.; Iranmanesh, M.; Kuppusamy, M.; Ganesan, Y.; Ghobakhloo, M.; Senali, M.G. Determinants of continuance intention to use gamification applications for task management: An extension of technology continuance theory. Electron. Libr. 2023, 41, 286–307. [Google Scholar] [CrossRef]
  44. Arpaci, I. Understanding and predicting students’ intention to use mobile cloud storage services. Comput. Hum. Behav. 2016, 58, 150–157. [Google Scholar] [CrossRef]
  45. Manchanda, M.; Deb, M. On m-Commerce Adoption and Augmented Reality: A Study on Apparel Buying Using m-Commerce in Indian Context. J. Internet Commer. 2020, 20, 84–112. [Google Scholar] [CrossRef]
  46. Chen, X.; Miraz, M.H.; Gazi, M.A.I.; Rahaman, M.A.; Habib, M.M.; Hossain, A.I. Factors affecting cryptocurrency adoption in digital business transactions: The mediating role of customer satisfaction. Technol. Soc. 2022, 70, 102059. [Google Scholar] [CrossRef]
  47. Marinković, V.; Đorđević, A.; Kalinić, Z. The moderating effects of gender on customer satisfaction and continuance intention in mobile commerce: A UTAUT-based perspective. Technol. Anal. Strateg. Manag. 2020, 32, 306–318. [Google Scholar] [CrossRef]
  48. Zhao, Y.; Bacao, F. What factors determining customer continuingly using food delivery apps during 2019 novel coronavirus pandemic period? Int. J. Hospit. Manag. 2020, 91, 102683. [Google Scholar] [CrossRef]
  49. Nguyen, D.G.; Ha, M.T. What makes users continue to want to use the digital platform? Evidence from the ride-hailing service platform in Vietnam. SAGE Open 2022, 12, 21582440211. [Google Scholar] [CrossRef]
  50. Pitardi, V.; Marriott, H.R. Alexa, she’s not human but… Unveiling the drivers of consumers’ trust in voice-based artificial intelligence. Psychol. Mark. 2021, 38, 626–642. [Google Scholar] [CrossRef]
  51. Gefen, D. TAM or just plain habit: A look at experienced online shoppers. J. Organ. End User Comput. 2003, 15, 1–13. [Google Scholar] [CrossRef]
  52. Alalwan, A.A.; Baabdullah, A.M.; Rana, N.P.; Tamilmani, K.; Dwivedi, Y.K. Examining adoption of mobile internet in Saudi Arabia: Extending TAM with perceived enjoyment, innovativeness and trust. Technol. Soc. 2018, 55, 100–110. [Google Scholar] [CrossRef]
  53. Sim, J.J.; Loh, S.H.; Wong, K.L.; Choong, C.K. Do We Need Trust Transfer Mechanisms? An M-Commerce Adoption Perspective. J. Theor. Appl. Electron. Commer. Res. 2021, 16, 2241–2262. [Google Scholar] [CrossRef]
  54. Kaushik, A.K.; Mohan, G.; Kumar, V. Examining the Antecedents and Consequences of Customers’ Trust Toward Mobile Retail Apps in India. J. Internet Commer. 2019, 19, 1–31. [Google Scholar] [CrossRef]
  55. Toma, C.L. Perceptions of trustworthiness online: The role of visual and textual information. In Proceedings of the 2010 ACM Conference on Computer Supported Cooperative Work, CSCW 2010, Savannah, GA, USA, 6–10 February 2010. [Google Scholar] [CrossRef]
  56. Khaw, K.W.; Alnoor, A.; Al-Abrrow, H.; Chew, X.; Sadaa, A.M.; Abbas, S.; Khattak, Z.Z. Modelling and evaluating trust in mobile commerce: A hybrid three stage Fuzzy Delphi, structural equation modeling, and neural network approach. Int. J. Hum. Comp. Interact. 2022, 38, 1529–1545. [Google Scholar] [CrossRef]
  57. Hajiheydari, N.; Ashkani, M. Mobile application user behavior in the developing countries: A survey in Iran. Inf. Syst. 2018, 77, 22–33. [Google Scholar] [CrossRef]
  58. Sarkar, S.; Chauhan, S.; Khare, A. A meta-analysis of antecedents and consequences of trust in mobile commerce. Int. J. Inf. Manag. 2020, 50, 286–301. [Google Scholar] [CrossRef]
  59. Smith, T.A. The role of customer personality in satisfaction, attitude-to-brand and loyalty in mobile services. Span. J. Mark.-ESIC 2020, 24, 155–175. [Google Scholar] [CrossRef]
  60. Arpaci, I.; Karatas, K.; Kusci, I.; Al-Emran, M. Understanding the social sustainability of the Metaverse by integrating UTAUT2 and big five personality traits: A hybrid SEM-ANN approach. Technol. Soc. 2022, 71, 102120. [Google Scholar] [CrossRef]
  61. Leong, L.-Y.; Hew, T.-S.; Ooi, K.-B.; Chong, A.Y.-L. Predicting the antecedents of trust in social commerce—A hybrid structural equation modeling with neural network approach. J. Bus. Res. 2020, 110, 24–40. [Google Scholar] [CrossRef]
  62. Hew, J.-J.; Leong, L.-Y.; Tan, G.W.-H.; Lee, V.-H.; Ooi, K.-B. Mobile social tourism shopping: A dual-stage analysis of a multi-mediation model. Tour. Manag. 2018, 66, 121–139. [Google Scholar] [CrossRef]
  63. Lee, V.-H.; Hew, J.-J.; Leong, L.-Y.; Wei-Han Tan, G.; Ooi, K.-B. Wearable payment: A deep learning-based dual-stage SEM-ANN analysis. Expert Syst. Appl. 2020, 157, 113477. [Google Scholar] [CrossRef]
  64. Cable.co.uk. Worldwide Broadband Speed League 2023. 2023. Available online: https://www.cable.co.uk/broadband/speed/worldwide-speed-league/ (accessed on 26 November 2023).
  65. Eurostat. Online Shopping Ever More Popular. 2023. Available online: https://ec.europa.eu/eurostat/statistics-explained/index.php?title=Digital_economy_and_society_statistics_-_households_and_individuals (accessed on 20 August 2023).
  66. GPEC.ro. Raport GPeC E-Commerce România 2022. 2023. Available online: https://www.gpec.ro/blog/raport-gpec-e-commerce-romania-2022-cumparaturi-online-de-63-miliarde-de-euro (accessed on 6 August 2023).
  67. Hair, J.F.; Hult, G.T.M.; Ringle, C.; Sarstedt, M. A Primer on Partial Least Squares Structural Equation Modeling; SAGE Publication: Thousand Oaks, CA, USA, 2017. [Google Scholar]
  68. Hair, J.F.; Risher, J.J.; Sarstedt, M.; Ringle, C.M. When to use and how to report the results of PLS-SEM. Eur. Bus. Rev. 2019, 31, 2–24. [Google Scholar] [CrossRef]
  69. Ringle, C.M.; Wende, S.; Becker, J.-M. SmartPLS 4; SmartPLS GmbH: Oststeinbek, Germany, 2022. [Google Scholar]
  70. Podsakoff, P.M.; MacKenzie, S.B.; Lee, J.Y.; Podsakoff, N.P. Common method biases in behavioral research: A critical review of the literature and recommended remedies. J. Appl. Psychol. 2003, 88, 879–903. [Google Scholar] [CrossRef] [PubMed]
  71. McLean, G.; Wilson, A. Shopping in the digital world: Examining customer engagement through augmented reality mobile applications. Comput. Hum. Behav. 2019, 101, 210–224. [Google Scholar] [CrossRef]
  72. Fornell, C.; Larcker, D.F. Evaluating structural equation models with unobservable variables and measurement error. J. Mark. Res. 1981, 18, 39–50. [Google Scholar] [CrossRef]
  73. Becker, J.M.; Cheah, J.H.; Gholamzade, R.; Ringle, C.M.; Sarstedt, M. PLS-SEM’s most wanted guidance. Int. J. Contemp. Hosp. Manag. 2023, 35, 321–346. [Google Scholar] [CrossRef]
  74. Alam, M.Z.; Hu, W.; Kaium, M.A.; Hoque, M.R.; Alam, M.M.D. Understanding the determinants of mHealth apps adoption in Bangladesh: A SEM-Neural network approach. Technol. Soc. 2020, 61, 101255. [Google Scholar] [CrossRef]
  75. Liébana-Cabanillas, F.; Marinković, V.; Kalinić, Z. A SEM-neural network approach for predicting antecedents of m-commerce acceptance. Int. J. Inf. Manag. 2017, 37, 14–24. [Google Scholar] [CrossRef]
  76. Ooi, K.B.; Hew, J.J.; Lin, B. Unfolding the privacy paradox among mobile social commerce users: A multi-mediation approach. Behav. Inf. Technol. 2018, 37, 575–595. [Google Scholar] [CrossRef]
  77. Wang, G.; Tan, G.W.H.; Yuan, Y.; Ooi, K.B.; Dwivedi, Y.K. Revisiting TAM2 in behavioral targeting advertising: A deep learning-based dual-stage SEM-ANN analysis. Technol. Forecast. Soc. Chang. 2022, 175, 121345. [Google Scholar] [CrossRef]
  78. Abdul-Halim, N.A.; Vafaei-Zadeh, A.; Hanifah, H.; Teoh, A.P.; Nawaser, K. Understanding the determinants of e-wallet continuance usage intention in Malaysia. Qual. Quant. 2022, 56, 3413–3439. [Google Scholar] [CrossRef]
Figure 1. Proposed model.
Jtaer 19 00050 g001
Figure 2. Model results: (a) less experienced m-shoppers; (b) more experienced m-shoppers. Note: * p < 0.05; ** p < 0.01; *** p < 0.001; n.s. = not significant.
Jtaer 19 00050 g002
Figure 3. ANN results based on: Hidden layer activation function: Sigmoid; Output layer activation function: Sigmoid. (a) Less experienced m-shoppers; (b) More experienced m-shoppers.
Jtaer 19 00050 g003
Table 1. Respondents’ profile.
Variable Less Experienced m-Shoppers (N = 214) (%)More Experienced m-Shoppers (N = 158) (%)
GenderFemale77.666.5
Male22.433.5
Employment statusStudent61.243.0
Employed36.951.9
Searching for a job1.95.1
Favorite
m-commerce apps
Food-and-delivery apps25.720.9
Fashion apps48.643.0
Grocery shopping apps3.78.9
Beauty products apps15.913.3
Other6.113.9
Personal monthly income (Euro/month) <50058.941.1
501–1000 30.431.0
1001–1500 7.916.5
>15012.810.8
Table 2. Construct reliability and validity.
Items (Sources)Less ExperiencedMore Experienced
Loadingsα/CR/AVELoadingsα/CR/AVE
M-Commerce Attitude [2,38] 0.867/0.876/0.790 0.855/0.857/0.775
AT1: “Overall, I feel favorable toward m-commerce.”0.875 ***0.869 ***
AT2: “Using m-commerce seems like a good idea to me.”0.892 ***0.892 ***
AT3: “I feel positive about shopping on m-commerce apps.”0.899 ***0.880 ***
Enjoyment [26,33,35] 0.784/0.796/0.699 0.736/0.764/0.652
E1: “M-commerce is fun.”0.815 ***0.812 ***
E2: “M-commerce is enjoyable.”0.888 ***0.855 ***
E3: “M-commerce is very entertaining.”0.802 ***0.751 ***
Satisfaction [24,48] 0.853/0.856/0.774 0.858/0.860/0.778
SAT1: “I am very satisfied that m-commerce apps meet my requirements.”0.910 ***0.892 ***
SAT2: “My interaction with mobile shopping is very satisfying. ”0.905 ***0.884 ***
SAT3: “Overall, I am satisfied with my experience with m-commerce.”0.822 ***0.870 ***
Subjective Norms [2,23,26] 0.720/0.758/0.778 0.764/0.765/0.809
SN1: “Important people in my life encourage me to adopt m-commerce.”0.848 ***0.897 ***
SN2: “People who are important to me support me to use mobile commerce.”0.916 ***0.902 ***
Trust [2,48] 0.858/0.858/0.704 0.834/0.837/0.670
TR1: “I believe m-commerce apps are trustworthy.”0.891 ***0.881 ***
TR2: “The information provided on m-commerce apps is reliable.”0.775 ***0.731 ***
TR3: “I felt secure in ordering and receiving orders through m-commerce apps.”0.882 ***0.855 ***
TR4: “The information provided by mobile shopping apps is reliable.”0.803 ***0.799 ***
Usefulness [22,23] 0.806/0.807/0.722 0.797/0.803/0.710
U1: “I would find m-commerce useful in my daily life.”0.810 ***0.864 ***
U2: “Using m-commerce would increase my productivity.”0.866 ***0.836 ***
U3: “Using m-commerce would help me accomplish things more quickly.”0.872 ***0.828 ***
Note: Loadings > 0.6; Cronbach’s Alpha/α > 0.7; Average variance extracted (AVE) > 0.5; Composite reliability (CR) > 0.7; *** p < 0.001.
Table 3. Discriminant validity.
SampleVariablesFornell–Larcker CriterionHeterotrait–Monotrait Ratio (HTMT)
123456123456
Less experienced
m-shoppers
1. Enjoyment0.836
2. M-commerce Attitude0.5960.889 0.720
3. Satisfaction0.6620.7390.880 0.8070.859
4. Subjective
Norm
0.5160.4810.5820.882 0.6740.5990.731
5. Trust0.5780.7720.7490.4970.839 0.7020.8940.8740.623
6. Usefulness0.5010.7070.6150.4990.6540.8490.6170.8450.7440.6450.786
More experienced
m-shoppers
1. Enjoyment0.808
2. M-commerce Attitude0.6220.880 0.766
3. Satisfaction0.6740.7600.882 0.8280.884
4. Subjective
Norm
0.4740.3790.4940.900 0.6280.4650.605
5. Trust0.6200.7630.7390.4330.819 0.7880.8960.8680.541
6. Usefulness0.6160.7280.7490.4750.6250.8430.7920.8760.8950.6120.756
Note: The bold diagonal factors are the square roots of constructs’ AVEs.
Table 4. PLS-SEM results.
SampleHypothesesCoefft-TestCI 1f2Sig.Result
Less experienced m-shoppersH1aEnjoyment→Attitude0.0982.1350.007–0.1890.0170.033 *Supported
H2aEnjoyment→Satisfaction0.2654.7770.153–0.3720.1260.000 ***Supported
H3aUsefulness→Attitude0.2894.5980.167–0.4130.1450.000 ***Supported
H4aUsefulness→Satisfaction0.1091.479−0.031–0.2560.0190.139 n.s.Rejected
H5aSubjective Norm→Attitude−0.0370.674−0.142–0.0730.0030.500 n.s.Rejected
H6aSubjective Norm→Satisfaction0.1733.3020.07–0.2760.0590.001 ***Supported
H7aTrust→Attitude0.3564.2180.183–0.5080.1610.000 ***Supported
H8aTrust→Satisfaction0.4386.6610.303–0.5580.2780.000 ***Supported
H9aSatisfaction→Attitude0.2512.5100.07–0.4600.0700.012 *Supported
More experienced m-shoppersH1bEnjoyment→Attitude0.0761.111−0.062–0.2020.0090.267 n.s.Rejected
H2bEnjoyment→Satisfaction0.1862.4120.025–0.330.0600.016 *Supported
H3bUsefulness→Attitude0.3014.0130.145–0.4350.1270.000 ***Supported
H4bUsefulness→Satisfaction0.3784.9390.222–0.5210.2450.000 ***Supported
H5bSubjective Norm→Attitude−0.0861.498−0.187–0.0390.0180.134 n.s.Rejected
H6bSubjective Norm→Satisfaction0.0711.242−0.03–0.1920.0120.214 n.s.Rejected
H7bTrust→Attitude0.3894.0760.189–0.5630.2210.000 ***Supported
H8bTrust→Satisfaction0.3574.1850.192–0.5310.2250.000 ***Supported
H9bSatisfaction→Attitude0.2382.1920.048–0.4750.0570.028 *Supported
Note: * p < 0.05; ** p < 0.01; *** p < 0.001; n.s. = not significant; CI 1 = Confidence Interval [2.5–97.5%].
Table 5. Training and testing processes’ RMSE.
ANNsLess ExperiencedMore Experienced
R2 = 0.7041R2 = 0.6952
TrainingTestingTrainingTesting
RMSERMSERMSERMSE
10.06090.05590.08170.0615
20.06990.06500.08750.1001
30.06170.04940.06250.0497
40.06680.05590.09320.1193
50.05760.06770.06230.0577
60.06250.04520.06110.0484
70.06000.07130.05790.0856
80.06140.08810.05920.0614
90.06000.05600.06200.0608
100.06100.05290.06030.0658
Average0.06220.06070.06880.0710
St. dev.0.00360.01260.01330.0232
Table 6. Sensitivity analysis.
ANNLess ExperiencedMore Experienced
EnjoymentSatisfactionTrustUsefulnessUsefulnessTrustSatisfaction
10.20010.29010.32270.18710.33870.43460.2267
20.13860.32200.24590.29350.24110.58150.1774
30.18760.27350.31280.22610.23500.51280.0000
40.17300.22630.41880.18190.27240.43200.2956
50.15220.25070.33480.26230.25180.47980.2684
60.13890.24020.28050.34040.28230.51880.1988
70.20730.18600.31850.28810.37780.38310.2391
80.06270.25720.40120.27890.35550.46700.1775
90.10940.20090.44850.24120.28190.49800.2201
100.08940.24290.33520.33250.25390.55030.1958
Average0.14590.24900.34190.26320.28910.48580.1999
Normalized importance42.44%71.66%95.88%75.61%61.27%100.00%47.47%
Table 7. PLS-SEM and ANN comparison.
SampleExamined Driver of AttitudePath
Coefficient
ANN Result—Normalized ImportancePLS-SEM RankingANN RankingConclusion
Less experienced m-shoppersEnjoyment0.09842.44%44Matched
Usefulness0.28975.61%22
Trust0.35695.88%11
Satisfaction0.25171.66%33
More experienced m-shoppersUsefulness0.30161.27%22Matched
Trust0.389100.00%11
Satisfaction0.23847.47%33
Disclaimer/Publisher’s Note: The statements, opinions and data contained in all publications are solely those of the individual author(s) and contributor(s) and not of MDPI and/or the editor(s). MDPI and/or the editor(s) disclaim responsibility for any injury to people or property resulting from any ideas, methods, instructions or products referred to in the content.

