Hurricane Footprints in Global Climate Models


Institute of Environmental Sciences, Faculty of Environmental Sciences, University of Castilla-La Mancha, Toledo, Spain
Entropy 2008, 10(4), 613-620; https://doi.org/10.3390/e10040613
Submission received: 23 September 2008
/
Revised: 9 November 2008
/
Accepted: 10 November 2008
/
Published: 13 November 2008
Abstract
:This paper addresses the identification of hurricanes in low-resolution global climate models (GCM). As hurricanes are not fully resolvable at the coarse resolution of the GCMs (typically 2.5 × 2.5 deg), indirect methods such as analyzing the environmental conditions favoring hurricane formation have to be sought. Nonetheless, the dynamical cores of the models have limitations in simulating hurricane formation, which is a far from fully understood process. Here, it is shown that variations in the specific entropy rather than in dynamical variables can be used as a proxy of the hurricane intensity as estimated by the Accumulated Cyclone Energy (ACE). The main application of this research is to ascertain the changes in the hurricane frequency and intensity in future climates.

1. Introduction
Estimating hurricane intensity/frequency in a global warming scenario is an active research topic. Controversy exists on whether or not increasing temperatures will bring about increased hurricane activity. On one hand, it has been argued that increased Sea Surface Temperatures (SST) would naturally yield an increase in activity, as hurricanes are heat engines feeding from sea-atmosphere exchanges [1]. On the other hand, it has been found that the notion of a trend towards large increases in hurricane activity due to increases in atmospheric greenhouse-gas concentration is not supported by a recent modeling study [2].
The explicit simulation of hurricanes using high-resolution regional climate models (RCMs) is prohibitively expensive in computational terms, whereas global climate models (GCMs) cannot resolve individual hurricanes due to their coarse spatial resolution (about 2.5 × 2.5 deg). At such scale, tropical cyclone dynamics are poorly represented in GCMs [3]. Nonetheless, even at the high spatial resolution of the RCMs (typically, 0.25 × 0.25 deg), the simulation of hurricanes remains a challenge [4], so one cannot expect to obtain a hurricane without seeding the simulation (i.e. relocating the vortex within the initial guess fields and providing bogus initial conditions). Therein, most of the research on hurricane detection in model simulations is focused on changes in environmental conditions in which hurricanes may (or may not) appear, instead of on directly counting the hurricanes popping up in the simulations.
Figure 1.
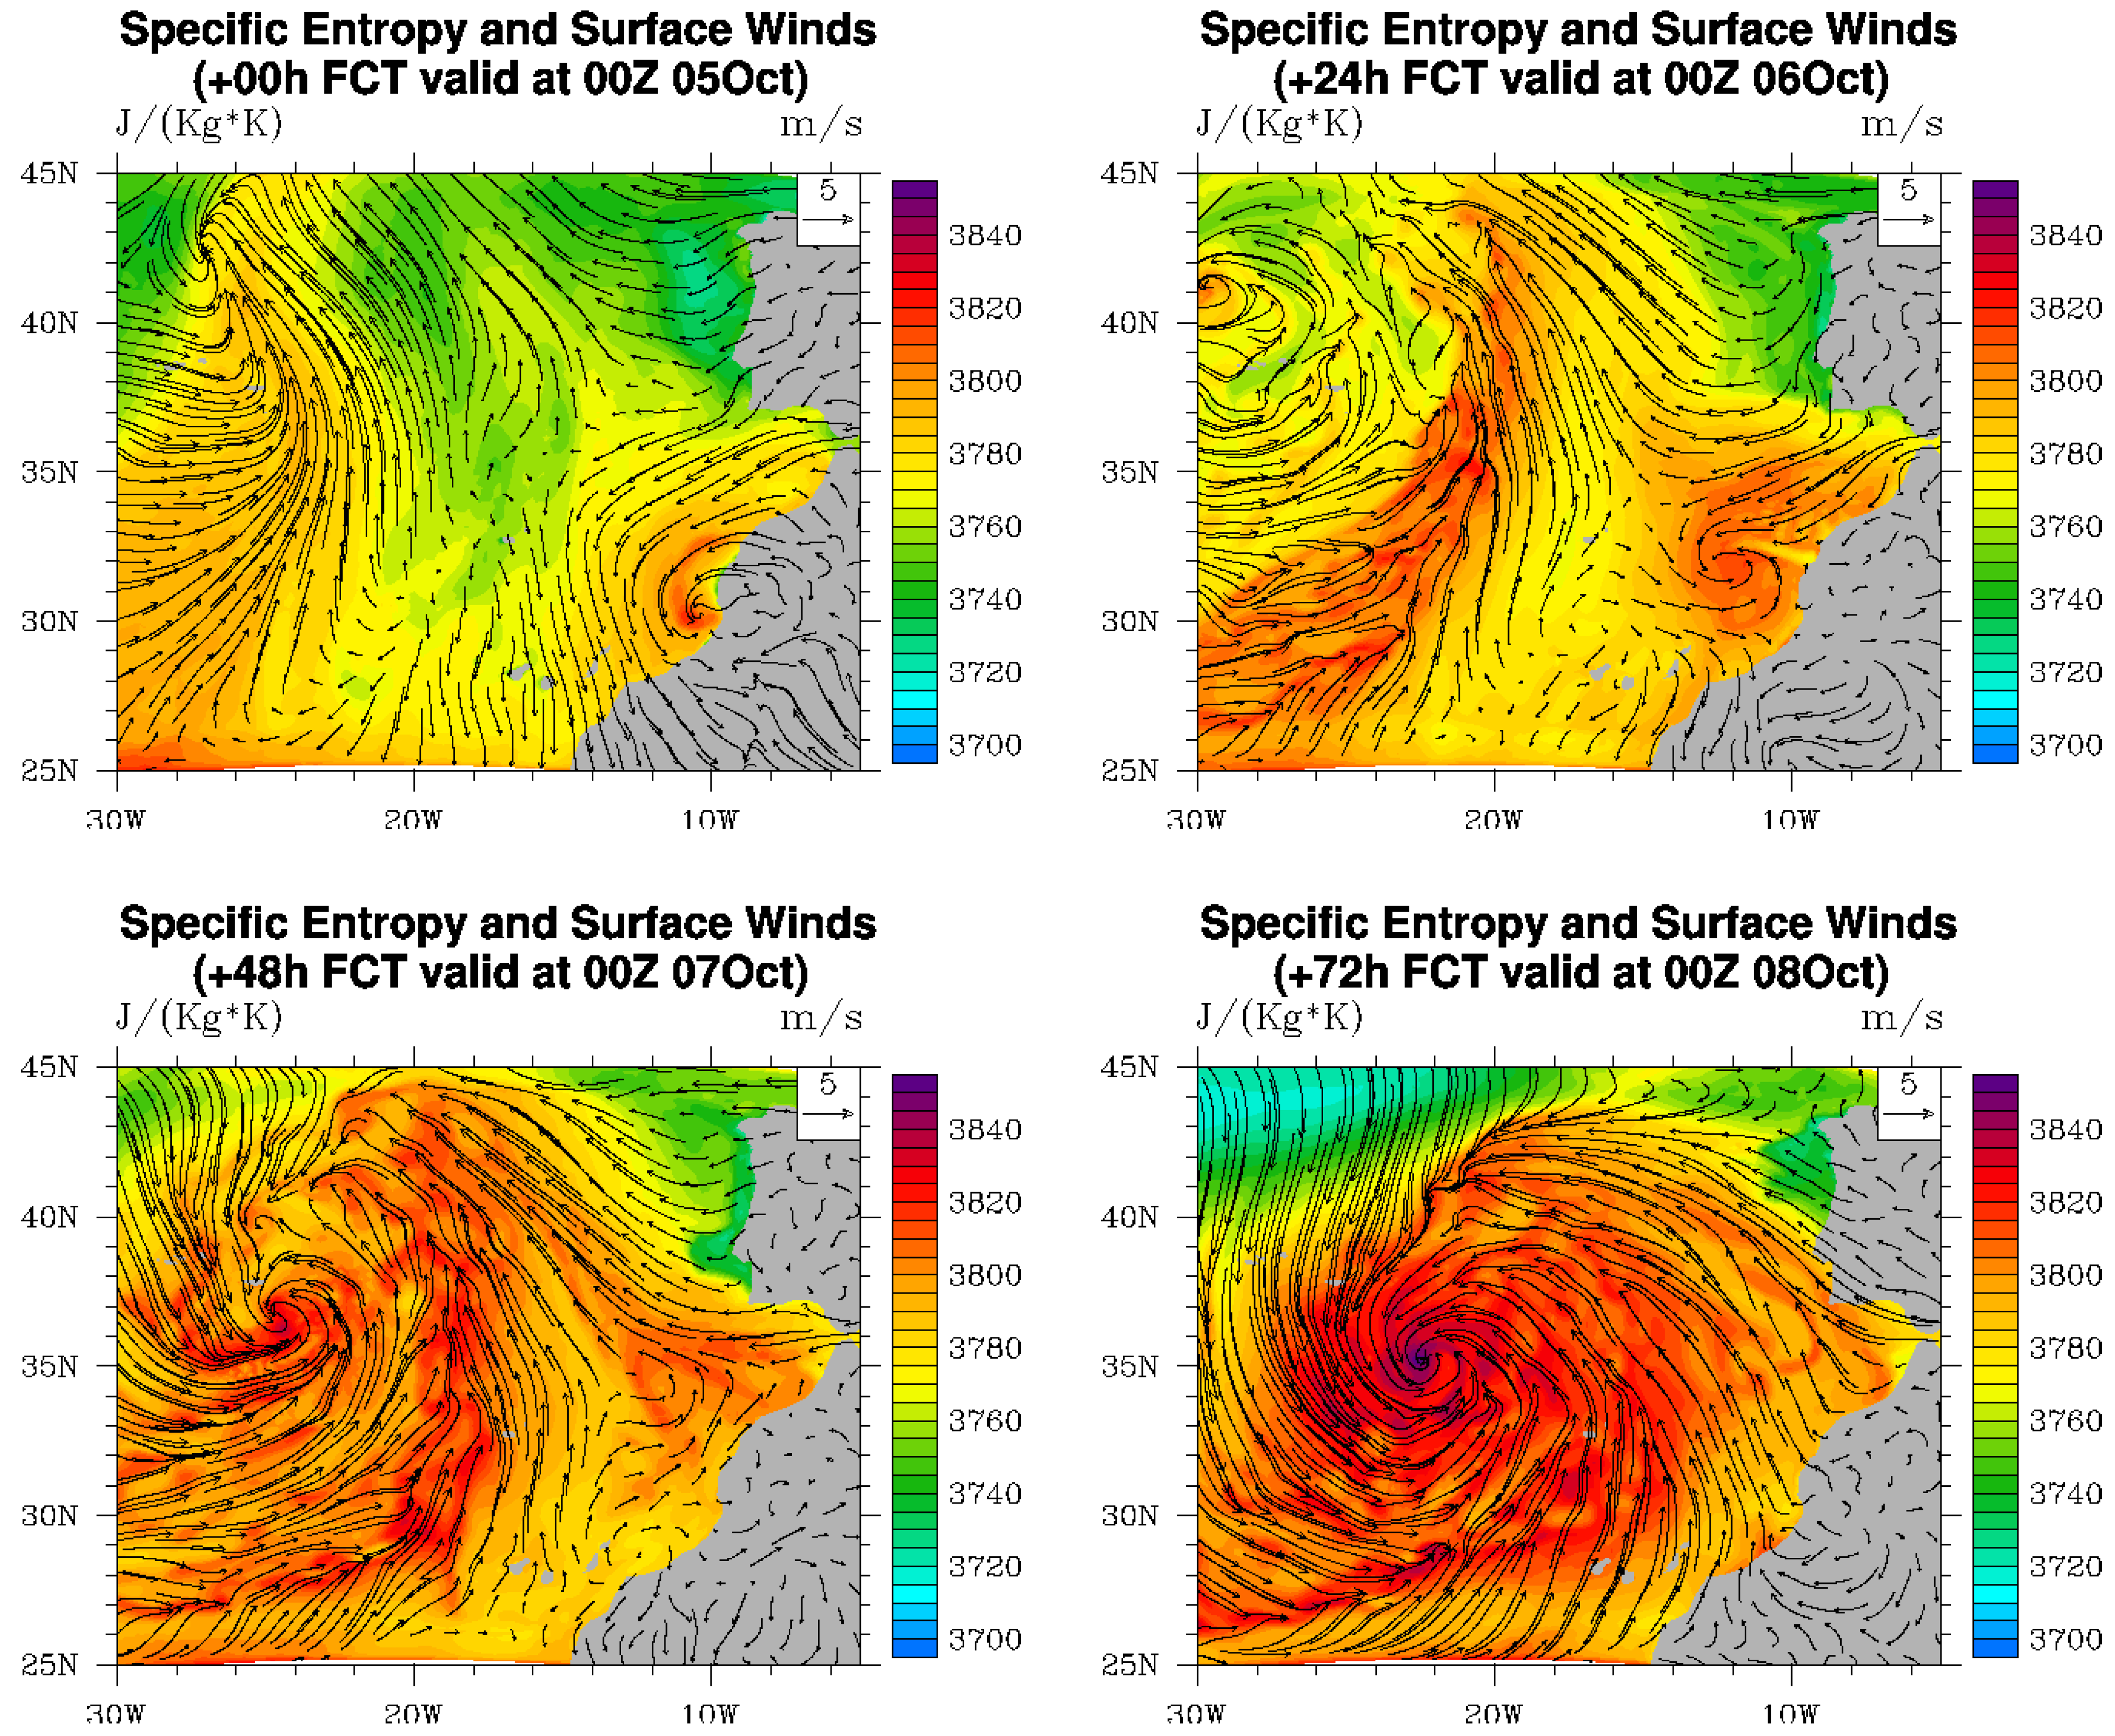
Evolution of the specific entropy field in a regional model forecast of hurricane Vince of 2005. The spatial resolution (grid cell size) of the simulation is 25 km. No seeding was used, and the model (WRF) was nested on GFS analysis.
Figure 1.
Evolution of the specific entropy field in a regional model forecast of hurricane Vince of 2005. The spatial resolution (grid cell size) of the simulation is 25 km. No seeding was used, and the model (WRF) was nested on GFS analysis.

The alternative to direct observation of hurricanes in a GCM is to look for a variable related to hurricane activity. Thus, indirect methods such as the tropical cyclone genesis potential index [4, 5] use dynamical variables (absolute vorticity at 850 hPa and wind shear between 850 and 200 hPa), and thermodynamic variables such as relative humidity at 700 hPa embedded into the potential intensity, a variable that also includes dissipative heating, enthalpy fluxes, drag coefficient, outflow temperature, SST and convective available potential energy (CAPE).
Entropy is another variable that is related with hurricane activity. Hurricanes are atmospheric structures that efficiently dissipate energy through irreversible processes. The entropy in hurricanes growths by enthalpy exchange from the sea surface in form of latent heat of vaporization, and by turbulent dissipation of kinetic energy in the boundary layer [6]. Given the right dynamic conditions for hurricane formation (low vertical wind shear, large Coriolis force and a dynamical trigger for convection such as tropical waves, tropospheric troughs or decaying frontal boundaries), the hurricane is a self-maintaining heat machine that (in theory) dissipates energy as effectively as possible as long as there is a supply of energy in excess. In other words, hurricanes are dissipative structures that take energy in form of entropy from the low atmosphere and dissipate it through radiative cooling in the upper levels.
The advantage of using entropy as a proxy for hurricane intensity is twofold. First, entropy is a state variable and accounts for the fundamental physics of the problem. As long as the second law of the thermodynamics holds in the simulation (and it should, or something is going terribly wrong), the entropy will gauge the energy fluxes of the problem. Another reason to prefer entropy over other more complicated, ad-hoc indexes is that by using entropy one avoids the errors in dynamical cores that are common in numerical simulations and that prevent hurricanes to be directly found.
The hypothesis here is that changes in the specific entropy may be noticeable even at GCM resolutions. Hurricane centers are the places on the Earth’s surface where the specific entropy is at its maximum [7]. Figure 1 shows a simulation of Hurricane Vince from 2005 [8] using a regional model nested on GFS analysis. The simulation was performed without seeding and using analysis (not reanalysis) data, so the hurricane is displaced over the best location estimated by the US National Hurricane Center. The example is brought here just to show how as the hurricane builds up, the specific entropy (the entropy per unit mass) increases to a relative maximum in the hurricane eye. The area covered by the hurricane center is smaller compared to the GCM grid size, so the hurricane signal may in principle be buried in the background environment. Nonetheless, it can be argued that a fast-moving, powerful hurricane would generate discernible transient entropy changes in the grid cell in a time scale of hours. To test this hypothesis, reanalysis data from the ECMWF model is used, as described in the next section.
2. Experimental Section
The empirical basis of this study corresponds to ERA-40 reanalysis data derived from the ECMWF model [9]. This dataset represents the best available state of the global atmosphere every 6-hours at 2.5x2.5 degrees resolution, from 1958 to 2001. As other experiments on hurricane detection using reanalysis data [3] this setup assumes observations as perfect as possible. The concept of reanalysis is fully explained in [9]. The American Meteorological Society definition asserts that a reanalysis yields complete, global gridded data that are as temporally homogeneous as possible. Reanalysis data include many derived fields (heating, soil moisture over land, etc.) for which direct observations are nearly absent.
ERA-40 data were used to calculate the specific entropy in the North Atlantic basin. Specific entropy was calculated as in [7]:
where T is the temperature, P the pressure, q the water vapor concentration, H the relative humidity, Cp=1004 J Kg-1 K-1 (heat capacity at constant pressure), Rd=287.04 Kg-1 K-1 (gas constant for dry air), Lv=2.6·;106 J Kg-1 (latent heat of vaporization), and Rv=461.495 J Kg-1 K-1 (gas constant for water vapor). An alternative formulae to (1) to calculate the moist entropy is [10 (eq. 4.5.9)], [11]:
in which cpd (cl) is the specific heat of dry air (liquid water), q (qt) is the mixing ratio of water vapour (total water content), Rd (Rv) is the gas constant for dry-air (water-vapour), pd is the partial pressure of dry air, Lv is the latent heat of vaporization, and H is the relative humidity. Expression (2) provides a more precise definition of moist entropy, and its use will be investigated in another paper.
In the present research, 43-years worth of ERA-40 fields of T, P, q and H were used, resulting in a specific entropy field every 6 hours from 1/Jan/1958 to 31/Dec/2001.Then, the 6-hour changes in the specific entropy (Δs hereafter) were calculated. Hurricane occurrence was taken from the US National Hurricane Center database. Hurricane intensity was estimated using a standard measure, the Accumulated Cyclone Energy (ACE). The ACE of a season is calculated by adding the squares of the estimated maximum sustained velocity of every active tropical storm (wind speed 35 knots or higher), at six-hour intervals. Thus,
where vmax is estimated sustained wind speed in knots, and k a dummy constant to make figures more manageable. k is usually taken as 10-4. If any storms of a season happen to cross years, the storm's ACE counts for the previous year. Actual ACE data values for this study were taken from NOAA and then aggregated to annual values matching the specific entropy field dataset. Both Δs and ACE were normalized to ease comparison. Thus, the deviation of the value from the mean over the period was calculated and then divided by the standard deviation.
Figure 2.
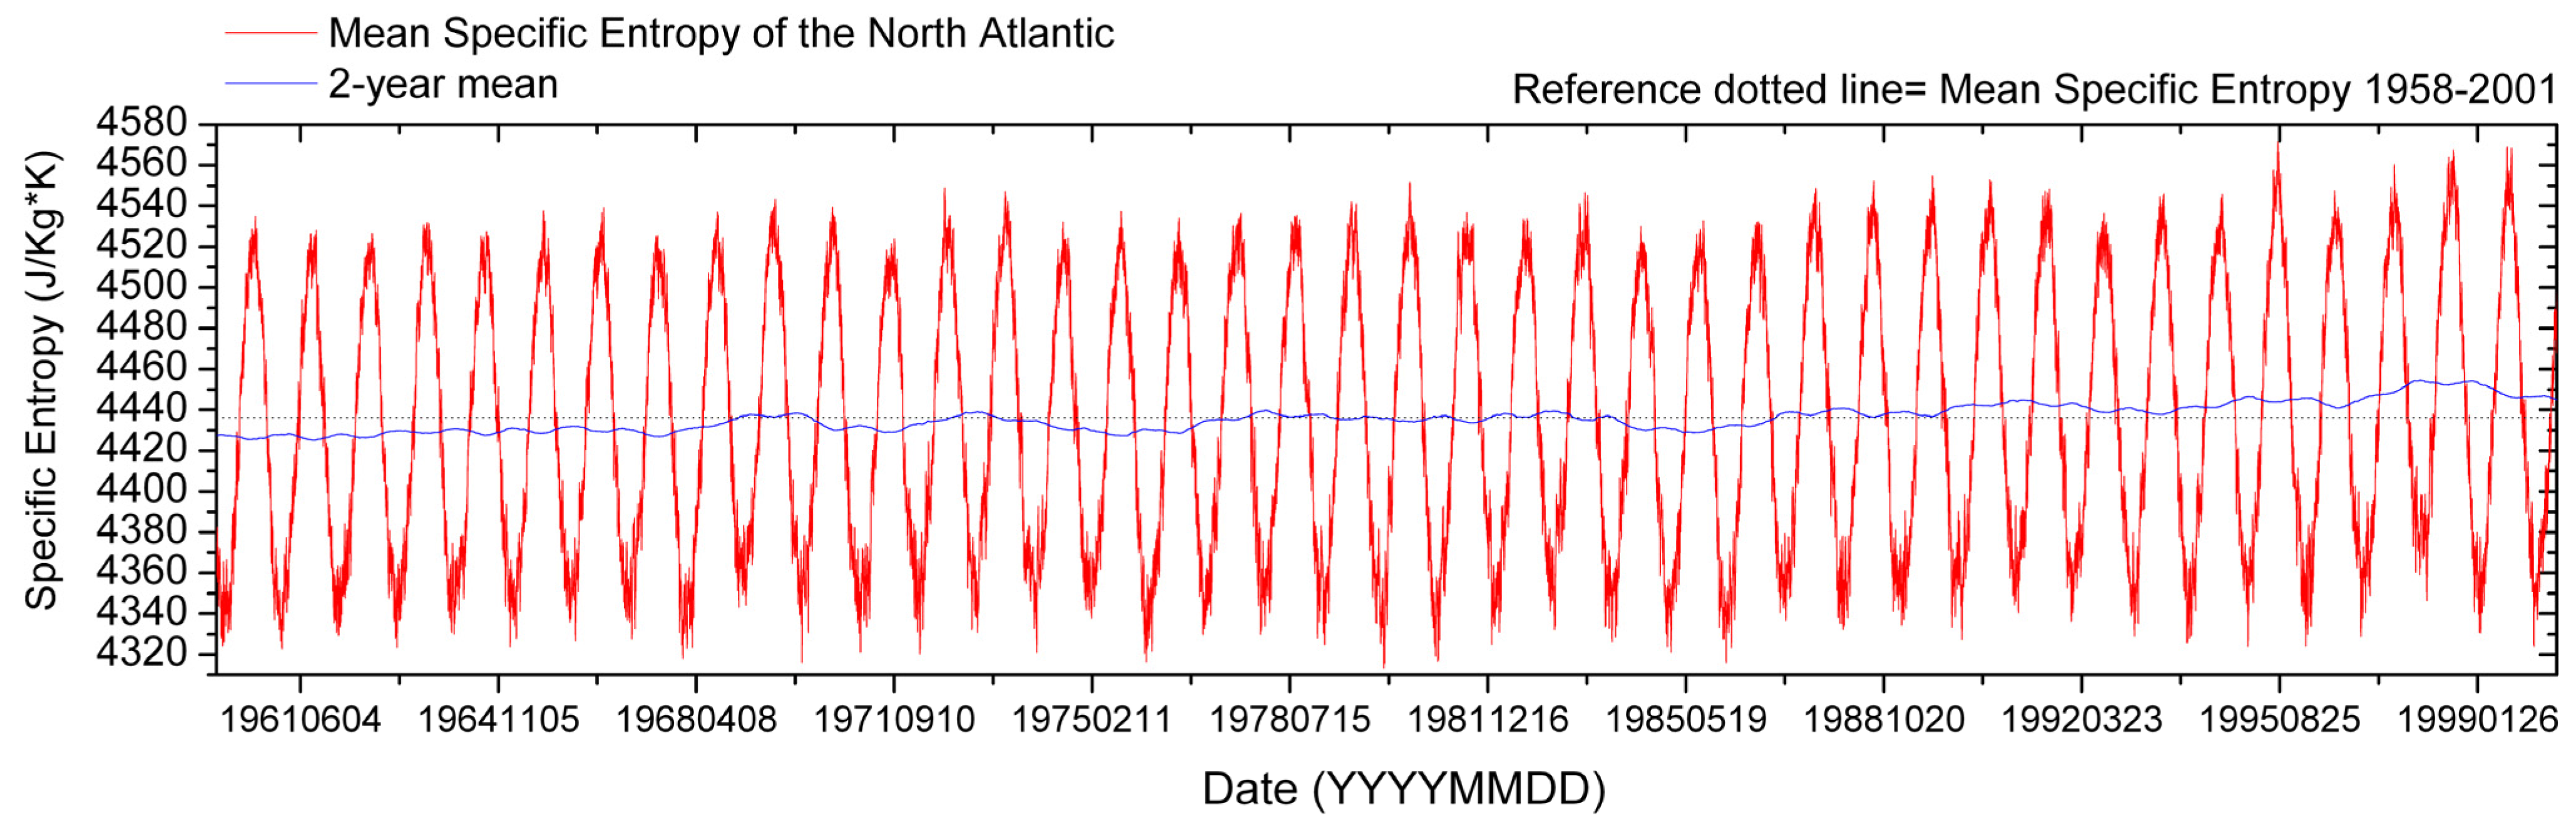
Evolution of the specific entropy in the North Atlantic basin.

3. Results and Discussion
Figure 2 shows the evolution of the mean specific entropy of the North Atlantic basin. The annual cycle is apparent, as it is the interannual variability. The 2-year mean shows a slow net increase in the specific entropy, which is consistent with the reported trends in hurricane activity. Nonetheless, the trend was found to be non statistically-significant, so it is not discussed here. The maximum in 1995, however, corresponds to the observed maximum in hurricane activity (ACE of 228; ACE above 103 indicates an above-normal season).
Large values of specific entropy, however, cannot be exclusively associated to hurricane activity, as it they be due to either hurricane activity or to an overall increase in the entropy in the model grid cell due to, for instance, advection of warm water. In contrast, sudden changes in the specific entropy are likely to be due to rapid-development processes such as strong storms, as the other slowly-varying factors that may increase the specific entropy would generate a smoother change, if any. If advection occurs on a timescale much longer than radiative transfer, the air would be in thermal equilibrium and the heat absorbed and rejected is reversible [12]. If the changes occur in a timescale comparable to or shorter than radiative transfer, then we will have an irreversible process and entropy will appear.
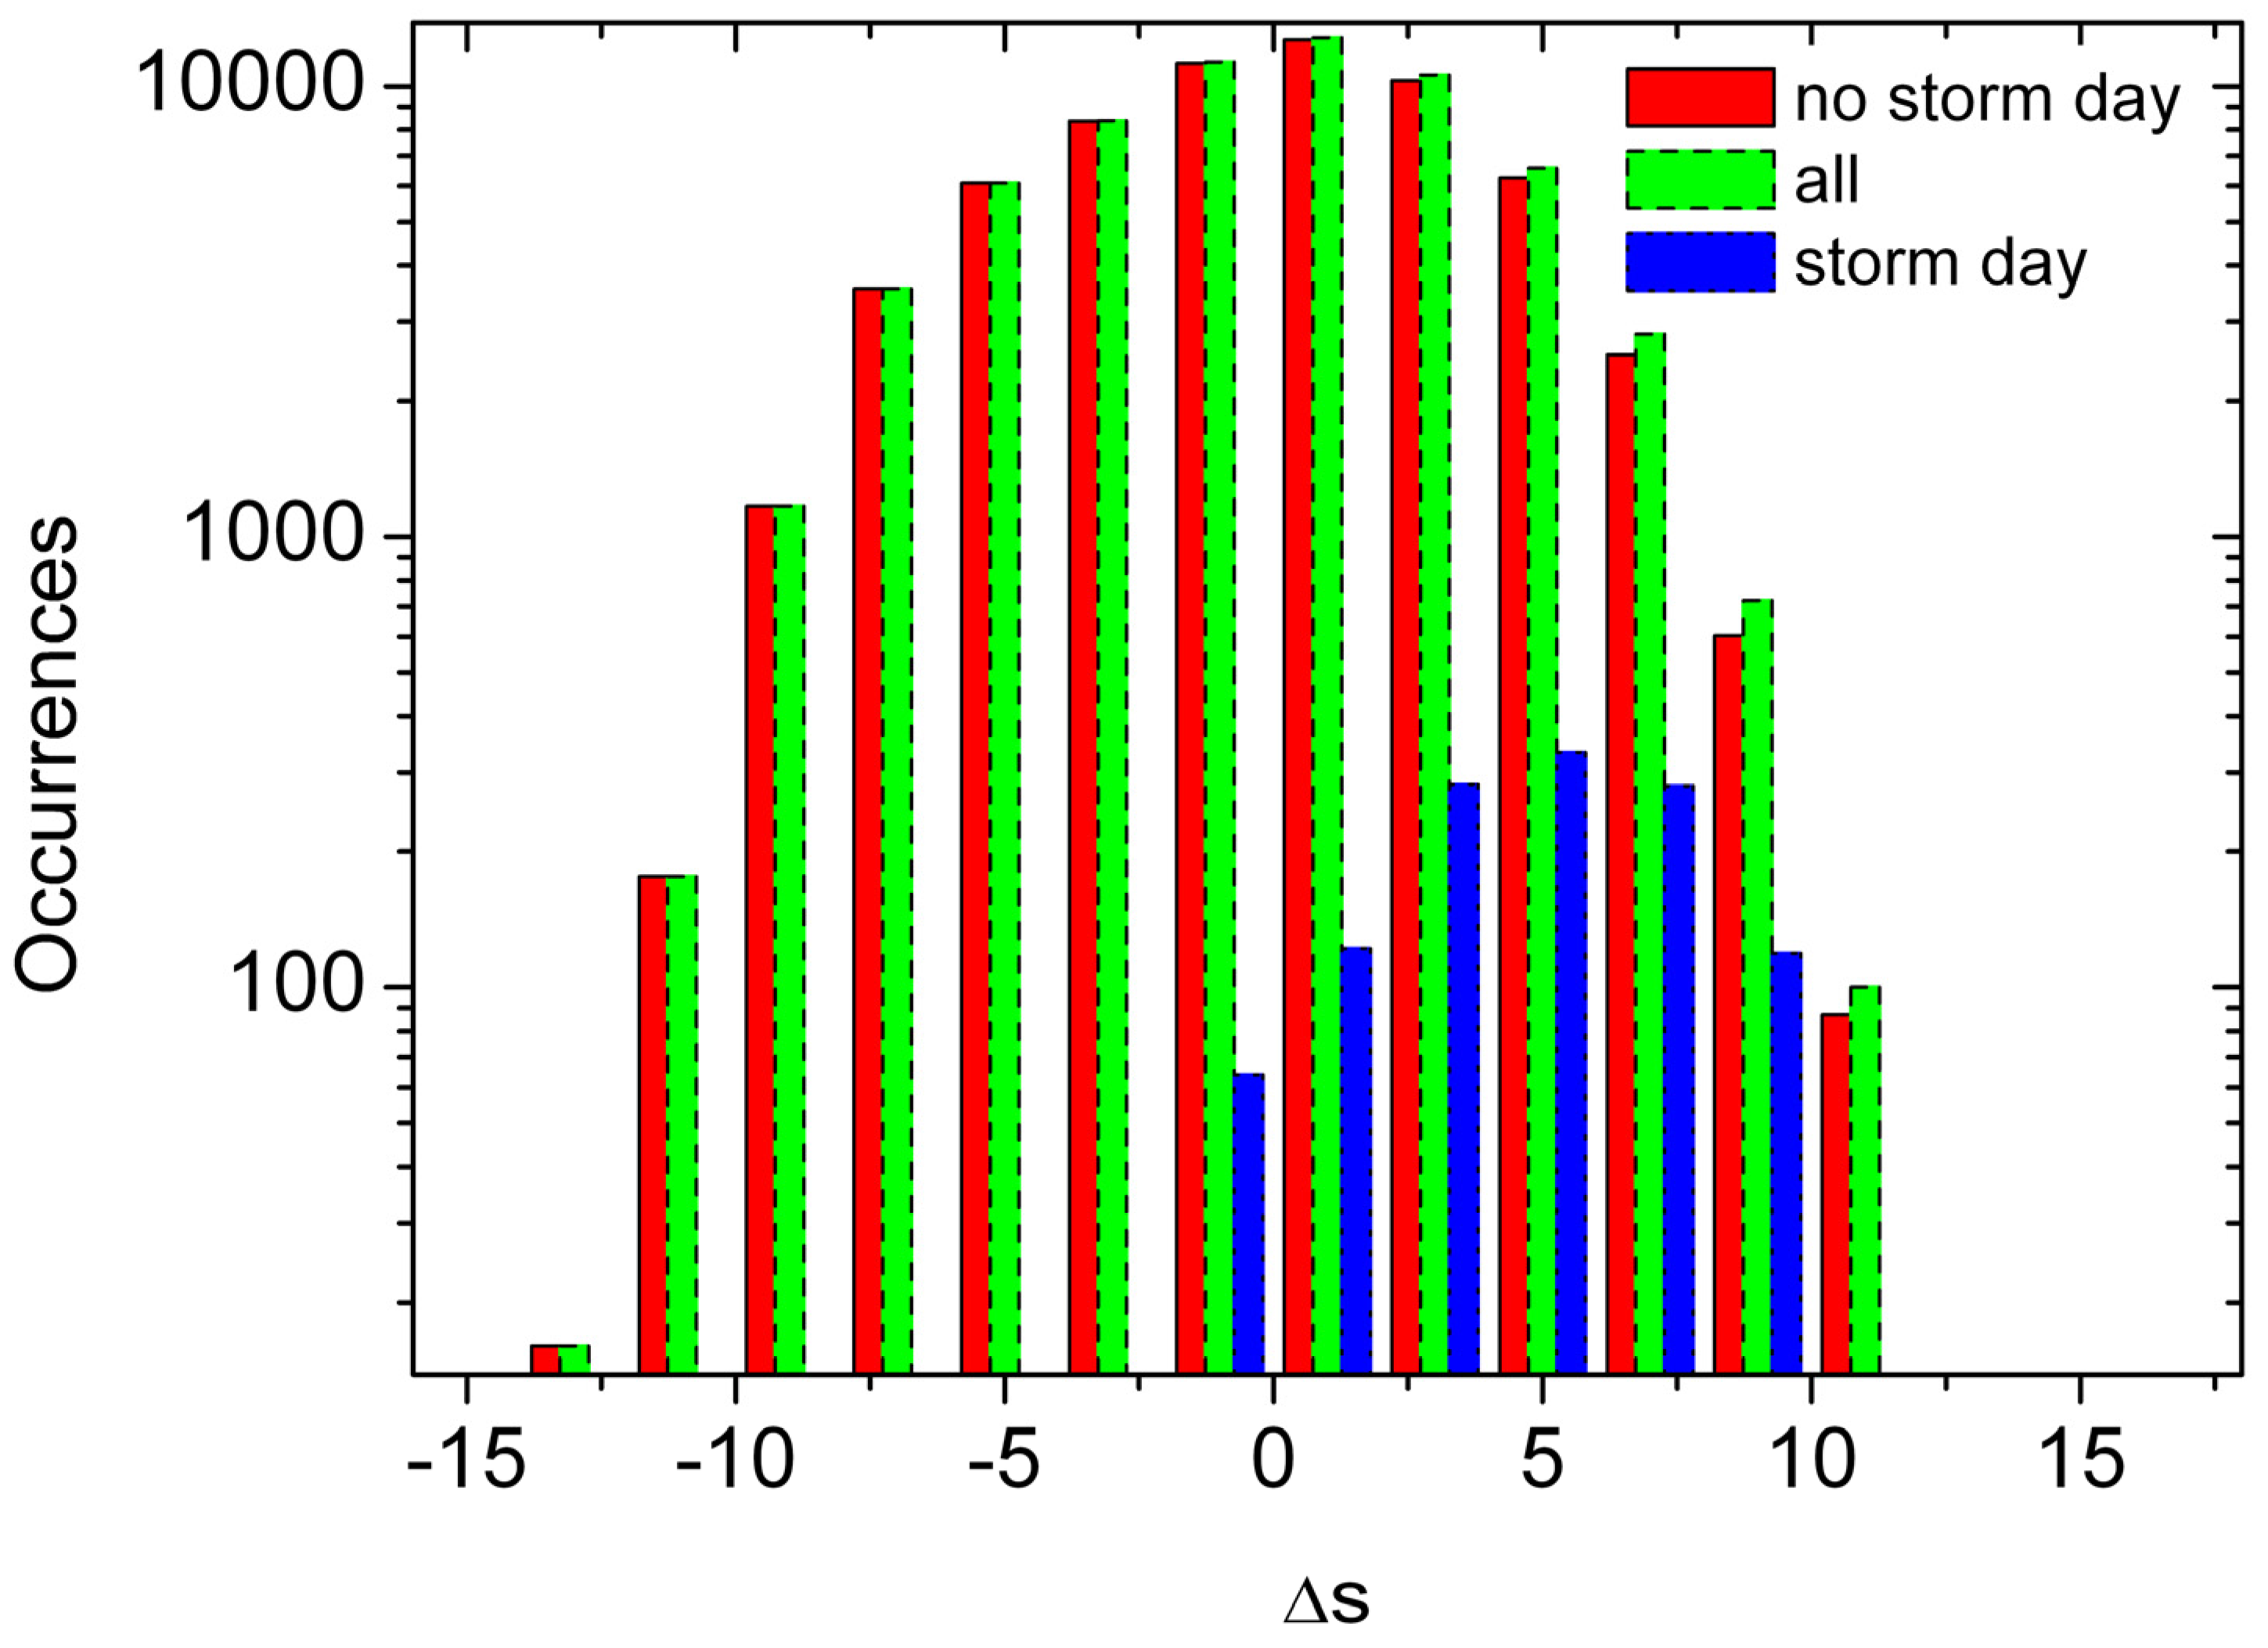
To test whether or not there is a difference in the Δs field when a hurricane is present in the simulation, the histograms of Δs were calculated for the whole ERA-40 dataset. Then, the histograms were segmented into those days when a tropical storm or a hurricane was observed and those when none was found. Figure 3 shows the result. Notably, days with tropical storms and hurricanes (storm days in the figure) are characterized by a positive Δs distribution centered in 5.5 J Kg-1 K-1. To ascertain if this characterization is useful to discern hurricanes at GCM resolution, annual aggregations of both ACE and the number of days with a Δs>5.5 J Kg-1 K-1 were calculated. This aggregation is the standard procedure to tackle the uncertainties in calculating the ACE over a large period of time. Previous to the satellite era, aggregated estimates of hurricane intensity relied on sparse observations and that introduces a bias in the series.
Figure 3.
Histogram of 6-hour changes in the specific entropy (Δs), comparing all dates (green, dashed border), those dates when tropical storm conditions where found (blue), and those without tropical storm (red).
Figure 3.
Histogram of 6-hour changes in the specific entropy (Δs), comparing all dates (green, dashed border), those dates when tropical storm conditions where found (blue), and those without tropical storm (red).

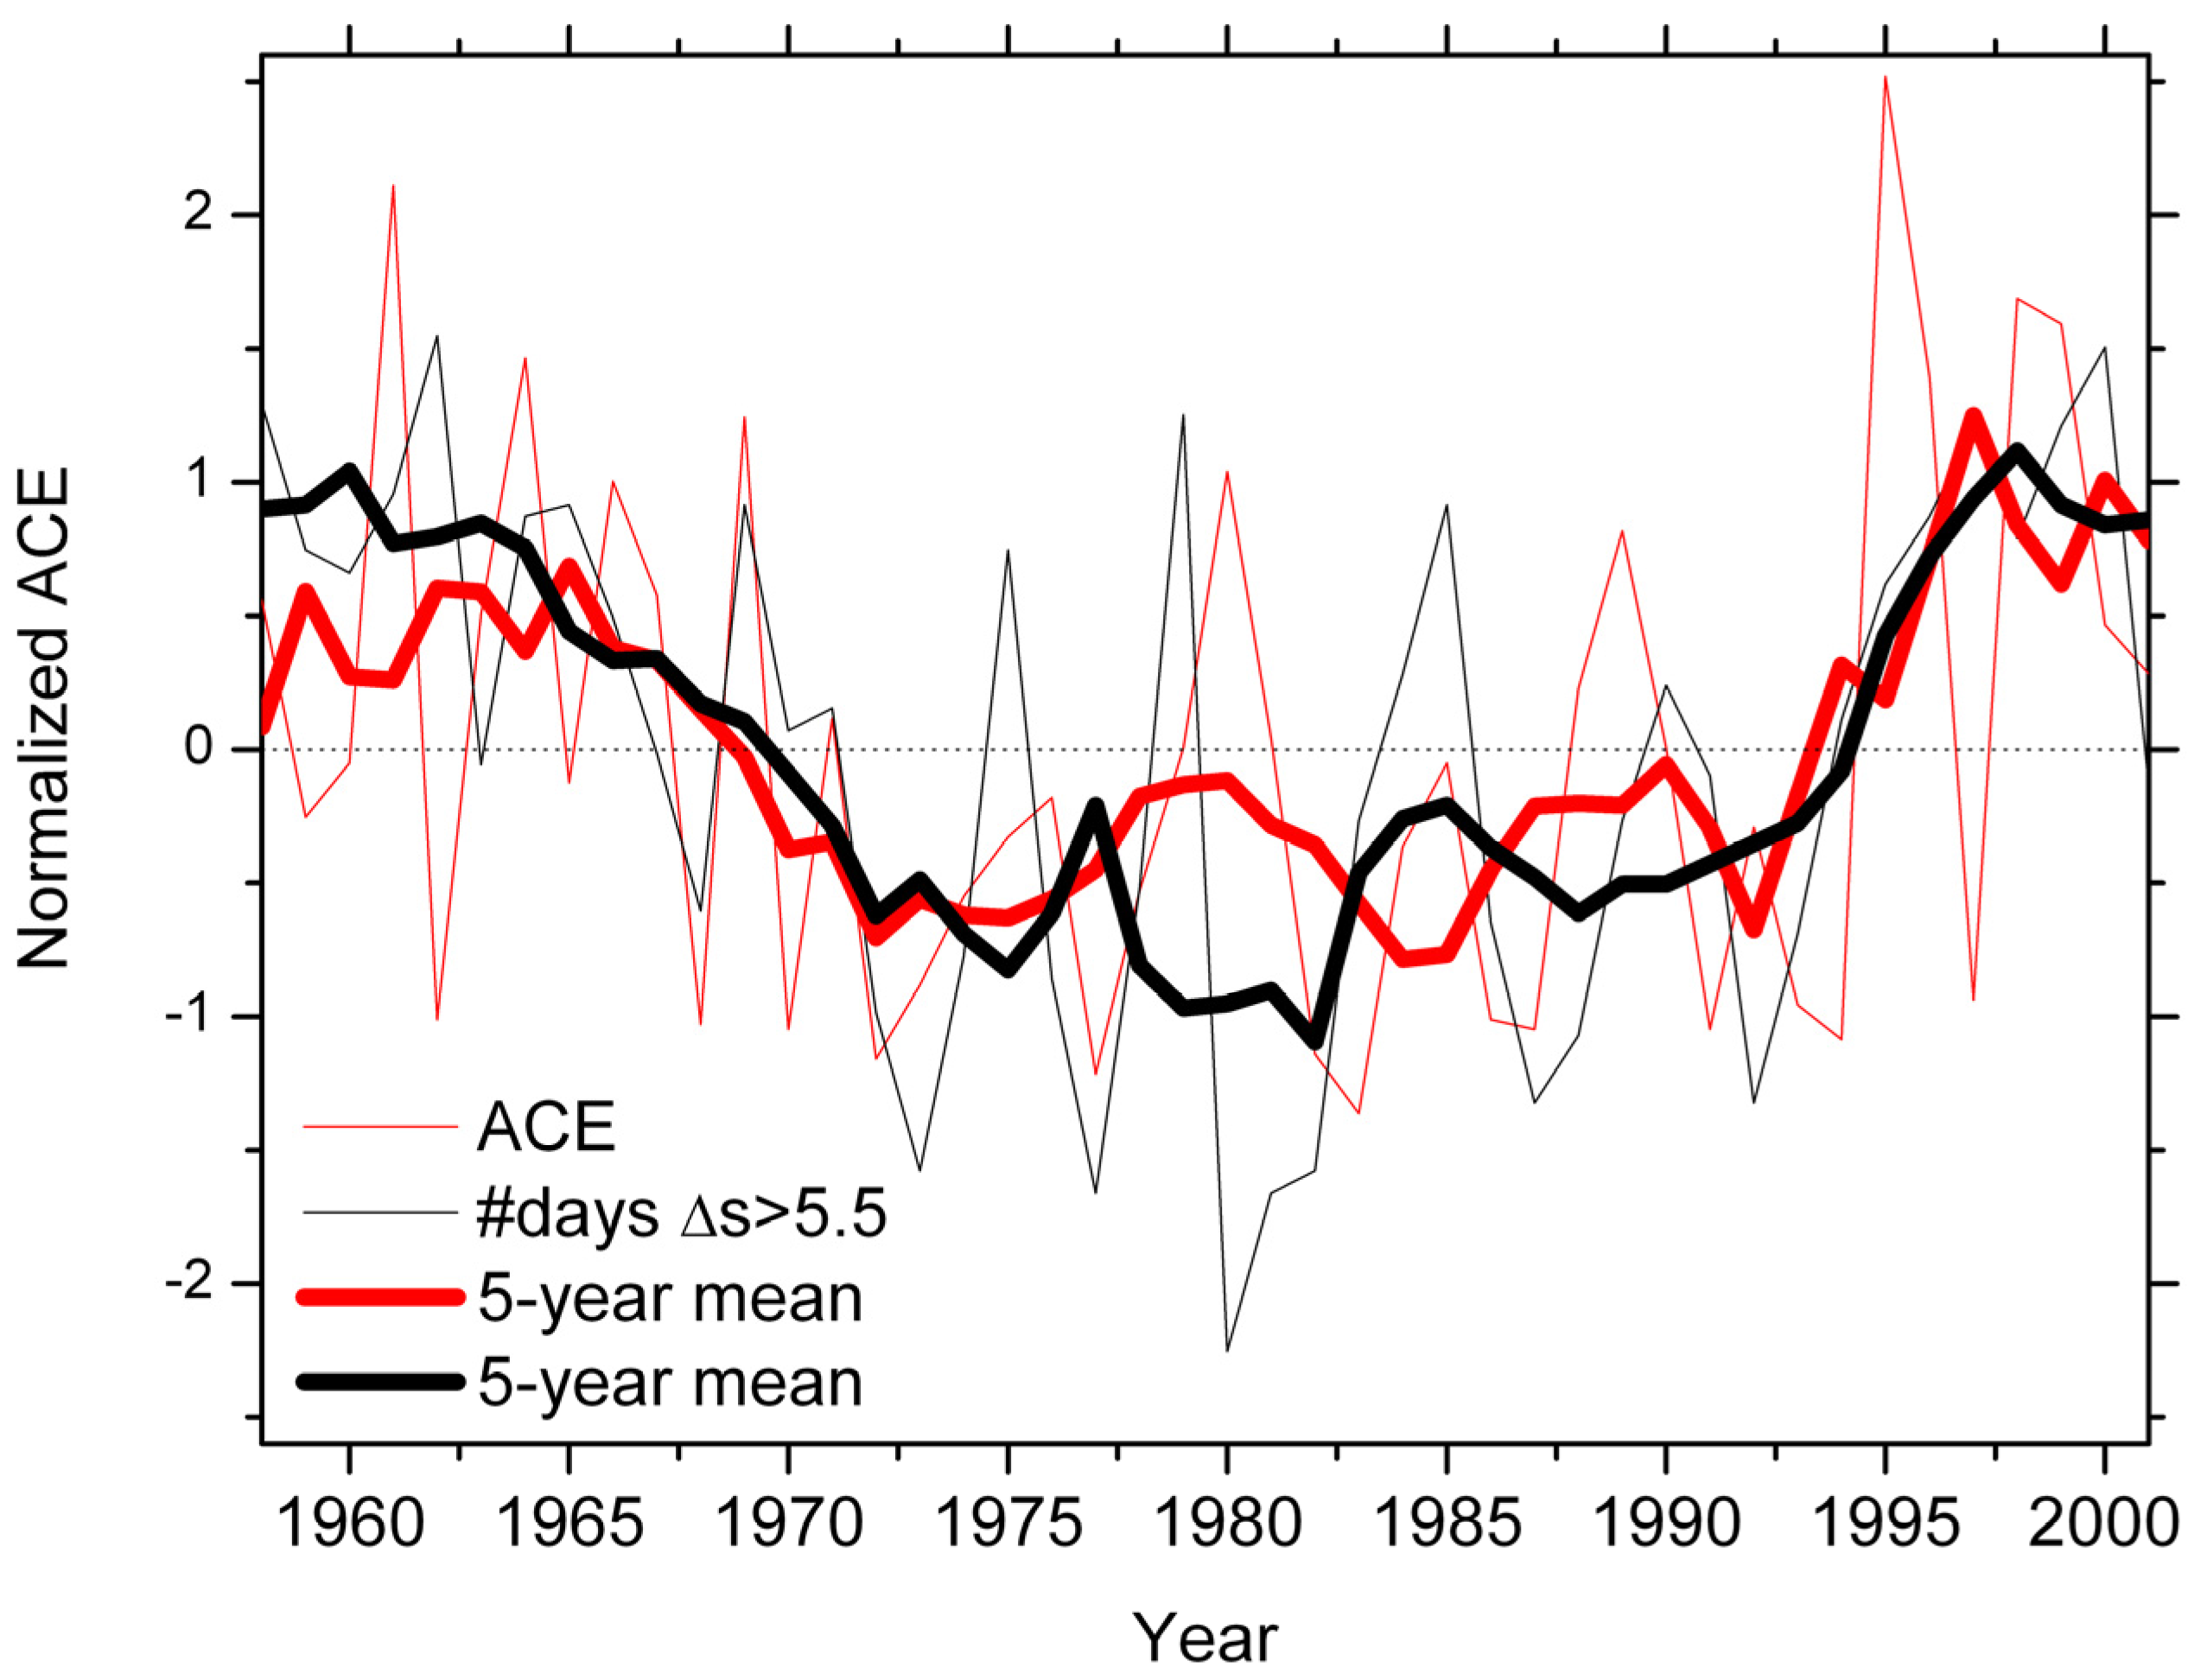
Figure 4.
Annual aggregations of NOAA’s Accumulated Cyclone Energy (ACE) and the accumulated number of days with a change in the specific entropy greater than 5.5 J Kg-1 K-1.
Figure 4.
Annual aggregations of NOAA’s Accumulated Cyclone Energy (ACE) and the accumulated number of days with a change in the specific entropy greater than 5.5 J Kg-1 K-1.

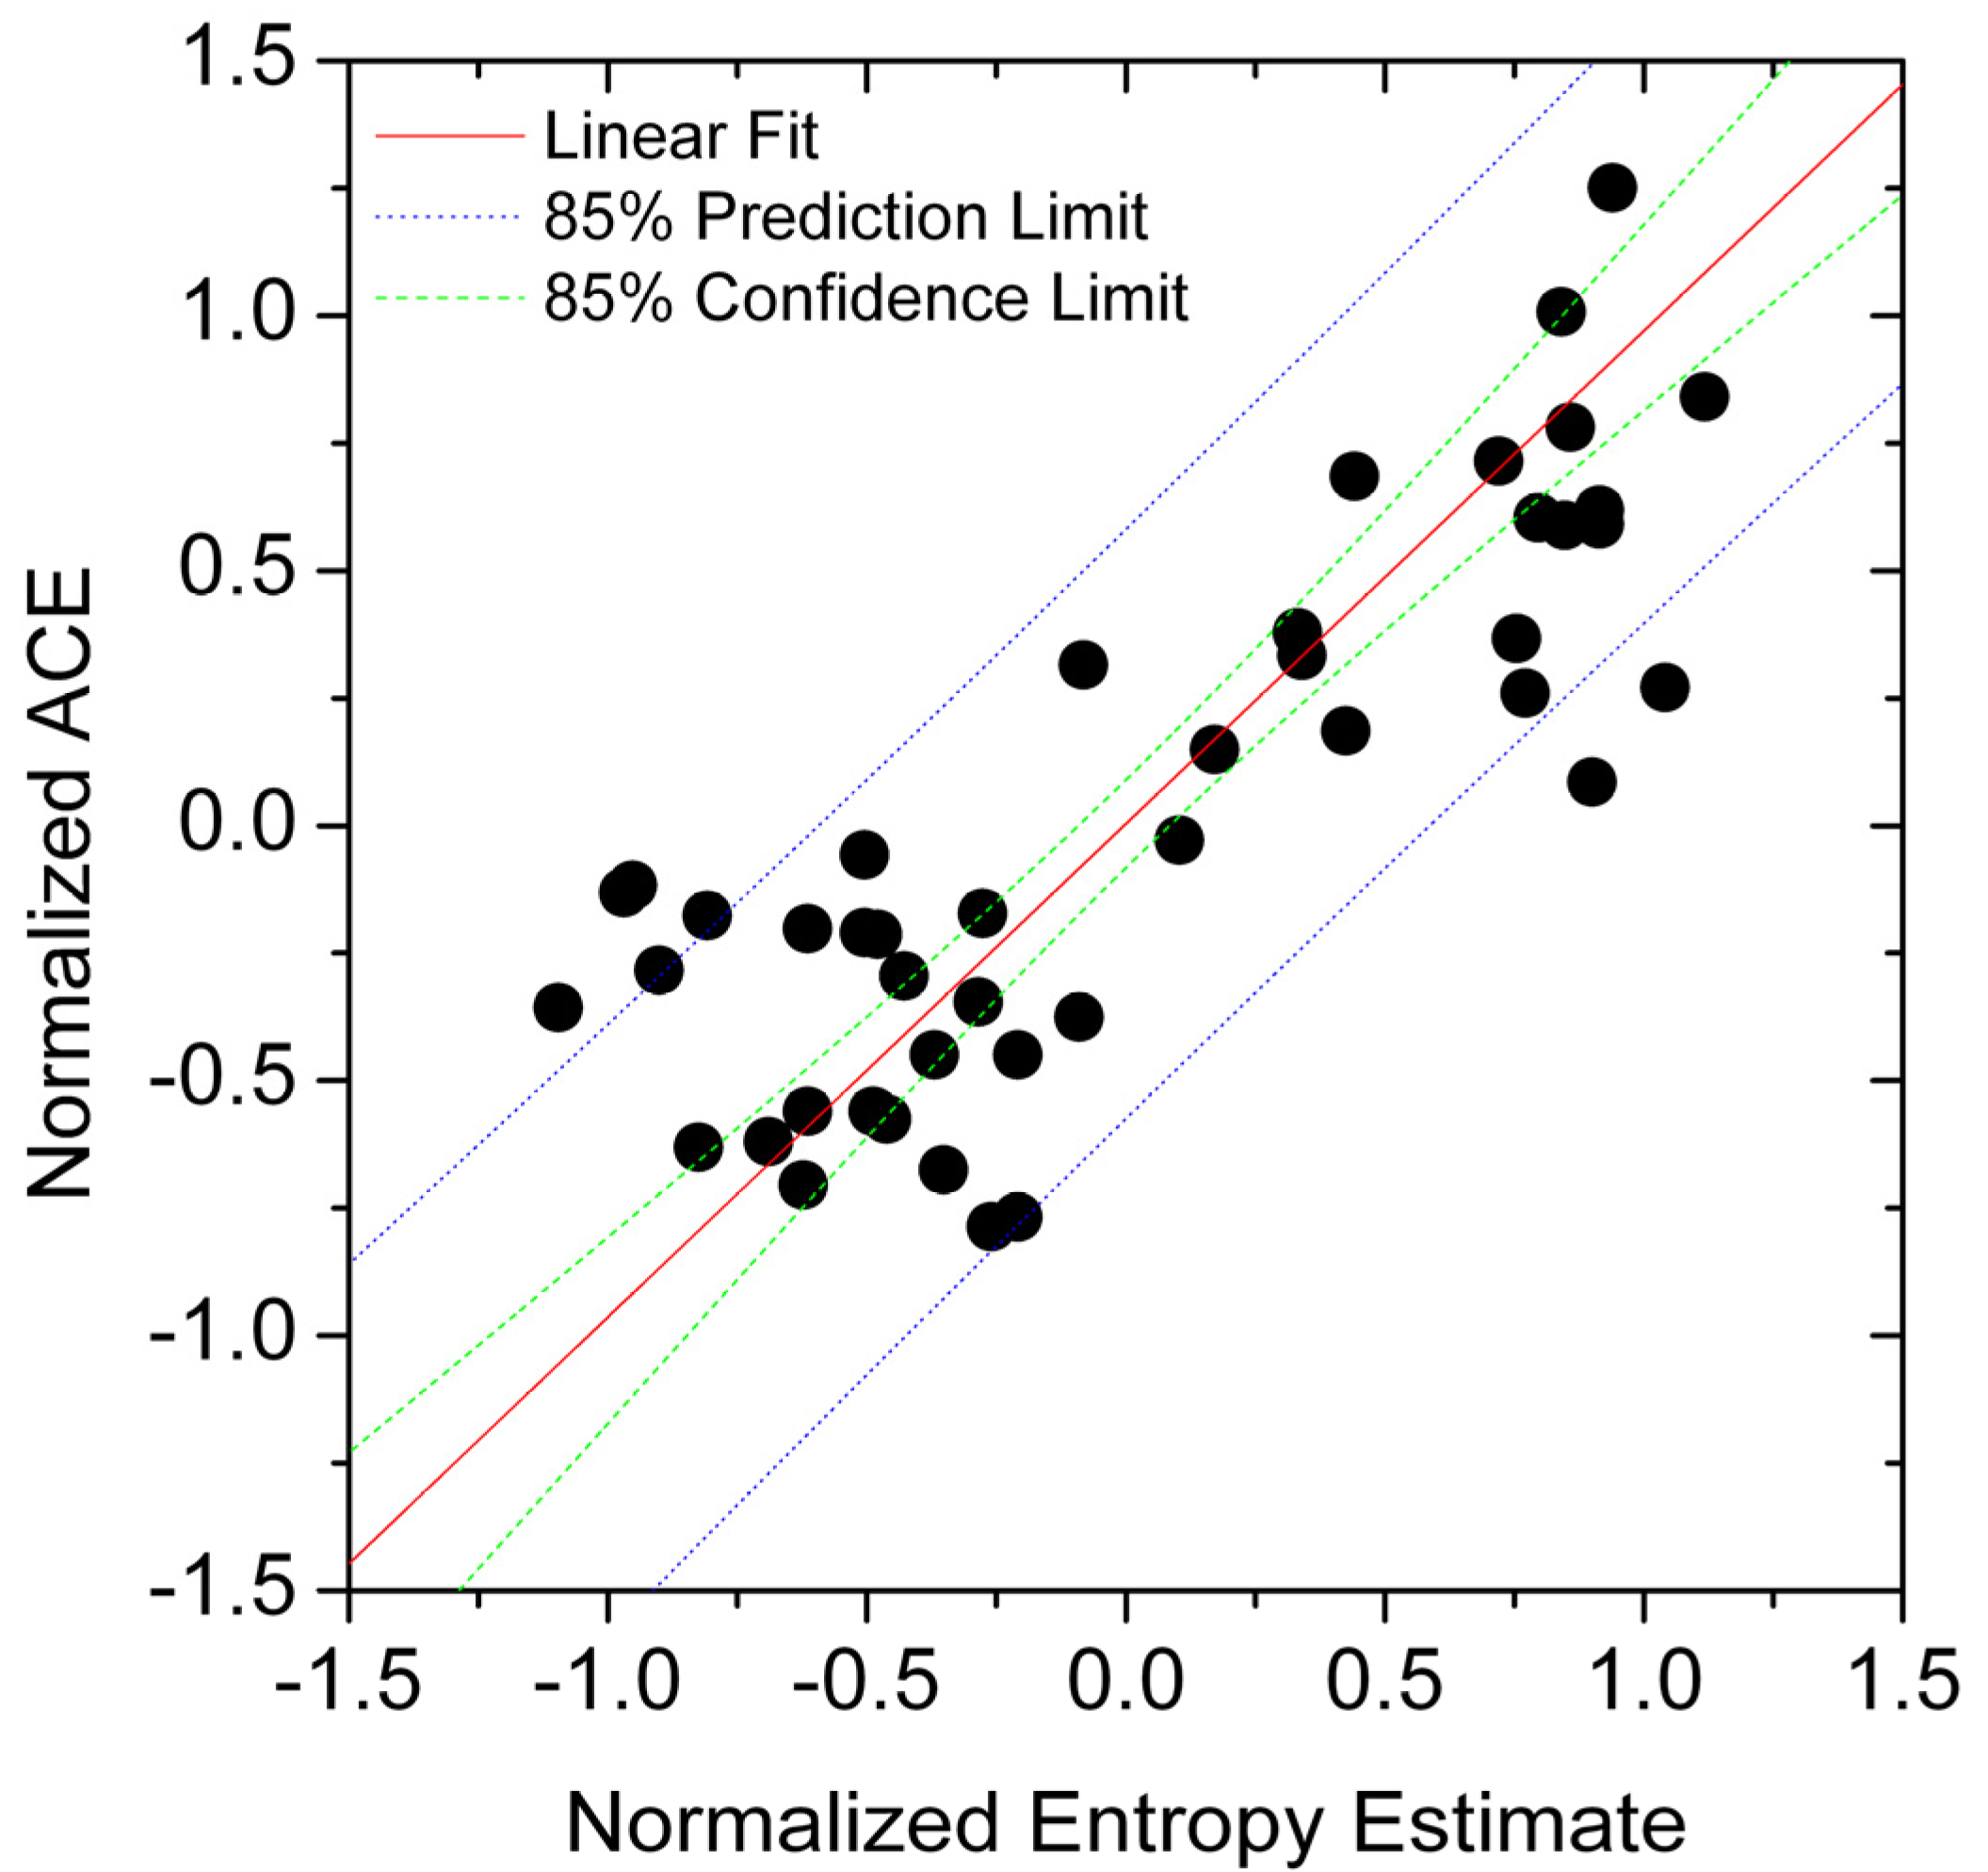
Figure 5.
Comparison of the entropy estimate and the ACE, depicting the 85% confidence and prediction limits.
Figure 5.
Comparison of the entropy estimate and the ACE, depicting the 85% confidence and prediction limits.

The results of comparing the ACE index with the changes in the specific entropy are shown in Figure 4. This figure illustrates that the specific entropy is a suitable proxy of hurricane intensity compared with the ACE index. The five-year mean shows a similar evolution and a joint phasing in both estimates of hurricane intensity.
A more direct comparison is shown in Figure 5, including the 85% confidence and prediction limits of the linear fit. The linear relationship between both variables is:
where y is the normalized ACE and x the normalized entropy estimate. The t-values for the (A, B) parameters in y=A+Bx are (-.05838, 9.04435), with a Prob>|t|=(0.95373, <0.0001). The R correlation is 0.81286, with a root mean squared error of 0.39779. This correlation was found statistically-significant at the 0.01 level.
y = (–0.0035±0.05997)+(1.0342±0.11436)x
In terms of the climatology, which represent the mean values over a 30 year period, the results are close enough to support the idea that the hypothesis is correct, and that hurricanes may have a strong enough entropy footprint to be recognized on climate simulations.
4. Conclusion and final remarks
This paper has shown that specific entropy may be used to estimate hurricane activity at the spatial resolution of GCMs. It has been shown that the changes of the specific entropy in reanalysis data (ERA-40) can be used as a proxy of hurricane activity. This makes entropy a suitable proxy of hurricane intensity in the GCMs used to estimate future climate conditions under prescribed socioeconomic scenarios. Further examination of this relationship would require a detailed modeling study with a focus on entropy changes, and a study of the vertical structure of the entropy. The hypothesis that hurricane intensity can be estimated with changes in the entropy at GCM resolution requires further scrutiny. The uncertainties in the observations of hurricane intensity are large, and as with other indexes used to estimate hurricane strength, longer series of observations would be required for the comparison to be statistically significant. Future research will be in direction of performing similar analyses for the East and West Pacific ocean basins where ACE is also calculated.
As one of the seven referees of this paper suggested, this research can be related with the current debate over climate change and hurricane intensity already mentioned in the introduction. The reduction in Atlantic hurricane frequency found in recent simulations [2] is consistent with an overall global warming in terms of entropy analysis. As in a theoretical Carnot machine, the ability to do work in the atmosphere is related with energy gradients and not with the actual value of the available energy. If there is a connection between entropy and increased hurricane intensity, it follows that gradients rather that net increases of energy drive hurricane intensity, so the warmer climate that appears in the simulations does not necessarily translate into more frequent/stronger hurricanes.
The role of hurricanes in the climate system seems to be to erase gradients by dissipating power, so a model simulation in which increased SST activity appears does not necessarily represent a climate with more hurricanes. It has to be remembered that dynamical factors also play a role. Weak wind shear in a warmer climate may help to achieve the column stability required for a hurricane to develop, but the disturbances that act as hurricane precursors may also be weak in such environment.
Notwithstanding the fact that the models contain parameterizations that are tuned to observations, that models cannot provide the empirical evidence over which science is built, and that there are both knows unknowns (cloud feedbacks, to name one) and unknown unknowns (the biota is still poorly coupled with atmospheric/ocean models), models are useful tools to increase our knowledge on the atmospheric physics. While models projections of future climates have to be taken with a pinch of salt, the outputs for present climate simulations can be compared with observations to check whether or not the simplifications in the physics of the problem are consistent with measurements, thus improving our understanding of the climate system.
Acknowledgements
This research has been funded through projects CGL2006-03611 (MEC), PAI06-0101 (JCCM) and the Ramon y Cajal program. Computing time at the Barcelona Supercomputing Center is also acknowledged (activities AECT-2008-2-0001, AECT-2008-1-0003 and AECT-2008-3-0001). ECMWF is thanked for making ERA-40 data freely available.
References and Notes
- Emanuel, K.A. The dependence of hurricane intensity on climate. Nature 1987, 483–485. [Google Scholar] [CrossRef]
- Knutson, T.R.; Sirutis, J.J.; Garner, S.T.; Vecchi, G.A.; Held, I.M. Simulated reduction in Atlantic hurricane frequency under twenty-first-century warming conditions. Nat. Geosci. 2008, 1, 359–364. [Google Scholar] [CrossRef]
- Camargo, S.; Sobel, A.H.; Barnston, A.G.; Emanuel, K.A. Tropical cyclone genesis potential index in climate models. Tellus 2007, 59, 428–443. [Google Scholar] [CrossRef]
- Oouchi, K.; Yoshimura, J.; Yoshimura, H.; Mizuta, R.; Kusonoki, S.; et al. Tropical cyclone climatology in a global-warming climate as simulated in a 20 km-mesh global atmospheric model: Frequency and wind intensity analyses. J. Meteor. Soc. Japan 2006, 84, 259–276. [Google Scholar] [CrossRef]
- Emanuel, K.A.; Nolan, D.S. Tropical cyclone activity and global climate. In Proc. of 26th Conference on Hurricanes and Tropical Meteorology; American Meteorological Society: Miami, FL, 2004; pp. 240–241. [Google Scholar]
- Bister, M.; Emanuel, K.A. Dissipative heating and hurricane intensity. Meteor. Atm. Phys. 1998, 52, 233–240. [Google Scholar] [CrossRef]
- Emanuel, K.A. Tropical Cyclones. Annu. Rev. Earth Planet. Sci. 2003, 31, 75–104. [Google Scholar] [CrossRef]
- Tapiador, F.J.; Gaertner, M.A.; Romera, R.; Castro, M. A Multisource analysis of hurricane Vince. Bull. Am. Meteorol. Soc. 2007, 88. [Google Scholar] [CrossRef]
- Uppala, S.M.; Kållberg, P.W.; Simmons, A.J.; Andrae, U.; da Costa Bechtold, V.; Fiorino, M.; Gibson, J.K.; Haseler, J.; Hernandez, A.; Kelly, G.A.; Li, X.; Onogi, K.; Saarinen, S.; Sokka, N.; Allan, R.P.; Andersson, E.; Arpe, K.; Balmaseda, M.A.; Beljaars, A.C.M.; van de Berg, L.; Bidlot, J.; Bormann, N.; Caires, S.; Chevallier, F.; Dethof, A.; Dragosavac, M.; Fisher, M.; Fuentes, M.; Hagemann, S.; Hólm, E.; Hoskins, B.J.; Isaksen, L.; Janssen, P.A.E.M.; Jenne, R.; McNally, A.P.; Mahfouf, J.-F.; Morcrette, J.-J.; Rayner, N.A.; Saunders, R.W.; Simon, P.; Sterl, A.; Trenberth, K.E.; Untch, A.; Vasiljevic, D.; Viterbo, P.; Woollen, J. The ERA-40 re-analysis. Quart. JR Meteorol. Soc. 2005, 131, 2961–3012. [Google Scholar] [CrossRef]
- Emanuel, K.A. Atmospheric Convection; Oxford Univ. Press: New York, 1994. [Google Scholar]
- Zeng, X.; Tao, W.-K. T.; Simpson, J. An equation for moist entropy in a precipitating and icy atmosphere. J. Atmos. Sci. 2005, 62, 4293–4309. [Google Scholar] [CrossRef]
- Salby, M.L. Fundamentals of atmospheric physics; Elsevier: New York, 1996. [Google Scholar]
© 2008 by the authors; licensee Molecular Diversity Preservation International, Basel, Switzerland. This article is an open-access article distributed under the terms and conditions of the Creative Commons Attribution license (http://creativecommons.org/licenses/by/3.0/).
Share and Cite
MDPI and ACS Style
Tapiador, F.J. Hurricane Footprints in Global Climate Models. Entropy 2008, 10, 613-620. https://doi.org/10.3390/e10040613
AMA Style
Tapiador FJ. Hurricane Footprints in Global Climate Models. Entropy. 2008; 10(4):613-620. https://doi.org/10.3390/e10040613
Chicago/Turabian StyleTapiador, Francisco J. 2008. "Hurricane Footprints in Global Climate Models" Entropy 10, no. 4: 613-620. https://doi.org/10.3390/e10040613