Applying Multiscale Entropy to the Complexity Analysis of Rainfall-Runoff Relationships

Department of Design for Sustainable Environment, MingDao University, 369 Wen-Hua Road, Peetow, Changhua 52345, Taiwan
Entropy 2012, 14(5), 945-957; https://doi.org/10.3390/e14050945
Submission received: 14 March 2012
/
Revised: 6 May 2012
/
Accepted: 11 May 2012
/
Published: 16 May 2012
Abstract
:This paper presents a novel framework for the complexity analysis of rainfall, runoff, and runoff coefficient (RC) time series using multiscale entropy (MSE). The MSE analysis of RC time series was used to investigate changes in the complexity of rainfall-runoff processes due to human activities. Firstly, a coarse graining process was applied to a time series. The sample entropy was then computed for each coarse-grained time series, and plotted as a function of the scale factor. The proposed method was tested in a case study of daily rainfall and runoff data for the upstream Wu–Tu watershed. Results show that the entropy measures of rainfall time series are higher than those of runoff time series at all scale factors. The entropy measures of the RC time series are between the entropy measures of the rainfall and runoff time series at various scale factors. Results also show that the entropy values of rainfall, runoff, and RC time series increase as scale factors increase. The changes in the complexity of RC time series indicate the changes of rainfall-runoff relations due to human activities and provide a reference for the selection of rainfall-runoff models that are capable of dealing with great complexity and take into account of obvious self-similarity can be suggested to the modeling of rainfall-runoff processes. Moreover, the robustness of the MSE results were tested to confirm that MSE analysis is consistent and the same results when removing 25% data, making this approach suitable for the complexity analysis of rainfall, runoff, and RC time series.
PACS Codes:
92.40.Ea
1. Introduction
Heavy rainfall and flooding are some of the disasters which cause the greatest loss of property and life in Taiwan. It is therefore essential to study the relation between the rainfall and runoff processes. Usually, observed rainfall and runoff data are applied to rainfall-runoff models to investigate the relation between the rainfall and runoff. Jakeman and Hornberger [1] indicated that the information content in a rainfall-runoff record is sufficient to support models of only very limited complexity. This raises the question of what limits should observed data place on the allowable complexity of rainfall-runoff models [1]. In practice, it is difficult to identify the underlying mechanisms that produced the data. The runoff coefficient (RC), defined as the ratio of the runoff to the rainfall, can demonstrate how much rainfall is transformed into runoff for a specific duration, and represent the transformed relation of rainfall-runoff processes in a river basin. Therefore, this study applies the RC time series to investigate the rainfall-runoff relationship.
The concept of entropy originated in the field of thermodynamics. After more than 100 years of development, the applications of entropy have gone far beyond the category of thermodynamics and statistical physics. Entropy has directly or indirectly permeated into the domains of information theory, mathematics, geosciences, life science, social science, and more [2]. Shannon introduced the concept of Boltzmann entropy in statistical thermodynamics to information theory in 1948. Entropy is considered a measure of uncertainty or information quantity of events, establishing the concept of information entropy, which is the basic theory of modern information theory. Information entropy has become an important tool to measure and analyze the complexity of various physical and non-physical systems [2].
Entropy is commonly used to characterize the complexity of a signal. Kolmogorov-Sinai (KS) entropy can be used to represent complexity, and is computed from the average production rate of new information. KS entropy is the basis of approximate entropy [3]. Approximate entropy is effective for analyzing the complexity of short time series. Richman and Moorman [4] defined sample entropy, which is a modification of approximate entropy. However, traditional sample entropy measures only quantify the regularity of time series. Each type of observation data may include different characteristic at various scales because of their complexity. This makes it difficult to explore the characteristics of data and processing results deficient in stability when the data analysis is limited to a single scale [2].
Both KS entropy and determined approximate entropy use a single scale. However, these methods neglect the characteristics when the number of scales exceeds one. Costa et al. [5,6] defined and applied multiscale entropy (MSE), which is based on sample entropy and is effective in analyzing the complexity of physiological signals. Their results demonstrate that MSE curves identified diseased hearts to have a significant decrease in the sample entropy on multiple time scales, indicating a lower degree of complexity. Valuable hidden information may be obtained by excavating the characteristics of signals at various scales [7]. Traditional methods, determined use a single scale, ignore sequential properties across scales, thereby may misinterpret the changes of reduced complexity with the order of different time series [8]. Greater entropy values are not always associated with an increase in complexity [8]. For example, although there is no underlying dynamical structure in a white Gaussian noise time series, the time series returns a high entropy value [8]. The MSE, an aggregate analysis method, has been suggested to overcome the limitations of single-scale entropy measures by using a moving average window that varies in scale to compute entropy over different variations of the same data set [8]. For this purpose, this study applies MSE to the complexity analysis of rainfall, runoff, and RC time series.
Hydrological time series, such as rainfall, runoff, and RC time series, usually operate across time scales and have more complexity than those on a single scale. Hence, using traditional entropy measures to describe the complexity of hydrological time series will be incomplete [9]. Compared to traditional entropy measures, MSE curves are used to compare the relative complexity of time series and are more effective for analyzing those series with multiple temporal scale characteristics [7]. In this study, the MSE is applied to RC time series for the investigation of the complexity of rainfall-runoff processes.
MSE analysis, which is a method of measuring the complexity of a finite length time series, has been applied to the analysis of multiscale hydrological time series. Li and Zhang [9] applied MSE analysis to long-term (131 year) daily flow rates (Q) of the Mississippi River (MR) to investigate possible changes in the complexity of the MR system caused by human activities since the 1940s. They found that the sample entropy for Q of the MR and its two components, overland flow (OF) and base flow (BF), generally increase as the time scale increases, and the MR may have been losing its complexity since the 1940s. Chou [10] presented a novel framework to determine the number of resolution levels in the application of a wavelet transformation to a rainfall time series. He decomposed rainfall time series using à trous wavelet transform. Then, he applied MSE analysis, which helps elucidate some hidden characteristics of the original rainfall time series, to the decomposed rainfall time series. His results show that the Mann-Kendall (MK) rank correlation test of MSE curves of residuals at various resolution levels can determine the number of resolution levels in the wavelet decomposition. The complexity of rainfall time series at four stations on a multiscale is compared. These results reveal that the suggested number of resolution levels can be obtained using MSE analysis and the MK test. The complexity of rainfall time series at various locations can also be analyzed to provide a reference for water resource planning and application. Zhou et al. [11] used MSE analysis to study the effects of water reservoirs on river flow records based on long streamflow series at four representative hydrological stations. They found that before the construction of the water reservoirs, the complexity of the streamflow series was decreasing from the upper reaches to the lower reach of the East River. The construction of water reservoirs greatly increased the degree of complexity of the hydrological processes. Their results have theoretical and scientific merit for conservation of the ecological environment and water resource management under the influences of climate changes and intensifying human activities.
The central objectives of this study were to apply MSE analysis to rainfall, runoff, and RC time series. The entropy measures of these time series at various scale factors can be compared and used for complexity analysis. The following sections describe the structure of the MSE, present a case study in Taiwan to demonstrate the effectiveness of the presented method, and discuss the results to draw the conclusions.
2. Multiscale Entropy Analysis
2.1. Sample Entropy
Sample entropy provides a measure of an “orderly structure” in a time series, by testing if there are any repeated patterns of various lengths. The sample entropy is the exact value of the negative average natural log of the conditional probability. If the data length of the original time series is N, then the sample entropy of the time series is calculated below [4,12].
(I) The m-dimensional vector, , comprises a time series in which i = 1,2,…,N − m + 1.
(II) Define the distance between X(i) and X(j) as follows:
where k = 0,1,2,…, m − 1. Calculate the distance between X(i) and other vector X(j), where j= 1,2,…,N – m + 1, but j ≠ i.
(III) Count the that are smaller than a given threshold r. Then, compute the ratio of this number to the total number N − m, as follows:
(IV) Find the average for all i, as follows:
(V) Add one to the number of dimensions of the vector, yielding m + 1 dimensions. Repeat Steps (I) to (IV), yielding .
(VI) The theoretical sample entropy of the time series is given by:
2.2. Multiscale Entropy
The parameters of sample entropy are determined by a single differentiation. The sample entropy, which is used in the analysis of a single scale factor, does not include the characteristics of the time series when the number of scale factor exceeds one. Costa et al. [5,6,7] developed a multiscale entropy analysis based on the definition of the sample entropy. Suppose that is the original time series. The time series at various scale factors, {}, can then be obtained using the following procedure [7,12]:
(I) Apply a coarse graining process to a time series. Let , where , j = 1,2,…,N/τ. The data length of the time series equals that of the original time series divided by the scale factor τ.
(II) Compute the sample entropy {} for all scale factors τ.
This procedure, called multiscale entropy analysis, is used to analyze entropy when the scale factor exceeds one. When τ = 1, {} equals the original time series.
3. Application and Analysis
This study demonstrates the feasibility of applying the proposed MSE method to the complexity analysis of rainfall-runoff processes using the Wu-Tu watershed located in northern Taiwan as a case study. The watershed area is 203 km2 (Figure 1). Because of the topography of this watershed, the runoff pathlines are short and steep, and rainfall is nonuniform in both time and space. Large floods develop quickly in the middle-to-downstream reaches of the watershed, causing severe damage. The daily rainfall and runoff data for 1966–1994 were collected. The basin average rainfall data were obtained from the Jui–Fang, Huo–Shao–Liao, and Wu–Tu weather stations using the block kriging method. The daily runoff data were obtained from the Wu–Tu hydrological station. The ratio of the runoff to the rainfall was defined as the RC. The RC demonstrates how much rainfall is transformed into runoff at a specific duration, and represents the transformed relationship of rainfall-runoff processes in a river basin. This study applies MSE analysis to the rainfall, runoff, and RC time series to extract some of their hidden characteristics. Basin average rainfall, runoff, and RC time series recorded along with a magnified view of one year are shown as Figure 2.
Figure 1.
The map (with Taiwan Datum 97 coordinates) of Wu–Tu watershed showing the study area near Taipei, Taiwan.
Figure 1.
The map (with Taiwan Datum 97 coordinates) of Wu–Tu watershed showing the study area near Taipei, Taiwan.

4. Results and Discussion
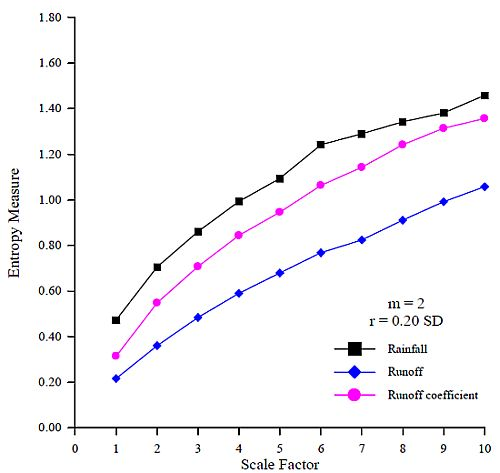
Figure 3 shows the MSE curves of the rainfall time series and average rainfall time series. The scale factor τ, the number of dimensions m, and threshold r are 10, 2, and 0.20 standard deviation (SD), respectively. The length of the original time series was 29 × 365 = 10585. Figure 3 shows that the entropy measures of these three rainfall stations are similar in various scale factors. The complexities of these three rainfall stations in the same watershed are almost the same. In addition, the entropy measures of average rainfall are similar to those of the rainfall time series at the three stations at various scale factors. This finding confirms that the average rainfall is a suitable input of rainfall-runoff system, and does not enhance the complexity of rainfall time series.
Figure 2.
Basin average rainfall, runoff, and RC time series recorded along with a magnified view of one year.
Figure 2.
Basin average rainfall, runoff, and RC time series recorded along with a magnified view of one year.
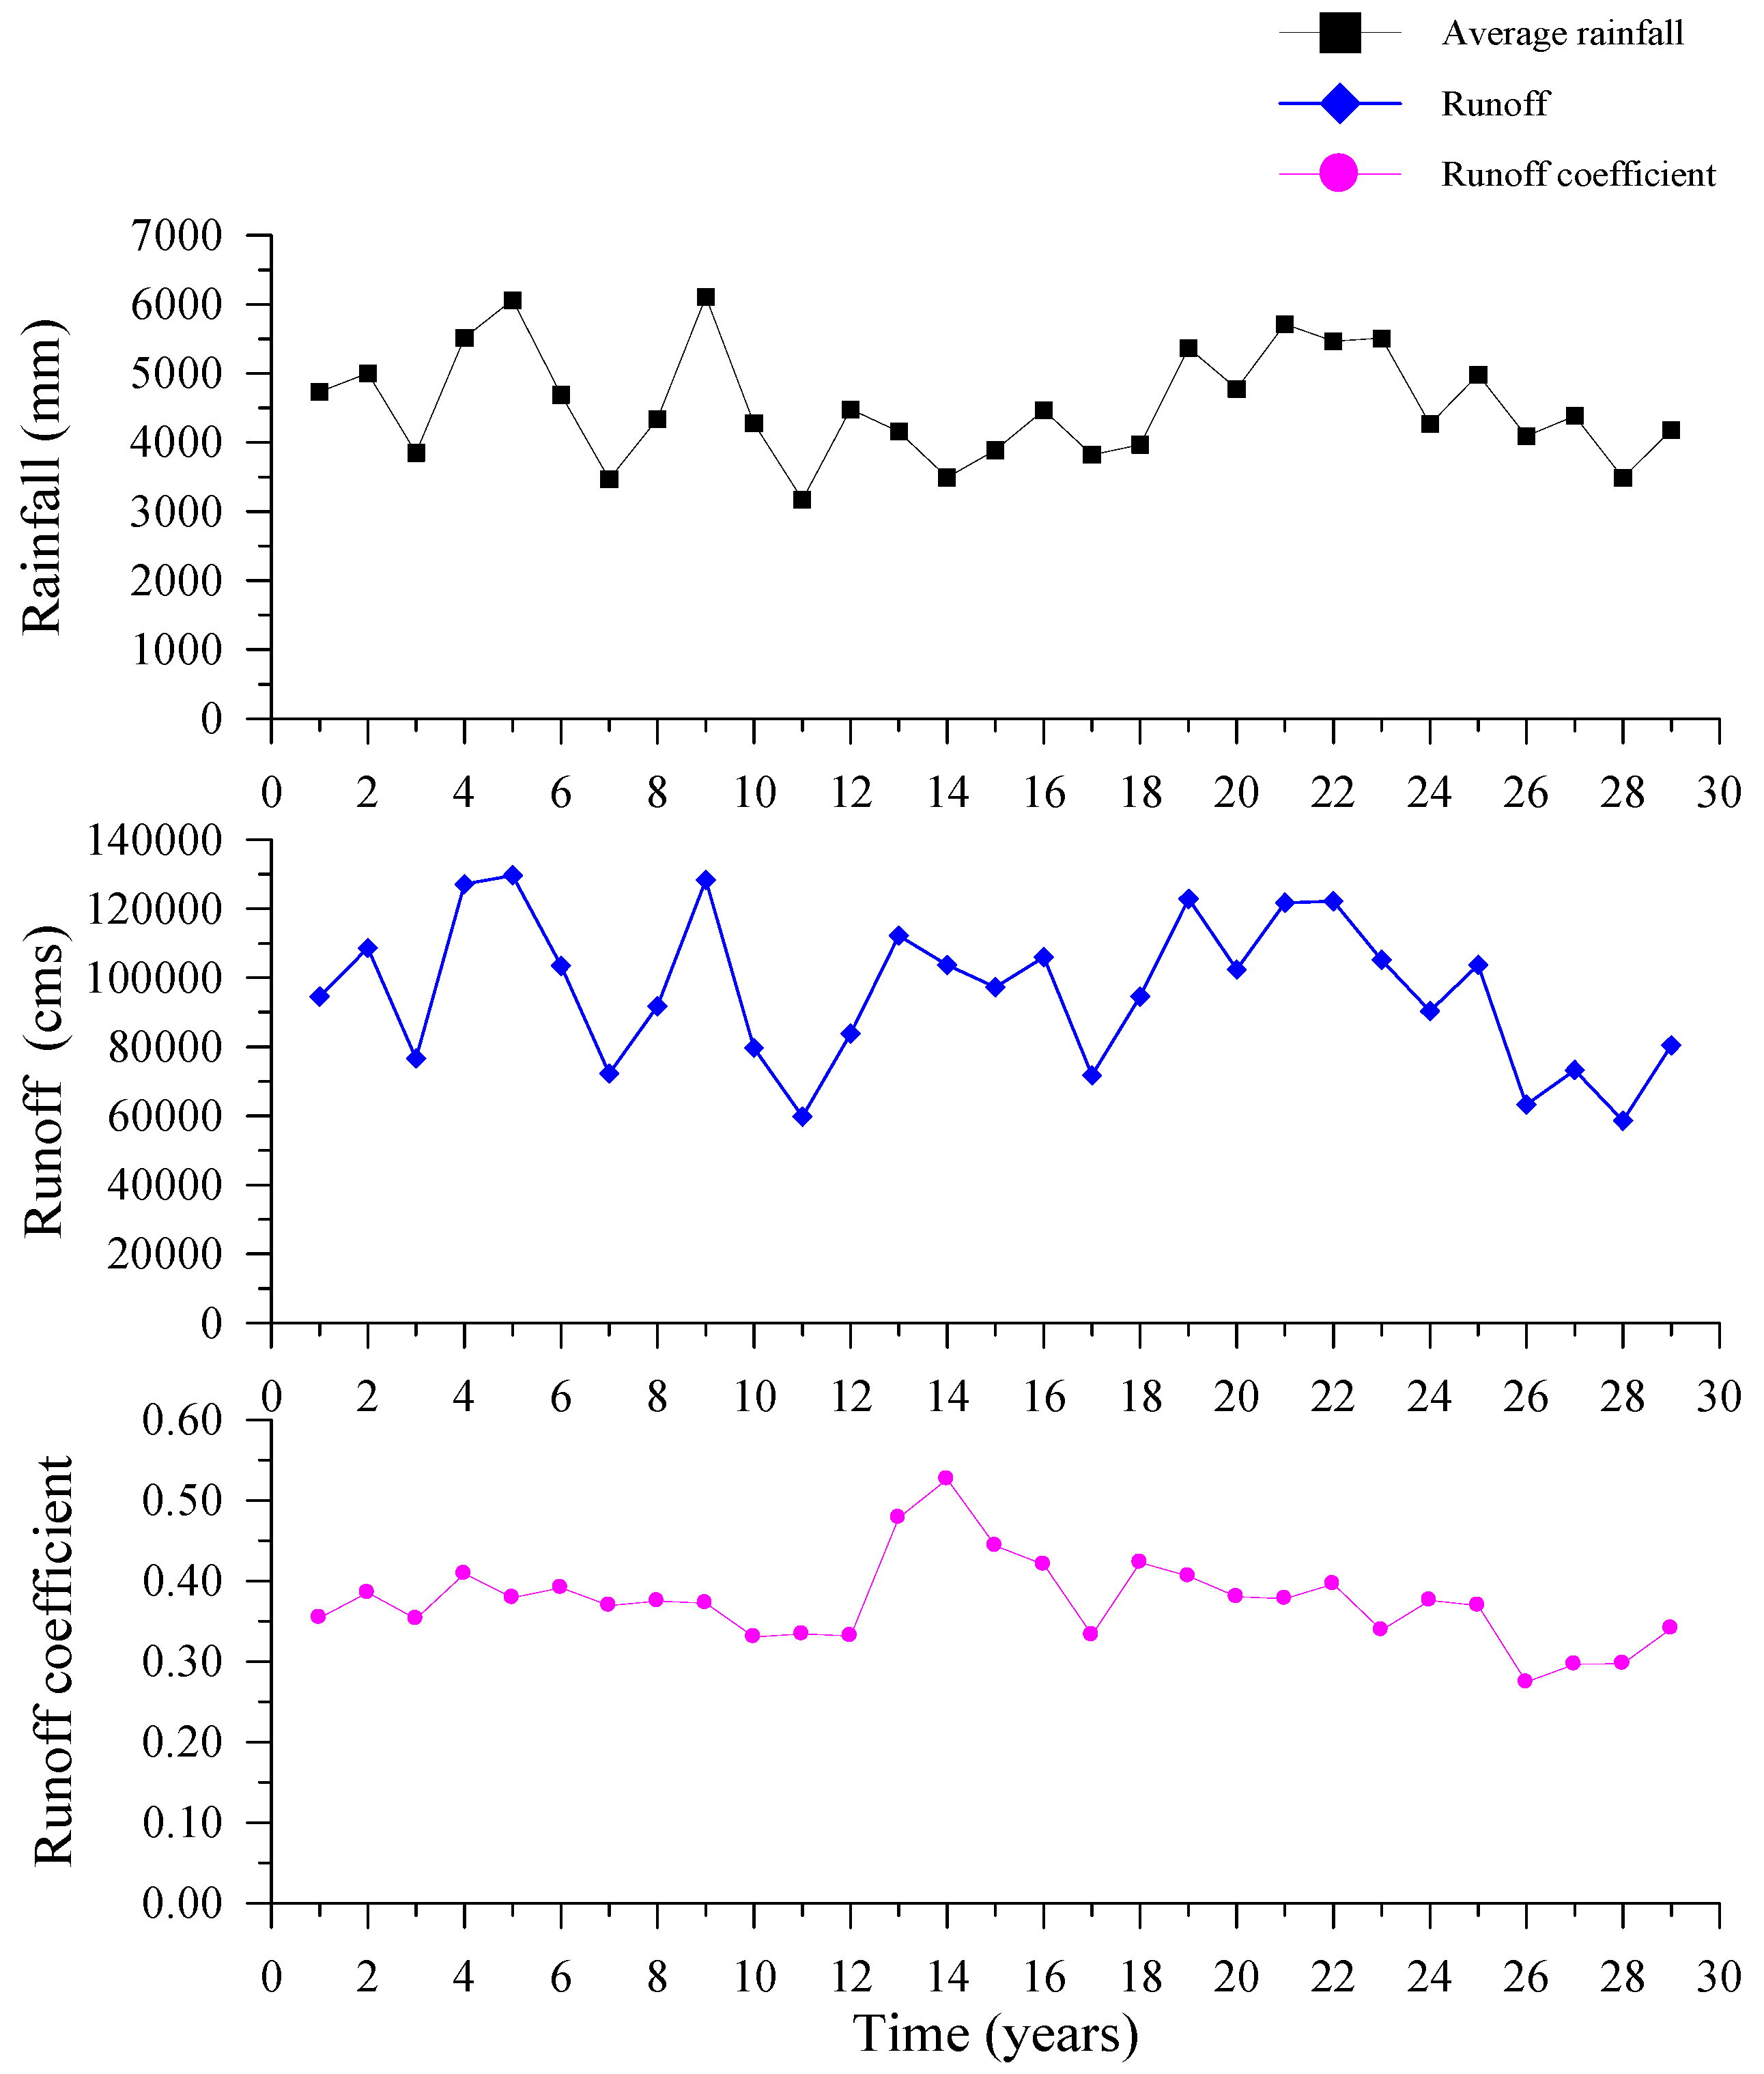
Figure 3.
The MSE curves of the rainfall time series at various stations and the average rainfall time series (m = 2 and r = 0.20SD).
Figure 3.
The MSE curves of the rainfall time series at various stations and the average rainfall time series (m = 2 and r = 0.20SD).

The MSE calculates the sample entropy at various scale factors. When the entropy measures increase as the scale factors increase, it represents that the time series have obvious self-similarity and great complexity [13]. Figure 3 confirms that the entropy measures of all the rainfall time series at the three stations and the average rainfall time series increase when scale factors increase. All of the above time series have obvious self-similarity and great complexity.
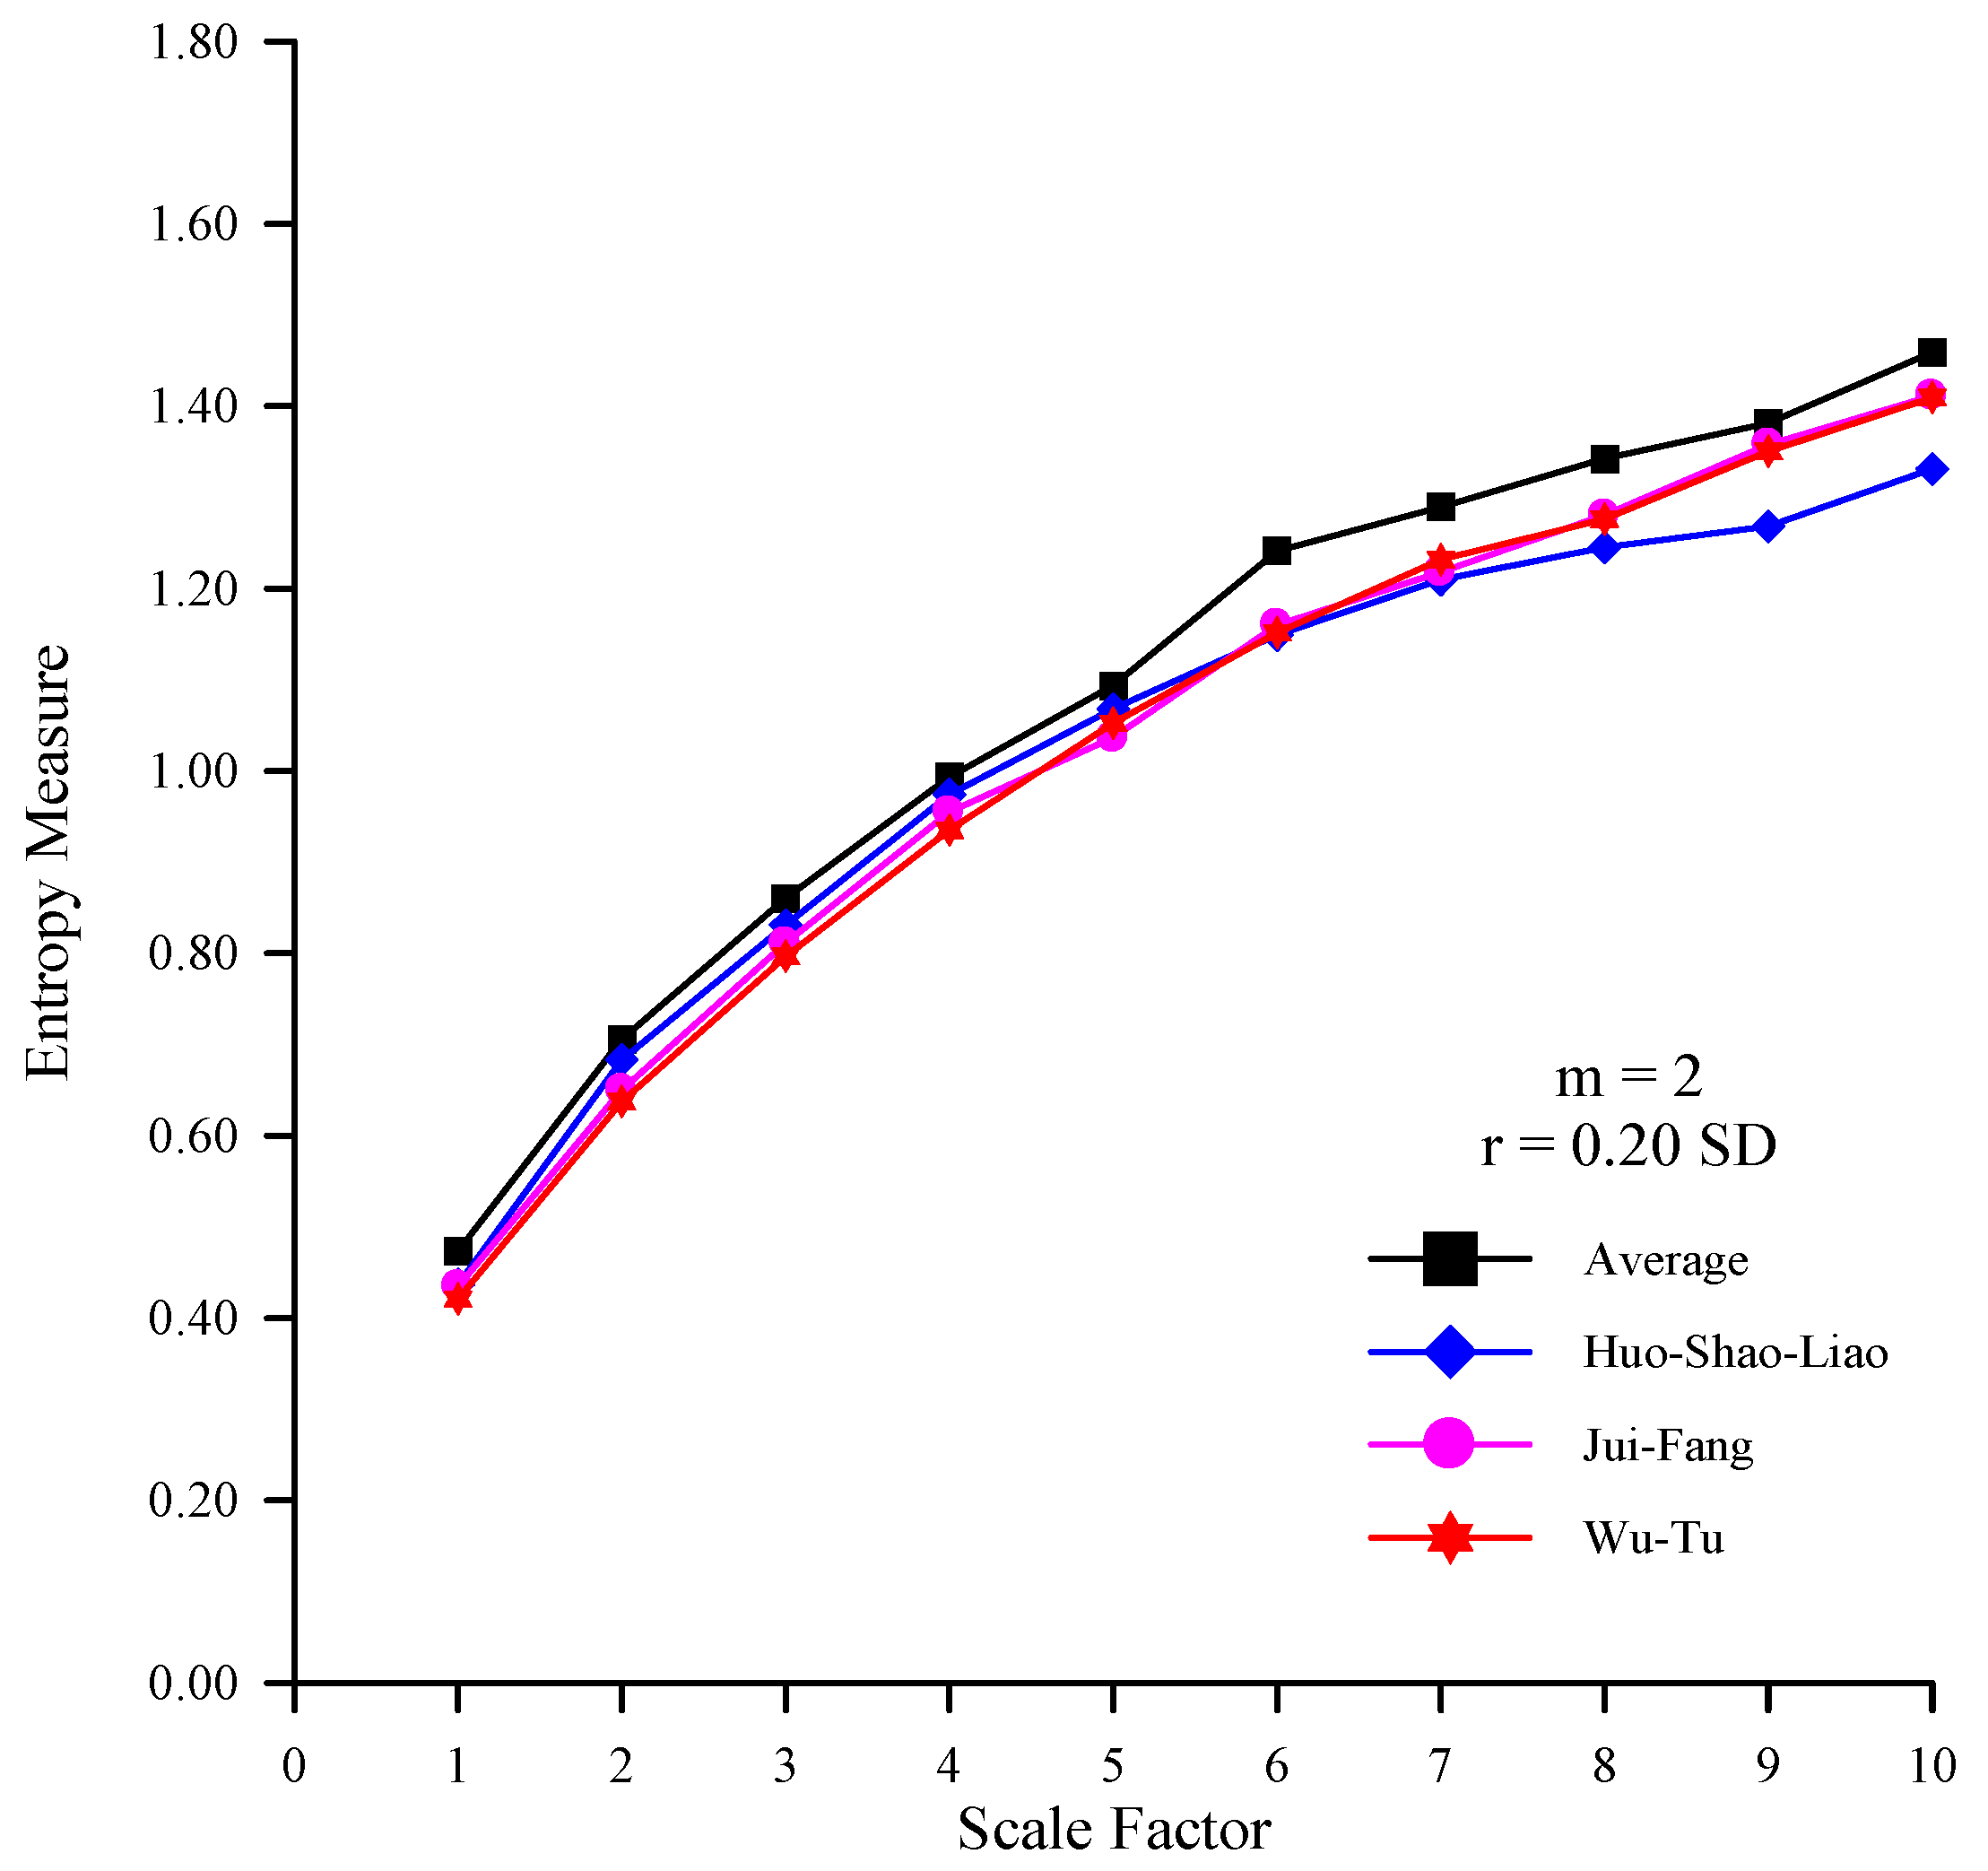
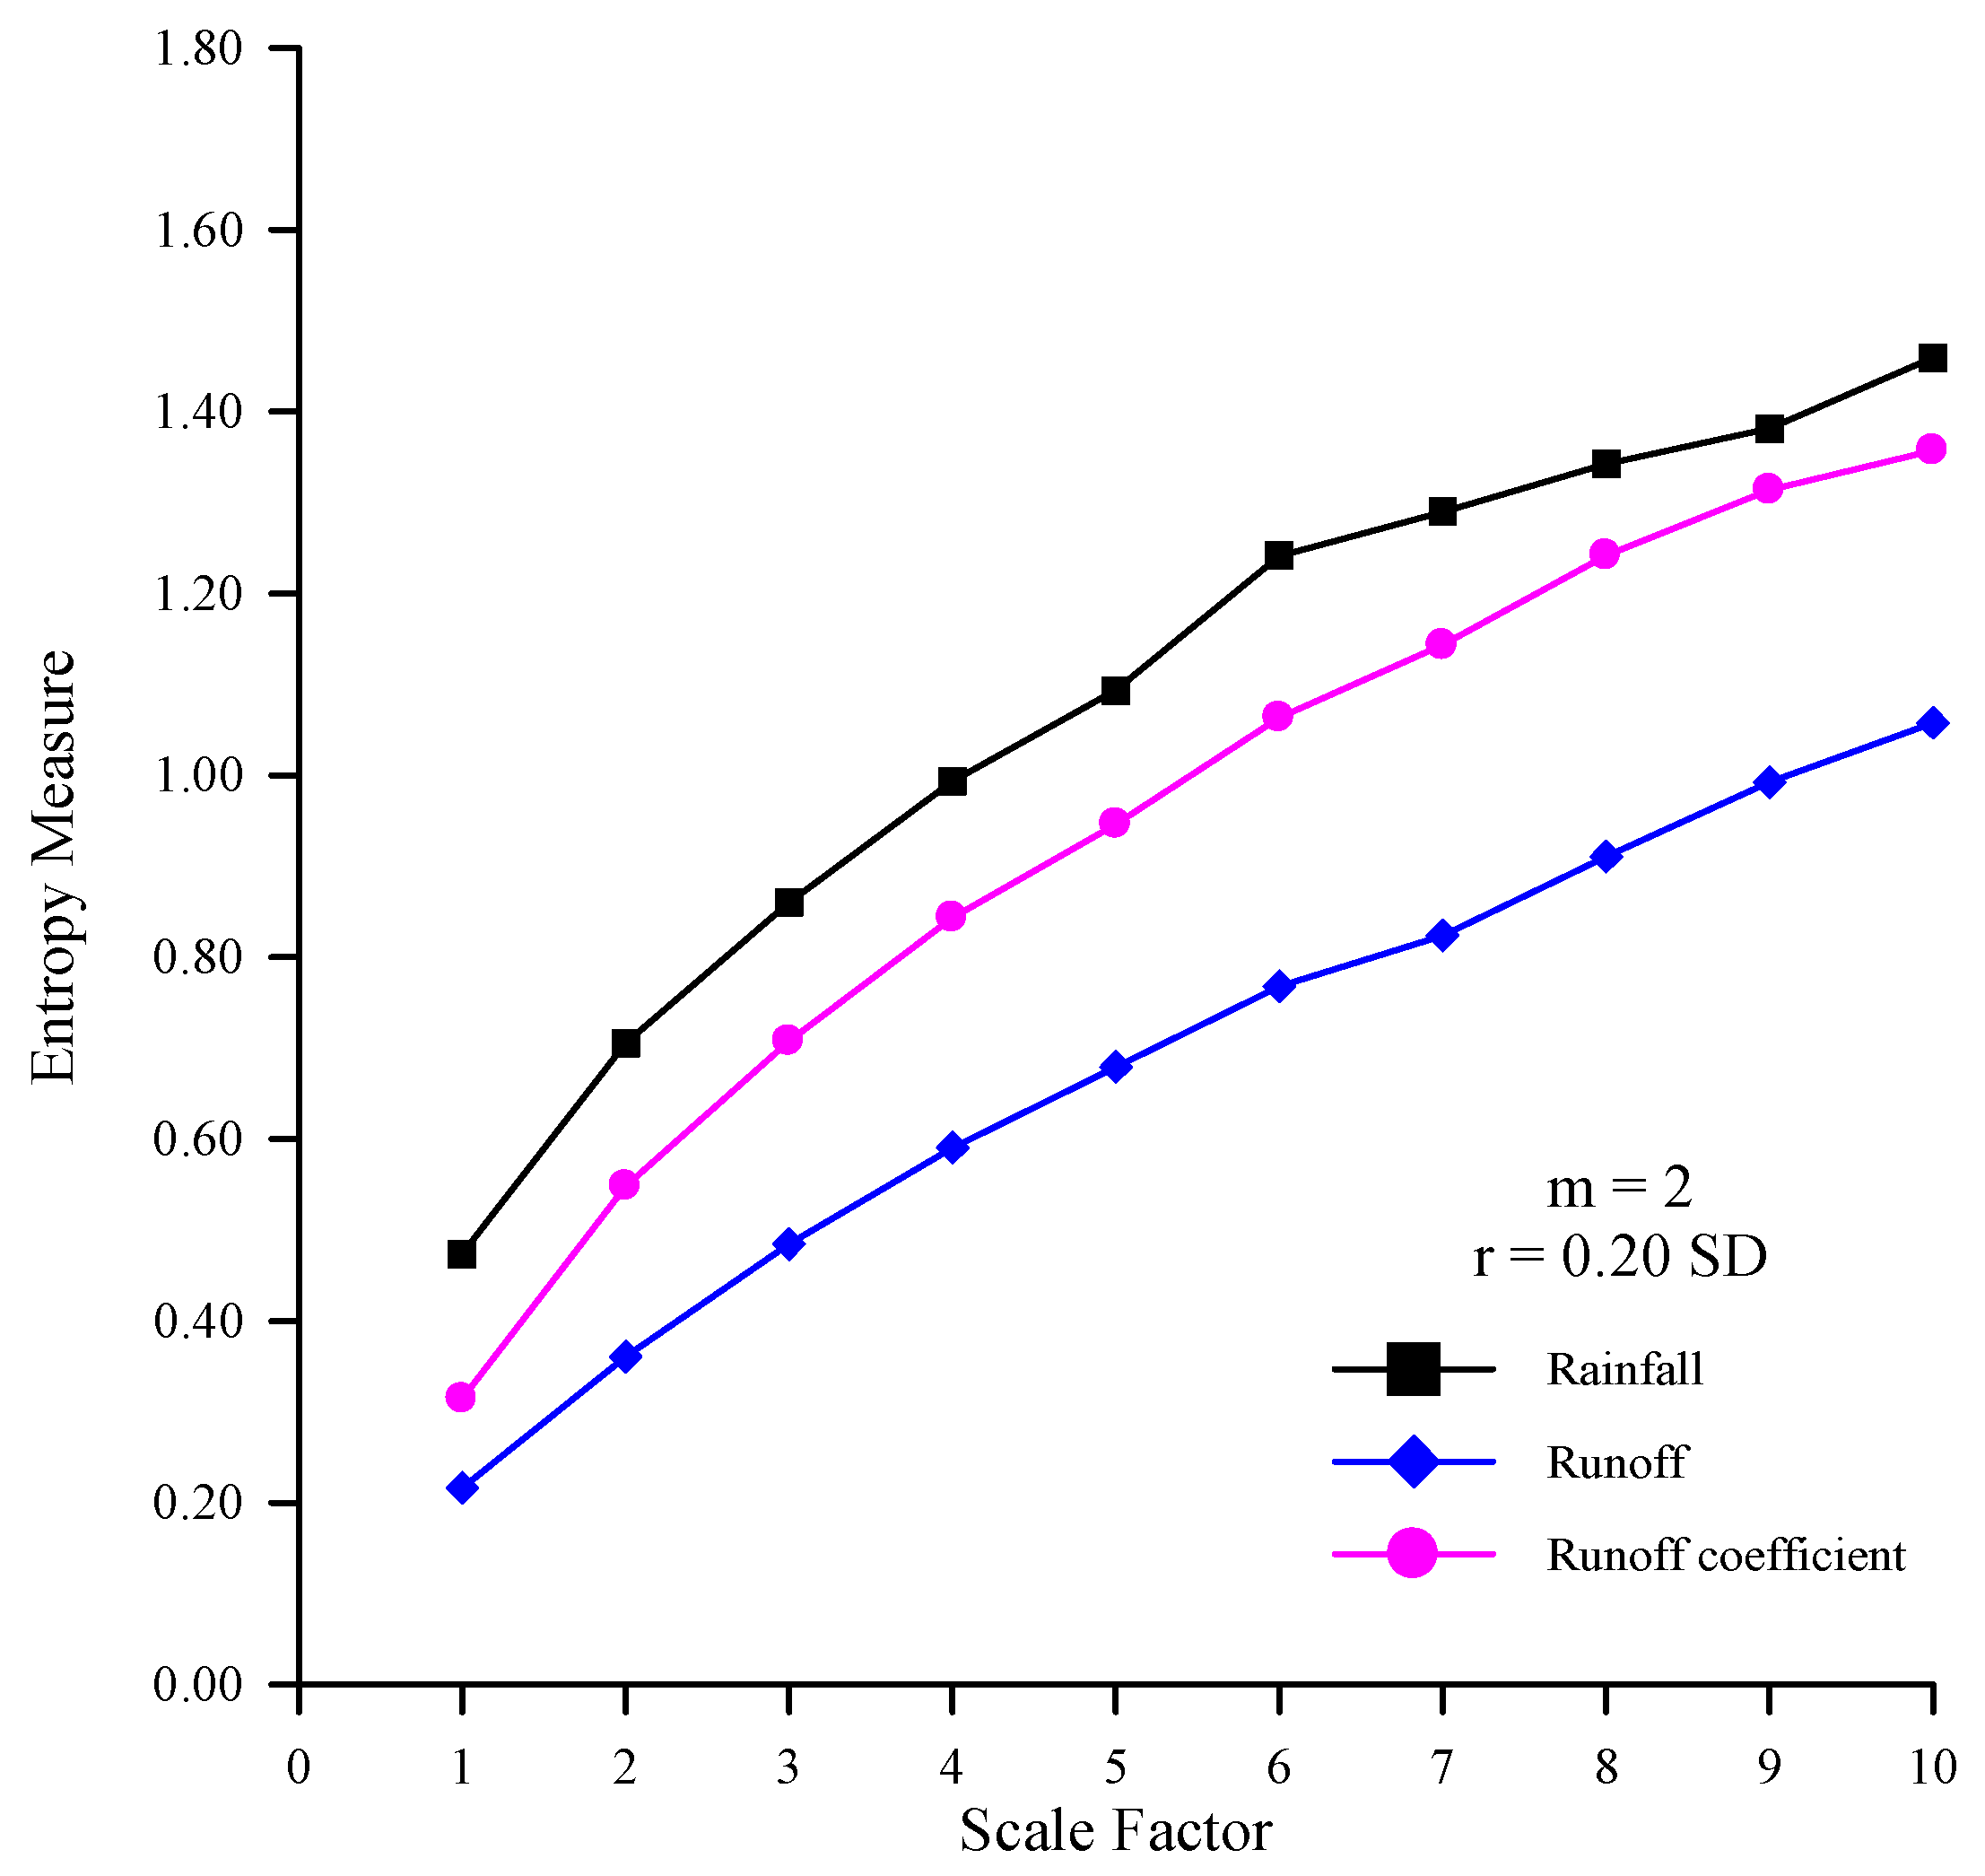
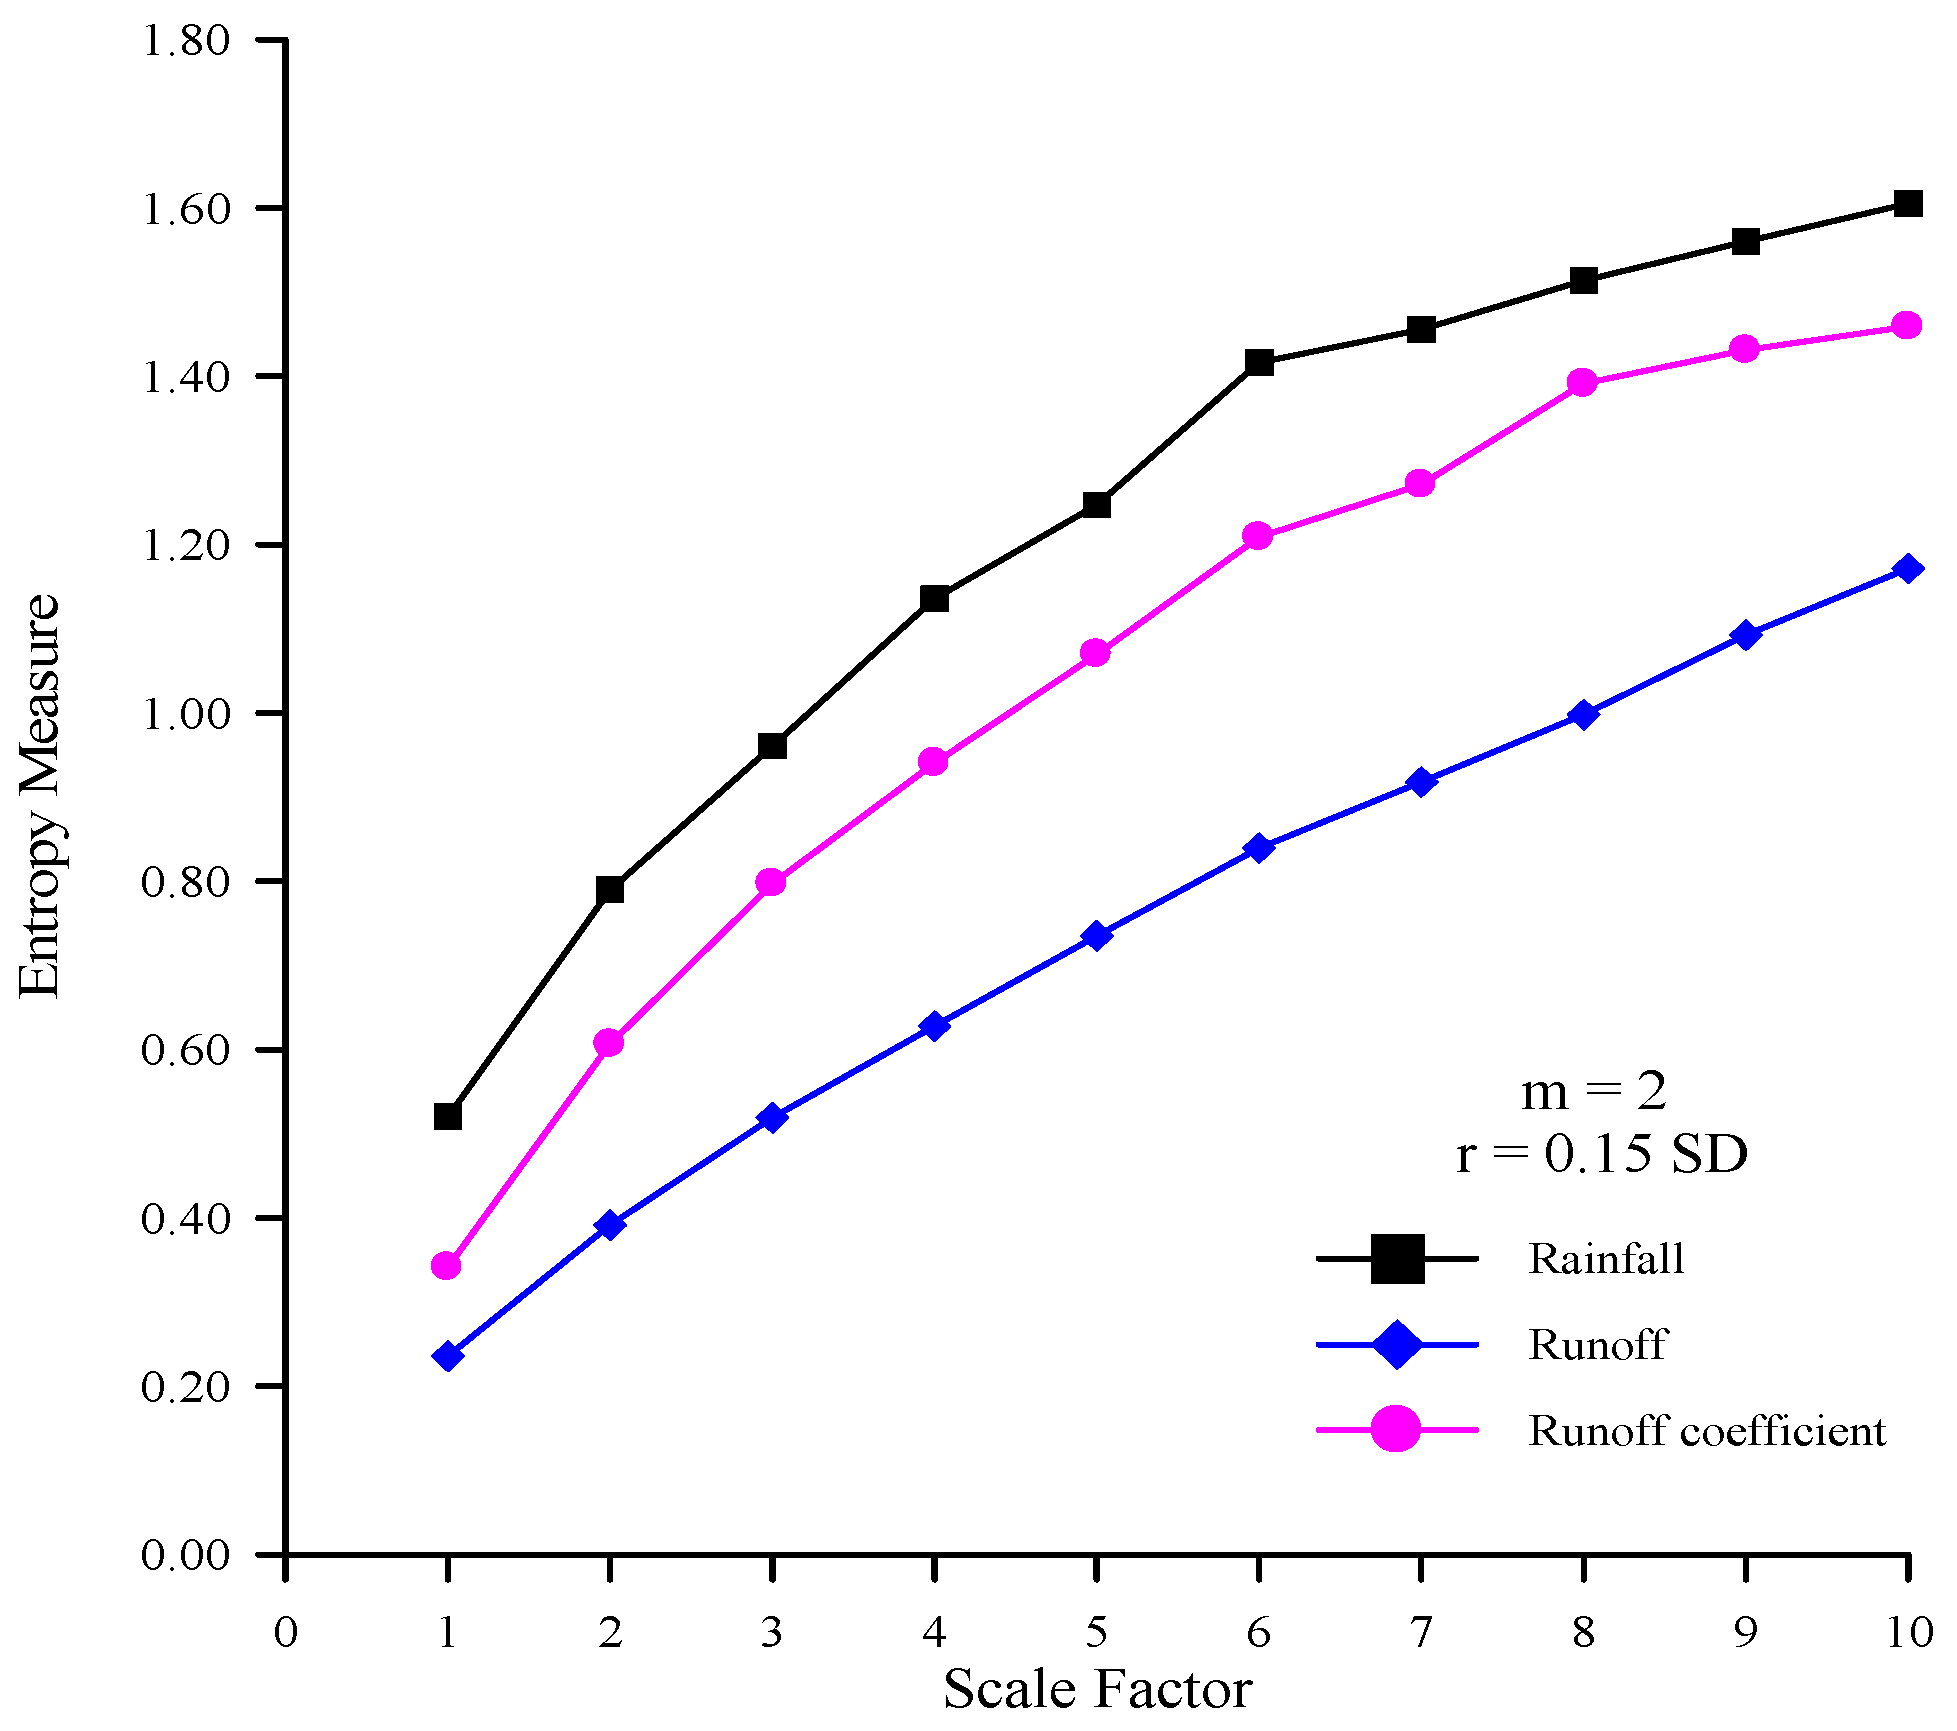
When the entropy measures of one time series are higher than that of another time series at most scale factors, it indicates that the former is more complex than the latter [7]. Figure 4 shows that the entropy measures of the rainfall time series are higher than those of runoff time series at all scale factors. This suggests that the rainfall time series is more complex than the runoff time series. In addition, these data provide evidence that the rainfall time series with high complexity transforms into the runoff time series with low complexity via the response of rainfall-runoff processes. Figure 4 shows that the entropy measures of rainfall, runoff, and RC time series increase as the scale factors increase. These results imply that these time series have self-similarity and great complexity. Figure 4 also shows that the entropy measures of RC are between those of the rainfall and runoff time series at all scale factors. The RC demonstrates how much rainfall is transformed into runoff at a specific duration, and represents the transformed relationship of rainfall-runoff processes in a river basin. The RC time series, which can be used to represent the rainfall-runoff relationship, are less complex than the rainfall time series, and are more complex than the runoff time series. Results also show that the entropy values of rainfall, runoff, and RC time series increase as scale factors increase, indicative of the obvious self-similarity and great complexity contained in the data [13]. The changes in the complexity of RC time series indicate the changes of rainfall-runoff relations due to human activities and provide a reference for the selection of rainfall-runoff models that are capable of dealing with great complexity and take into account of obvious self-similarity can be suggested to the modeling of rainfall-runoff processes. In this study, the results that the sample entropy for runoff time series generally increases with the scale factor are similar to those in Li and Zhang [9].
Figure 4.
The MSE curves of the rainfall, runoff, and RC time series (m = 2 and r = 0.20 SD).

To test the robustness of MSE results, the same analyses were performed by removing the last 25% of the time series (Table 1 and Table 2). Greater entropy values are not always associated with an increase in complexity when traditional methods which were determined using a single scale are used [8]. The average entropy measure, proposed by Chou, is used to compare the average complexity of rainfall time series at four different stations [10]. For example, Costa et al. [5] tested the MSE method on simulated white and 1/f noises. They found that for scale one, a higher value of entropy (about 2.48) is assigned to white noise time series in comparison with that (about 1.80) assigned to 1/f time series. However, while the value of entropy for the coarse-grained white noise time series monotonically decreases, the value of entropy for the coarse-grained 1/f series remains almost constant for all scales [5]. The greater average entropy measure of 1/f time series (about 1.80) contains more complex structures across multiple time scale than that of white noise (about 1.46). The use of the average entropy measure in MSE helps avoid the misinterpretation brought about by traditional single scale methods in which greater entropy values are always associated with an increase in complexity. The average entropy measures of the rainfall time series for the average rainfall and Huo–Shao–Liao, Jui–Fang, and Wu–Tu stations are 1.08, 1.02, 1.03, and 1.03, respectively. The average entropy measures of the rainfall time series for the average rainfall and Huo–Shao–Liao, Jui–Fang, and Wu–Tu stations when removing 25% of the time series are 1.08, 1.03, 1.03, and 1.02, respectively. The average entropy measures of the rainfall, runoff, and RC time series are 1.08, 0.69, and 0.95, respectively. The average entropy measures of the rainfall, runoff, and RC time series when removing 25% of the time series are 1.08, 0.69, and 0.95, respectively. These results confirm that the MSE is robust to removing part of the data. The influence of removing 25% of the time series on the MSE is small.

Table 1.
The entropy measures of the rainfall time series at various scale factors for various stations and the average rainfall when removing 25% of the time series.
| Scale Factor | Average Rainfall | Huo–Shao–Liao | Jui–Fang | Wu–Tu |
|---|---|---|---|---|
| 1 | 0.49 | 0.46 | 0.44 | 0.43 |
| 2 | 0.72 | 0.70 | 0.65 | 0.65 |
| 3 | 0.86 | 0.83 | 0.81 | 0.80 |
| 4 | 0.99 | 0.98 | 0.95 | 0.92 |
| 5 | 1.10 | 1.08 | 1.05 | 1.05 |
| 6 | 1.22 | 1.13 | 1.16 | 1.12 |
| 7 | 1.28 | 1.22 | 1.21 | 1.23 |
| 8 | 1.33 | 1.25 | 1.26 | 1.24 |
| 9 | 1.37 | 1.27 | 1.34 | 1.32 |
| 10 | 1.45 | 1.34 | 1.39 | 1.39 |
| Average | 1.08 | 1.03 | 1.03 | 1.02 |
Table 2.
The entropy measures of the rainfall, runoff, and RC time series at various scale factors when removing 25% of the time series.
| Scale Factor | Rainfall | Runoff | RC |
|---|---|---|---|
| 1 | 0.49 | 0.22 | 0.32 |
| 2 | 0.72 | 0.37 | 0.55 |
| 3 | 0.86 | 0.48 | 0.70 |
| 4 | 0.99 | 0.59 | 0.83 |
| 5 | 1.10 | 0.68 | 0.95 |
| 6 | 1.22 | 0.76 | 1.06 |
| 7 | 1.28 | 0.81 | 1.15 |
| 8 | 1.33 | 0.92 | 1.24 |
| 9 | 1.37 | 0.99 | 1.33 |
| 10 | 1.45 | 1.07 | 1.37 |
| Average | 1.08 | 0.69 | 0.95 |
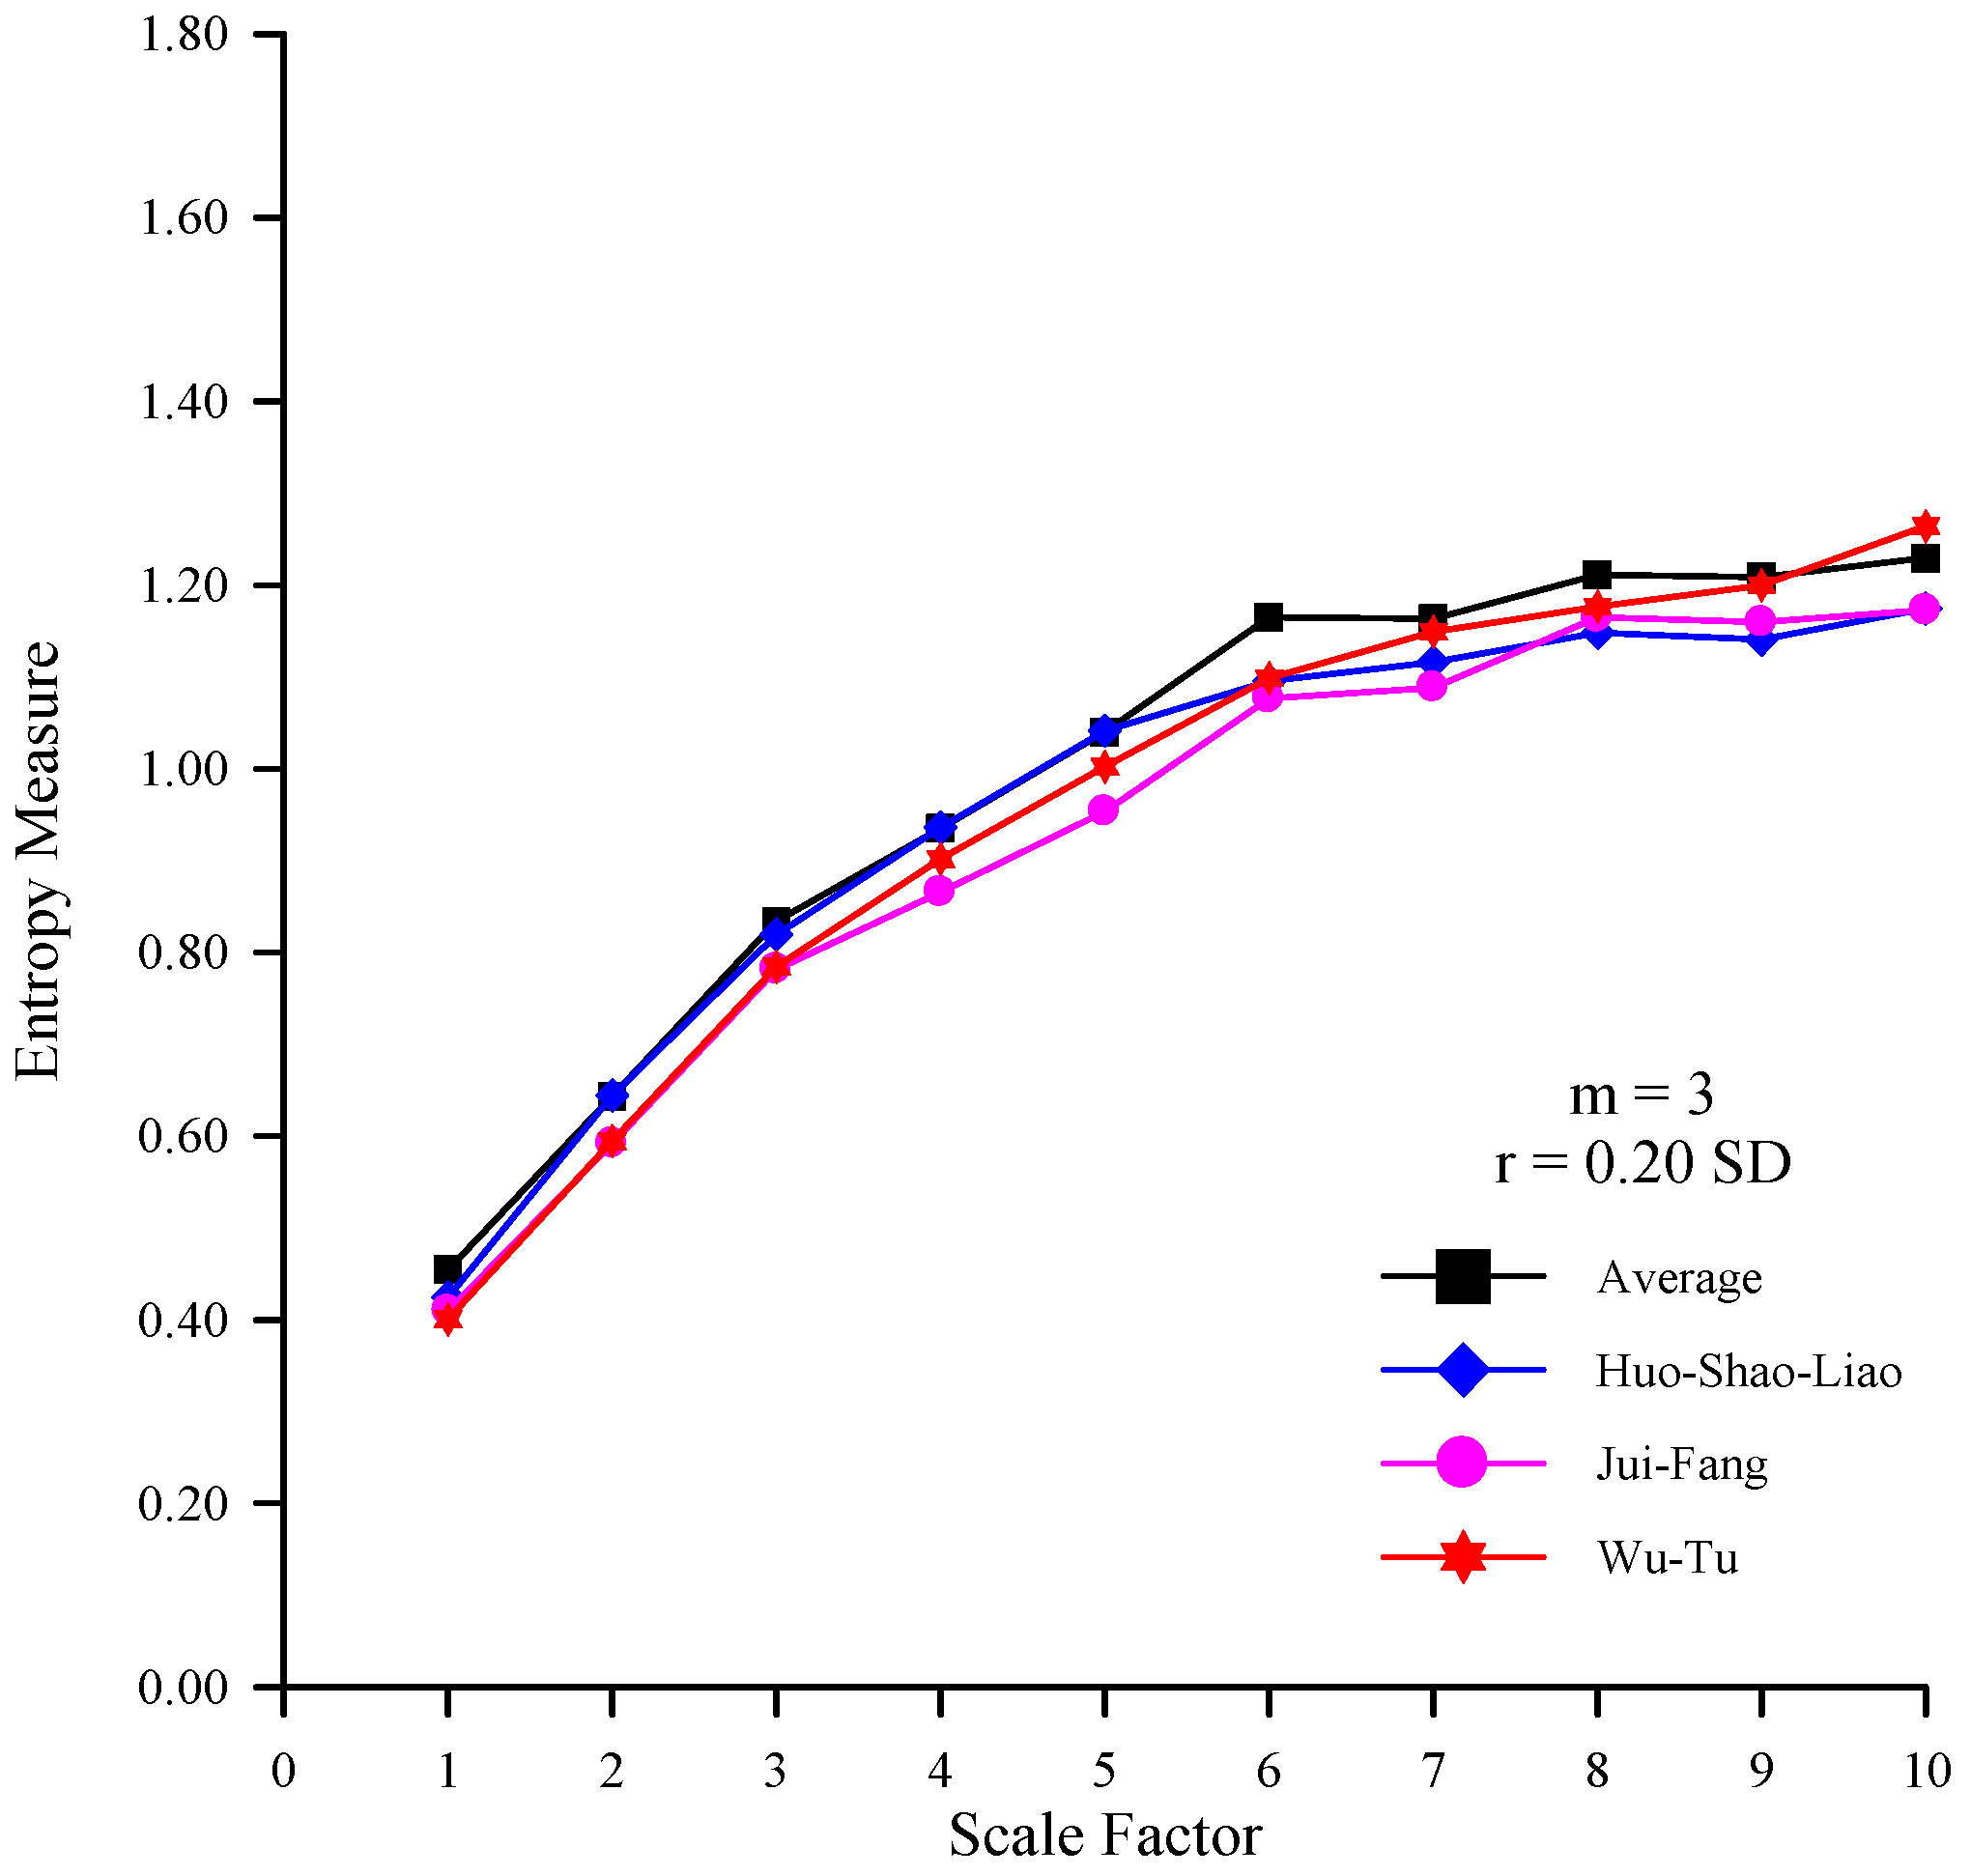
To test the robustness of MSE results, the same analyses were performed for r = 0.15SD (Figure 5 and Figure 6) and r = 0.25 SD (Figure 7 and Figure 8). The same analyses were performed for m = 3 and r = 0.20 SD (Figure 9 and Figure 10). Figure 5, Figure 6, Figure 7, Figure 8, Figure 9 and Figure 10 indicate that the entropy values of RC time series also increase with scale factors. These results confirm again that the changes in the complexity of rainfall-runoff relations. Table 3 shows the average entropy measures of the rainfall time series for average rainfall and three stations obtained from different m and r values. Table 4 shows the average entropy measures of the rainfall, runoff, and RC time series obtained from different m and r value. These results confirm that MSE analysis is consistent for various values of m and r. That is, if one time series has higher entropy measures than another time series, the results will be the same for various values of m and r. In this study, the MSE values with m = 2 and r = 0.20 SD can be used to robustly perform the complexity analysis of the rainfall-runoff relationship.
Figure 5.
The MSE curves of the rainfall time series at various stations and the average rainfall time series (m = 2 and r = 0.15SD).
Figure 5.
The MSE curves of the rainfall time series at various stations and the average rainfall time series (m = 2 and r = 0.15SD).
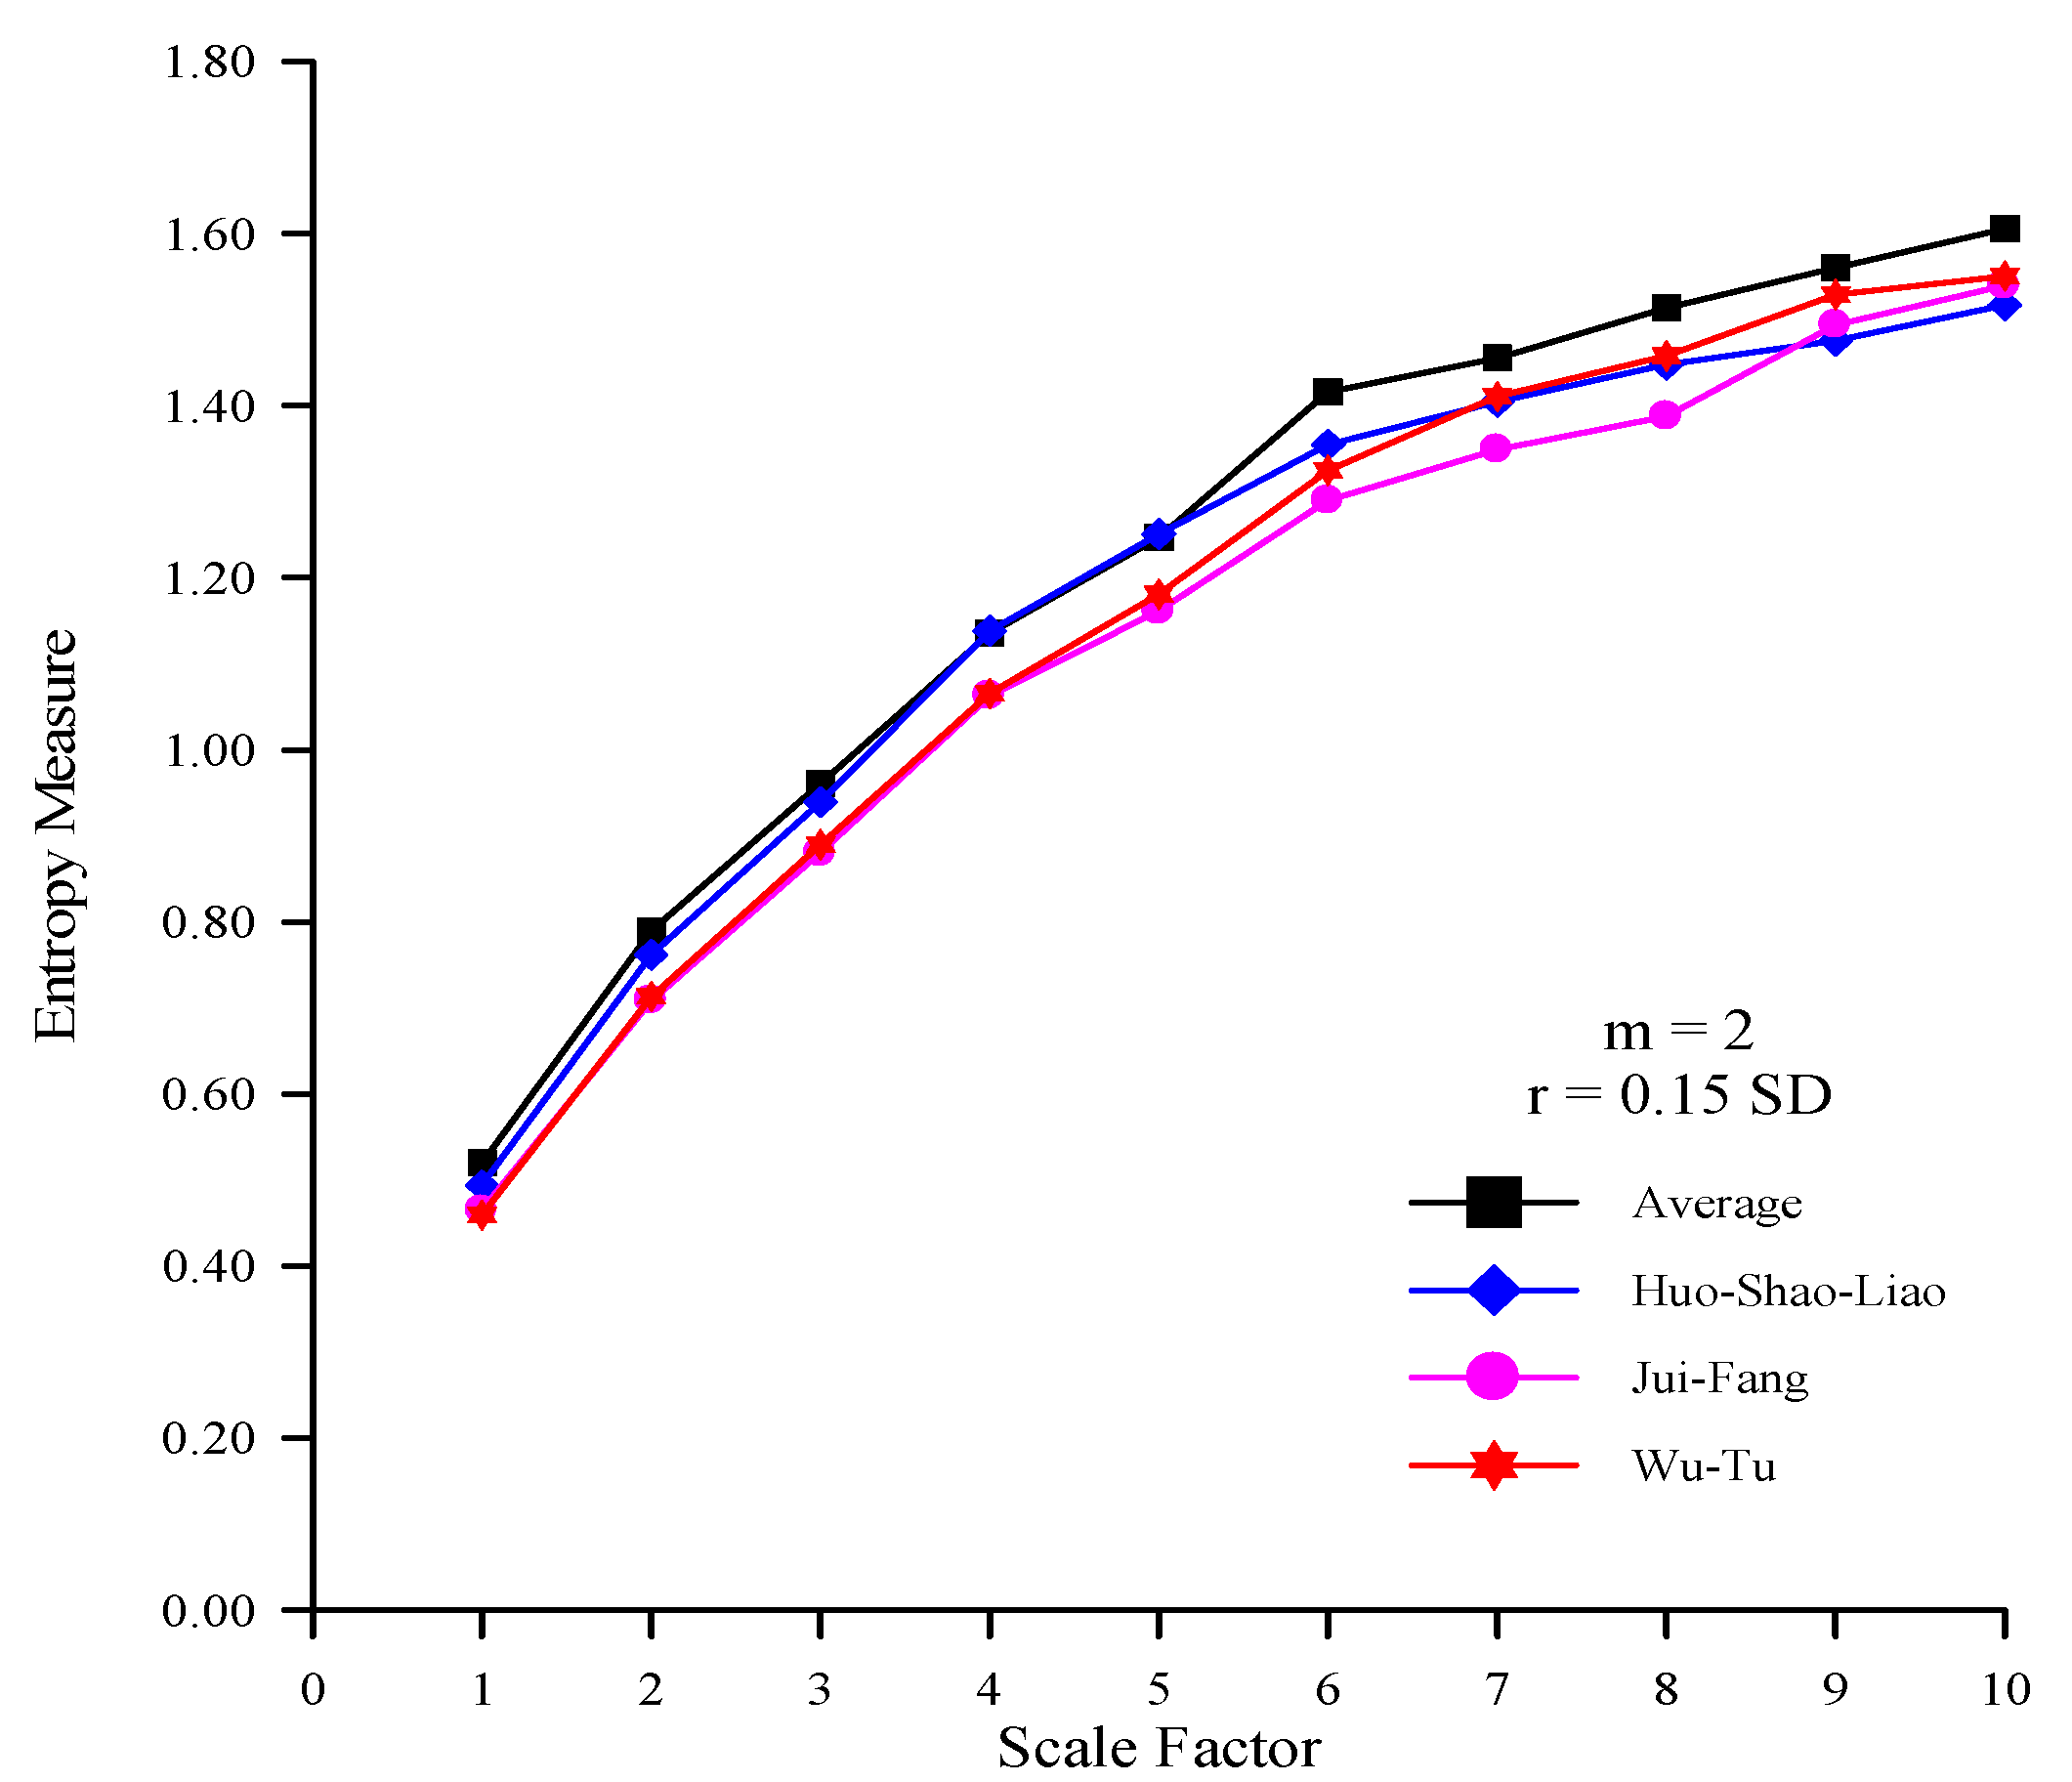
Figure 6.
The MSE curves of the rainfall, runoff, and RC time series (m = 2 and r = 0.15 SD).

Figure 7.
The MSE curves of the rainfall time series at various stations and the average rainfall time series (m = 2 and r = 0.25 SD).
Figure 7.
The MSE curves of the rainfall time series at various stations and the average rainfall time series (m = 2 and r = 0.25 SD).
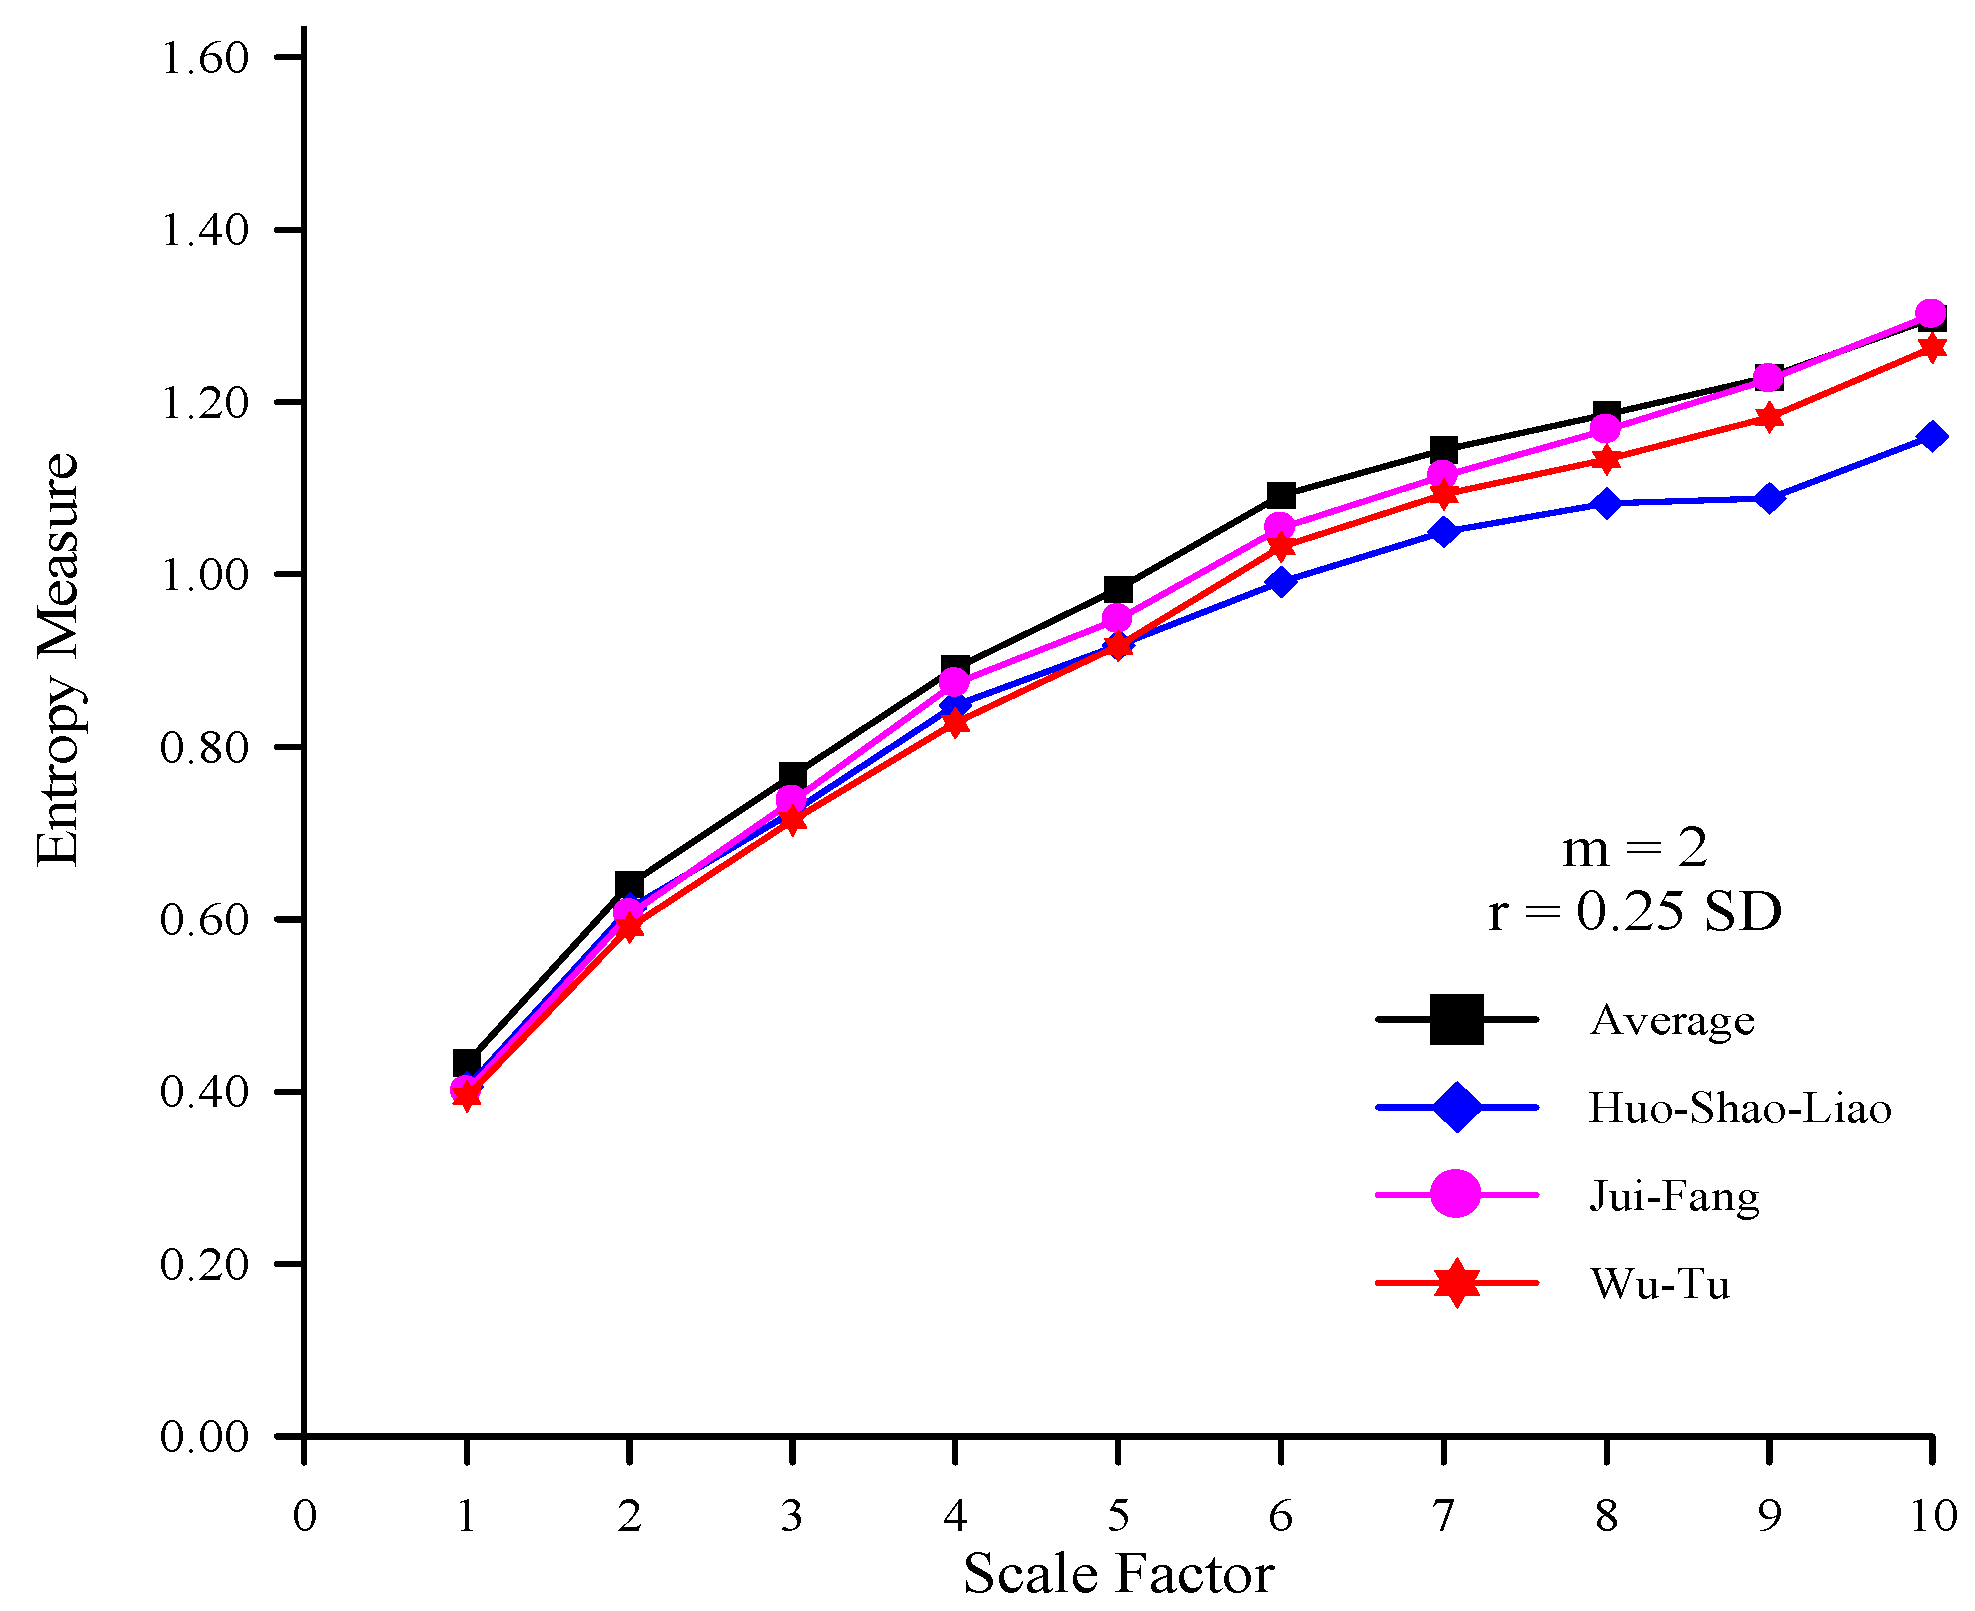
Figure 8.
The MSE curves of the rainfall, runoff, and RC time series (m = 2 and r = 0.25 SD).
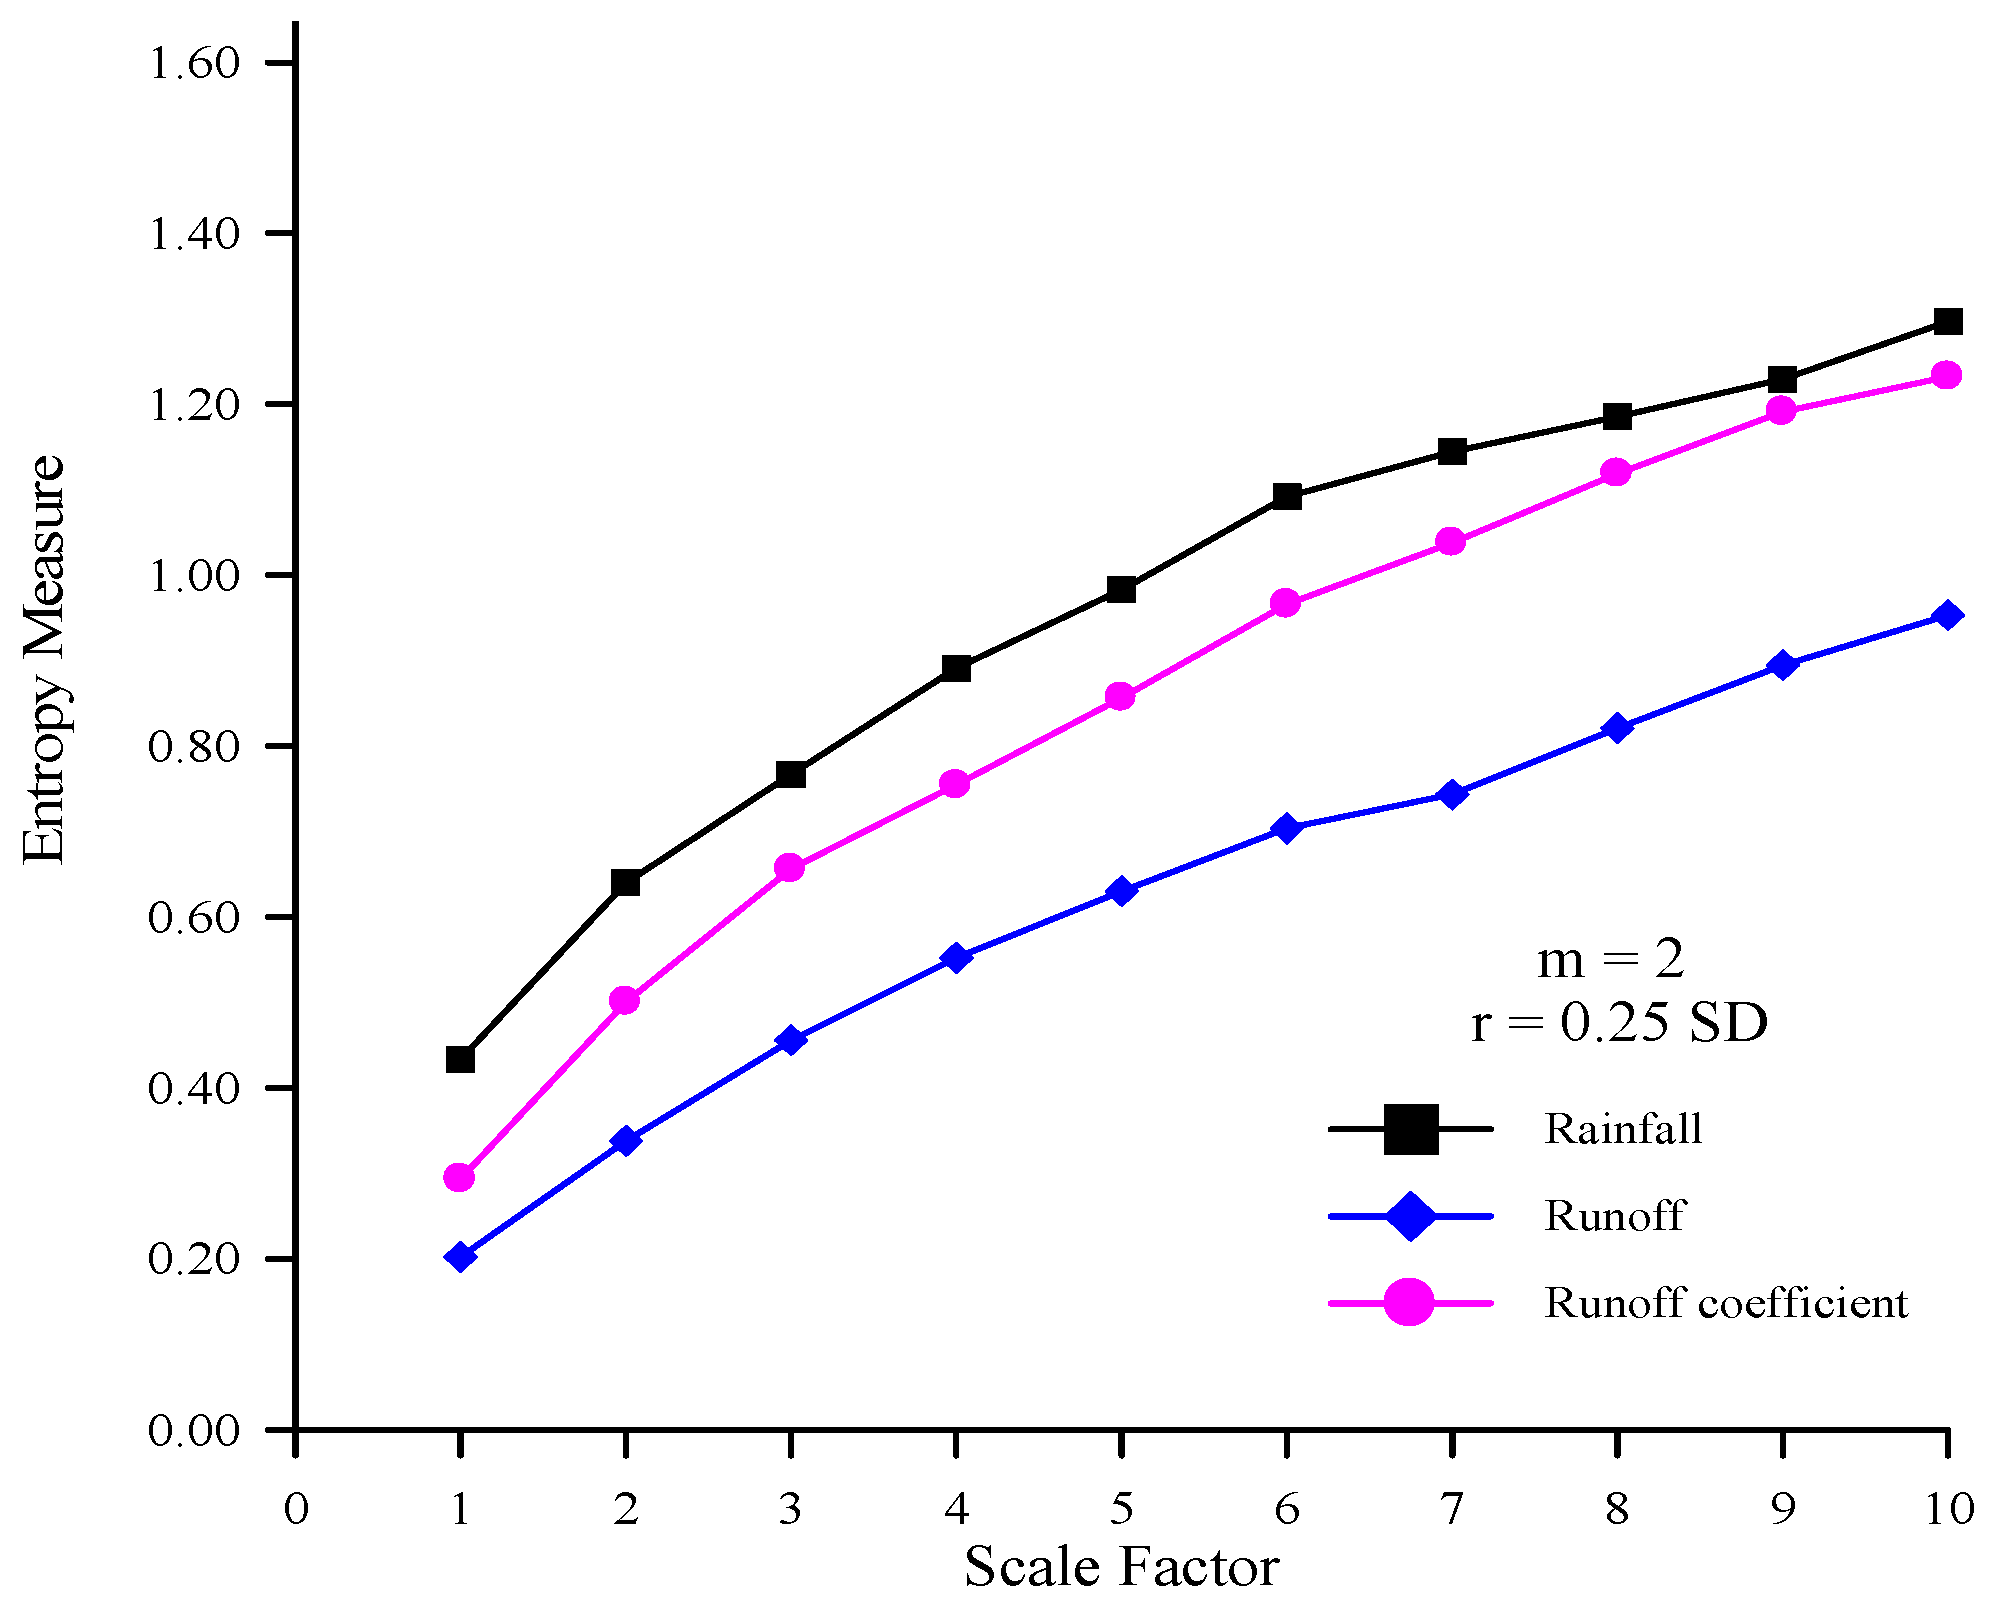
Figure 9.
The MSE curves of the rainfall time series at various stations and the average rainfall time series (m = 3 and r = 0.20 SD).
Figure 9.
The MSE curves of the rainfall time series at various stations and the average rainfall time series (m = 3 and r = 0.20 SD).

Figure 10.
The MSE curves of the rainfall, runoff, and RC time series (m = 3 and r = 0.20 SD).
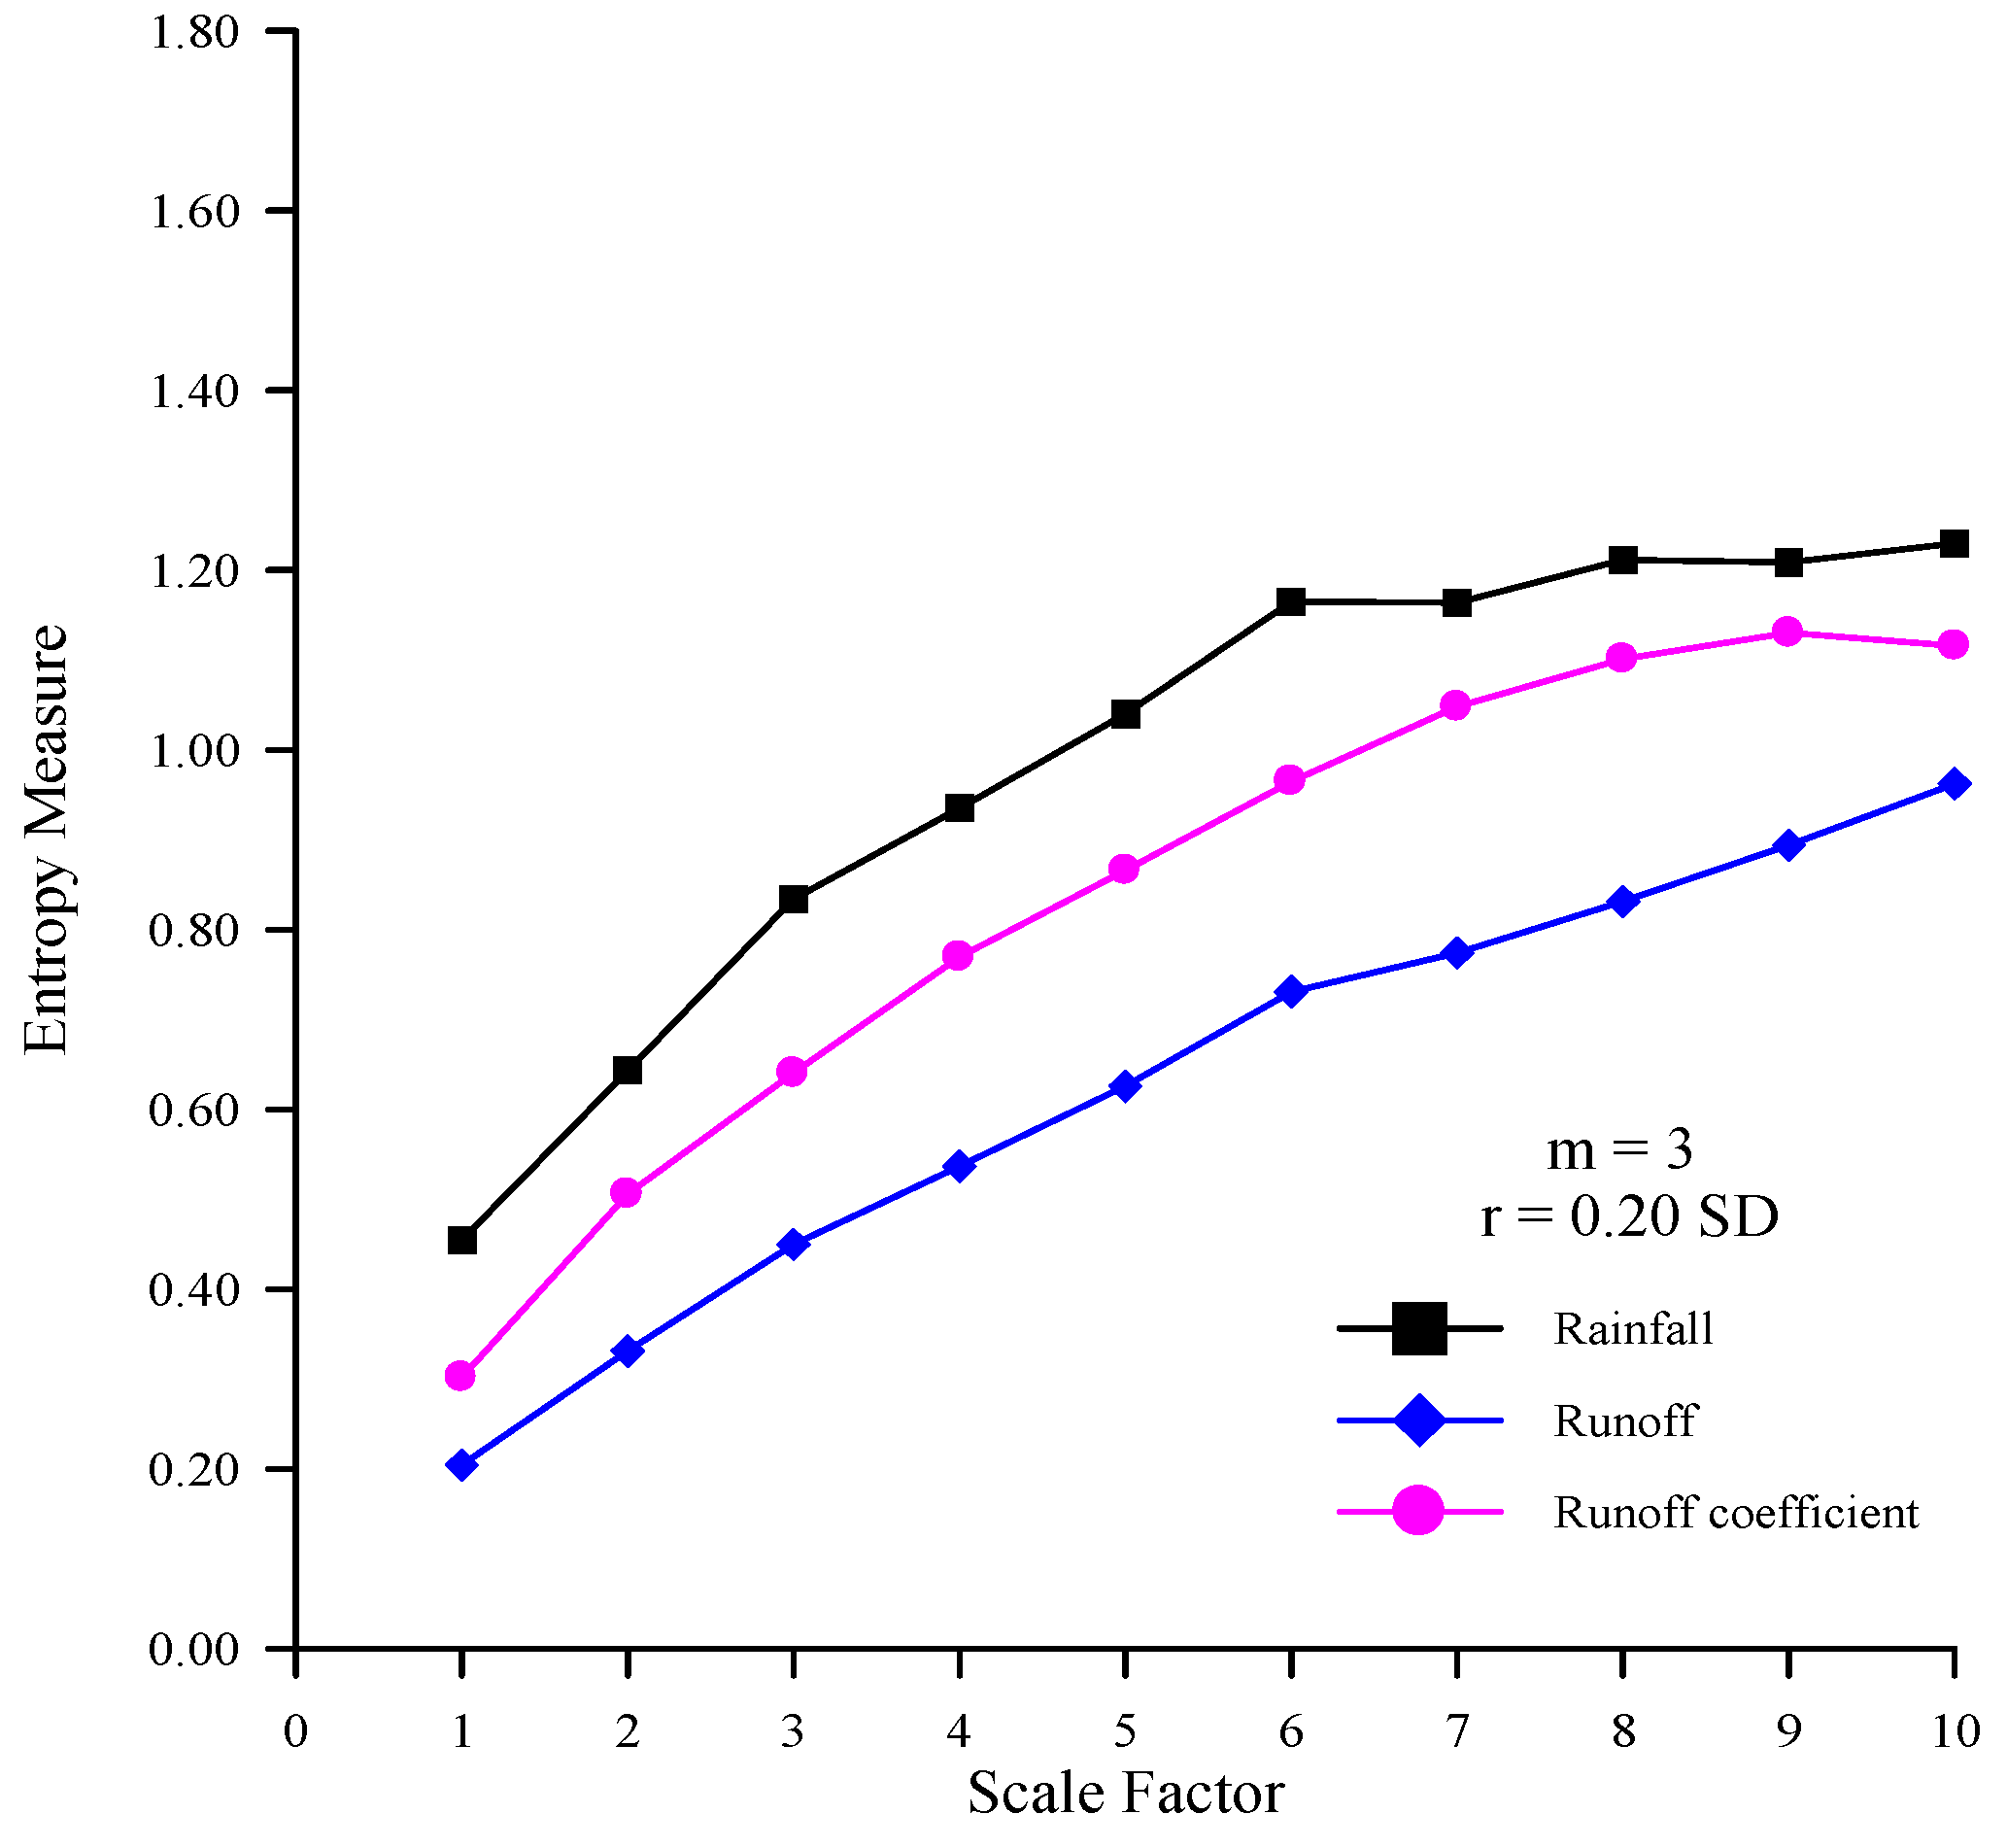
Table 3.
The average entropy measures of the rainfall time series for average rainfall and three stations obtained from different m and r values.
| Average Rainfall | Huo–Shao–Liao | Jui–Fang | Wu–Tu | |
|---|---|---|---|---|
| m = 2; r = 0.15SD | 1.22 | 1.18 | 1.13 | 1.16 |
| m = 2; r = 0.20SD | 1.08 | 1.02 | 1.03 | 1.03 |
| m = 2; r = 0.25SD | 0.97 | 0.89 | 0.94 | 0.92 |
| m = 3; r = 0.15SD | 1.04 | 1.05 | 0.97 | 1.01 |
| m = 3; r = 0.20SD | 0.99 | 0.95 | 0.93 | 0.96 |
| m = 3; r = 0.25SD | 0.91 | 0.85 | 0.87 | 0.87 |
Table 4.
The average entropy measures of the rainfall, runoff, and RC time series obtained from different m and r values.
| Rainfall | Runoff | RC | |
|---|---|---|---|
| m = 2; r = 0.15SD | 1.22 | 0.75 | 1.05 |
| m = 2; r = 0.20SD | 1.08 | 0.69 | 0.95 |
| m = 2; r = 0.25SD | 0.97 | 0.63 | 0.86 |
| m = 3; r = 0.15SD | 1.04 | 0.69 | 0.89 |
| m = 3; r = 0.20SD | 0.99 | 0.63 | 0.84 |
| m = 3; r = 0.25SD | 0.91 | 0.58 | 0.79 |
5. Conclusions
This study applies MSE, which has the ability to represent the complexity of signals, to the complexity analysis of rainfall, runoff, and RC time series. The results show that the entropy measures of rainfall, runoff, and RC time series increase when scale factors increase. All of the above time series have self-similarity and great complexity. In addition, the entropy measures of rainfall time series are higher than those of runoff time series at all scale factors. These results demonstrate that the rainfall time series is more complex than the runoff time series. The RC time series, which can be used to represent the rainfall-runoff relationship, are less complex than the rainfall time series and are more complex than runoff time series. These results also show that the rainfall time series with high complexity transform into the runoff time series with low complexity through rainfall-runoff processes.
The rainfall-runoff process in a river basin can be conceptualized as a single input-output system. The average rainfall obtained from several rainfall stations is usually considered as the input of hydrological systems. Results show that the entropy measures of these three rainfall stations are similar at various scale factors. That is, the complexities of these three rainfall stations in the same watershed are almost the same. In addition, the entropy measures of average rainfall are similar to those of the rainfall time series at all three stations at various scale factors. These results confirm that that average rainfall is a suitable input of the rainfall-runoff system.
To test the robustness of MSE results, the same analyses were performed by removing 25% of the time series. These results confirm that the MSE is not sensitive when removing part of the data. The influence of removing 25% of the time series on the MSE is small. The same analyses were also performed for different m and r values, with no change in results. These results confirm that MSE analysis is consistent for various values of m and r. That is, if one time series has higher entropy measures than another time series, the results will be the same for various values of m and r. In this study, the MSE values with m = 2 and r = 0.20 SD can be used to robustly perform the complexity analysis of the rainfall-runoff relationship.
The analysis of sample entropy with a single scale neglects the multiscale hidden characteristics of rainfall, runoff, and RC time series. This study indicates that the variation in the entropy measures of rainfall, runoff, and RC time series as scale factor increases can be obtained using MSE analysis. This study also proves that MSE supports a more complete complexity analysis than sample entropy using only one scale factor. Analyzing rainfall, runoff, and RC time series using MSE analysis also helps extract some of their hidden characteristics because of its capability of expressing complex time series.
In this study, the MSE has been applied to RC time series to investigate the rainfall-runoff relationship. As the MSE curve of RC time series shows that the entropy values increase with scale factors, RC time series contain information in various scales. That is, RC time series have great complexity and obvious self-similarity. Therefore, the MSE analysis of RC time series can be used to investigate changes in the complexity of rainfall-runoff processes due to human activities. In addition, the results provide a reference for selecting rainfall-runoff models that can deal with great complexity and take into account of obvious self-similarity.
Acknowledgments
The author would like to thank the National Science Council of the Republic of China, Taiwan for financially supporting this research under Contract No. NSC 100-2221-E-451-010.
References and Notes
- Jakeman, A.J.; Hornberger, G.M. How much complexity is warranted in a rainfall-runoff model? Water Resour. Res. 1993, 29, 2637–2649. [Google Scholar] [CrossRef]
- Xie, Z.M. Multiscale entropy method for analysis of complex geophysical signals (In Chinese). Technol. Earthq. Disas. Prev. 2009, 4, 380–385. [Google Scholar]
- Pincus, S.M. Approximate entropy as a complexity measure. Chaos 1995, 5, 110–117. [Google Scholar] [CrossRef] [PubMed]
- Richman, J.S.; Moorman, J.R. Physiological time-series analysis using approximate entropy and sample entropy. Am. J. Physiol. Heart Circ. Physiol. 2000, 278, H2039–H2049. [Google Scholar] [PubMed]
- Costa, M.; Goldberger, A.L.; Peng, C.K. Multiscale entropy analysis of complex physiologic time series. Phys. Rev. Lett. 2002, 89, 068102:1–068102:4. [Google Scholar] [CrossRef]
- Costa, M.; Goldberger, A.L.; Peng, C.K. Multiscale entropy to distinguish between physiologic and synthetic RR time series. Comput. Cardiolog. 2002, 29, 137–140. [Google Scholar]
- Costa, M.; Goldberger, A.L.; Peng, C.K. Multiscale entropy analysis of biological signals. Phys. Rev. E 2005, 71, 021906:1–021906:18. [Google Scholar] [CrossRef]
- Vaillancourt, D.E.; Sosnoff, J.J.; Newell, K.M. Age-related changes in complexity depend on task dynamics (Letter to the editor). J. Appl. Physiol. 2004, 97, 454–455. [Google Scholar] [CrossRef] [PubMed]
- Li, Z.; Zhang, Y.K. Multi-scale entropy analysis of Mississippi River flow. Stoch. Environ. Res. Risk Assess. 2008, 22, 507–512. [Google Scholar] [CrossRef]
- Chou, C.M. Wavelet-based multi-scale entropy analysis of complex rainfall time series. Entropy 2011, 13, 241–253. [Google Scholar] [CrossRef]
- Zhou, Y.; Zhang, Q.; Li, K.; Chen, X. Hydrological effects of water reservoirs on hydrological processes in the East River (China) basin: Complexity evaluations based on the multi-scale entropy analysis. Hydrolog. Process. 2012. [Google Scholar] [CrossRef]
- Cai, R.; Bian, C.H.; Ning, X.B. Multiscale entropy analysis of complex physiological time series (In Chinese). Beijing Biomed. Eng. 2007, 26, 543–547. [Google Scholar]
- Xu, X.K. Nonlinear Analysis and Modeling on Mixed Sea Wave (In Chinese). Ph.D. Thesis, Dalian Maritime Affairs University, Dalian, China, 2007. [Google Scholar]
© 2012 by the authors; licensee MDPI, Basel, Switzerland. This article is an open access article distributed under the terms and conditions of the Creative Commons Attribution license (http://creativecommons.org/licenses/by/3.0/).
Share and Cite
MDPI and ACS Style
Chou, C.-M. Applying Multiscale Entropy to the Complexity Analysis of Rainfall-Runoff Relationships. Entropy 2012, 14, 945-957. https://doi.org/10.3390/e14050945
AMA Style
Chou C-M. Applying Multiscale Entropy to the Complexity Analysis of Rainfall-Runoff Relationships. Entropy. 2012; 14(5):945-957. https://doi.org/10.3390/e14050945
Chicago/Turabian StyleChou, Chien-Ming. 2012. "Applying Multiscale Entropy to the Complexity Analysis of Rainfall-Runoff Relationships" Entropy 14, no. 5: 945-957. https://doi.org/10.3390/e14050945