Information Flow in Animal-Robot Interactions


Abstract
: The nonverbal transmission of information between social animals is a primary driving force behind their actions and, therefore, an important quantity to measure in animal behavior studies. Despite its key role in social behavior, the flow of information has only been inferred by correlating the actions of individuals with a simplifying assumption of linearity. In this paper, we leverage information-theoretic tools to relax this assumption. To demonstrate the feasibility of our approach, we focus on a robotics-based experimental paradigm, which affords consistent and controllable delivery of visual stimuli to zebrafish. Specifically, we use a robotic arm to maneuver a life-sized replica of a zebrafish in a predetermined trajectory as it interacts with a focal subject in a test tank. We track the fish and the replica through time and use the resulting trajectory data to measure the transfer entropy between the replica and the focal subject, which, in turn, is used to quantify one-directional information flow from the robot to the fish. In agreement with our expectations, we find that the information flow from the replica to the zebrafish is significantly more than the other way around. Notably, such information is specifically related to the response of the fish to the replica, whereby we observe that the information flow is reduced significantly if the motion of the replica is randomly delayed in a surrogate dataset. In addition, comparison with a control experiment, where the replica is replaced by a conspecific, shows that the information flow toward the focal fish is significantly more for a robotic than a live stimulus. These findings support the reliability of using transfer entropy as a measure of information flow, while providing indirect evidence for the efficacy of a robotics-based platform in animal behavioral studies.1. Introduction
Animals interact with a large number of sources in their environment through multiple senses, while adapting their behavior in response to a few important cues [1]. In social organisms that move in groups, it has been shown that the actions of a few nearest neighbors contribute largely to such cues [2]. In this respect, determining the flow of information between interacting individuals can reveal how they prioritize sensory modalities [3], infer the directionality of information flow [4–6], quantify leadership roles in animal groups [7], and determine the effectiveness of engineered stimuli in the laboratory studies [8–10]. These motivations to measure information flow are similar to those encountered in the study of networks of dynamical systems, where tools from information theory have been used to detect causal relationships [11–13], locate driving nodes [14], and quantify the strength of network connections [15].
Information flow between two systems is measured as the reduction in the uncertainty of one system given the knowledge of the other [16]. Here, uncertainty is quantified by the entropy rate of a stochastic process (or the entropy in the case of a random variable) [16,17]. Information flow measured in this sense is able to highlight nonlinear relationships between coupled systems over large interaction delays, a major advantage over correlation-based methods that assume linearity [18]. This has resulted in a multitude of applications of information-theoretic tools ranging from neuroscience [19], to structure health monitoring [20], financial time series analysis [21] and weather forecasting [22].
The application of information-theoretic measures to study animal behavior is not new [23–25]. In [23], the entropy of a dynamical system is used to study rat locomotor behavior; in [24], relative entropy is used to quantify behavior patterns in Pacific bluefin tuna after release; and in [25], entropy rates are used to quantify aphid behavior under different conditions. Across these studies, the advantage of information-theoretic quantities over traditional methods are cited in terms of independence from observational noise and sensitivity to higher order moments in parameter distributions. While these efforts focus on the movement of a single individual, similar opportunities exist in the study of social animals, whose behavior is driven by the complex exchange of information through multiple sensory cues [3,26]. Interestingly, entropy-based measures have been used as an efficient sensing approach in swarm navigation algorithms [27] and multi-robot systems [28].
Here, we utilize information-theoretic tools to study the social behavior of zebrafish [29]. Zebrafish is selected for its extensive use as an animal model [29–31], its prominent shoaling tendency [32] and its use of vision as a dominant sensing modality [30,33]. To offer a consistent and controllable visual stimulus to the focal subjects, we consider a robotics-based experimental paradigm, in which fish interact with a live fish and a life-sized replica maneuvered along predetermined trajectories using a robotic arm. We compute transfer entropy between the trajectories of the live fish and the replica to demonstrate the reliability of this approach in elucidating the direction of information flow between the focal subject and the replica.
The paper is organized as follows. In Section 2, we introduce the entropy of a random process and define transfer entropy to measure information flow between two dynamical systems. Section 3 presents materials and methods used to perform and analyze the animal behavior experiments. Results are presented in Section 4, followed by their discussion in Section 5.
2. Preliminaries on Information Flow Measurements
In information theory, the uncertainty of a random variable is measured by its Shannon entropy, which quantifies the expected value of the amount of information contained in the population [17]. Specifically, the Shannon entropy H(X) of a discrete random variable X that can take values in the set
 with a probability distribution PX(x), x ∈
, is defined as:
with a probability distribution PX(x), x ∈
, is defined as:
The logarithmic function in Equation (1) can have any base; for the selected base 2, H(X) is measured in bits. In terms of expectation, entropy can also be defined as the expected value of –log2 PX(x), where X is drawn according to PX(x), as H(x) = EX [–log2 PX(x)] [16]. Notably, Rényi [34] generalized this definition of information entropy by proposing a parametric family that includes Shannon entropy as a limiting case. For two random variables X and Y, with Y taking values in
 , the joint entropy, H(X, Y ), is [16]:
where PX,Y (x, y) is the joint distribution. The reduction in uncertainty of a random variable X given another random variable Y is quantified by the mutual information defined as [16]:
where H(X|Y ) is the conditional entropy that follows the chain rule H(X, Y) = H(X) + H(Y |X). Mutual information is nonnegative and symmetric with respect to its arguments, that is, I(X; Y) = I(Y ;X). If X and Y are independent, knowledge about one does not alter the uncertainty in the other, and therefore, mutual information between two independent random variables is zero.
To extend these ideas to dynamical systems, the above quantities are generalized to a stochastic process as follows. For a stochastic process X, considered as a sequence of random variables, X1, X2, …, the entropy rate is defined as [16,35]:
where the joint entropy, H(X1, …, Xn), for any finite n is computed on the basis of the joint probability distribution, P(x1, …, xn), where x1 ∈
 , …, xn ∈
 , similarly to Equation (2).
For two stochastic processes X and Y the mutual information rate is defined by [17]:
where I(n) = I(X1, …, Xn; Y1, …, Yn) is the mutual information computed over sequences of length n.
Unlike the mutual information rate, which is symmetric with respect to the two stochastic processes it is computed for, Schreiber proposed the use of another quantity, called transfer entropy, to measure directional information flow between two dynamical systems [36]. (A different, but related information-theoretic measure, called conditionalmutual information, was proposed by Paluš et al. [37].) Assuming that X and Y are first-order Markov processes, so that for example P(xn+1|xn, …, x1) = P(xn+1|xn) for any n, the transfer entropy quantifies the reduction in uncertainty of the state, Xn+1, given Xn and Yn. This quantity measures the flow of information from Y to X and is given by [21,36]:
where xn and yn take values in the sets
and
 , which are generally different for each n. The definition implies TEX→Y ≠ TEY →X. In this sense, given the direction of dominant information flow, the transfer entropy is associated with the cause-effect relationship between two dynamical systems [11,38].
In practice, information-theoretic measures, such as mutual information rate and transfer entropy, are difficult to compute with experimental data, which is often limited and noisy [39]. As a result, short-range correlations between noise in two processes may be interpreted as information flow undermining important long-range correlations [40]. One way to address this issue is to downsample the time series while ensuring that the Markovianity of the process is not lost [41]. Probability distributions can then be computed from the down-sampled data using binning methods, such as histograms [12] or a correlation integral [42]. To ensure that the experimental data is well approximated by a first-order Markov process, we calculate the sampling time interval t and the number of bins for computing histograms following the method described in [43]. In [43], expansion rates, instead of probabilities, are used to calculate mutual information rates and its bounds. The evolution of the coupled system of two one-dimensional processes X and Y is represented as points on a two-dimensional grid that is quantized into N square boxes each with side 1/N. The expansion rates, ek, k = 1, 2, are [43]:
where ÑC is the number of boxes on the two-dimensional grid occupied by points on the combined trajectory of X and Y, ε = 1/N, measures the maximum growth rate of nearby points in ε-square box i that have spread out after time t and quantifies the spread of a region enclosing such points. Accordingly, δi is the maximum distance between pairs of points in a box i and Δi(t) is the largest distance between the same pair of points after time t. Similarly, Ai(t) is the area occupied by points after time t that were initially in ε-square box i. Given a range of values of t and ε, the following constrained minimization problem is solved [43]:
where T = N/e1(t) represents the amount of time that is needed for the correlation of the combined trajectory of X and Y to decay to zero. The optimization reduces the correlation by ensuring that the number of boxes occupied in a time window of duration T is the same as that over the full trajectory. In other words, points on the two-dimensional grid occupy approximately the same number of boxes in T as for the full distribution.
3. Materials and Methods
3.1. Animals
Experiments were conducted with adult zebrafish, Danio rerio, bought from an online store (LiveAquaria, Rhinelander, WI, USA). At the time of the experiments, the fish were approximately 3 cm in body length and were maintained in 37.8-liter (10-gallon) housing tanks at a housing density of no more than 4 fish per liter. Housing conditions were maintained in accordance with the approved animal care protocol, with lighting at a 12 h dark/12 h light photoperiod [44], pH between 7 and 7.2 and the temperature set at 27 ± 1 °C.
3.2. Experimental Setup
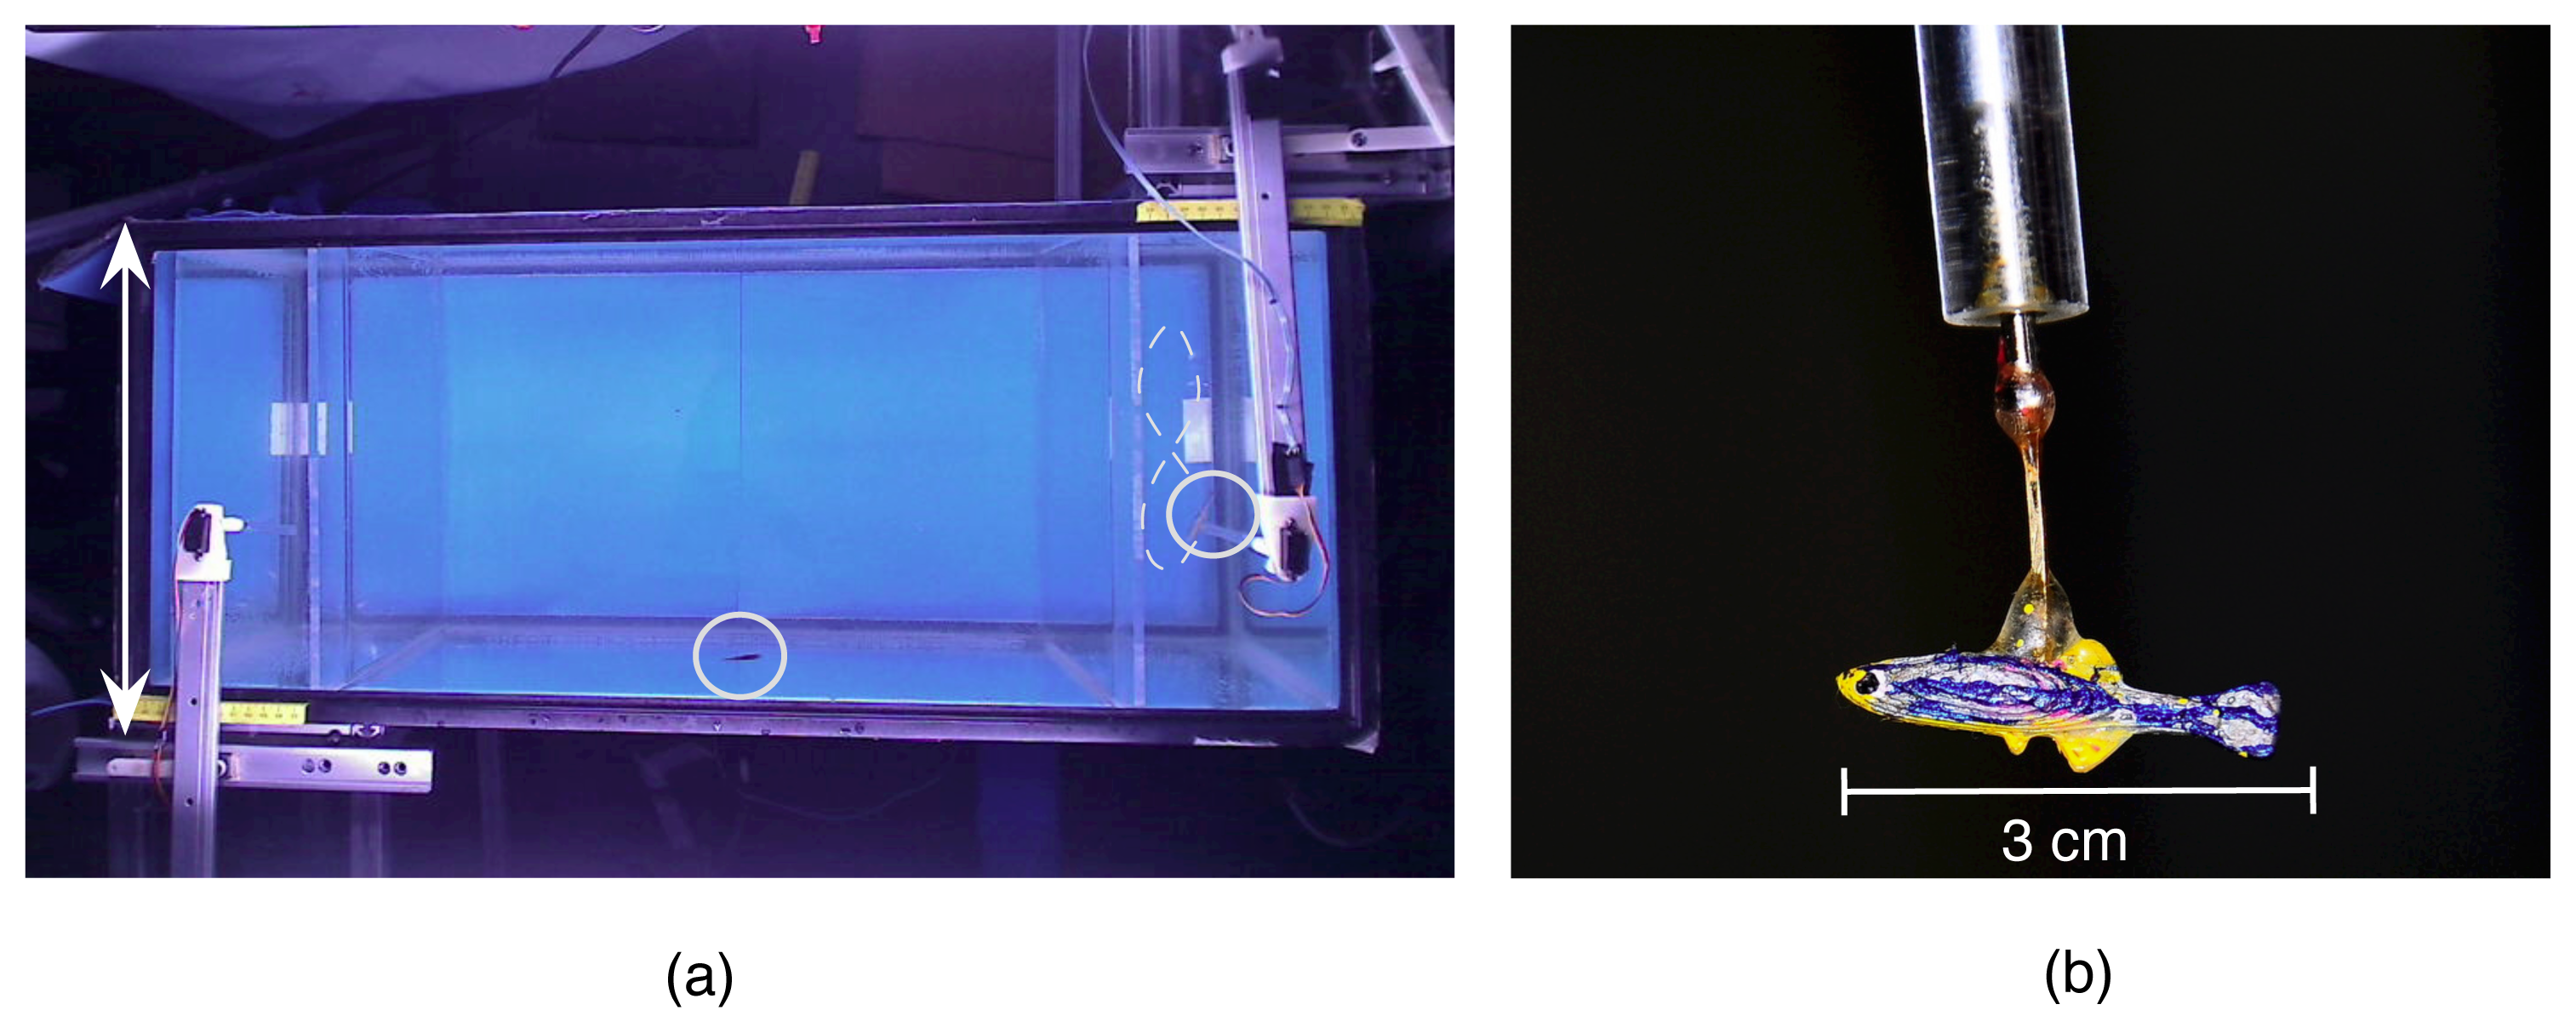
A classical two-choice experimental setup [45], comprising a 76 × 30 × 30 cm tank with two 10 × 30 × 30 cm stimulus compartments on either side of the tank and a 56 × 30 × 30 cm swimming compartment (Figure 1), was used to conduct the experiments. The tank was lit by two 25 W fluorescent lamps (All-Glass Aquarium, preheat aquarium lamp, U.K.) mounted above the longitudinal sides. An overhead view of the setup was recorded with a web camera (Logitech, Newark, CA, USA) mounted approximately 65 cm above the surface of the water. Experiments were filmed at 15 frames per second at a resolution of 800 × 600 pixels. A similar setup was used for other zebrafish-robot interactions experiments by our group [46–51].
Fish replicas, 3 cm in length, were fabricated using Acrylonitrile Butadiene Styrene (ABS) thermoplastic in a 3D prototyping machine (Dimension Elite, Stratasys Ltd., Eden Prairie, MN, USA). The replicas were designed in a Computer Aided Design (CAD) software (SolidWorks, SolidWorks Corp., Waltham, MA, USA) and featured dorsal, ventral and caudal fins. The replicas were painted with non-toxic pigments to match the zebrafish skin coloration and were mounted onto a movable platform with a transparent acrylic rod (Figure 1). The rod was attached to a custom-made robotic arm installed at the edge of the tank. The robotic arm consisted of three rigid links each driven by a separate servo-motor (Futaba Corporation of America, Schaumburg, IL, USA; and Hitec RCD USA Inc., Poway, CA, USA) [52]. The servo motors were controlled using a pre-programmed microcontroller (Arduino Uno, Arduino, Italy), so that the combined end-effector trajectory followed a periodic figure-eight pattern along the breadth of the tank at a speed of 5.7 ± 1.5 cm/s. The spatial trajectory was selected to achieve the large coverage of the stimulus region of the tank while being distinctly visible to the focal subject. A servo motor at the top end of the attachment rod was oscillated about the vertical axis at 3 Hz. This local oscillation gave an appearance of undulating movement to the replica in addition to spatial coverage and was selected tomatch previous values of tail-beat frequency in studies with bioinspired robots [46,49,51]. Two such robotic arms were installed on either side of the tank to provide a uniform visual background to the live subject with respect to the two choices available on the sides of the tank.
3.3. Experimental Procedure
A hypothesis-driven biological experiment in animal behavior typically involves conducting experimental trials by changing independent design parameters while observing specific behaviors [53]. The null hypothesis, namely that no change in behavior will be detected, is rejected using a statistical test when the alternate hypothesis is true with a high probability, which is typically 95% [54]. The number of trials for each value of the independent design parameter must be selected to avoid Type II errors, that is, a failure to reject a false null hypothesis [54]. Here, we test two hypotheses: first, that the directional information transfer will be dominant from the replica to the live fish; and second, that the information flow from the replica to the live fish is more than if the replica were replaced by a live stimulus.
To investigate the transfer of information between a live fish and the moving replica, an experimental condition was conducted where a single zebrafish was filmed as the replica was maneuvered on one of the tank sides (the experiments performed in this study were approved by the Animal Welfare Oversight Committee (AWOC) of the Polytechnic Institute of New York University, protocol AWOC-2013-103). To compare this with information flow between two live animals, a control condition was tested where a live conspecific was released in the stimulus area. To achieve statistical power, ten trials were conducted for each of the two conditions with a single experimentally naive fish for each trial; experimentally naive fish were observed for each trial to avoid pseudo replications [54]. Thus, a total of thirty subjects (twenty focal fish and ten stimulus fish) were considered in this study. In accordance with an established protocol that ensures that zebrafish are acclimatized to the experimental tank [55], fish were transferred from the holding tank using a hand net and were habituated to the experimental tank for ten minutes during which the replica, if present, was moving. Post-habituation, the fish were filmed for five minutes. Observations made during these five minutes were used in the analysis. The side on which the stimuli were presented was balanced across trials to avoid a possible left-right bias in the results. Note that in all the tests with the replica, the replica was always started from the same relative location in the stimulus area at the initial time of the recording to ensure the repeatability of the stimulus across trials.
3.4. Data Assimilation and Statistical Analysis
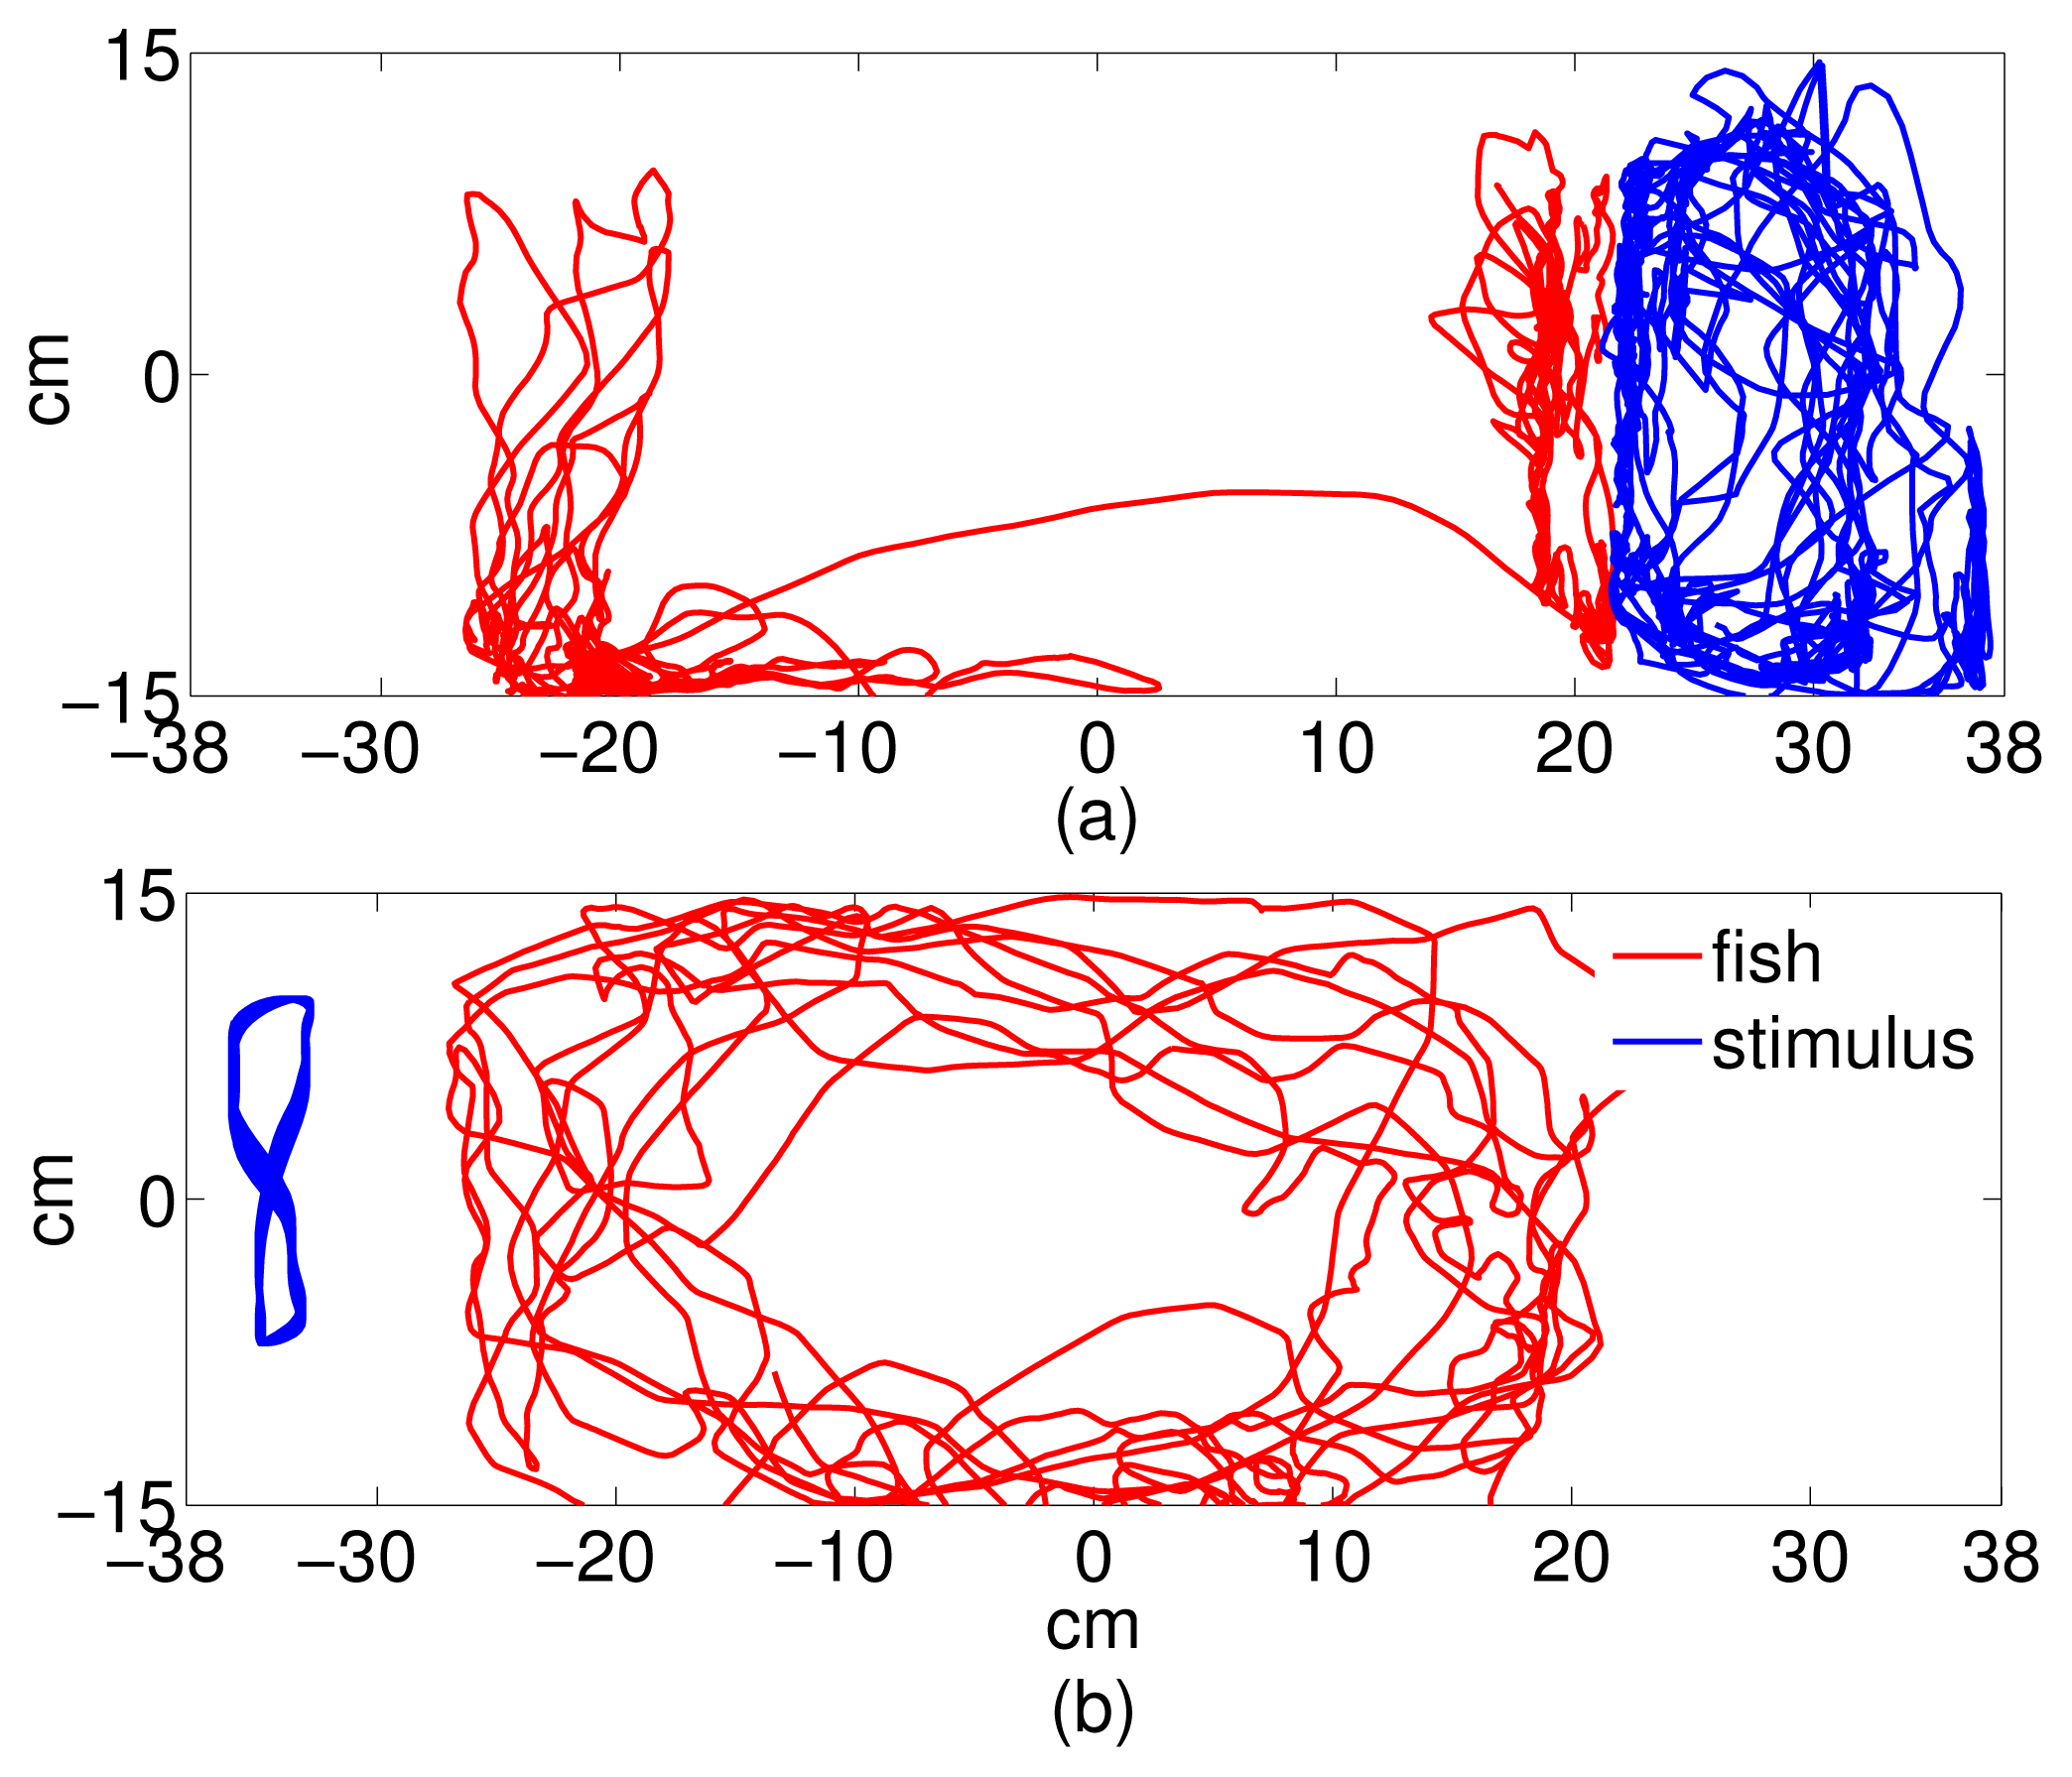
Video data was post-processed using a target-tracking system that output the trajectories of the focal fish and the stimulus (conspecific or replica) in the tank frame. The tracking system, described in detail in [56], used a Kalman filter to track the fish centroid through the five-minute experimental time. Fish tracks were verified and repaired in a MATLAB® graphical user interface (GUI) for analysis. The trajectory data was used to compute average speed along the tank-wide direction and validate the time series sampling strategy. To reconstruct the replica trajectory, the same was tracked manually using the GUI for the first ten seconds of each trial. The tank-wide component of the ten-second trajectory was then fit using the MATLAB nlinfit routine onto a four-parameter sinusoidal function of the form f(k) = B sin(ωk + φ) + C, k being the time in seconds. Instead, the orthogonal tank-long component was fit using least-squares estimation onto a twentieth order Fourier series expansion [57]. The full periodic trajectory was then extrapolated for the remaining of the trial and projected back onto the video for visual verification. Figure 2 shows sample trajectories from each experimental condition. Referring to Section 2, we use the tank-wide position of the fish (Figure 1) and the stimulus (replica or conspecific) as the dynamic variable for computing information flow.
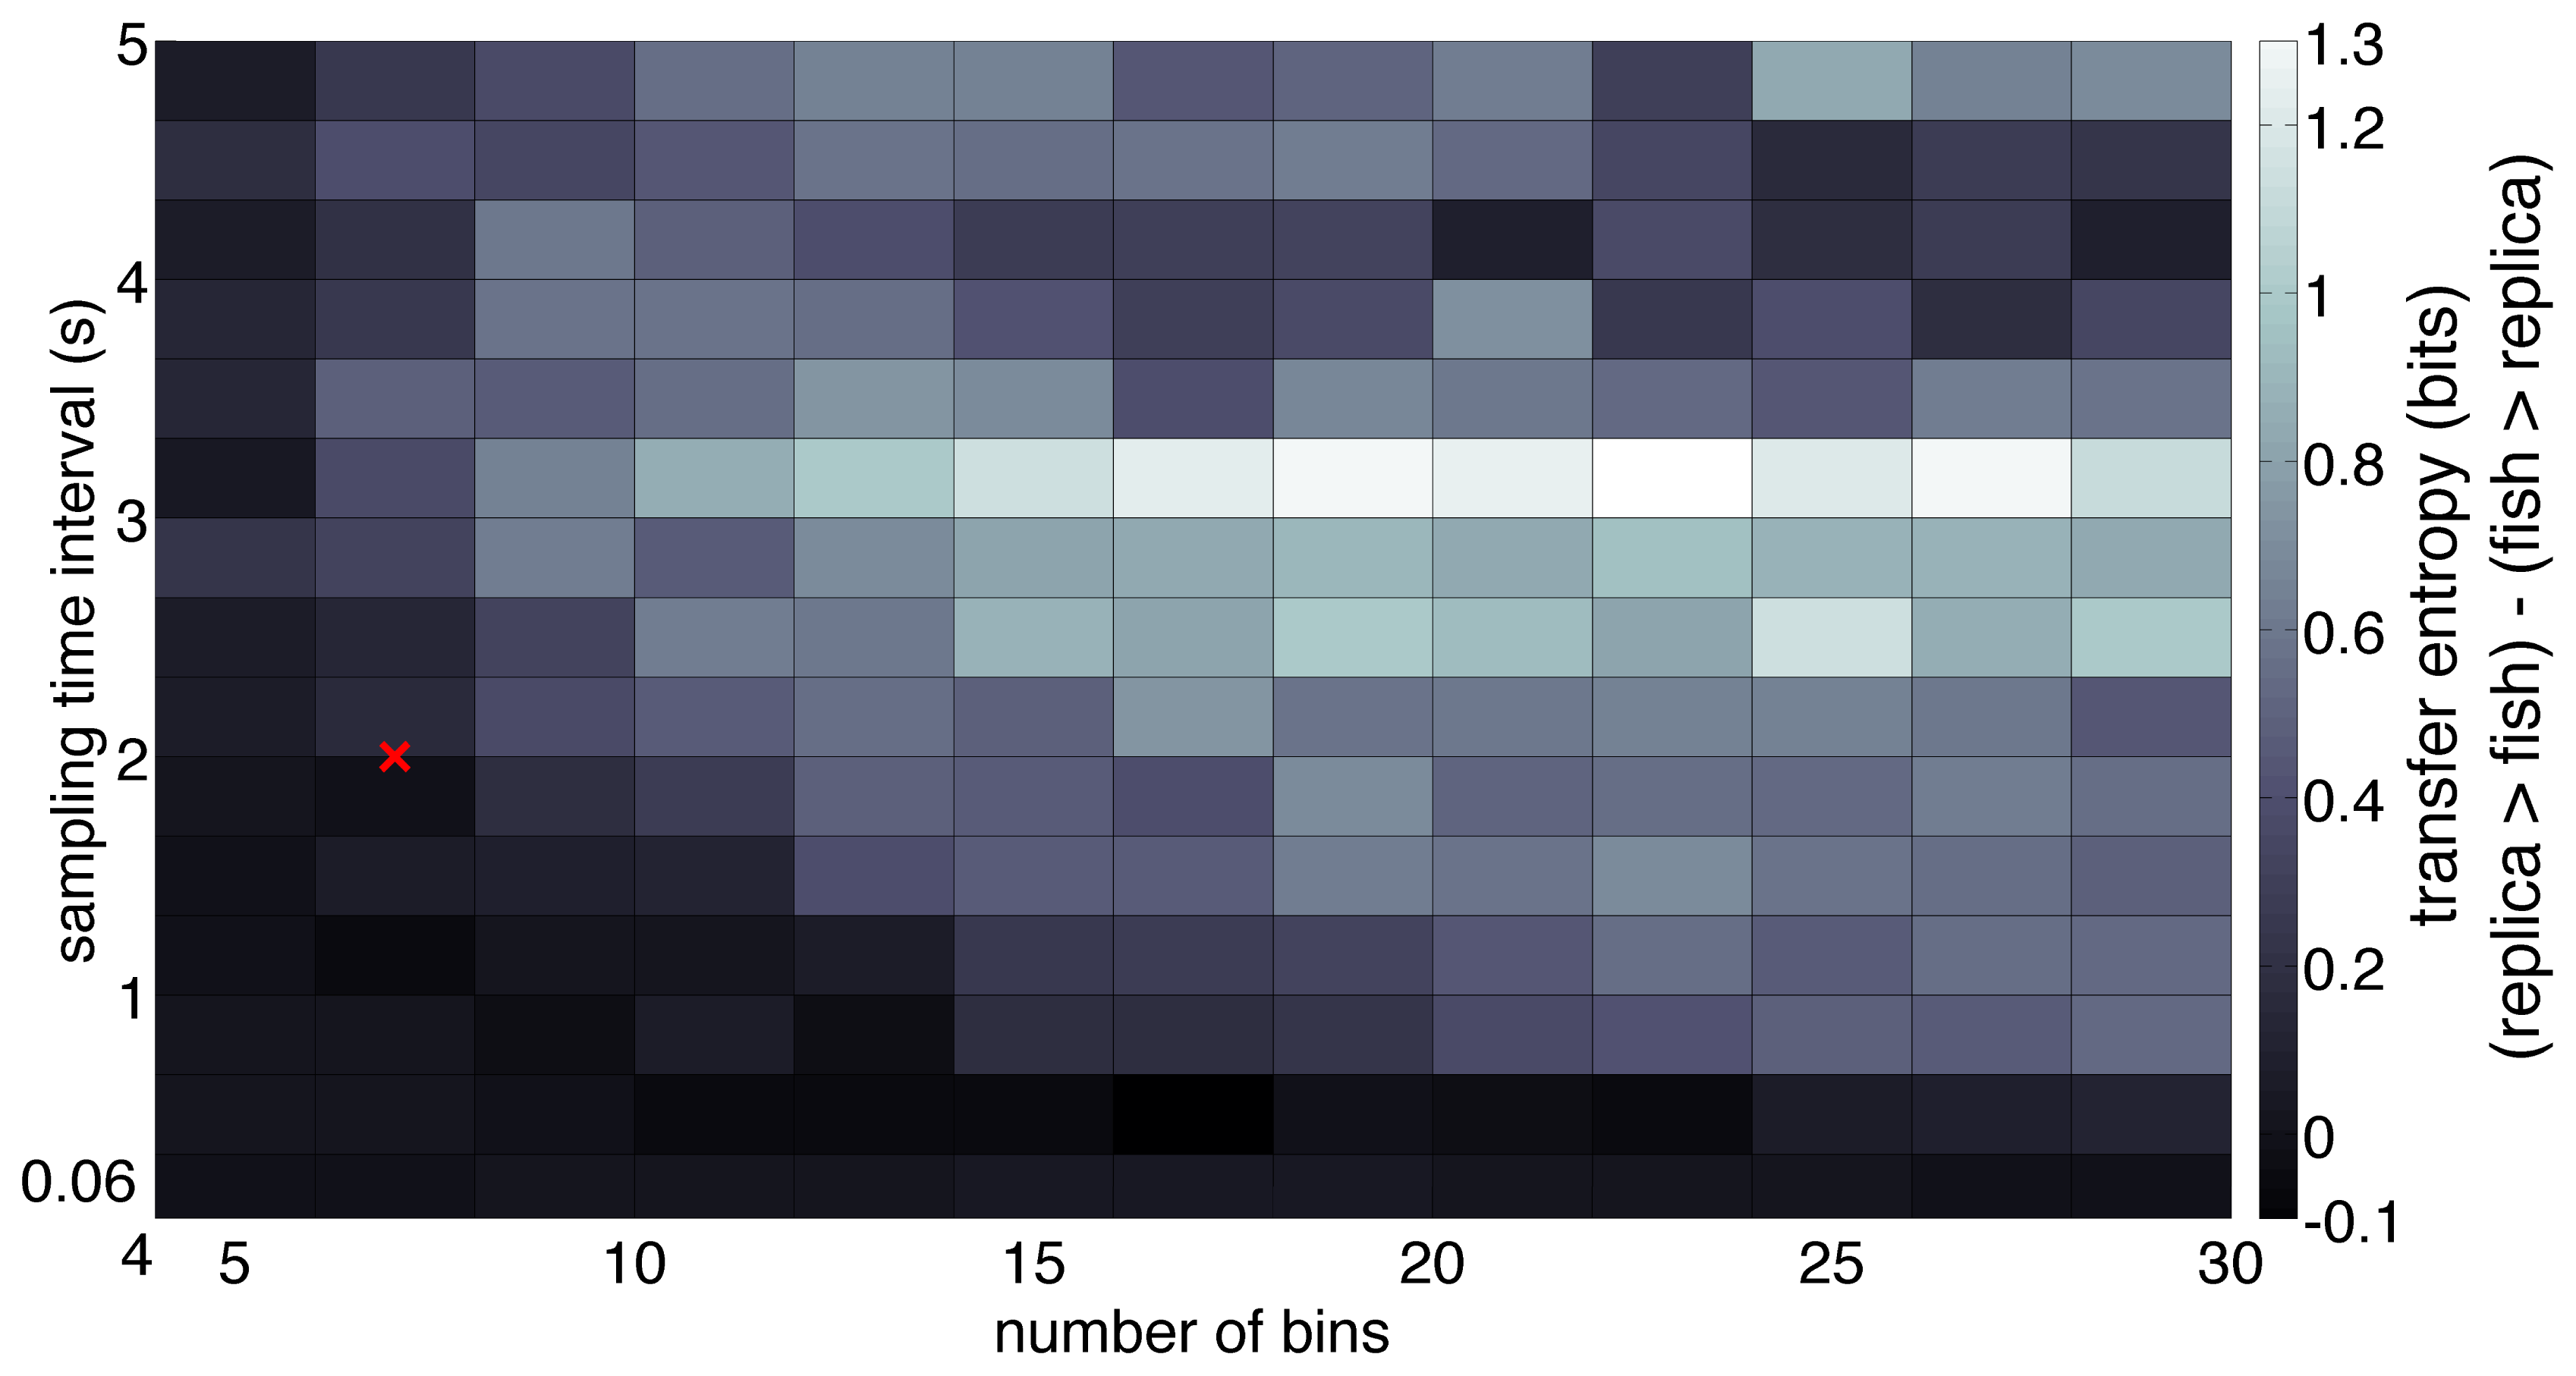
When working with experimentally generated time series, noise and limited data may undermine the application of theoretical approaches [58]. Coarse-grained treatments of the experimental data address these issues; however, their incorrect implementation could lead to the possibility of loosing important information [41]. Following the method detailed in Section 2, a sampling interval and a number of bins were computed for all trials to obtain common average values to be used for the entire dataset [43]. Thus, we set t = 2 seconds for the sampling interval and N = 7 for the number of bins. Notably, the 2-second sampling interval represents the average time during which the correlation of the trajectory decays to zero within a square box of size equal to the bin width. The facts that fish speed is generally on the order of a few body lengths per second [59] and that the size of each bin is on the order of one fish body length guarantee that a time interval of 2 seconds suffices for the fish to reach a different bin in the given time step. To ensure that these values are representative of the directionality of the dominant information transfer [41], we computed transfer entropy over a range of values of t ∈ [0.06, 5]s and N ∈ [4, 30] values for a random trial. Data from stimulus and focal fish trajectory was normalized so that the values lie between −1 and 1. The normalized data was, in turn, used to build the joint probability distributions using histograms. Transfer entropy was computed for each direction (fish → stimulus, stimulus → fish), where fish is the focal subject, and stimulus can be the replica or the conspecific. Figure 3 shows the tank-wide position for the sample trajectories for a single (fish ↔ fish) and (fish ↔ replica) trials, respectively.
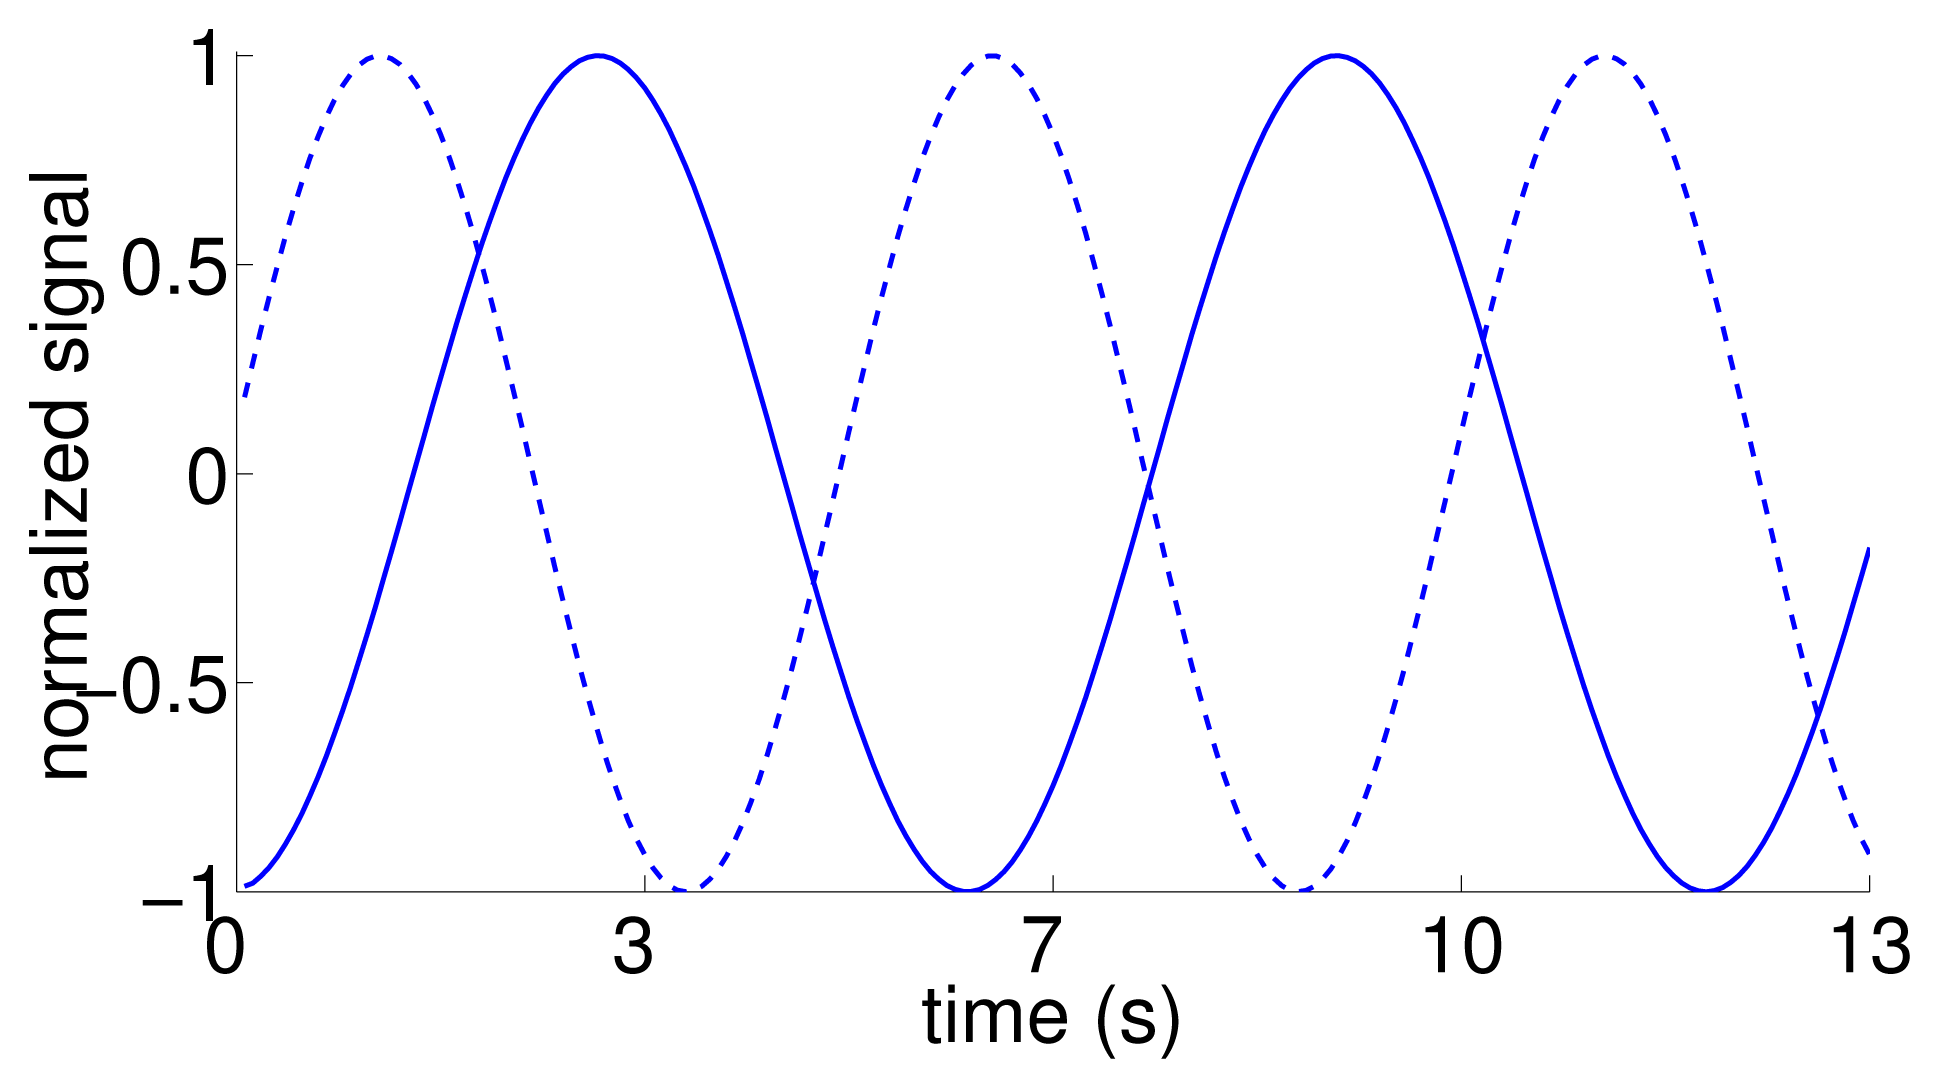
As an additional test to verify the inference about the directionality of the information flow, we considered an artificial dataset, for which we generated surrogate replica trajectories using the time trace of the position of the replica in the tank-wide direction as the reference. In particular, we simulated artificial motions as sinusoidal functions with the same frequency of oscillation, and a random phase difference (drawn from a uniform distribution sampled from [0, π]). Thus, the surrogate data shares the same behavior of the replica motion, while being dissimilar from that for most times (Figure 4). A total of 10 surrogate trajectories with phase delays of 1.32 ± 0.93 rad were generated and used in the statistical analysis. To each of these trajectories, we randomly associated the response of a focal fish in the condition with the replica.
Information flow was compared within each condition using one-way analysis of variance (ANOVA) [54] with the direction of flow as the independent parameter and the transfer entropy as the dependent parameter. Trials with abnormal fish behavior, such as excessive freezing [60], were discarded. This resulted in 9 trials for the control condition and 10 for the one with replica. The ANOVA comparison [54] reports the probability of the null hypothesis, namely that the means of the values are equal. If this probability is less than 5% (p < 0.05), we assume that the null hypothesis is rejected and that the means are significantly different. The output of a one-way ANOVA comparison consists of the probability p of accepting the null hypothesis and the F-test statistics reported in the form, Fdf1,df2, where df1, df2 are the degrees of freedom between groups and between single observations, respectively. The value of the F-test statistic is computed as F = between-group variability/within-group variability, where variability is computed as the variance between and within groups [54]. A large value of the F-test statistic corresponds to a higher between-group variability than within-group variability, implying a difference in populations. Significance is evaluated by comparing with an F-distribution whose shape depends on the number of degrees of freedom [54]. Information flow in a given direction is compared between conditions using one-way ANOVA, with the condition as the independent parameter and the transfer entropy for that direction as the dependent parameter. Similarly, one-way ANOVA was used to compare information flow from the surrogate trajectories to the fish with the information flow from the replica to the fish.
4. Results
Figure 5 shows the experimental results of this study. We found that the transfer entropy from the focal fish to the replica TEfish→replica was significantly less than from the replica to the fish TEreplica→fish (p = 0.007, F1,9 = 9.127). Differently, transfer entropy from the focal fish to the conspecific TEfish→fish was not significantly different between directions (p = 0.193, F1,8 = 1.845). Between conditions, the transfer entropy from the replica to the focal fish was significantly more than from the conspecific to the fish (p = 0.024, F1,17 = 6.05; Figure 5). With respect to the surrogate dataset, we also found that the transfer entropy from the simulated replica to the fish was significantly less than the transfer entropy from the replica to the focal subject (TEsurrogate→fish = 0.25 ± 0.08 bits; p < 0.001, F1,17 = 40.99). Finally, transfer entropy from the focal fish to the conspecific and transfer entropy from the focal fish to the replica were not significantly different (p = 0.086, F1,17 = 3.326).
To evaluate the sensitivity of the dominant flow of information with respect to variations in the selection of the parameters t and N, we considered the effect of varying them in the analysis of the single trial displayed in Figure 3b. Transfer entropy over a range of t values shows that the dominant direction of information flow, measured as the difference between the transfer entropies in each direction (TEreplica→fish − TEfish→replica), is preserved for a majority of the range. In particular, the difference in transfer entropy was positive for most values of the sampling time interval more than 0.5 s (Figure 6).
5. Discussion
Our results show that the transfer entropy can be used to measure information flow in zebrafish. In agreement with our expectations, we found that when a live fish interacts with a replica moving along predetermined trajectories, the dominant flow of information is from the replica to the fish. The comparison of information flow between the control and the experimental condition shows that the life-sized replica of a real zebrafish maneuvered using a robotic arm influences the motion of the focal fish more than a conspecific.
While determining the direction of information flow, we note that a lower value of the sampling interval is typically recommended in the literature on unidirectionally coupled oscillators modeled as a second-order autoregression process [41]. In this case, where the full system may be represented as a high-dimensional state vector with the past two states in time, a foreseeable problem associated with low temporal resolution is the loss of observability [41]. In contrast, the relatively large value of sampling interval used here can be justified in terms of the typical fish speed, which is on the order of a few body lengths [59], and thus allows for a change in position from one bin to another in a single time step, preserving the process’ Markovianity [41]. We find that although the dominant direction of information flow stays replica → fish for the most part, the direction is reversed when the sampling time interval is less than 0.5 s. A possible reason for this reversal may be the correlation between the noise in the fish and the replica trajectories [39]. In particular, correlations between the movement of the replica, which maneuvers tank-wide at a higher oscillation than the focal fish, and the noise from the fish trajectory may be detected at this temporal resolution.
The validation of the transfer entropy as a measure of directional information is offered by the significant difference between the information flow from the replica to the zebrafish and the information flow computed the other way around. Combined with the fact that no such significance was found when the stimulus is a conspecific, this suggests that transfer entropy is a valid measure of information flow. In particular, the result that the replica influenced the focal subject more than the other way around was expected, since the replica was controlled independently. The conspecific, on the other hand, was always visually aware of the focal subject and, therefore, likely to be influenced by it. In addition, transfer entropy from the replica to the focal subject was significantly reduced in a surrogate dataset in which the replica was artificially delayed, confirming the validity of the directional information flow between the replica and the live subject. At the same time, the non-zero information flow from the live subject to the replica is misleading, but not unexpected. This is because of the generality of the method that exhaustively looks at all possible combinations for the reduction in the uncertainty in the dynamics of one system given the knowledge of the other [36]. It is possible that within the confined space in which we observed the replica and the focal fish, some nonlinear relationships exist that can relate movements of the replica to those of the focal subject. At the same time, the significantly higher transfer of information from the replica to the fish is strong evidence in support of the use of this method to unravel information flow in zebrafish social response.
Between conditions, the amount of information flow from the stimulus to the focal subject was also significantly more when the stimulus was a replica. This is direct evidence in support of the efficacy of a robotics-based solution in animal behavior studies. For example, often cited benefits of using robotics in experimental paradigms addressing functional and dysfunctional processes are the reliability and repeatability of the animal response to the robot [47,48]. In this respect, the marked one-directional influence of the replica on the focal fish indicates that consistent responses may be elicited more easily with a robot than a live stimulus. Although vision was the primary mode of sensing in this experiment, it is conceivable that a similar finding could be garnered with animals that utilize other cues, such as chemical [61], acoustic [62] and hydrodynamic [63], to sense their environment.
6. Conclusions
An important question in the study of the behavior of social species is “who follows whom?” [64], which can be answered by quantifying the direction of information flow between individuals [11]. In this paper, we validated for the first time the use of transfer entropy as an information-theoretic measure to compute directional information flow in social behavior. To test the method in a scenario in which information flow is known, we designed an experimental paradigm based on the integration of a robotics-based platform in a dichotomous preference test. Ongoing work includes the classification of engineered stimuli using this method and the assessment of information flow in larger animal groups.
Acknowledgments
This research was supported by the National Science Foundation Civil, Mechanical and Manufacturing Innovation (CMMI) Division, under grant numbers CMMI-0745753 and CMMI-1129820. The authors would like to thank Paul Phamduy for designing and fabricating the robotic arm, Farihah Begum for assistance in conducting the experiments and the anonymous reviewers for their constructive feedback that has helped improve the work and its presentation.
Conflicts of Interest
The authors declare no conflicts of interest.
References
- Dall, S.R.; Giraldeau, L.A.; Olsson, O.; McNamara, J.M.; Stephens, D.W. Information and its use by animals in evolutionary ecology. Trends Ecol. Evol 2005, 20, 187–193. [Google Scholar]
- Ballerini, M.; Cabibbo, N.; Candelier, R.; Cavagna, A.; Cisbani, E.; Giardina, I.; Lecomte, V.; Orlandi, A.; Parisi, G.; Procaccini, A.; et al. Interaction ruling animal collective behavior depends on topological rather than metric distance: Evidence from a field study. Proc. Natl. Acad. Sci. USA 2008, 105, 1232–1237. [Google Scholar]
- Partridge, B.L.; Pitcher, T.J. The sensory basis of fish schools: Relative roles of lateral line and vision. J. Comp. Physiol. A: Neuroethol. Sens. Neural Behav. Physiol 1980, 135, 315–325. [Google Scholar]
- Eaton, R.; Emberley, D. How stimulus direction determines the trajectory of the Mauthner-initiated escape response in a teleost fish. J. Exp. Biol 1991, 161, 469. [Google Scholar]
- Gallup, A.C.; Chong, A.; Couzin, I.D. The directional flow of visual information transfer between pedestrians. Biol. Lett 2012, 8, 520–522. [Google Scholar]
- Miller, N.; Garnier, S.; Hartnett, A.T.; Couzin, I.D. Both information and social cohesion determine collective decisions in animal groups. Proc. Natl. Acad. Sci. USA 2013, 110, 5263–5268. [Google Scholar]
- Couzin, I.D.; Krause, J.; Franks, N.R.; Levin, S.A. Effective leadership and decision-making in animal groups on the move. Nature 2005, 433, 513–516. [Google Scholar]
- Krause, J.; Winfield, A.F.T.; Deneubourg, J. Interactive robots in experimental biology. Trends Ecol. Evol 2011, 26, 369–375. [Google Scholar]
- Woo, K.L.; Rieucau, G. From dummies to animations: A review of computer-animated stimuli used in animal behavior studies. Behav. Ecol. Sociobiol 2011, 65, 1671–1685. [Google Scholar]
- Mitri, S.; Wischmann, S.; Floreano, D.; Keller, L. Using robots to understand social behaviour. Biol. Rev 2013, 88, 31–39. [Google Scholar]
- Hlavácková-Schindler, K.; Paluš, M.; Vejmelka, M.; Bhattacharya, J. Causality detection based on information-theoretic approaches in time series analysis. Phys. Rep 2007, 441, 1–46. [Google Scholar]
- Vejmelka, M.; Paluš, M. Inferring the directionality of coupling with conditional mutual information. Phys. Rev. E 2008, 77, 026214. [Google Scholar]
- Sun, J.; Bollt, E.M. Causation entropy identifies indirect influences, dominance of neighbors and anticipatory couplings. Phys. D: Nonlinear Phenom 2014, 267, 49–57. [Google Scholar]
- David, O.; Guillemain, I.; Saillet, S.; Reyt, S.; Deransart, C.; Segebarth, C.; Depaulis, A. Identifying neural drivers with functional MRI: An electrophysiological validation. PLoS Biol 2008, 6, 2683–2697. [Google Scholar]
- Paluš, M.; Hartman, D.; Hlinka, J.; Vejmelka, M. Discerning connectivity from dynamics in climate networks. Nonlinear Process. Geophys 2011, 18, 751–763. [Google Scholar]
- Cover, T.M.; Thomas, J.A. Elements of Information Theory; John Wiley & Sons: New York, NY, USA, 1991. [Google Scholar]
- Shannon, C.E. A mathematical theory of communication. Bell Syst. Tech. J 1948, 27, 379–423. [Google Scholar]
- Li, W. Mutual information functions versus correlation functions. J. Stat. Phys 1990, 60, 823–837. [Google Scholar]
- Vicente, R.; Wibral, M.; Lindner, M.; Pipa, G. Transfer entropy—A model-free measure of effective connectivity for the neurosciences. J. Comput. Neurosci 2011, 30, 45–67. [Google Scholar]
- Nichols, J.; Seaver, M.; Trickey, S.; Todd, M.; Olson, C.; Overbey, L. Detecting nonlinearity in structural systems using the transfer entropy. Phys. Rev. E 2005, 72, 046217. [Google Scholar]
- Kantz, H.; Schreiber, T. Nonlinear Time Series Analysis; Cambridge University Press: Cambridge, UK, 2004. [Google Scholar]
- Kleeman, R. Information theory and dynamical system predictability. Entropy 2011, 13, 612–649. [Google Scholar]
- Paulus, M.P.; Geyer, M.A.; Gold, L.H.; Mandell, A.J. Application of entropy measures derived from the ergodic theory of dynamical systems to rat locomotor behavior. Proc. Natl. Acad. Sci. USA 1990, 87, 723–727. [Google Scholar]
- Kadota, M.; White, E.J.; Torisawa, S.; Komeyama, K.; Takagi, T. Employing relative entropy techniques for assessing modifications in animal behavior. PLoS One 2011, 6, e28241. [Google Scholar]
- Sudderth, E.A.; Sudderth, E.B. Quantifying aphid behavioral responses to environmental change. Entomol. Exp. Appl 2013, 150, 1–12. [Google Scholar]
- Herbert-Read, J.E.; Perna, A.; Mann, R.P.; Schaerf, T.M.; Sumpter, D.J.T.; Ward, A.J.W. Inferring the rules of interaction of shoaling fish. Proc. Natl. Acad. Sci. USA 2011, 108, 18726–18731. [Google Scholar]
- Choi, J.; Lee, J.; Oh, S. Biologically-inspired navigation strategies for swarm intelligence using spatial Gaussian processes. Proceedings of the International Federation of Automatic Control, Seoul, Korea, 6–11 July 2008; pp. 593–598.
- Kim, C.Y.; Song, D.; Xu, Y.; Yi, J. Localization of multiple unknown transient radio sources using multiple paired mobile robots with limited sensing ranges. Proceedings of the IEEE International Conference on Robotics and Automation (ICRA), Shanghai, China, 9–13 May 2011; pp. 5167–5172.
- Lieschke, G.J.; Currie, P.D. Animal models of human disease: Zebrafish swim into view. Nat. Rev. Genetics 2007, 8, 353–367. [Google Scholar]
- Miklósi, A.; Andrew, R.J. The zebrafish as a model for behavioral studies. Zebrafish 2006, 3, 227–234. [Google Scholar]
- Kalueff, A.V.; Steward, A.M.; Gerlai, R. Zebrafish as an emerging model for studying complex brain disorders. Trends Pharmacol. Sci 2013, 35, 63–75. [Google Scholar]
- Miller, N.; Gerlai, R. Quantification of shoaling behaviour in zebrafish (Danio rerio). Behav. Brain Res 2007, 184, 157–166. [Google Scholar]
- Saverino, C.; Gerlai, R. The social zebrafish: Behavioral responses to conspecific, heterospecific, and computer animated fish. Behav. Brain Res 2008, 191, 77–87. [Google Scholar]
- Rényi, A. On measures of entropy and information. Proceedings of the Fourth Berkeley Symposium on Mathematical Statistics and Probability, Berkeley, CA, USA, 20 June–30 July 1960; pp. 547–561.
- Grassberger, P.; Procaccia, I. Estimation of the Kolmogorov entropy from a chaotic signal. Phys. Rev. A 1983. [Google Scholar]
- Schreiber, T. Measuring information transfer. Phys. Rev. Lett 2000, 85, 461–464. [Google Scholar]
- Paluš, M.; Komárek, V.; Hrnčí, Z.; Štěrbová, K. Synchronization as adjustment of information rates: Detection from bivariate time series. Phys. Rev. E 2001, 63, 046211. [Google Scholar]
- Granger, C. Testing for causality: A personal viewpoint. J. Econ. Dyn. Control 1980, 2, 329–352. [Google Scholar]
- Paluš, M.; Vejmelka, M. Directionality of coupling from bivariate time series: How to avoid false causalities and missed connections. Phys. Rev. E 2007, 75, 056211. [Google Scholar]
- Costa, M.; Goldberger, A.; Peng, C.K. Multiscale entropy analysis of complex physiologic time series. Phys. Rev. Lett 2002, 89, 068102. [Google Scholar]
- Smirnov, D.A. Spurious causalities with transfer entropy. Phys. Rev. E 2013, 87, 042917. [Google Scholar]
- Grassberger, P.; Procaccia, I. Characterization of Strange Attractors. Phys. Rev. Lett 1983, 50, 346–349. [Google Scholar]
- Baptista, M.S.; Rubinger, R.M.; Viana, E.R.; Sartorelli, J.C.; Parlitz, U.; Grebogi, C. Mutual information rate and bounds for it. PLoS One 2012, 7, e46745. [Google Scholar]
- Cahill, G. Clock mechanisms in zebrafish. Cell Tissue Res 2002, 309, 27–34. [Google Scholar]
- Blaser, R.; Gerlai, R. Behavioral phenotyping in zebrafish: Comparison of three behavioral quantification methods. Behav. Res. Methods 2006, 38, 456–469. [Google Scholar]
- Kopman, V.; Laut, J.; Polverino, G.; Porfiri, M. Closed-loop control of zebrafish response using a bioinspired robotic-fish in a preference test. J. R. Soc. Interface 10, 0540.
- Cianca, V.; Bartolini, T.; Porfiri, M.; Macrì, S. A robotics-based behavioral paradigm to measure anxiety-related responses in zebrafish. PLoS One 2013, 8, e69661. [Google Scholar]
- Spinello, C.; Macrì, S.; Porfiri, M. Acute ethanol administration affects zebrafish preference for a biologically-inspired robot. Alcohol 2013, 47, 391–398. [Google Scholar]
- Polverino, G.; Abaid, N.; Kopman, V.; Macrì, S.; Porfiri, M. Zebrafish response to robotic fish: Preference experiments on isolated individuals and small shoals. Bioinspiration Biomim 2012, 7, 036019. [Google Scholar]
- Polverino, G.; Porfiri, M. Zebrafish (Danio rerio) behavioural response to bioinspired robotic fish and mosquitofish (Gambusia affinis). Bioinspiration Biomim 2013, 8, 044001. [Google Scholar]
- Abaid, N.; Bartolini, T.; Macrì, S.; Porfiri, M. Zebrafish responds differentially to a robotic fish of varying aspect ratio, tail beat frequency, noise, and color. Behav. Brain Res 2012, 233, 545–553. [Google Scholar]
- Phamduy, P.; Polverino, G.; Fuller, R.; Porfiri, M. Fish and robot dancing together: Bluefin killifish respond differently to the courtship of a robot with varying colour morphs Unpublished work. 2014.
- Martin, P.; Bateson, P.P.G. Measuring Behaviour: An Introductory Guide; Cambridge University Press: Cambridge, UK, 1993. [Google Scholar]
- McDonald, J.H. Handbook of Biological Statistics; Sparky House Publishing: Baltimore, MD, USA, 2009. [Google Scholar]
- Wong, K.; Elegante, M.; Bartels, B.; Elkhayat, S.; Tien, D.; Roy, S.; Goodspeed, J.; Suciu, C.; Tan, J.; Grimes, C.; et al. Analyzing habituation responses to novelty in zebrafish (Danio rerio). Behav. Brain Res 2010, 208, 450–457. [Google Scholar]
- Butail, S.; Bartolini, T.; Porfiri, M. Collective response of zebrafish shoals to a free-swimming robotic fish. PLoS One 2013, 8, e76123. [Google Scholar]
- Bracewell, R.N. The fourier transform. Sci. Am 1989, 260, 86–95. [Google Scholar]
- Paluš, M. Coarse-grained entropy rates for characterization of complex time series. Phys. D: Nonlinear Phenom 1996, 93, 64–77. [Google Scholar]
- Miller, N.; Gerlai, R. From schooling to shoaling: Patterns of collective motion in zebrafish (Danio rerio). PLoS One 2012, 7, e48865. [Google Scholar]
- Blaser, R.E.; Chadwick, L.; McGinnis, G.C. Behavioral measures of anxiety in zebrafish (Danio rerio). Behav. Brain Res 2010, 208, 56–62. [Google Scholar]
- Halloy, J.; Sempo, G.; Caprari, G.; Rivault, C.; Asadpour, M.; Tâche, F.; Saïd, I.; Durier, V.; Canonge, S.; Amé, J.M.; et al. Social integration of robots into groups of cockroaches to control self-organized choices. Science 2007, 318, 1155–1158. [Google Scholar]
- Partan, S.R.; Larco, C.P.; Owens, M.J. Wild tree squirrels respond with multisensory enhancement to conspecific robot alarm behaviour. Anim. Behav 2009, 77, 1127–1135. [Google Scholar]
- Marras, S.; Porfiri, M. Fish and robots swimming together: Attraction towards the robot demands biomimetic locomotion. J. R. Soc. Interface 2012, 9, 1856–1868. [Google Scholar]
- Lachlan, R.F.; Crooks, L.; Laland, K.N. Who follows whom? Shoaling preferences and social learning of foraging information in guppies. Anim. Behav 1998, 56, 181–190. [Google Scholar]


© 2014 by the authors; licensee MDPI, Basel, Switzerland This article is an open access article distributed under the terms and conditions of the Creative Commons Attribution license (http://creativecommons.org/licenses/by/3.0/).
Share and Cite
Butail, S.; Ladu, F.; Spinello, D.; Porfiri, M. Information Flow in Animal-Robot Interactions. Entropy 2014, 16, 1315-1330. https://doi.org/10.3390/e16031315
Butail S, Ladu F, Spinello D, Porfiri M. Information Flow in Animal-Robot Interactions. Entropy. 2014; 16(3):1315-1330. https://doi.org/10.3390/e16031315
Chicago/Turabian StyleButail, Sachit, Fabrizio Ladu, Davide Spinello, and Maurizio Porfiri. 2014. "Information Flow in Animal-Robot Interactions" Entropy 16, no. 3: 1315-1330. https://doi.org/10.3390/e16031315