Entropy-Based Investigation on the Precipitation Variability over the Hexi Corridor in China


Center for Agricultural Water Research in China, China Agricultural University, Beijing 100083, China
*
Author to whom correspondence should be addressed.
Entropy 2017, 19(12), 660; https://doi.org/10.3390/e19120660
Submission received: 30 September 2017
/
Revised: 23 November 2017
/
Accepted: 27 November 2017
/
Published: 1 December 2017
(This article belongs to the Special Issue Entropy Applications in Environmental and Water Engineering)
Abstract
:The spatial and temporal variability of precipitation time series were investigated for the Hexi Corridor, in Northwest China, by analyzing the entropy information. The examinations were performed on monthly, seasonal, and annual timescales based on 29 meteorological stations for the period of 1961–2015. The apportionment entropy and intensity entropy were used to analyze the regional precipitation characteristics, including the intra-annual and decadal distribution of monthly and annual precipitation amounts, as well as the number of precipitation days within a year and a decade. The regions with high precipitation variability are found in the western part of the Hexi corridor and with less precipitation, and may have a high possibility of drought occurrence. The variability of the number of precipitation days decreased from the west to the east of the corridor. Higher variability, in terms of both of precipitation amount and intensity during crop-growing season, has been found in the recent decade. In addition, the correlation between entropy-based precipitation variability and the crop yield is also compared, and the crop yield in historical periods is found to be correlated with the precipitation intensity disorder index in the middle reaches of the Hexi corridor.
1. Introduction
The Hexi corridor in northwest China (Figure 1), located in 93°21′–104°05′ E and 37°15′–42°48′ N, plays an important role in grain production and regional economic development. The corridor is a long-narrow region in Northwest China with a length of about 1000 km, an average width of about 270 km, and a total area of about 270,000 km2. The Qiliang Mountains are located in the southern part of the corridor and the Mazong and Longshou Mountains in the north, with the Wushaoling to the east and Dunhuang to the west. The corridor includes three inland water systems, namely the Shule River, the Hei River, and the Shiyang River, from west to east, respectively. The long-term mean annual precipitation is about 100–150 mm. Although it receives relatively limited precipitation, the Hexi corridor has sufficient light and heat resources, with a sunshine duration of about 3000 h/year. Therefore, it is an important crop-producing base, serving both the local food requirements and seeding production for other parts of China. Due to the shortage of irrigation water, the fluctuation of precipitation at different timescales may exert considerable effects on the farmland and oases in this area. The water resources is the most significant factor to affect the regional prosperity and the quality of life.
The crop growth relies heavily on water at different months or seasons for different grow phases. To rationally allocate regional water resources and mitigate the possible effects of drought, we need to analyze the long-term hydro-meteorological variables [1]. Together with the warming effects of climate change, the amount, timing, and distribution of precipitation may be affected, leading to changes in the amount of local available water. Many obvious/abrupt changes have been witnessed, such as the precipitation decline in Sahel [2], greater incidence of extreme precipitation events [3], and an increase in fall precipitation [4]. These observed changes could be partly attributed to the evolutions of large climate signals (e.g., [5]) in the context of climate change.
In order to reveal the underlying disorder features of precipitation variability during different months and different seasons, we use the entropy-based approach to study spatial and temporal precipitation variability over the Hexi corridor. The entropy theory presented by Shannon in the late 1940s [6] and the principle of maximum entropy presented by Jaynes in the late 1950s [7,8] have been applied in various research fields. Among them, there are many valuable hydrological applications of entropy theory (e.g., [9,10,11,12,13,14,15,16,17,18,19,20,21]). The aspects we want to address in this study include: (1) the detection of the spatial region and temporal year for high disorder features; (2) the identification of a monthly time series, which dominates the seasonal precipitation in Hexi corridor, and the identification of a seasonal time series, which dominates the annual precipitation in the corridor; (3) the correlations between drought-induced crop reduction and precipitation variability. The methods and data adopted in the present study are first presented in Section 2 and Section 3, respectively. The entropy-based precipitation features are analyzed and discussed, and the correlation between crop production and precipitation variability is examined in Section 4. The conclusions are given in Section 5.
2. Materials and Methods
The entropy-based investigation is helpful to determine the least-biased probability distribution of a random variable. A discrete form of entropy H(x) is written as [6,17]:
where k is time interval of the K events, xk is an event corresponding to the interval k, and p(xk) is the probability of xk. The application in this study is to measure the spatial and temporal variability/disorder features of precipitation in Hexi corridor in Northwest China. By following the methods in Mishra et al. [1], the several entropy measures, namely, intensity entropy, apportionment entropy, and marginal entropy, are employed for the research purpose. More details about the entropy and its applications can be found in Singh [9].
2.1. Marginal Entropy
The marginal entropy (ME) is the average information of a random variable x with the probability distribution p(x), which is used to quantify uncertainty. The calculation processes are expressed in Equation (1). ME is applicable to different timescales, such as the daily, seasonal, monthly, and annual timescales in the present study.
2.2. Intensity Entropy
We consider the number of precipitation days (ni) within a month i (i = 1, 2, 3, ..., 12) of a year and the total amount of precipitation days N (N = ) in the year [1]. The probabilities of precipitation days in each month are expressed as pi = ni/N. The intensity entropy (IE) for an individual meteorological station for a month is given as:
2.3. Apportionment Entropy
The apportionment entropy (AE) is used to study the distribution features of precipitation for different months over a year. Assume that the precipitation amount in the ith month is ri (i = 1, 2, 3, …, 12), and the total precipitation amounts for twelve months is R (R = ). The probabilities of precipitation days in each month to the total days in a year are expressed as pi = ri/R. The AE for an individual meteorological station for a year is calculated as:
The AE value is in the range of 0 and log2(12) [1], in which the precipitation occurs only one out of twelve months and the annual precipitation amount is evenly distributed for twelve month respectively.
2.4. Entropy-Based Variability
The entropy-based variability is characterized by disorder index (DI). The DI is the difference between the maximum possible entropy and the calculated entropy from the individual series. In case the probability of each event is even, the DI reaches the maximum value. Therefore, the DI carries the information of disorder features of the analyzed time series. Accordingly, there is a marginal disorder index (MDI), an apportionment disorder index (ADI), and an intensity disorder index (IDI). In temporal domain, the DI is computed for annual, seasonal, and monthly time series. In spatial and temporal domain, the mean DI (MDI) is given by:
where N is the length of entropy time scales. The higher the DI value is, the higher will be the variability [1].
3. Data
The precipitation data used in this study are derived from weather records of national standard meteorological stations for the Hexi corridor in Northwest China, obtained from China Meteorological Data Sharing Service System (http://data.cma.cn). A total of 29 stations, which have continuous precipitation records for the period 1961–2015, were selected for investigating precipitation variability. For the gap filling, the missing data were generally filled using the means of neighboring data, but if the missing period is longer than 1–2 days, the data of the same period from other years were considered occasionally. The geographical information of the 29 meteorological stations in Hexi corridor is listed in Table 1, and the basic statistical properties about annual total precipitation amount (ATP), monthly total precipitation amount (MTP), annual total precipitation days (ATD), and monthly total precipitation days (MTD) for the stations are listed in Table 2. The associated crop yield data were obtained from statistical data of the China Economic and Social Development Statistics Database (http://tongji.cnki.net/kns55/index.aspx), Gansu Water Statistical Yearbook.
4. Results and Discussion
4.1. Variability of Annual, Seasonal, and Monthly Precipitation
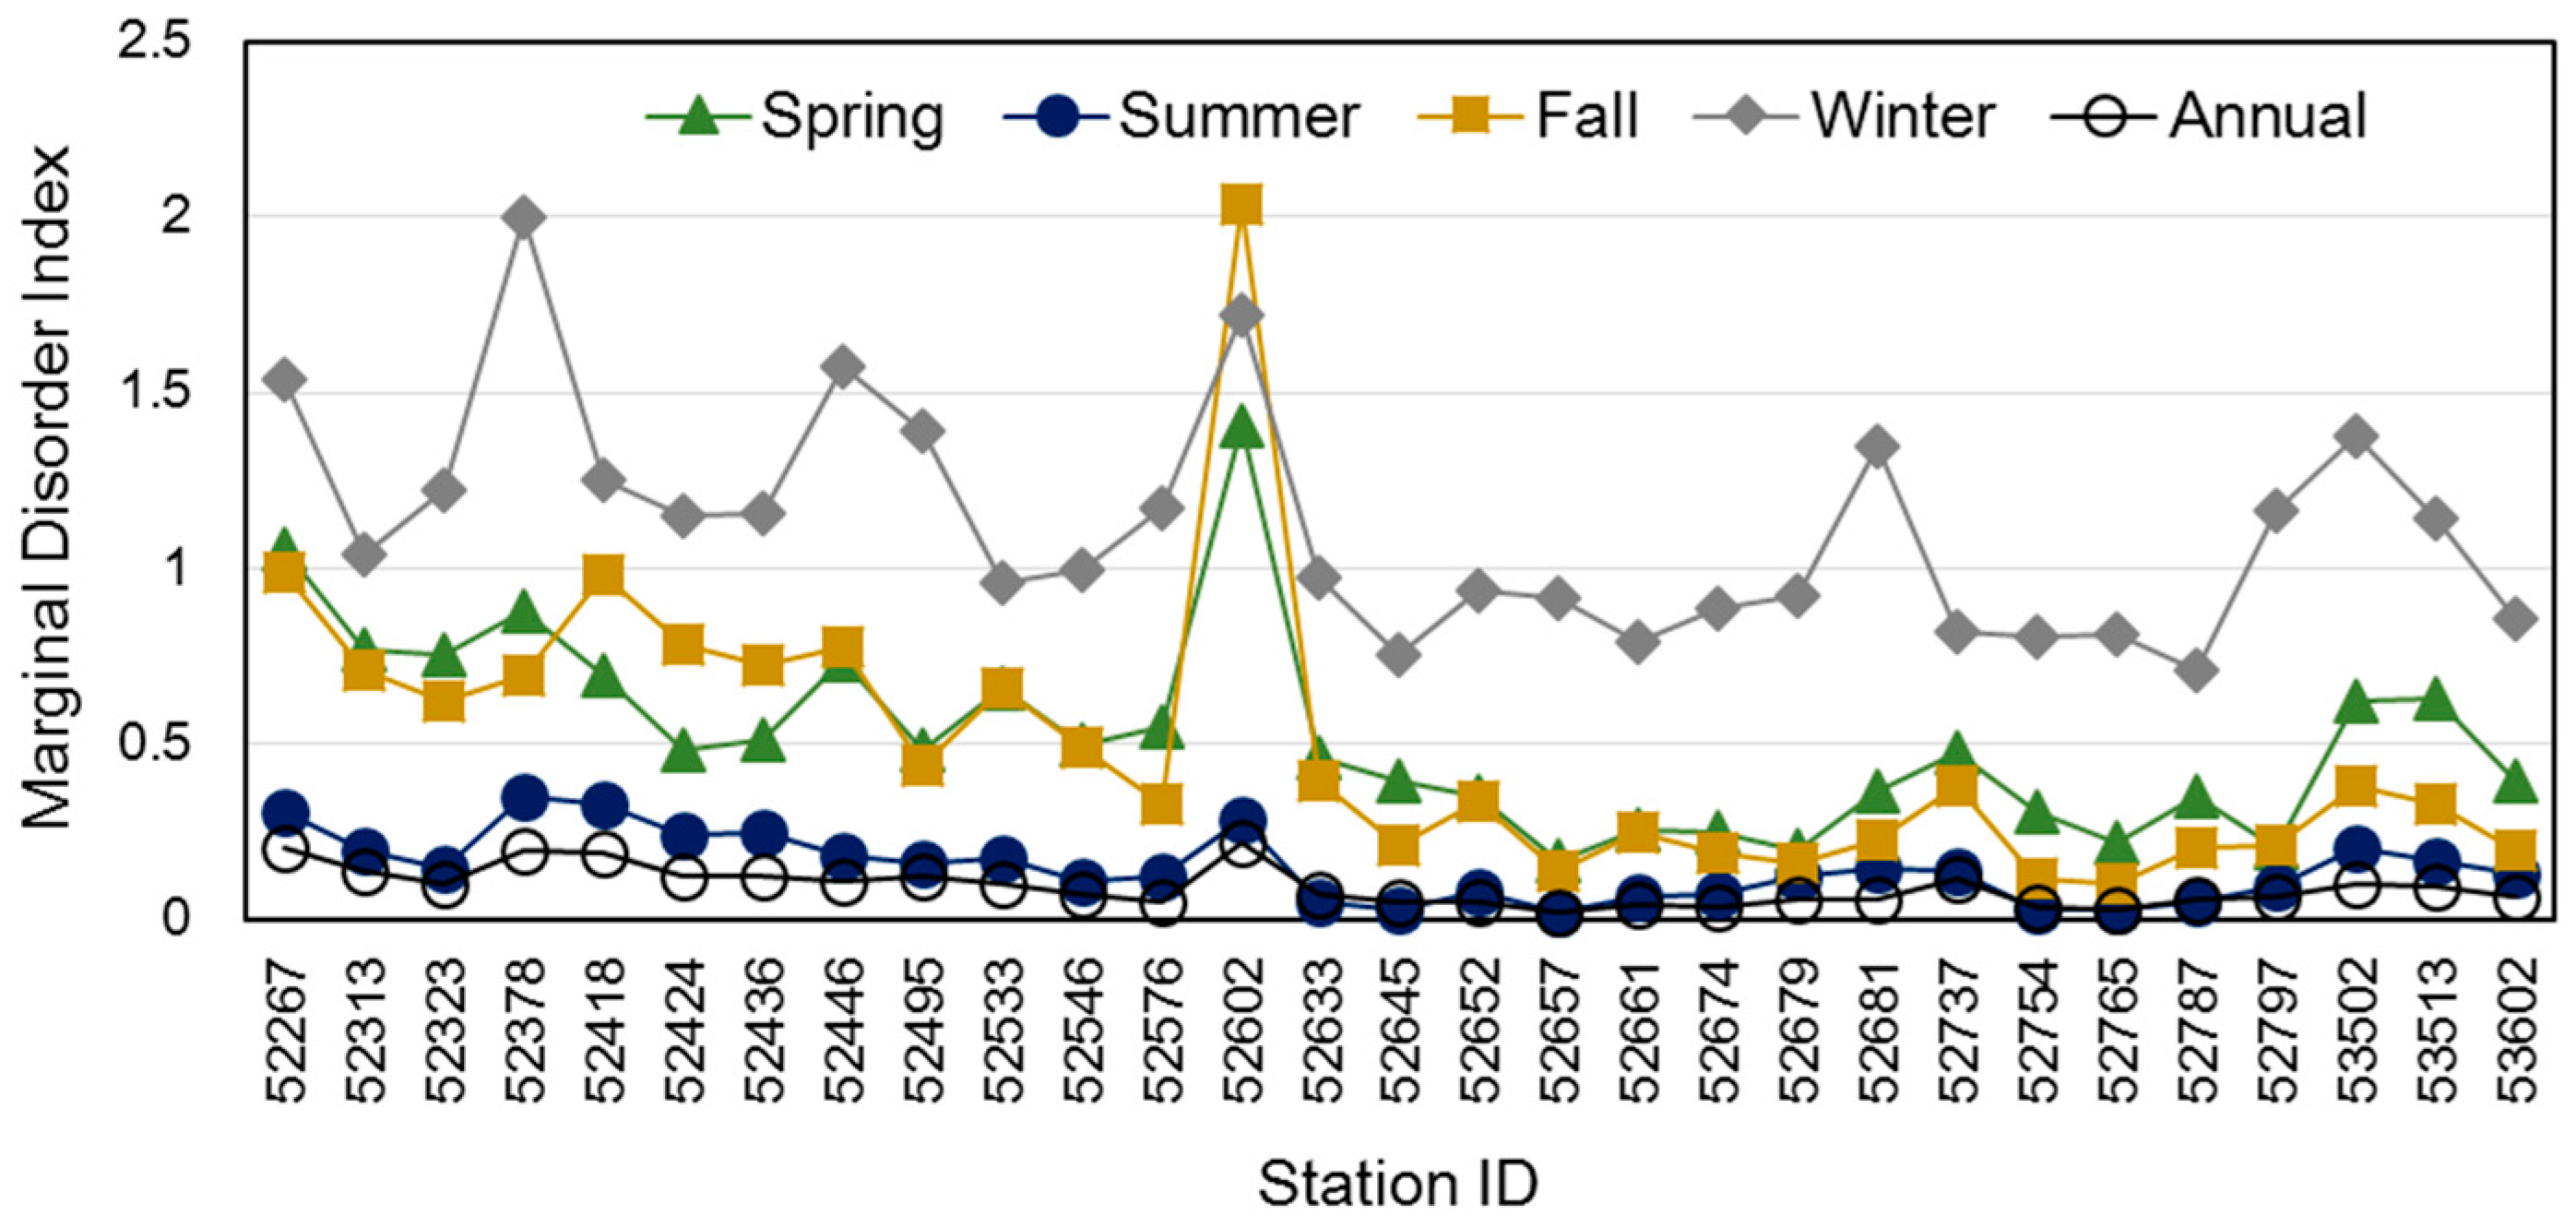
Figure 2 shows the calculated marginal disorder index (MDI) for annual and seasonal (spring, summer, fall, and winter) precipitation time series over different meteorological stations. Overall, the MDI at annual timescale is lower than those of four seasons. The higher MDI values appear for winter time series, which indicates the higher variability associated with the analyzed stations in winter. Among them, the precipitation recorded by Station 52602 near the western part of the Hexi corridor shows maximum marginal entropy in both annual and four seasonal timescales, followed by Station 52378 (in the northeastern part) and 52446 (in the middle region of the Hexi corridor) in terms of the MDI value in Winter. The spatial distribution of the computed MDI at annual timescale is shown in Figure 3, in comparison with the corresponding mean annual precipitation for the period 1961–2015. It is observed that the annual precipitation in Hexi corridor is increasing from the northwest region to the southeast region, with a range of 50–400 mm/year. Regarding the MDI value, the highest value exits in the west corner of the Hexi corridor, which is in the area of Shule River basin. The MDI gradually decreases from west to the junction area between the Hei and Shiyang River basins, and it further slightly increases in the northeastern part of Shiyang River basin. Therefore, the disorder characteristics associated with the mean annual precipitation vary spatially for the Hexi corridor.
The spatial distribution of MDI of seasonal precipitation time series is shown in Figure 4. It is found that the stations with high variability for the four seasons are: Stations 52424, 52436, and 52546 in spring; Station 52418 in summer; Stations 52313, 52418, 52424, and 52446 in fall; and Stations 52602, 52446, 52418, and 52681 in winter. It is interesting that the station 52418 is the only one with relatively higher disorder features in summer over the Hexi corridor. The stations with the higher winter MDI are not concentrated in one region, but distributed in the western, middle, and eastern parts. It is also observed that the winter MDI value is higher than that of other seasons, as shown in Figure 5. The distribution pattern of spring precipitation MDI is similar to that in fall MDI. The MDI value in summer is quite low, which indicates the disorder features are less obvious when the precipitation is relatively high in summer season over the Hexi corridor.
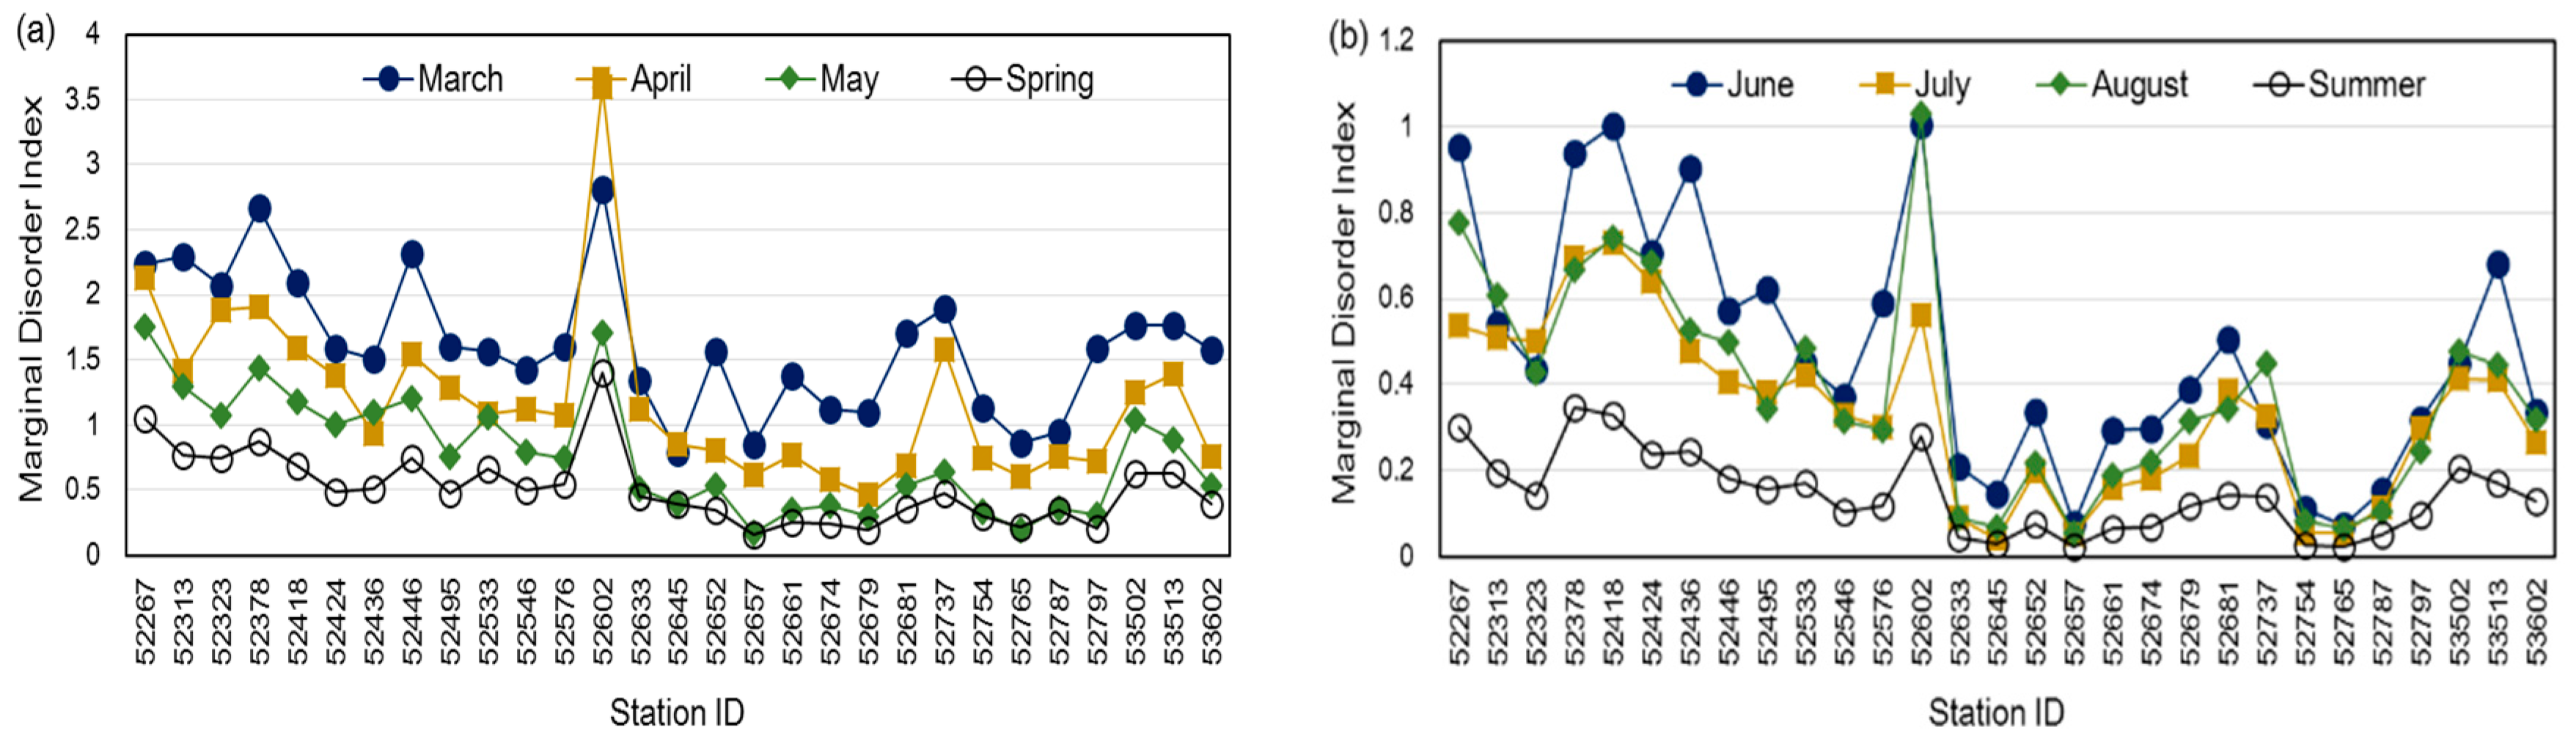
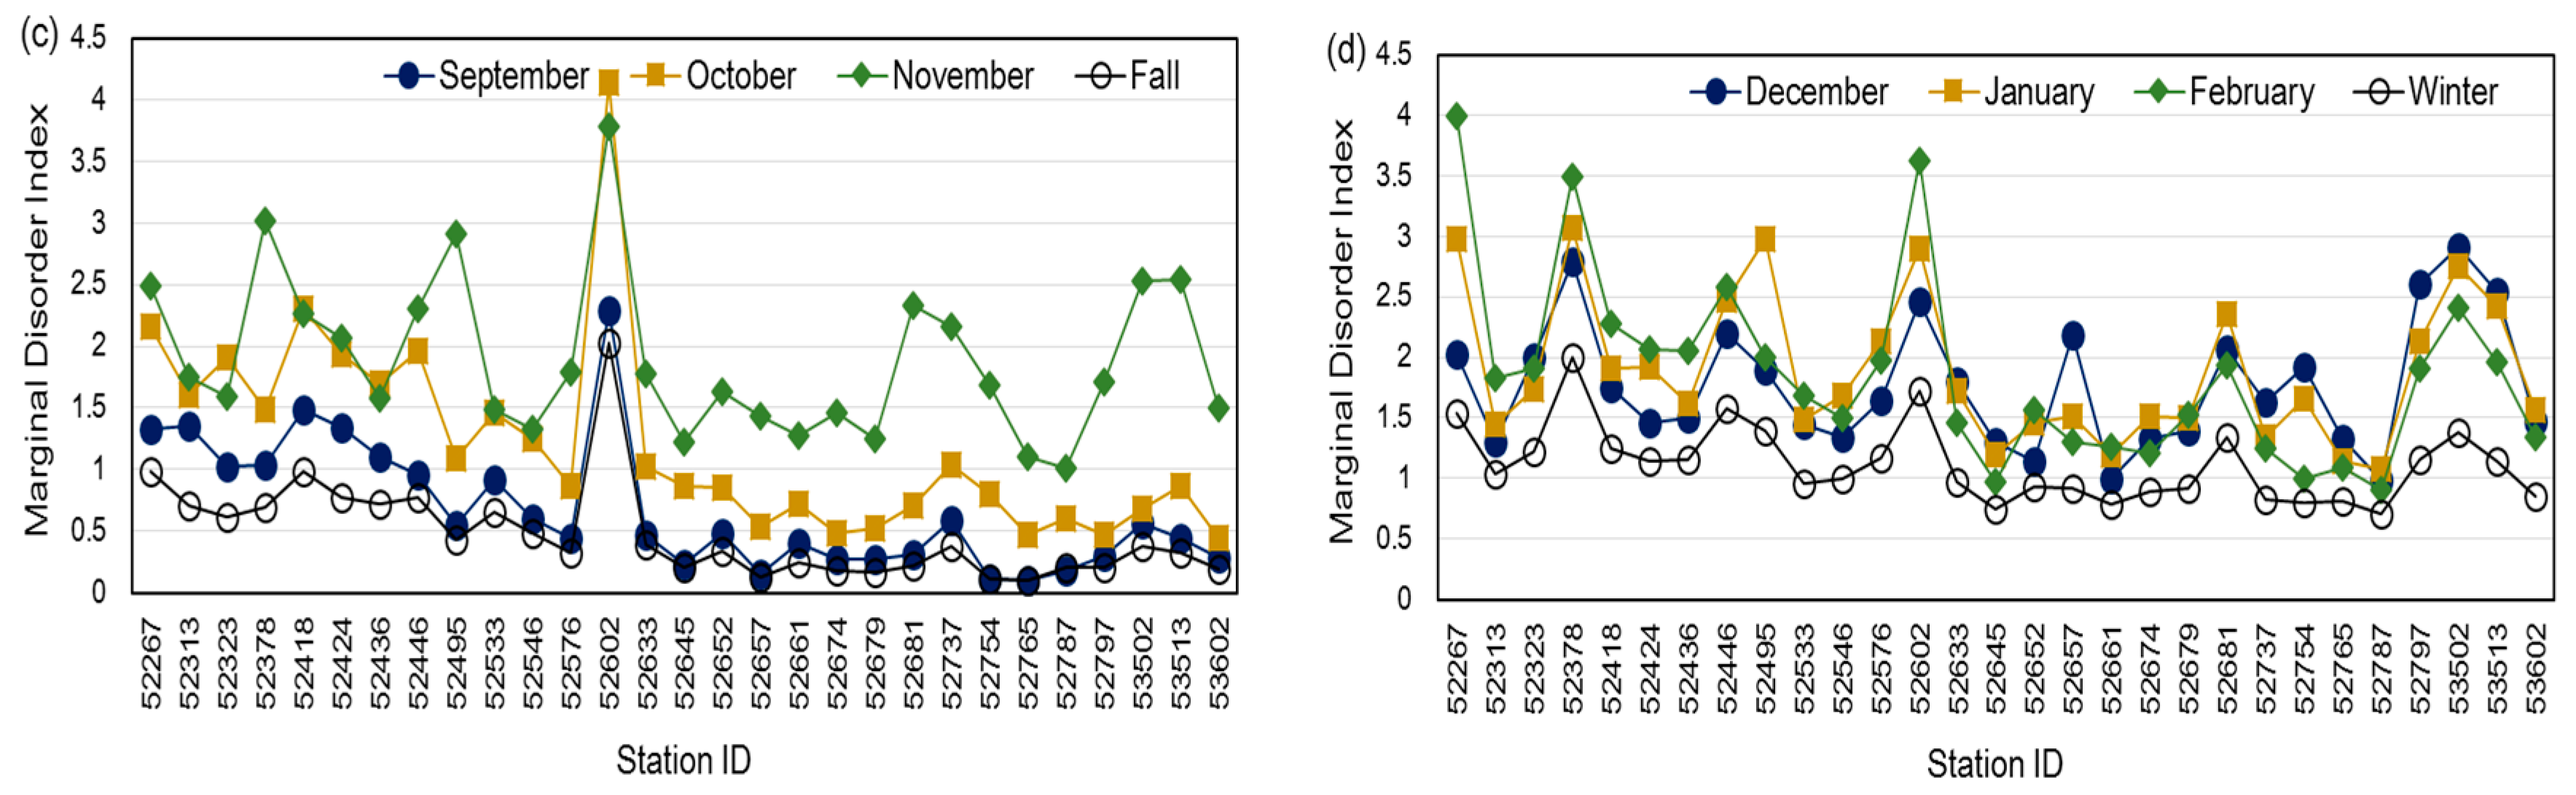
To understand which month is responsible for seasonal variability, it is useful to examine the intra-variability of months within a season [1]. Basically, the entropy-based variability of individual month is higher than that of corresponding season, which shows the disordered nature of precipitation. It is observed that the variability of March precipitation time series contributes the most in spring, while the variability in April contributes less. The summer variability is low in terms of the MDI value, and the MDI in July and August exerts the steadiest processes across the different stations in the studied region. Among it, the Stations 52267, 52378, 52418, 52436, and 53513 show relatively higher MDI value, which indicates the precipitation in summer may have more uncertainties. The farmland area located on or near the stations should pay more attention to the precipitation forecasting. The Station 52602, near the west corner of the Hexi corridor, has a distinguished disorder feature through all four seasons, with the most variability appearing in April, August, November, and February, respectively.
4.2. Variability of Precipitation Apportionment and Intensity
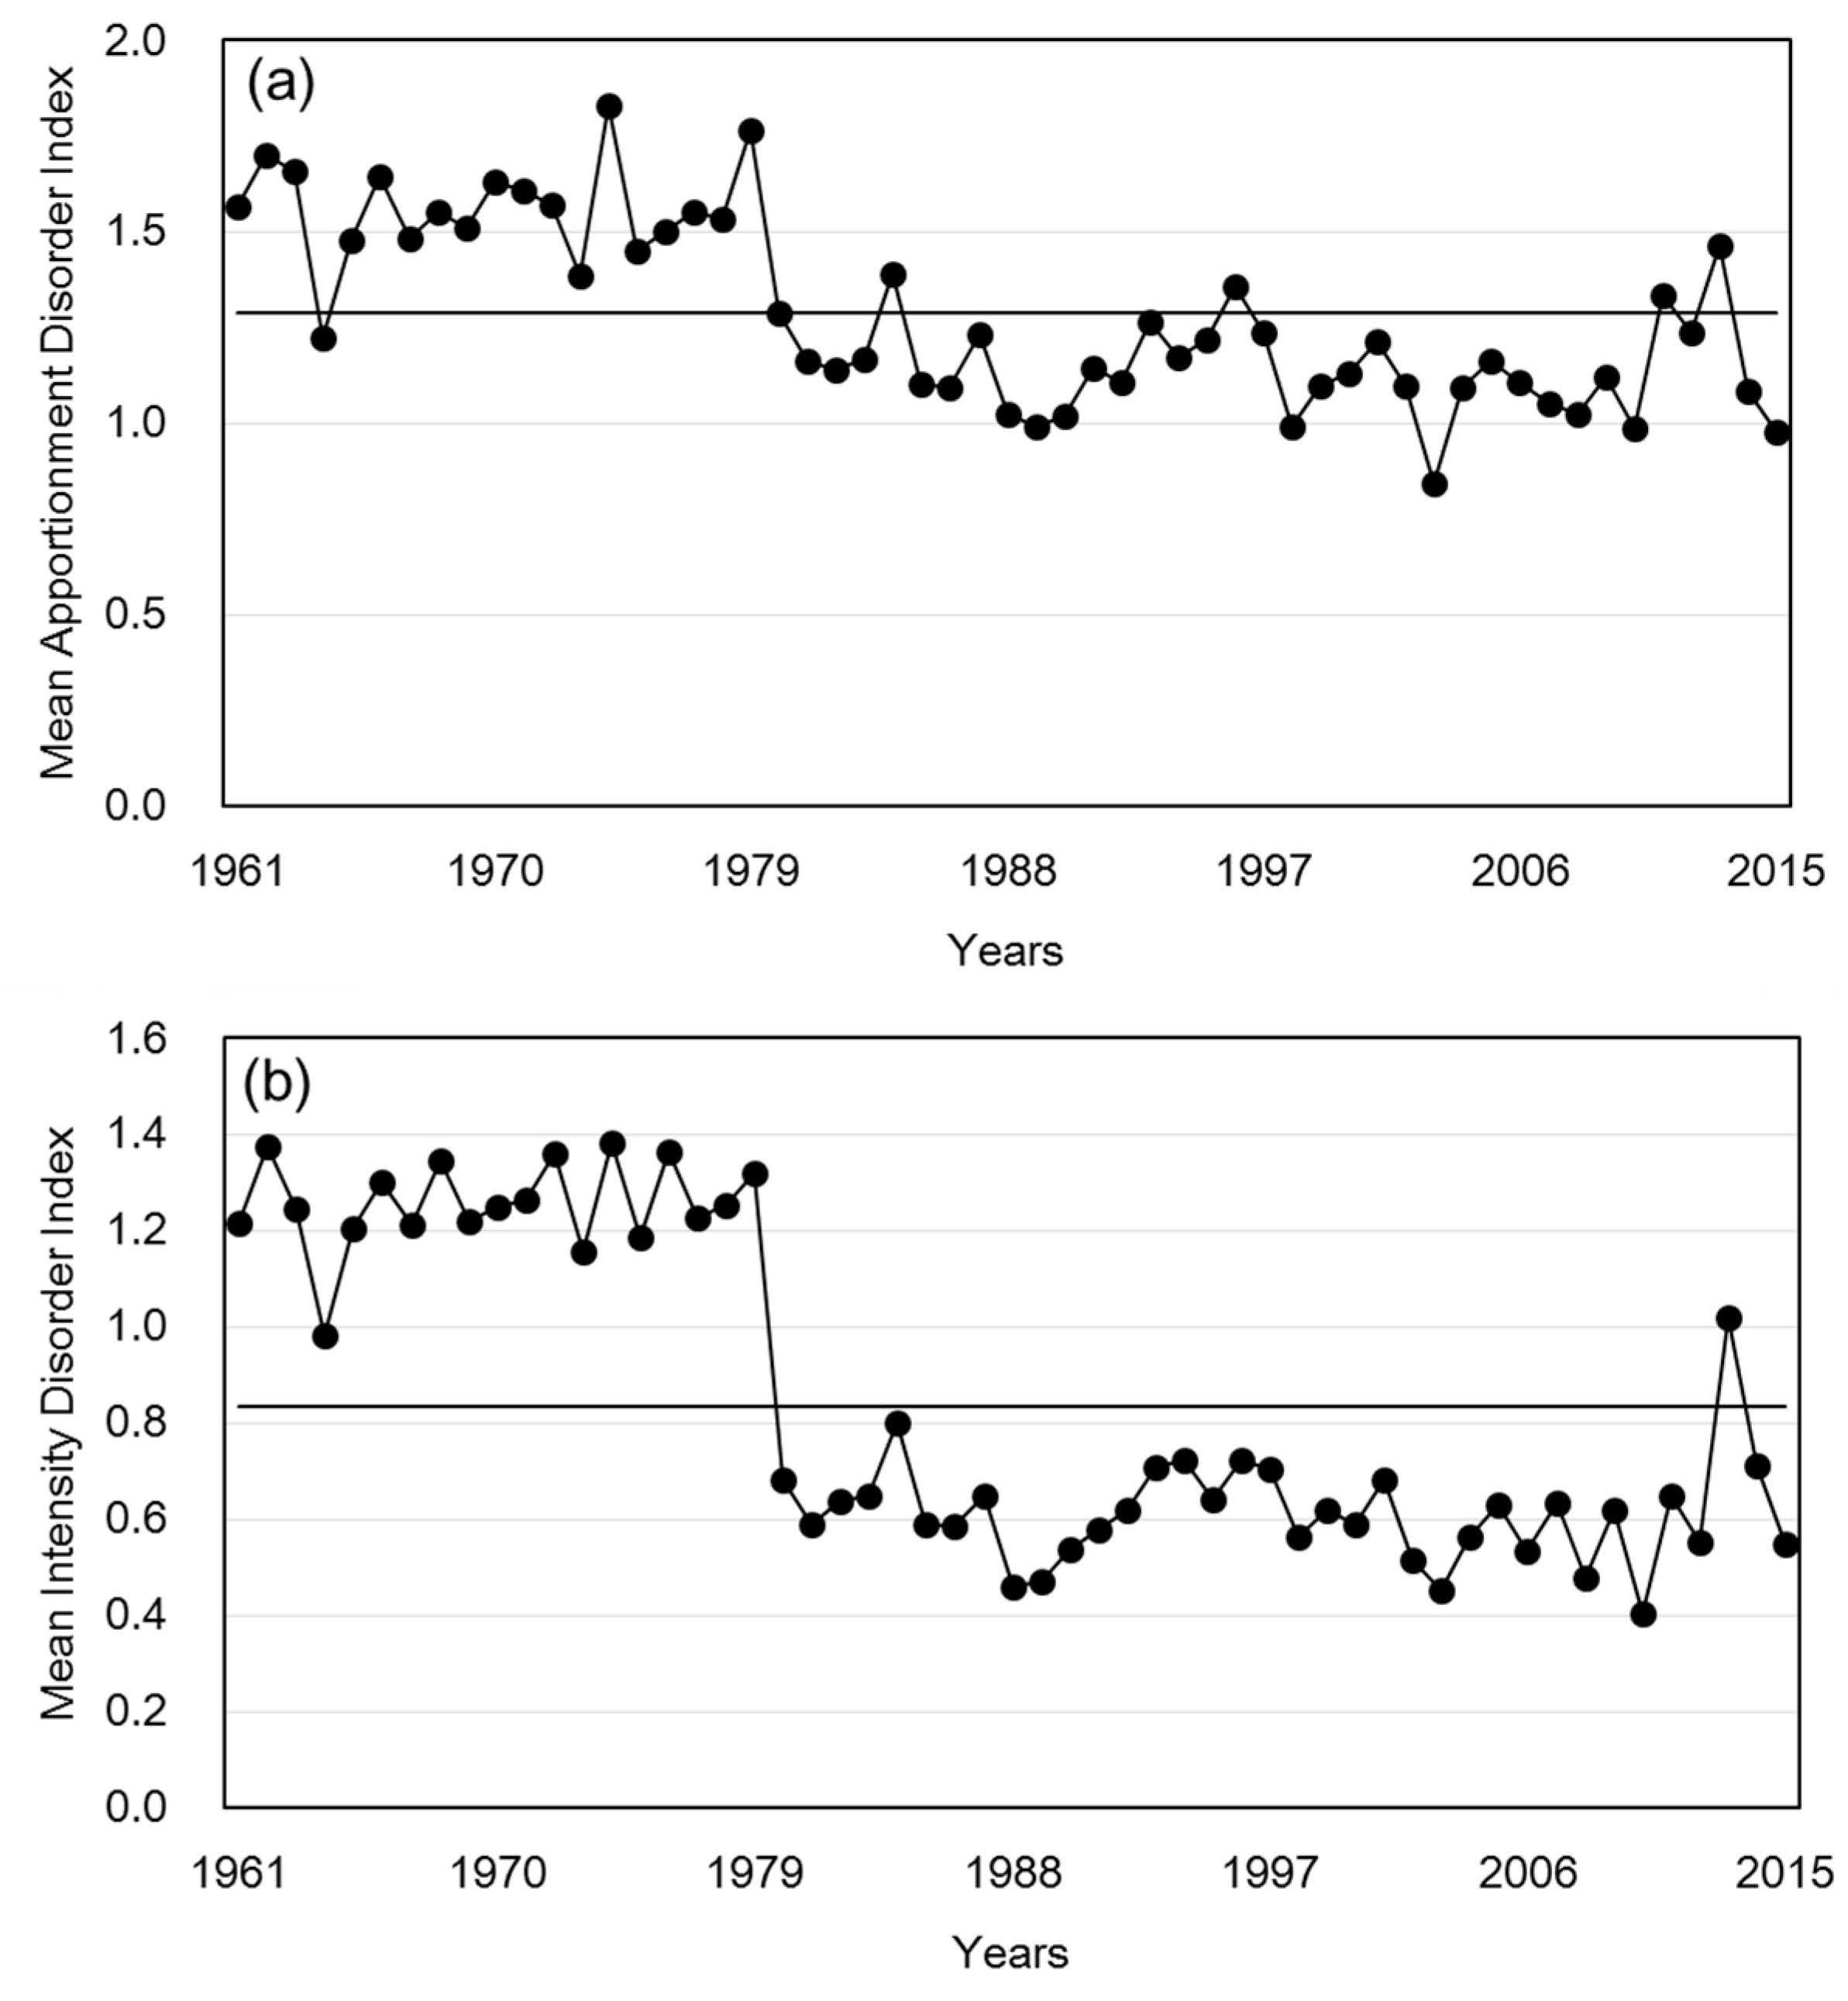
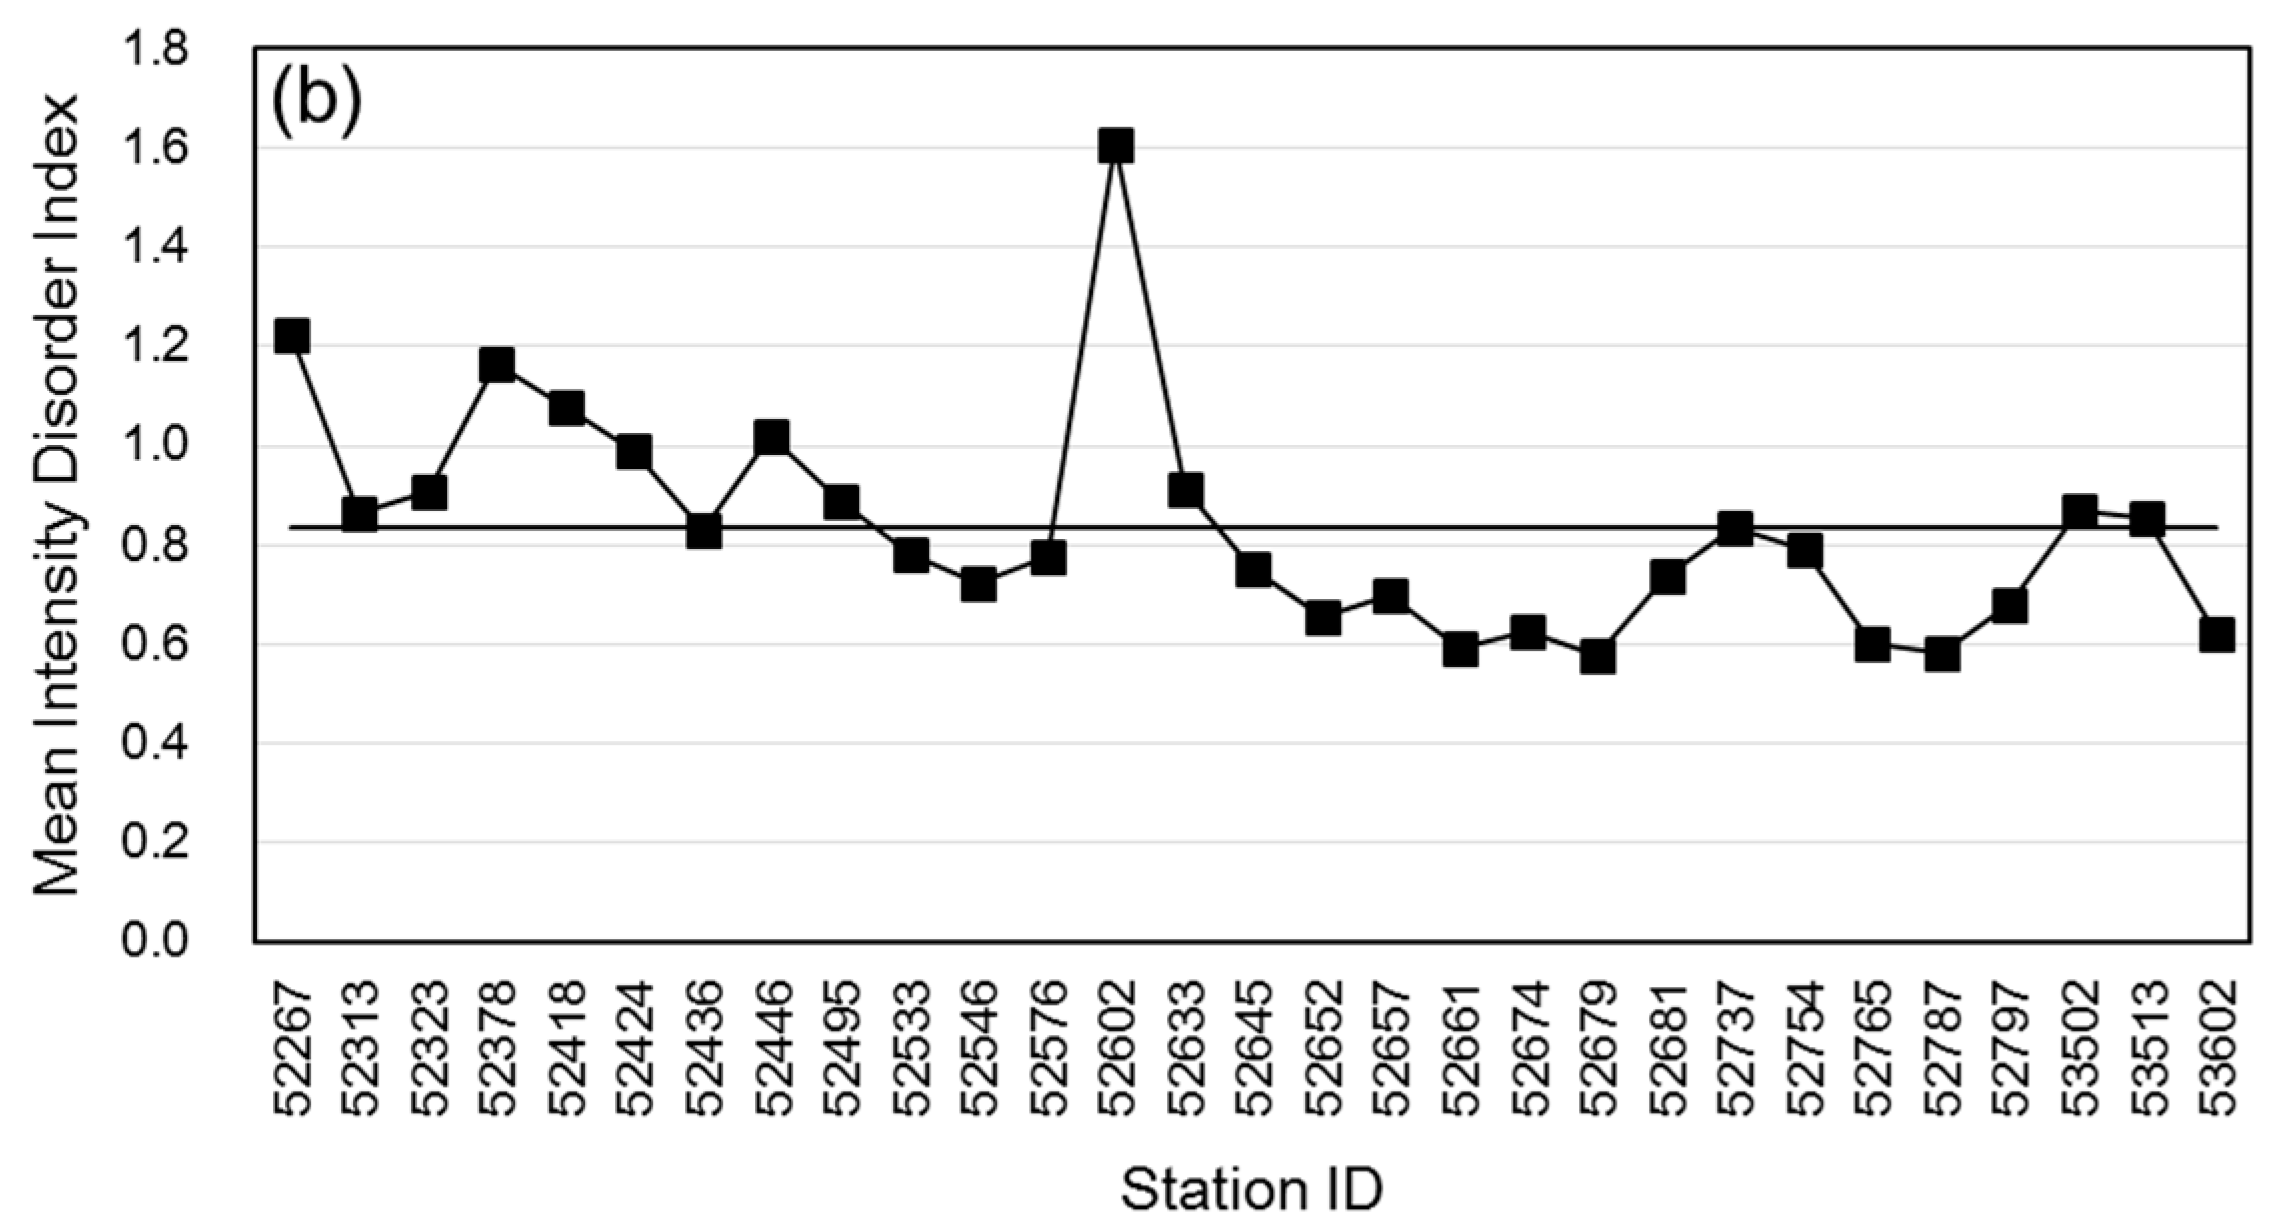
The apportionment features of precipitation can be reflected by the variability of precipitation amount of different months within a year. The apportionment disorder index (ADI) serves to quantify the precipitation characteristics, with the higher value indicating the higher unbalanced feature. Figure 6a summarizes the features for the whole studied region for the past 55 years (1961–2015). It is observed that the variability of precipitation amounts within a year are higher during the first 20-year period (1961–1980). These calculation results could be explained in two ways: (1) there are more zero values in precipitation records during 1961–1980 period, which probably demonstrates dire environment in this region compared to that of recent decades; and (2) the observed records may not reliable during the quite earlier years, and those zero values may not be effective. For the period 1980–2015, we can observe that the high variability of precipitation apportionment appears during the last decade in 20th century and after 2010. Meanwhile, Figure 7a reveals the station-based spatial features of ADI for the whole studied period. The stations with high apportionment variability include Stations 52267, 52378, 52418, 52446, and 52602. The variability generally decreases from the northwestern part of the region to the southeastern part area, as shown in Figure 8a.
The intensity entropy is reflected by the number of precipitation days in a month or in a year. The intensity disorder index (IDI) is computed for the involved stations of the studied region. Figure 6b shows the IDI over the past 5 decades. The relatively higher IDI are observed for the first 2 decades, which may be explained by the similar two reasons presented above for ADI results. For the recent 35 years (1980–2015), the years with high precipitation intensity are during 1980s and 2010s. The spatial features over all stations are summarized in Figure 7b. The stations with distinct intensity peak are 52267, 52378, 52418, 52446, and 52602. Overall, the spatial features of IDI generally are in line with the apportionment results in Figure 7a. This can be more easily observed in Figure 8a,b. In addition, Figure 8b reflects precipitation amount contribution within the Hexi corridor.
It is observed that the most contributions are along the south edge of the corridor, and those that are relatively higher are in Shiyang River basin. However, the contributions of precipitation days, shown in Figure 8d, are different from that of precipitation amount. The high contribution area includes both Shiyang River basin and the northern part of the Hei River basin in the middle part of the Hexi corridor.
4.3. Decadal Variability of Precipitation Amount and Precipitation Days
To reveal the long-term changing trend of precipitation variability over the Hexi corridor, the decadal apportionment disorder index (DADI) and decadal intensity disorder index (DIDI) were computed for the recent three decades. Figure 9 shows the average entropy value for all stations at annual, seasonal, and monthly time scales for three individual decades. It is observed from Figure 9a that the stations in February, June, and July in the last decade (2001–2010) appear to have more variability in precipitation amount as compared with the two decades (1981–1990 and 1991–2010). In contrast to the variability of precipitation amount, the variability on precipitation days in February in the last decade is less than that during 1981–1990 but slightly higher than the decade of 1991–2010, as shown in Figure 9b. The variability reduction of precipitation days, reflected by DIDI, also occurred in August and October. The variability of precipitation amount and intensity changes for the crop-growing season over the Hexi corridor are very important factors for regional agricultural activities.
4.4. Implication for Crop Production
Based on the results on the spatial distribution in Figure 8, we found that the entropy-based variability generally decreases from west to east, and the precipitation contributions in terms of both precipitation amount and precipitation days decrease from east to west. Therefore, the middle reaches of the Hexi corridor region has both relatively high variability and precipitation amount/precipitation days. Accordingly, the crop yield in this region may be more sensitive to the evolutions of precipitation.
The crop production rates in four counties in the middle of the Hexi corridor during the period of 2005–2014 were compared with the computed precipitation disorder index and the standard deviations of anuual precipitaion amount/precipitaiton days for the associated stations, as shown in Figure 10. There are mainly four different crop types, namely, corn, wheat, rape, and barley. The crop disorder index (CDI) and standard deviation were computed to represent the variability of crop production. Among them, the standard deviation values were scaled to a comparable magnitude with other entropy index values. It is observed that there is a more consistent trend between the crop disorder index and precipitation intensity disorder index (IDI), compared with the relationship between crop disorder index and apportionment disorder index. This indicates the higher IDI value may introduce more crop variability, which demonstrates the implication of entropy-based variability for regional crop production.
4.5. Co-Variability with Other Meteorological Variables
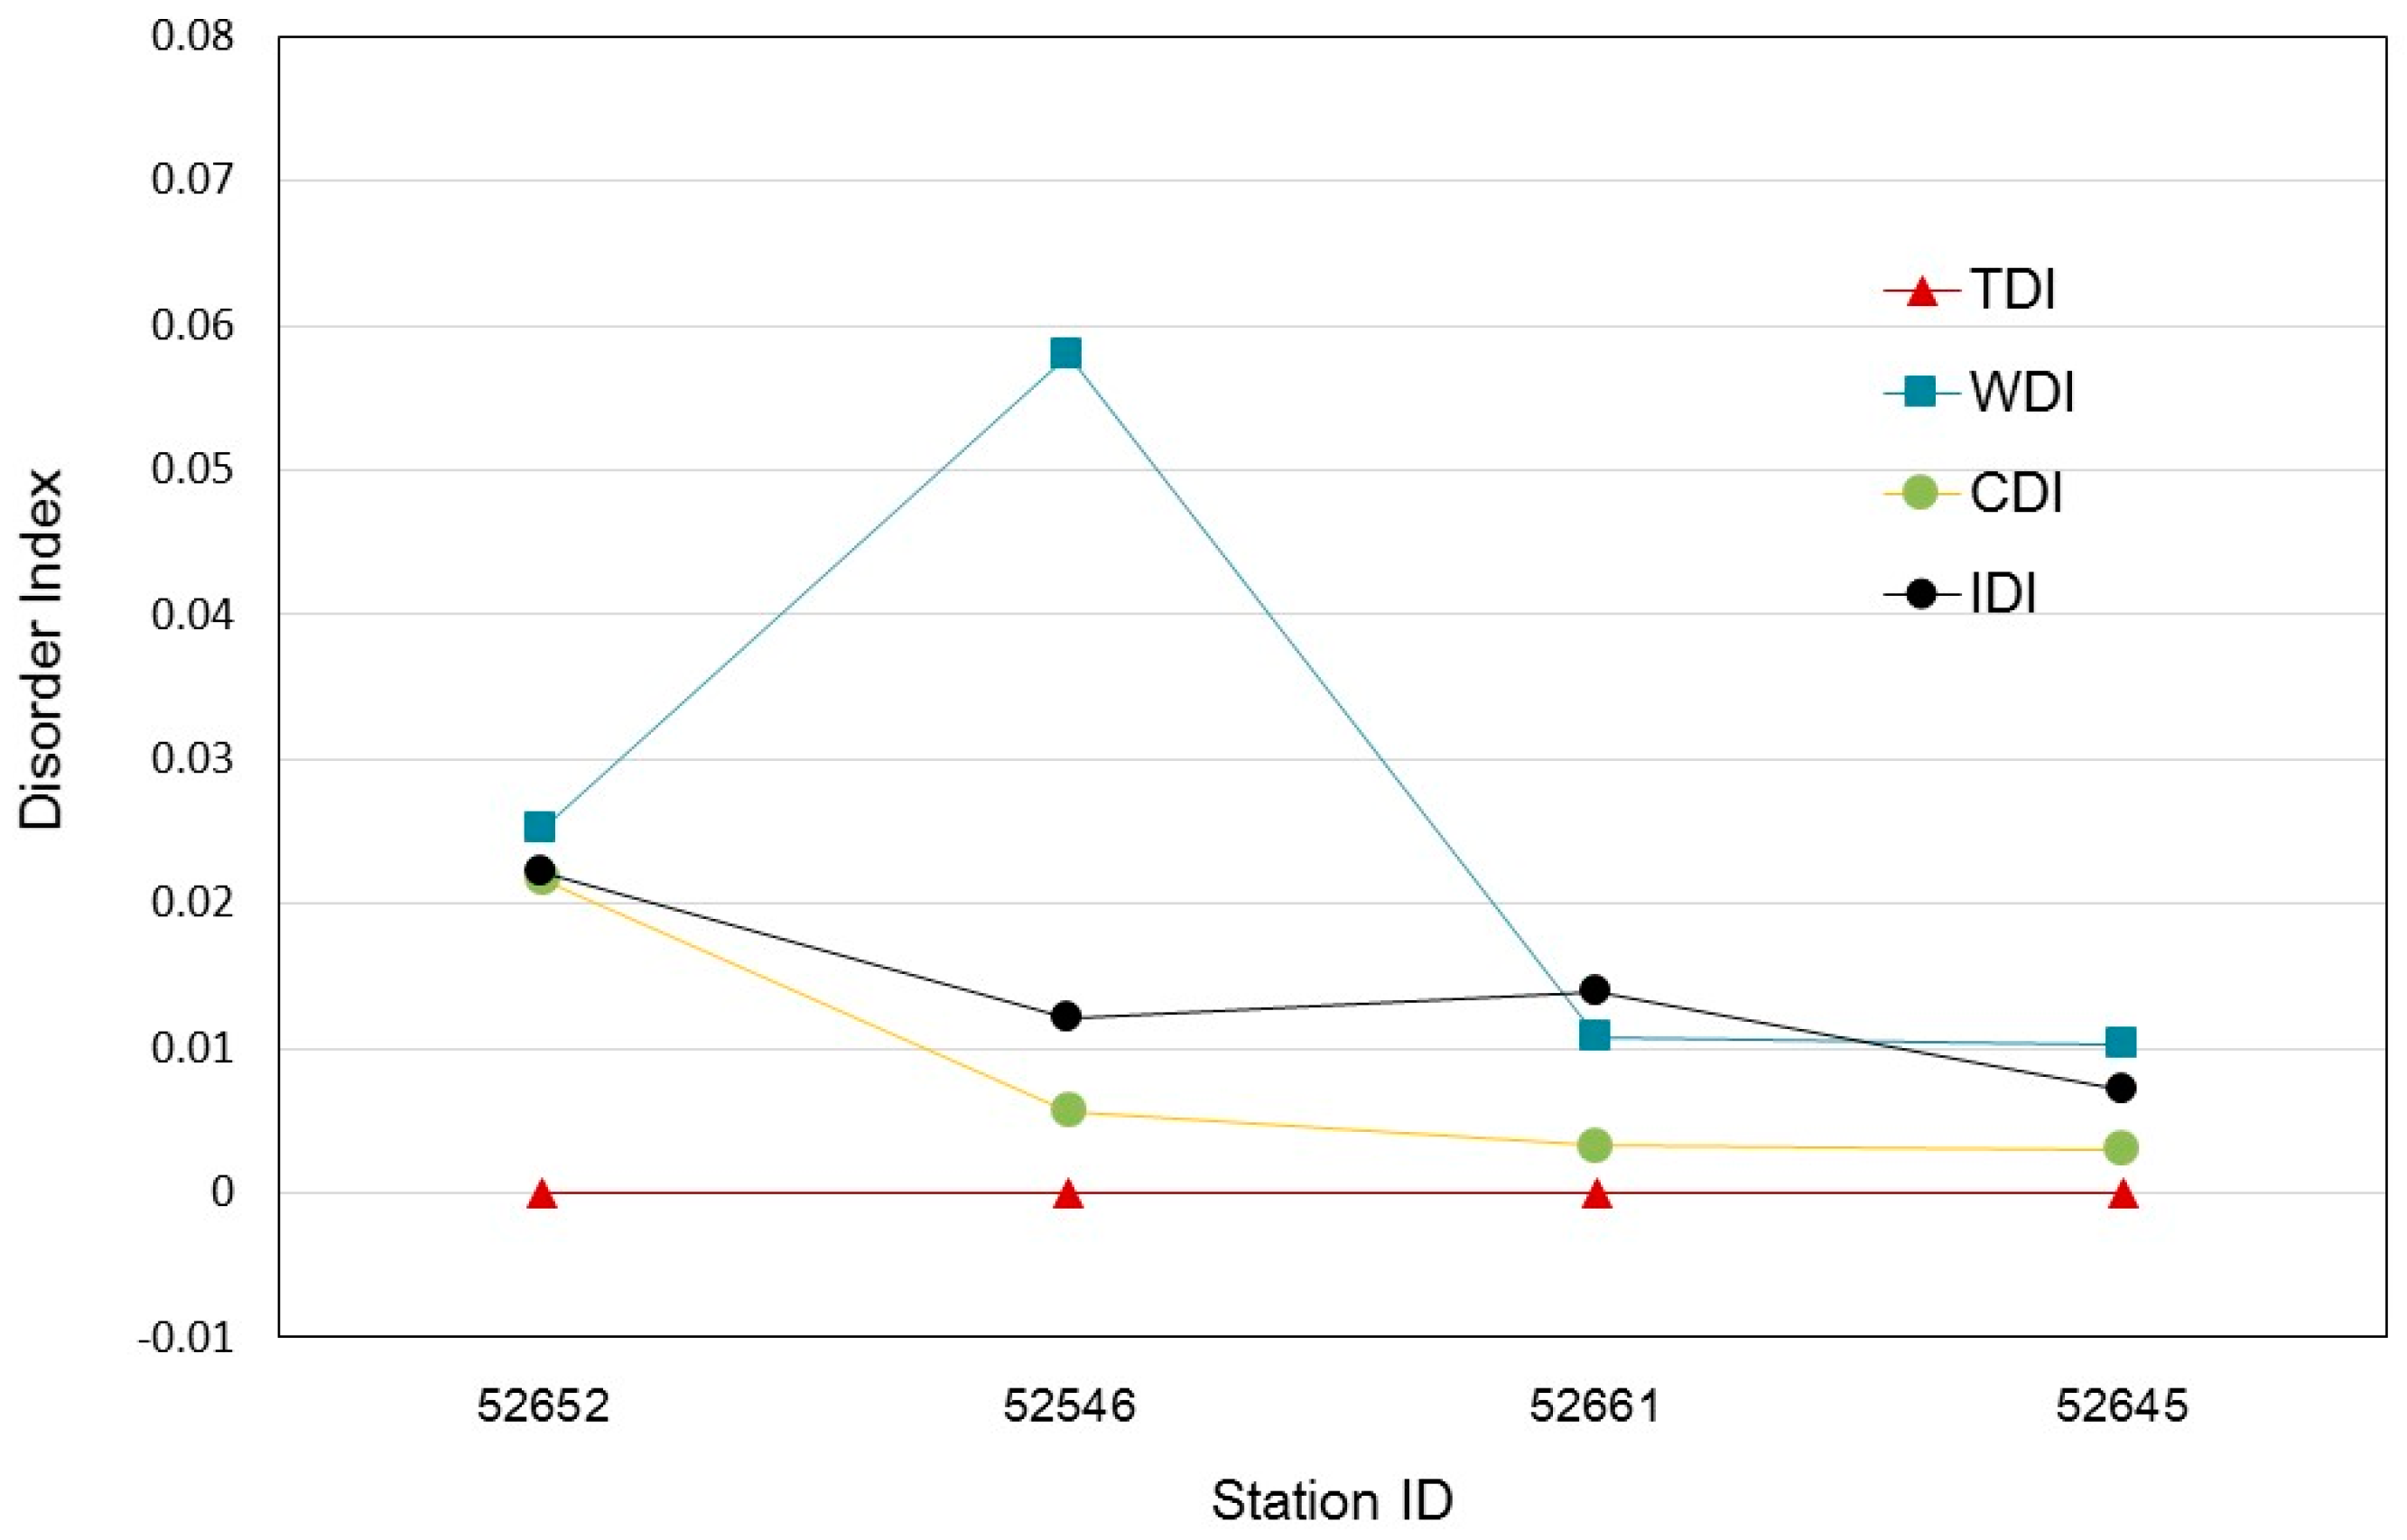
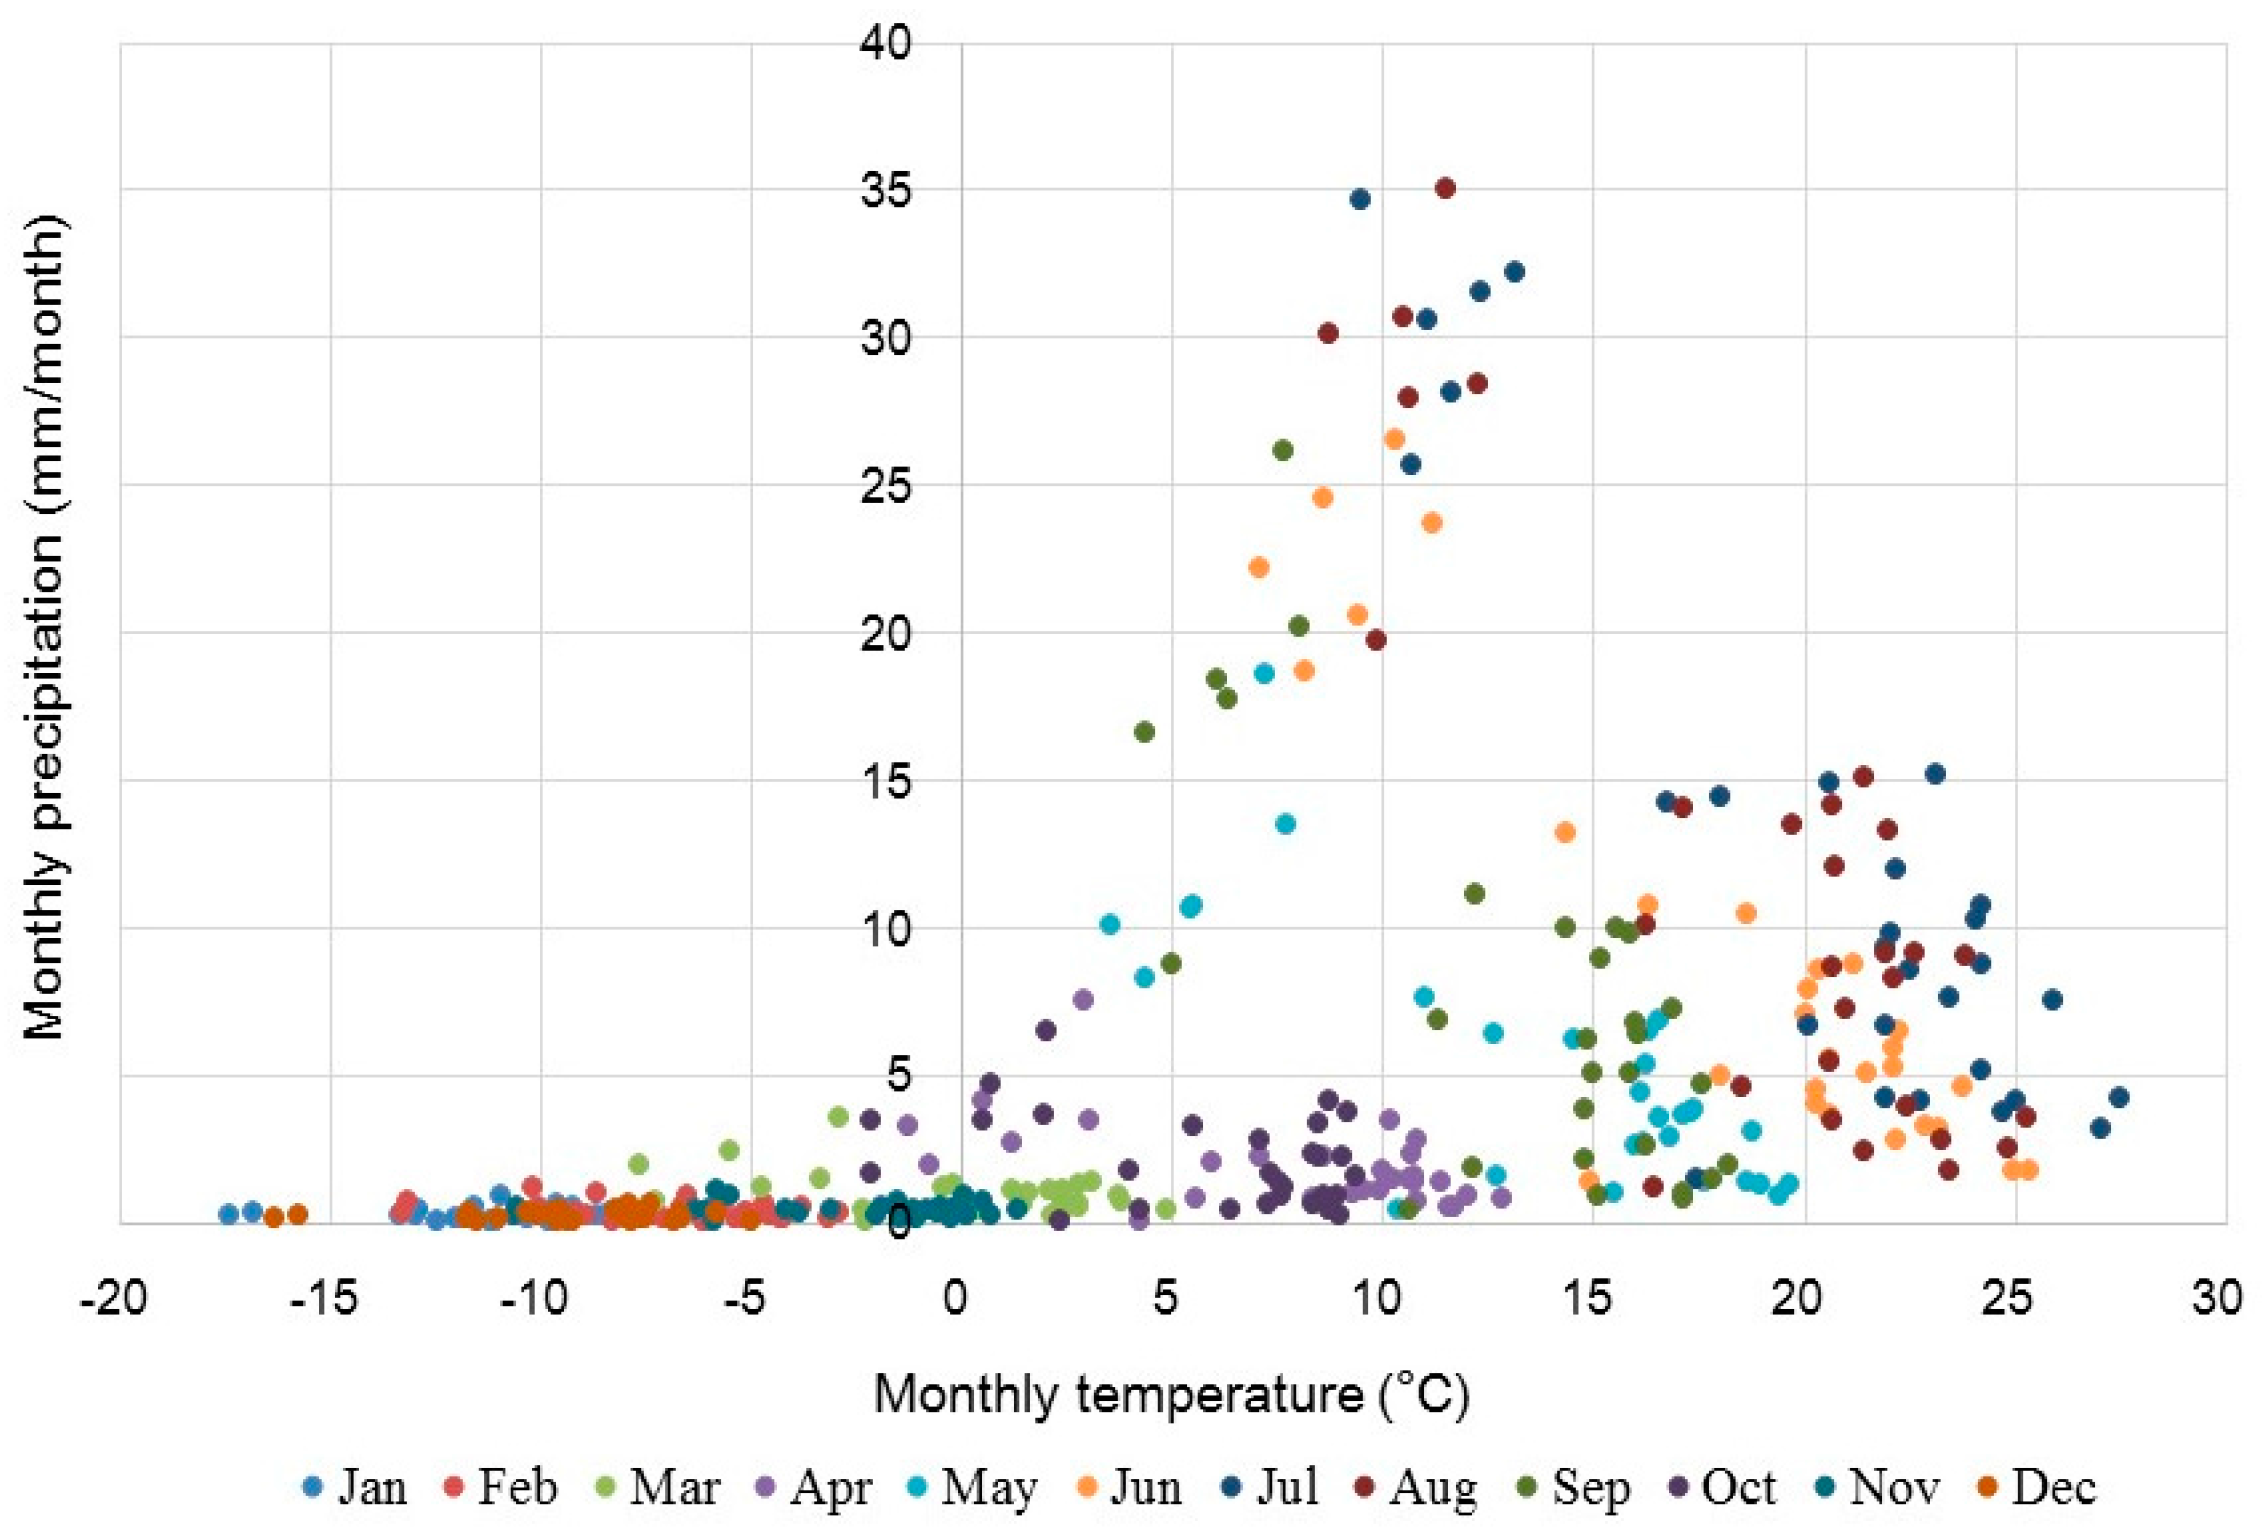
Screening the co-variability of different meterological or hydrological variations is an important step to revealing the dominant controls in certain geophysical processes, such as for the geochmical hot moments in the study of Arora et al. [21]. To better understand the variability of precipitation and crop production mentioned in Section 4.4, we further checked the entropy-based variabilities of the associated temperature and wind speed. Figure 11 shows the average entropy value for all stations on a monthly scale for three individual decades. More variability appears in May, June, and July for temperature, and in January, November, and December for wind speed. Basically, consistent seasonal distributions are found for past three decades. The relationships between precipitation and temperature on a monthly scale, as shown in Figure 12, displays little precipitation below 0 degrees Celsius, and precipitation reaches its height around 10 degrees Celsius in wet seasons. Furthermore, we compared the crop disorder index CDI in four counties with the computed precipitation disorder index, temperture disorder index (TDI), and wind speed disorder index (WDI) for the associated stations, as shown in Figure 13. The TDI shows relatively steady variability for different stations in the region, and WDI exhibits obvious spatial differences. It is observed that the trend of precipitation intensity disorder index IDI is more consistent with that of CDI, compared with TDI and WDI.
5. Conclusions
This study undertakes an entropy-based investigation of the spatial and temporal variability of precipitation for the period 1951–2015 over the Hexi corridor in Northwest China. The following conclusions are drawn based on the relevant analyses.
- The annual variability is mainly contributed to by the winter variability. The precipitation intensity is diversified due to the difference in spatial variability between the monthly precipitation amount and the number of precipitation days. The contributions of different months to seasonal variability are different. A high contribution is detected in March for spring and in December for the winter period.
- More variability during 2001–2010 is found for the precipitation time series in January, May, June, and July when we consider precipitation days. Regarding the precipitation amount, the variability in February, June, and July has increased in the recent decade.
- The variability in terms of the precipitation amount and precipitation days decreases from the western part of the Hexi corridor to the eastern part of the region, which indicates more precipitation uncertainty is accommodated in the western part. From the temporal domain, the variability in the recent decade is relatively stronger than the previous decades.
- The crop yield in historical periods is correlated with the precipitation intensity disorder index for the middle reaches of the Hexi corridor.
Extreme hydrological events may occur for highly disordered regions, which could induce negative effects on agriculture and reduce the crop production. Careful and early water management strategies should be proposed and particularly designed for these areas to mitigate the possible crop losses.
Acknowledgments
This research is supported by the National Training Program of Innovation and Entrepreneurship for Undergraduates (201710019225) and the National Natural Science Foundation of China (51679233).
Author Contributions
The authors designed and performed the research together. Liang Cheng and Dehai Liao collected the data and conducted analysis. Jun Niu and Liang Cheng wrote the draft of the paper. All authors have read and approved the final manuscript.
Conflicts of Interest
The authors declare no conflict of interest.
References
- Mishra, A.K.; Özger, M.; Singh, V.P. An entropy-based investigation into the variability of precipitation. J. Hydrol. 2009, 370, 139–154. [Google Scholar] [CrossRef]
- Hulme, M.; Doherty, R.; Ngara, T.; New, M.; Lister, D. African climate change: 1900–2100. Clim. Res. 2001, 17, 145–168. [Google Scholar] [CrossRef]
- Easterling, D.R.; Evans, J.L.; Groisman, P.Y.; Karl, T.R.; Kunkel, K.E.; Ambenje, P. Observed variability and trends in extreme climate events: A brief review. Bull. Am. Meteorol. Soc. 2000, 81, 417–425. [Google Scholar] [CrossRef]
- Karl, T.R.; Knight, R.W. Secular trends of precipitation amount, frequency, and intensity in the United States. Bull. Am. Meteorol. Soc. 1998, 79, 231–241. [Google Scholar] [CrossRef]
- Wang, F.; Niu, J. The implication of climate signal for precipitation in the Heihe River basin, Northwest China. Adv. Meteorol. 2016, 2016, 1078617. [Google Scholar] [CrossRef]
- Shannon, C.E. A mathematical theory of communication. Bell. Syst. Tech. J. 1948, 27, 379–423. [Google Scholar] [CrossRef]
- Jaynes, E.T. Information theory and statistical mechanics, I. Phys. Rev. 1957, 106, 620–630. [Google Scholar] [CrossRef]
- Jaynes, E.T. Information and statistical mechanics, II. Phys. Rev. 1957, 108, 171–190. [Google Scholar] [CrossRef]
- Cui, H.; Singh, V.P. On the cumulative distribution function for entropy-based hydrologic modeling. Trans. ASABE 2012, 55, 429–438. [Google Scholar] [CrossRef]
- Cui, H.; Singh, V.P. Computation of suspended sediment discharge in open channels using Tsallis entropy—Based Methods and Empirical Formulas. J. Hydrol. Eng. 2013, 19, 18–25. [Google Scholar] [CrossRef]
- Cui, H.; Singh, V.P. Configurational entropy theory for streamflow forecasting. J. Hydrol. 2015, 521, 1–7. [Google Scholar] [CrossRef]
- Cui, H.; Singh, V.P. Minimum relative entropy theory for streamflow forecasting with frequency as a random variable. Stoch. Environ. Res. Risk Assess. 2016, 30, 1545–1563. [Google Scholar] [CrossRef]
- Singh, V.P. The use of entropy in hydrology and water resources. Hydrol. Process. 1997, 11, 587–626. [Google Scholar] [CrossRef]
- Singh, V.P. Entropy Theory in Hydrologic Science and Engineering; McGraw-Hill Education: New York, NY, USA, 2015. [Google Scholar]
- Sivakumar, B. Chaos theory in hydrology: Important issues and interpretations. J. Hydrol. 2000, 227, 1–20. [Google Scholar] [CrossRef]
- Sivakumar, B. Chaos Identification and Prediction Methods. In Chaos in Hydrology; Springer: Dordrecht, The Netherlands, 2017; pp. 173–197. [Google Scholar]
- Dwivedi, D.; Mohanty, B.P. Hot spots and persistence of nitrate in aquifers across scales. Entropy 2016, 18, 25. [Google Scholar] [CrossRef]
- Maruyama, T.; Kawachi, T.; Maeda, S. Entropy-based Assessments of Monthly Rainfall Variability. J. Rainwater Catchment Syst. 2002, 8, 21–25. [Google Scholar] [CrossRef]
- Khan, M.I.; Liu, D.; Fu, Q.; Azmat, M.; Luo, M.; Hu, Y.; Zhang, Y.; Abrar, F.M. Precipitation variability assessment of northeast China: Songhua River basin. J. Earth Syst. Sci. 2016, 125, 957–968. [Google Scholar] [CrossRef]
- Atieh, M.; Rudra, R.; Gharabaghi, B.; Lubitz, D. Investigating the Spatial and Temporal Variability of Precipitation using Entropy Theory. J. Water Manag. Model. 2017. [Google Scholar] [CrossRef]
- Arora, B.; Dwivedi, D.; Hubbard, S.S.; Steefel, C.I.; Williams, K.H. Identifying geochemical hot moments and their controls on a contaminated river-floodplain system using wavelet and entropy approaches. Environ. Model. Softw. 2016, 85, 27–41. [Google Scholar] [CrossRef]
Figure 1.
The Hexi corridor and the meteorological stations used in this study.
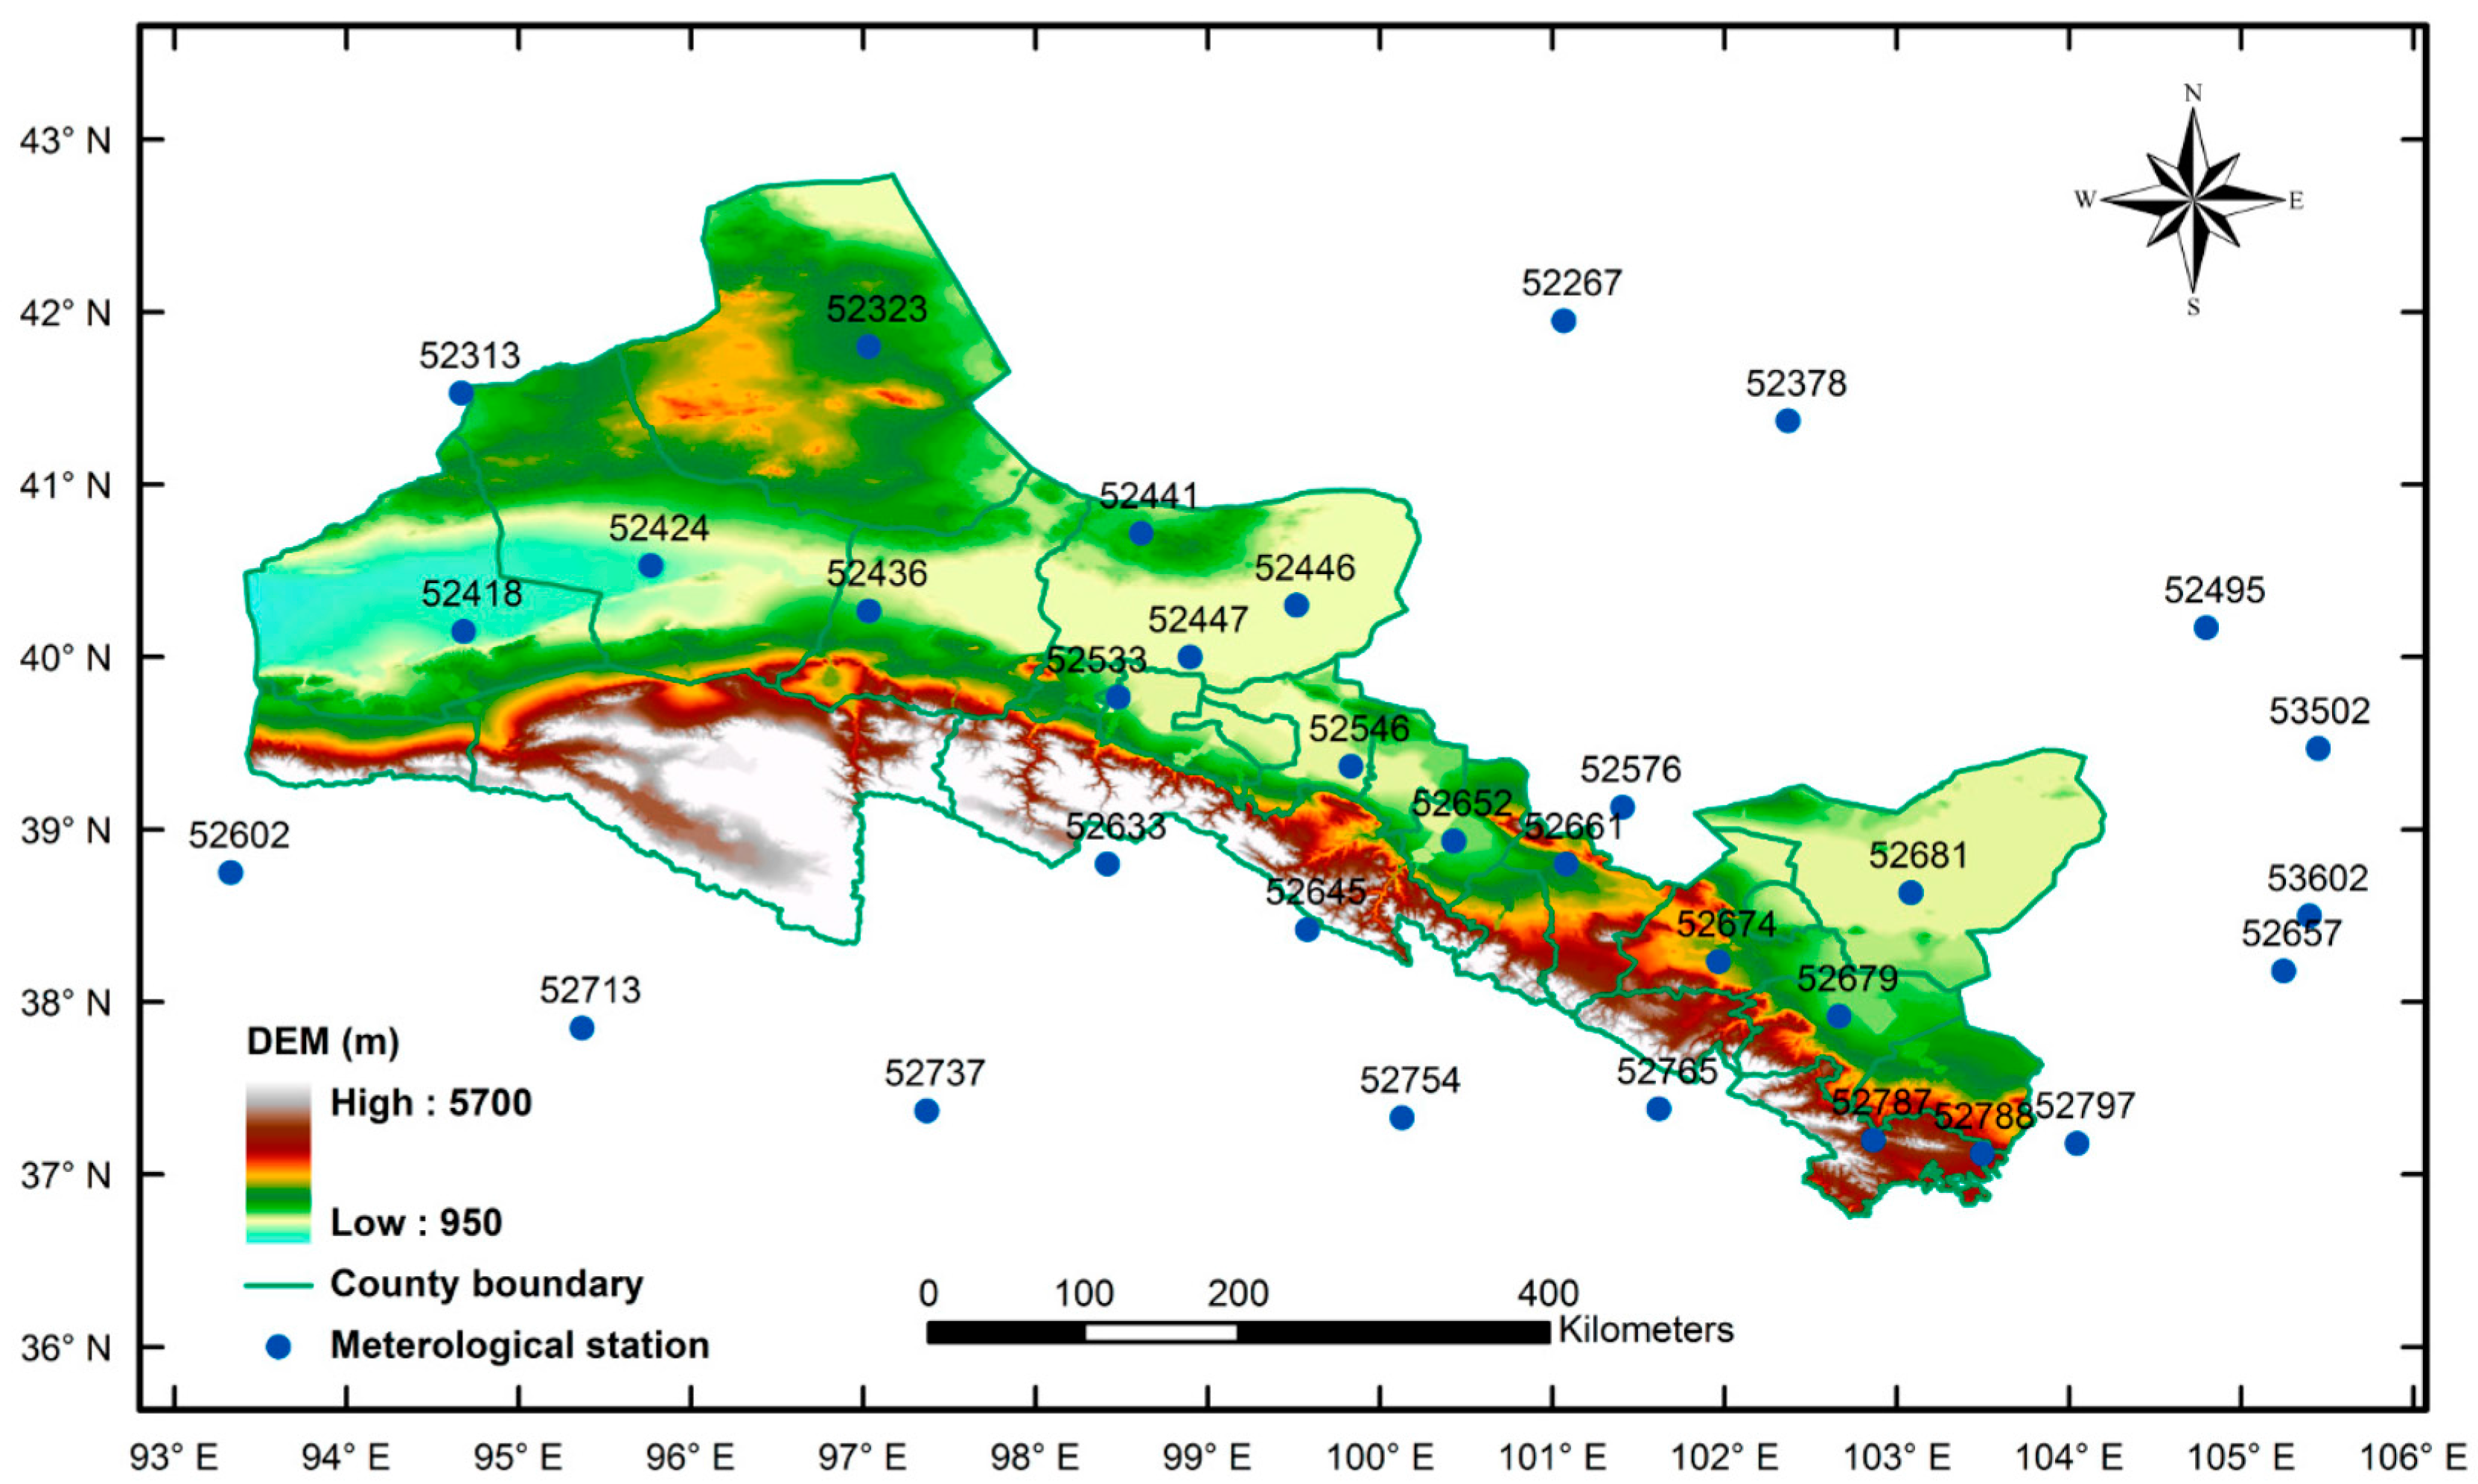
Figure 2.
Marginal disorder indices of annual and seasonal precipitation time series over the Hexi region, Northwest China.
Figure 2.
Marginal disorder indices of annual and seasonal precipitation time series over the Hexi region, Northwest China.

Figure 3.
Spatial distribution of mean annual precipitation (left panel) and marginal disorder index (MDI) (right panel) for annual time series over the Hexi corridor.
Figure 3.
Spatial distribution of mean annual precipitation (left panel) and marginal disorder index (MDI) (right panel) for annual time series over the Hexi corridor.
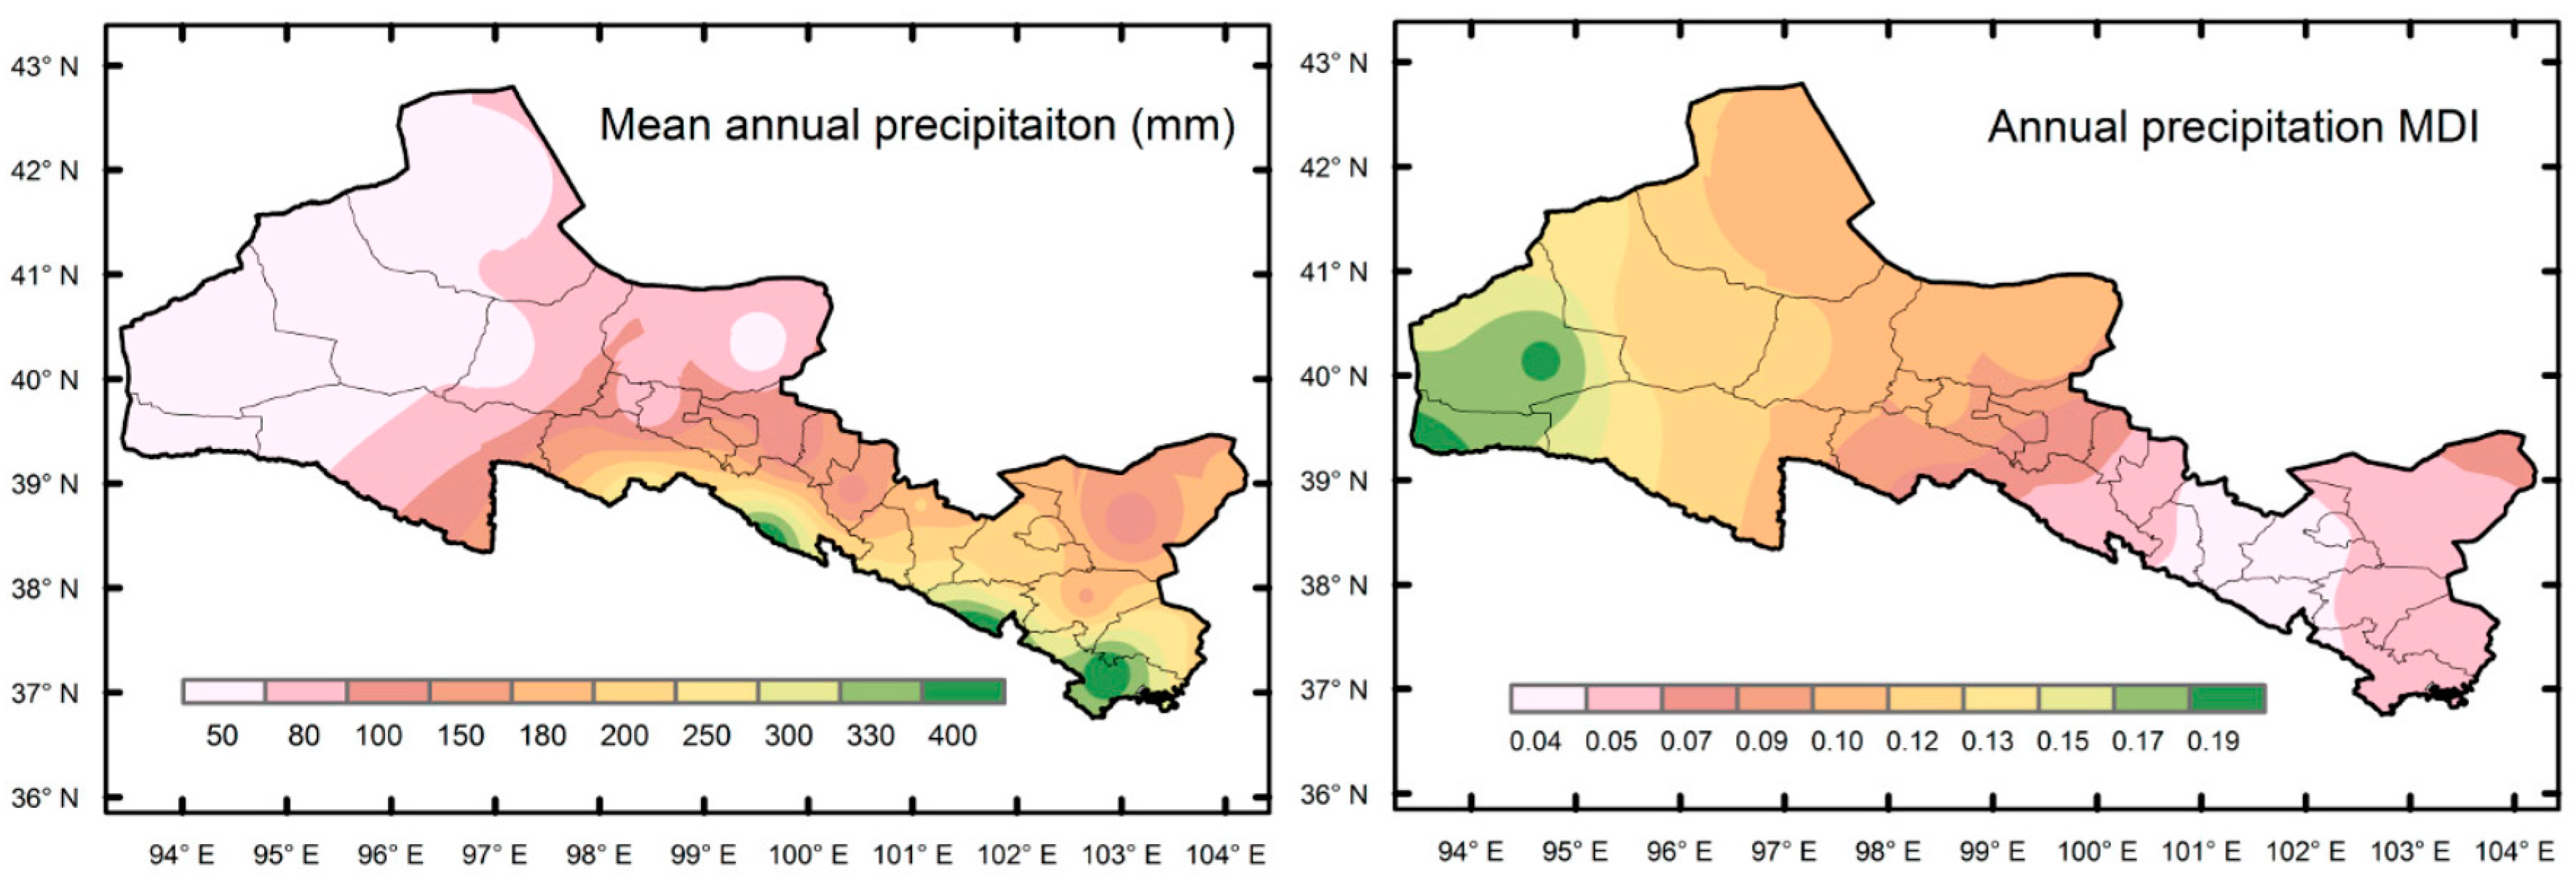
Figure 4.
Spatial distribution of marginal disorder index (MDI) of precipitation time series for (a) spring; (b) summer; (c) fall; and (d) winter seasons over the Hexi corridor.
Figure 4.
Spatial distribution of marginal disorder index (MDI) of precipitation time series for (a) spring; (b) summer; (c) fall; and (d) winter seasons over the Hexi corridor.
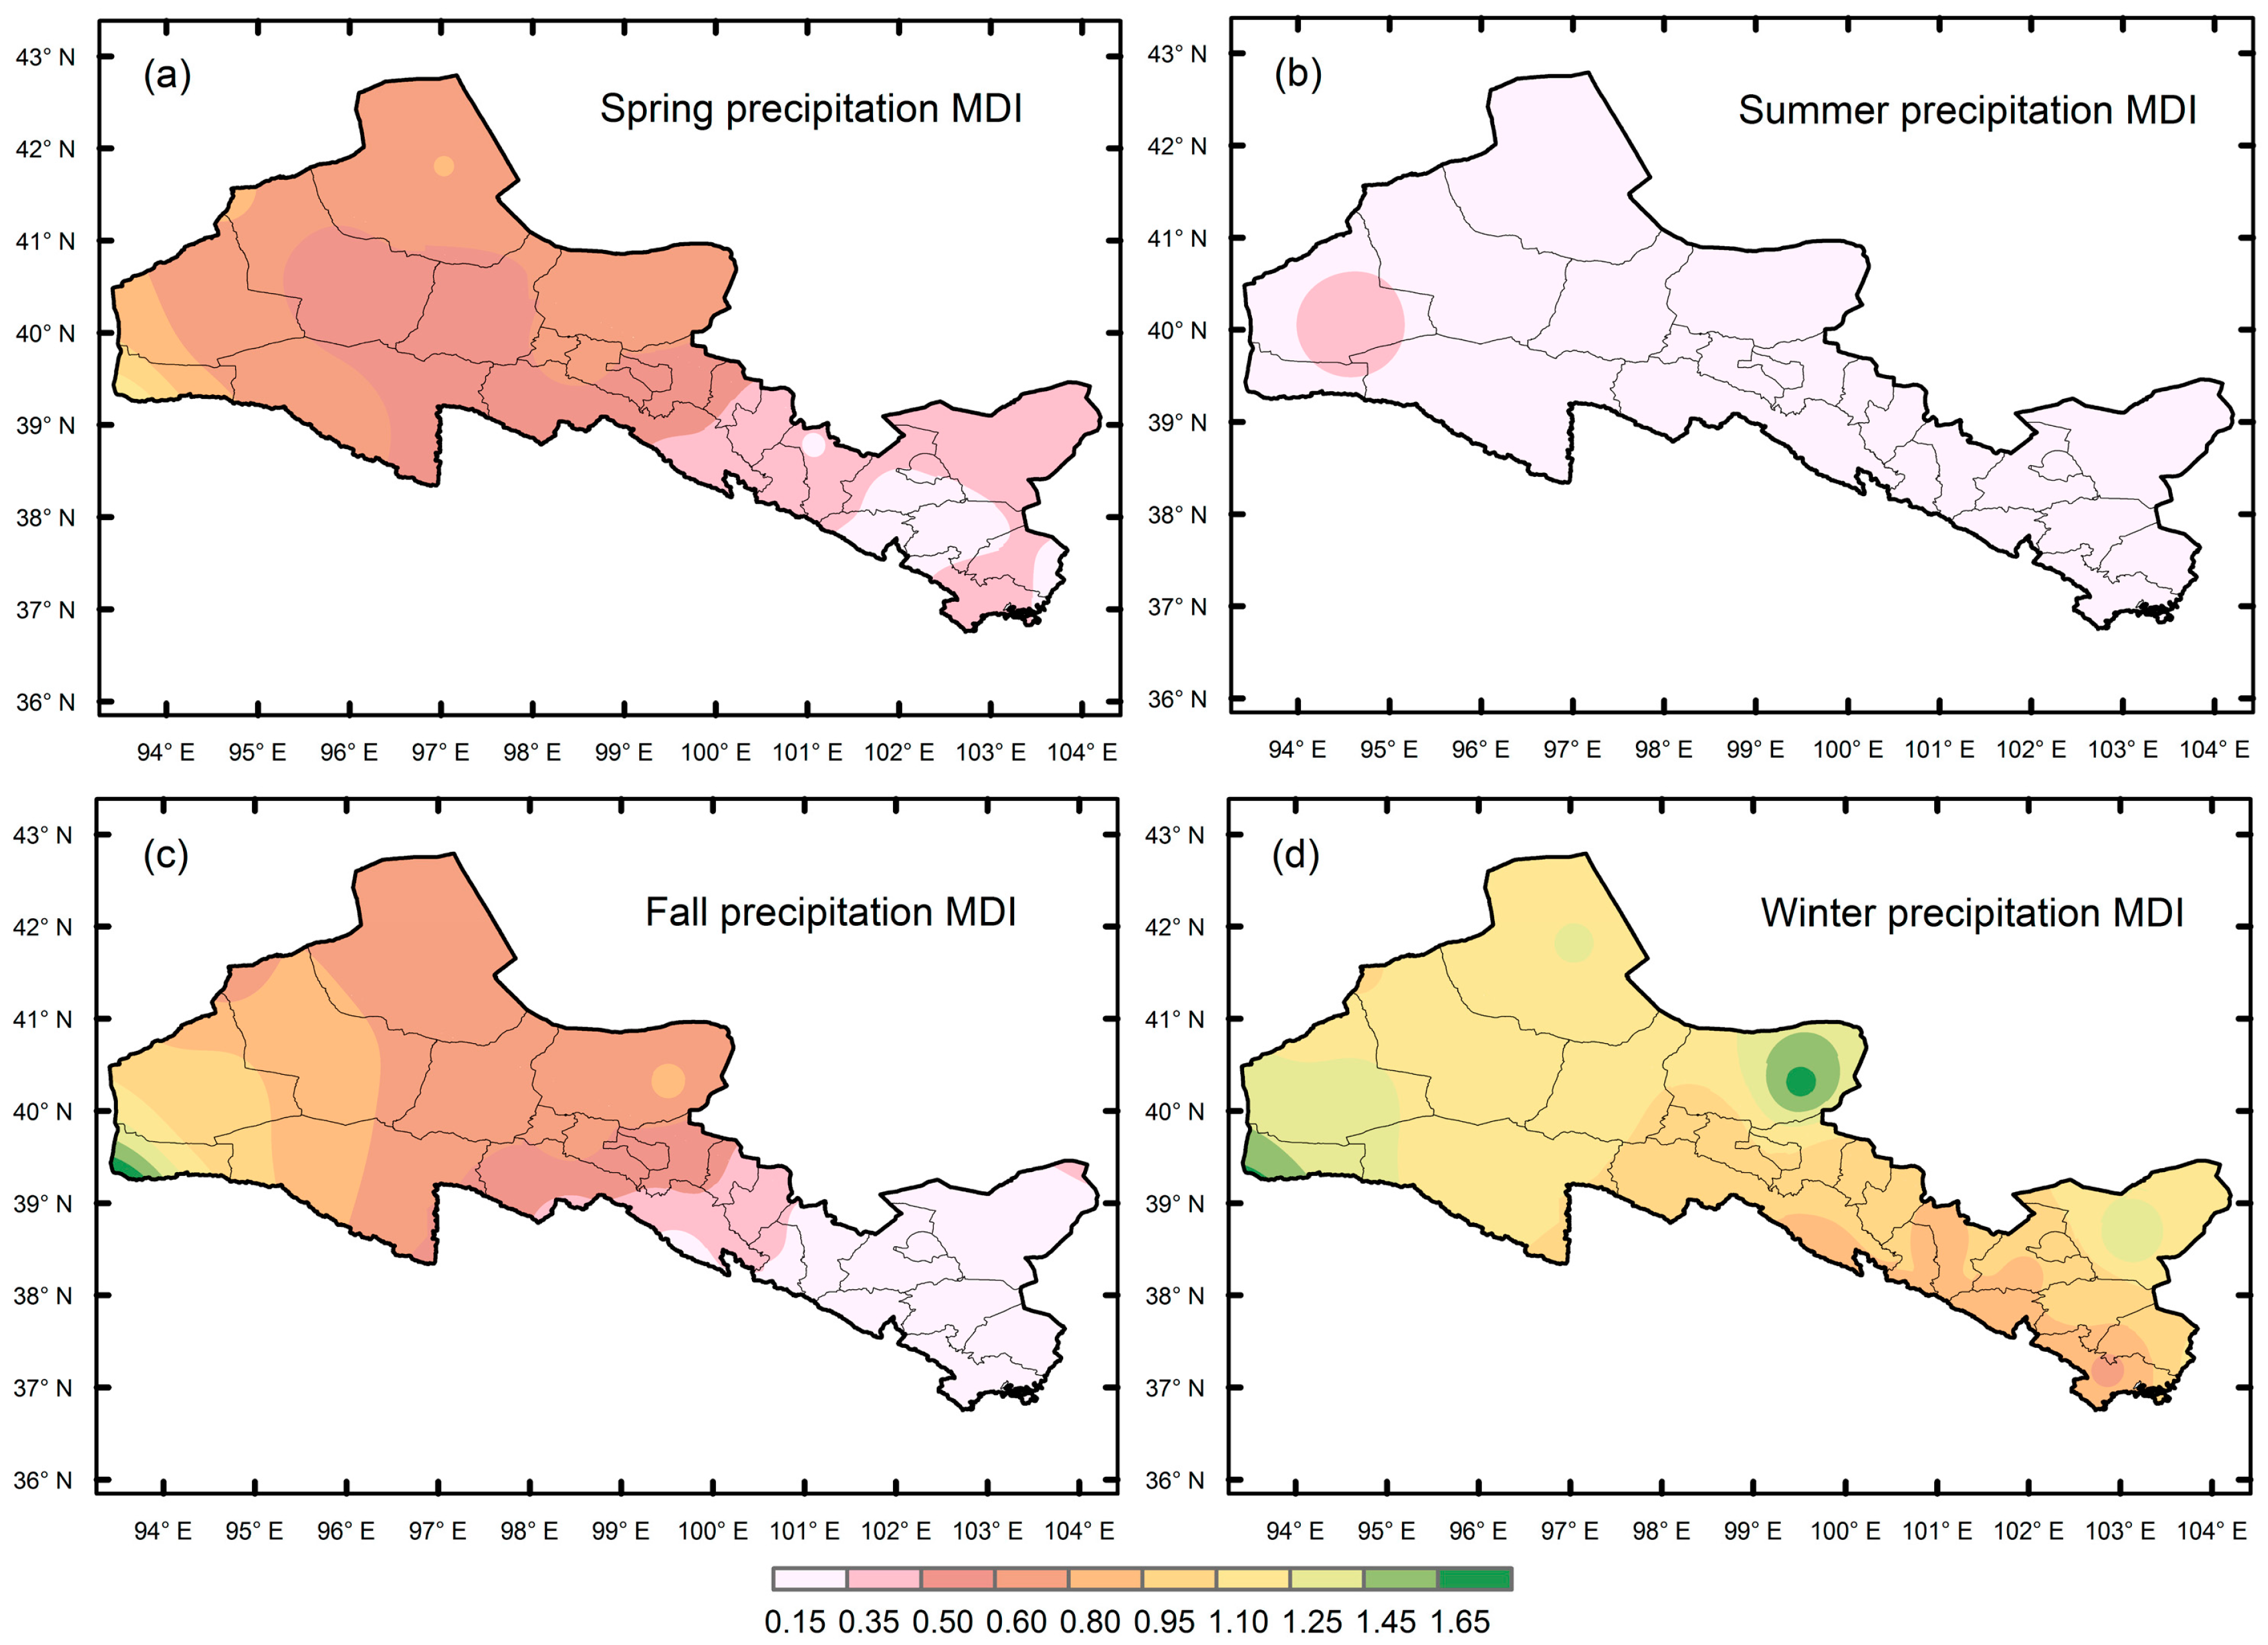
Figure 5.
Marginal disorder index (MDI) of precipitation time series over different stations for (a) spring; (b) summer; (c) fall; and (d) winter seasons and its respective months.
Figure 5.
Marginal disorder index (MDI) of precipitation time series over different stations for (a) spring; (b) summer; (c) fall; and (d) winter seasons and its respective months.


Figure 6.
(a) Mean apportionment disorder index (MDI) of precipitation time series of all stations for the period of 1961–2015; the central line is the long-term mean value; (b) same as (a), but for mean intensity disorder index (IDI).
Figure 6.
(a) Mean apportionment disorder index (MDI) of precipitation time series of all stations for the period of 1961–2015; the central line is the long-term mean value; (b) same as (a), but for mean intensity disorder index (IDI).

Figure 7.
(a) Mean apportionment disorder index (MDI) of precipitation time series for different stations for the period of 1961–2015. The central line is the long-term mean value; (b) same as (a), but for mean intensity disorder index (IDI).
Figure 7.
(a) Mean apportionment disorder index (MDI) of precipitation time series for different stations for the period of 1961–2015. The central line is the long-term mean value; (b) same as (a), but for mean intensity disorder index (IDI).
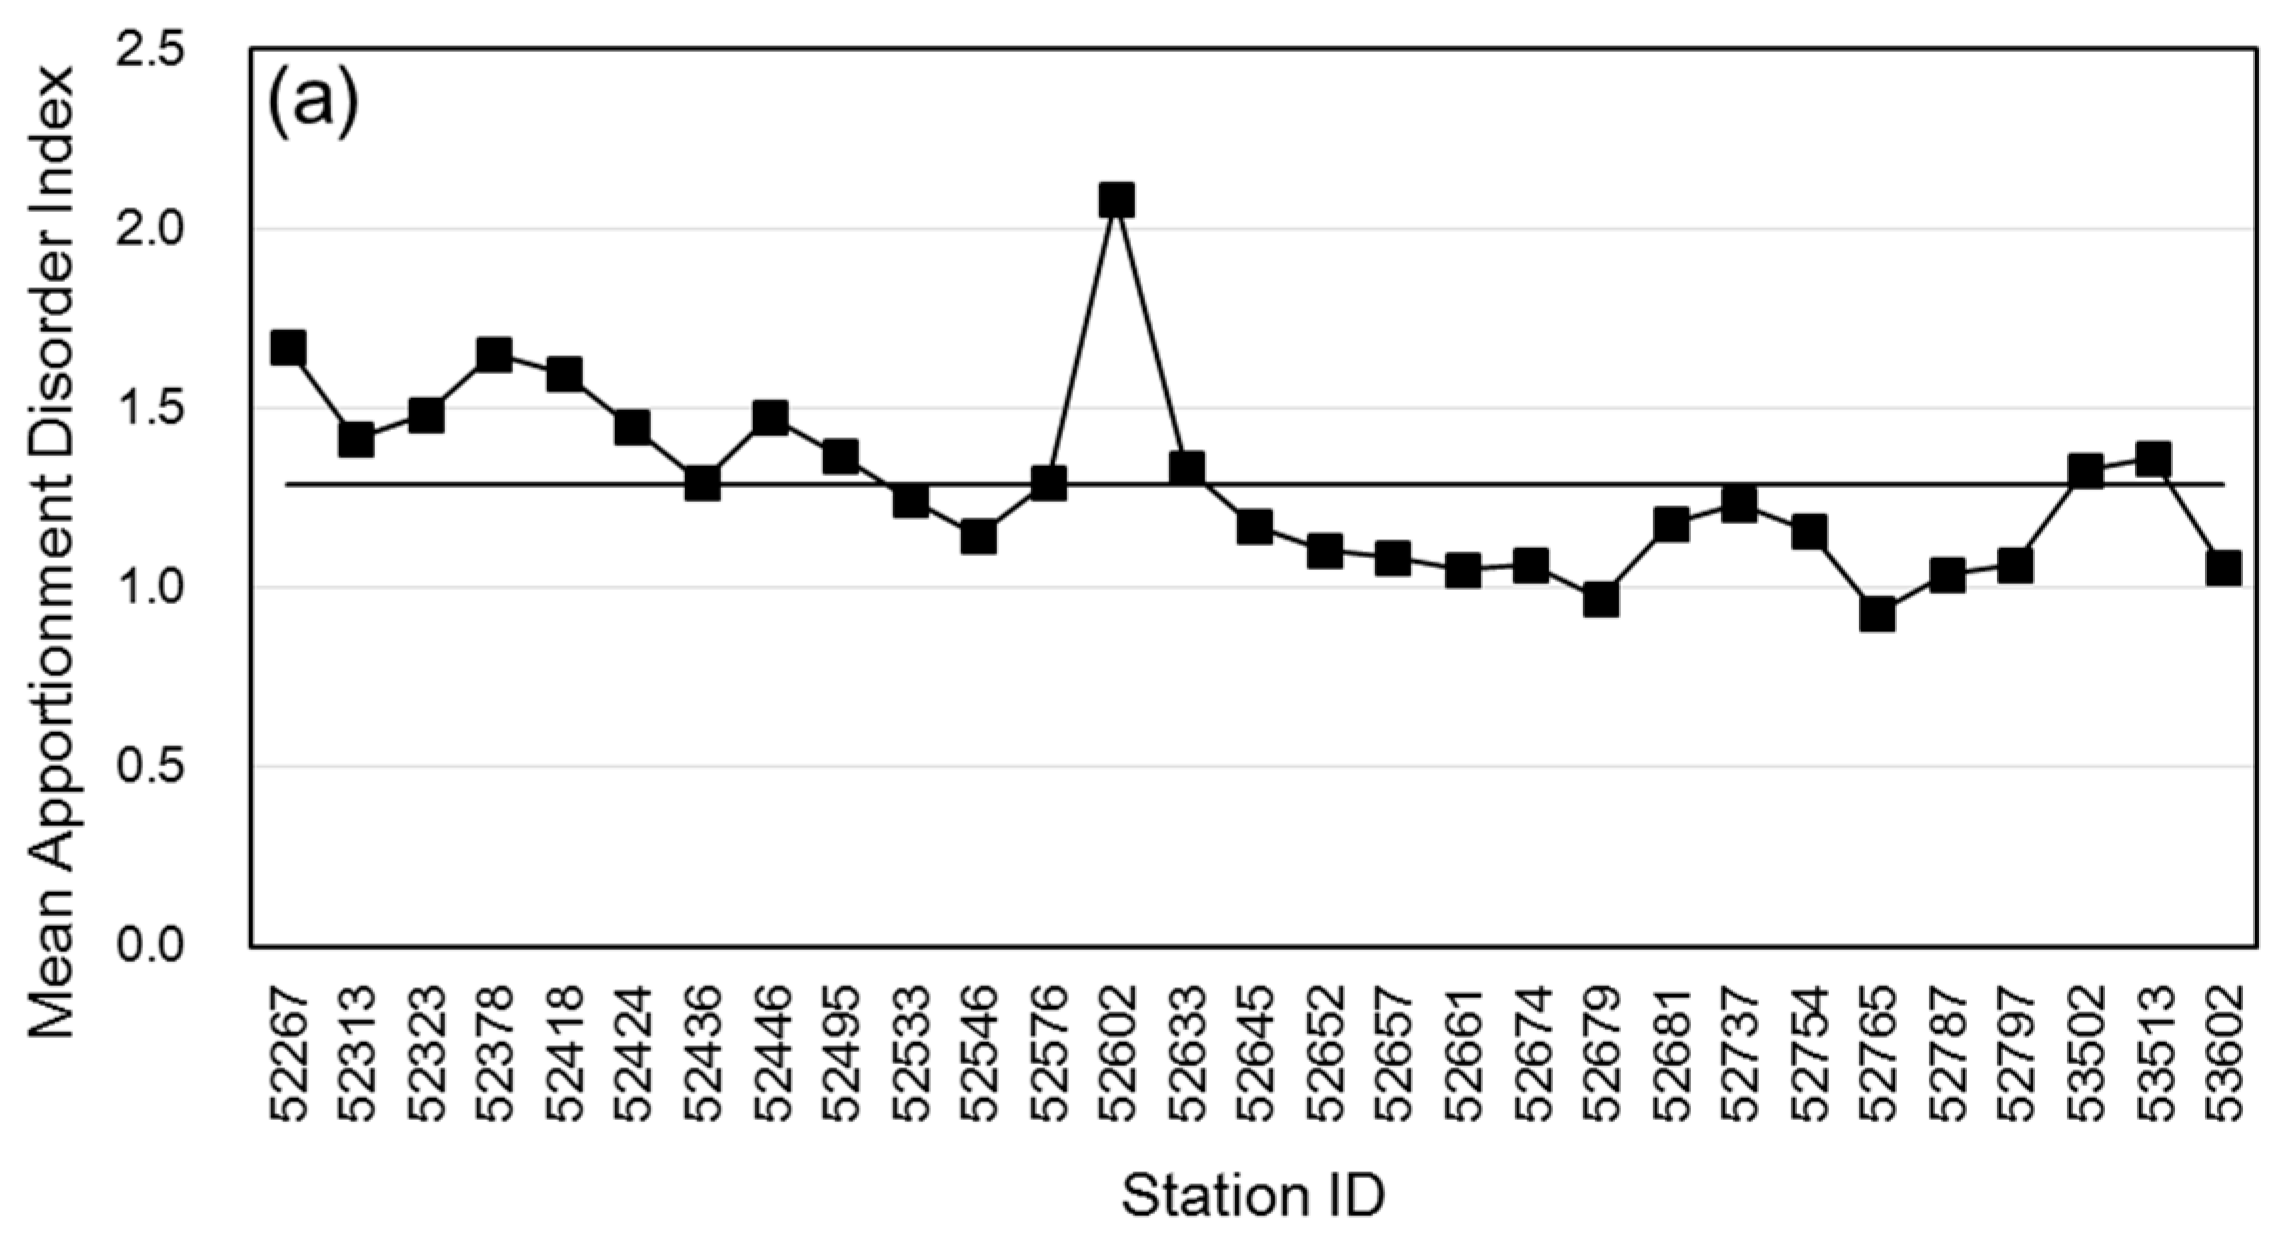

Figure 8.
(a) The distribution of apportionment disorder index of precipitation time series over the Hexi corridor; (b) the contribution of individual station to overall precipitation in the region; (c) same as (a), but for intensity disorder index; (d) same as (b), but for a number of precipitation days in the area.
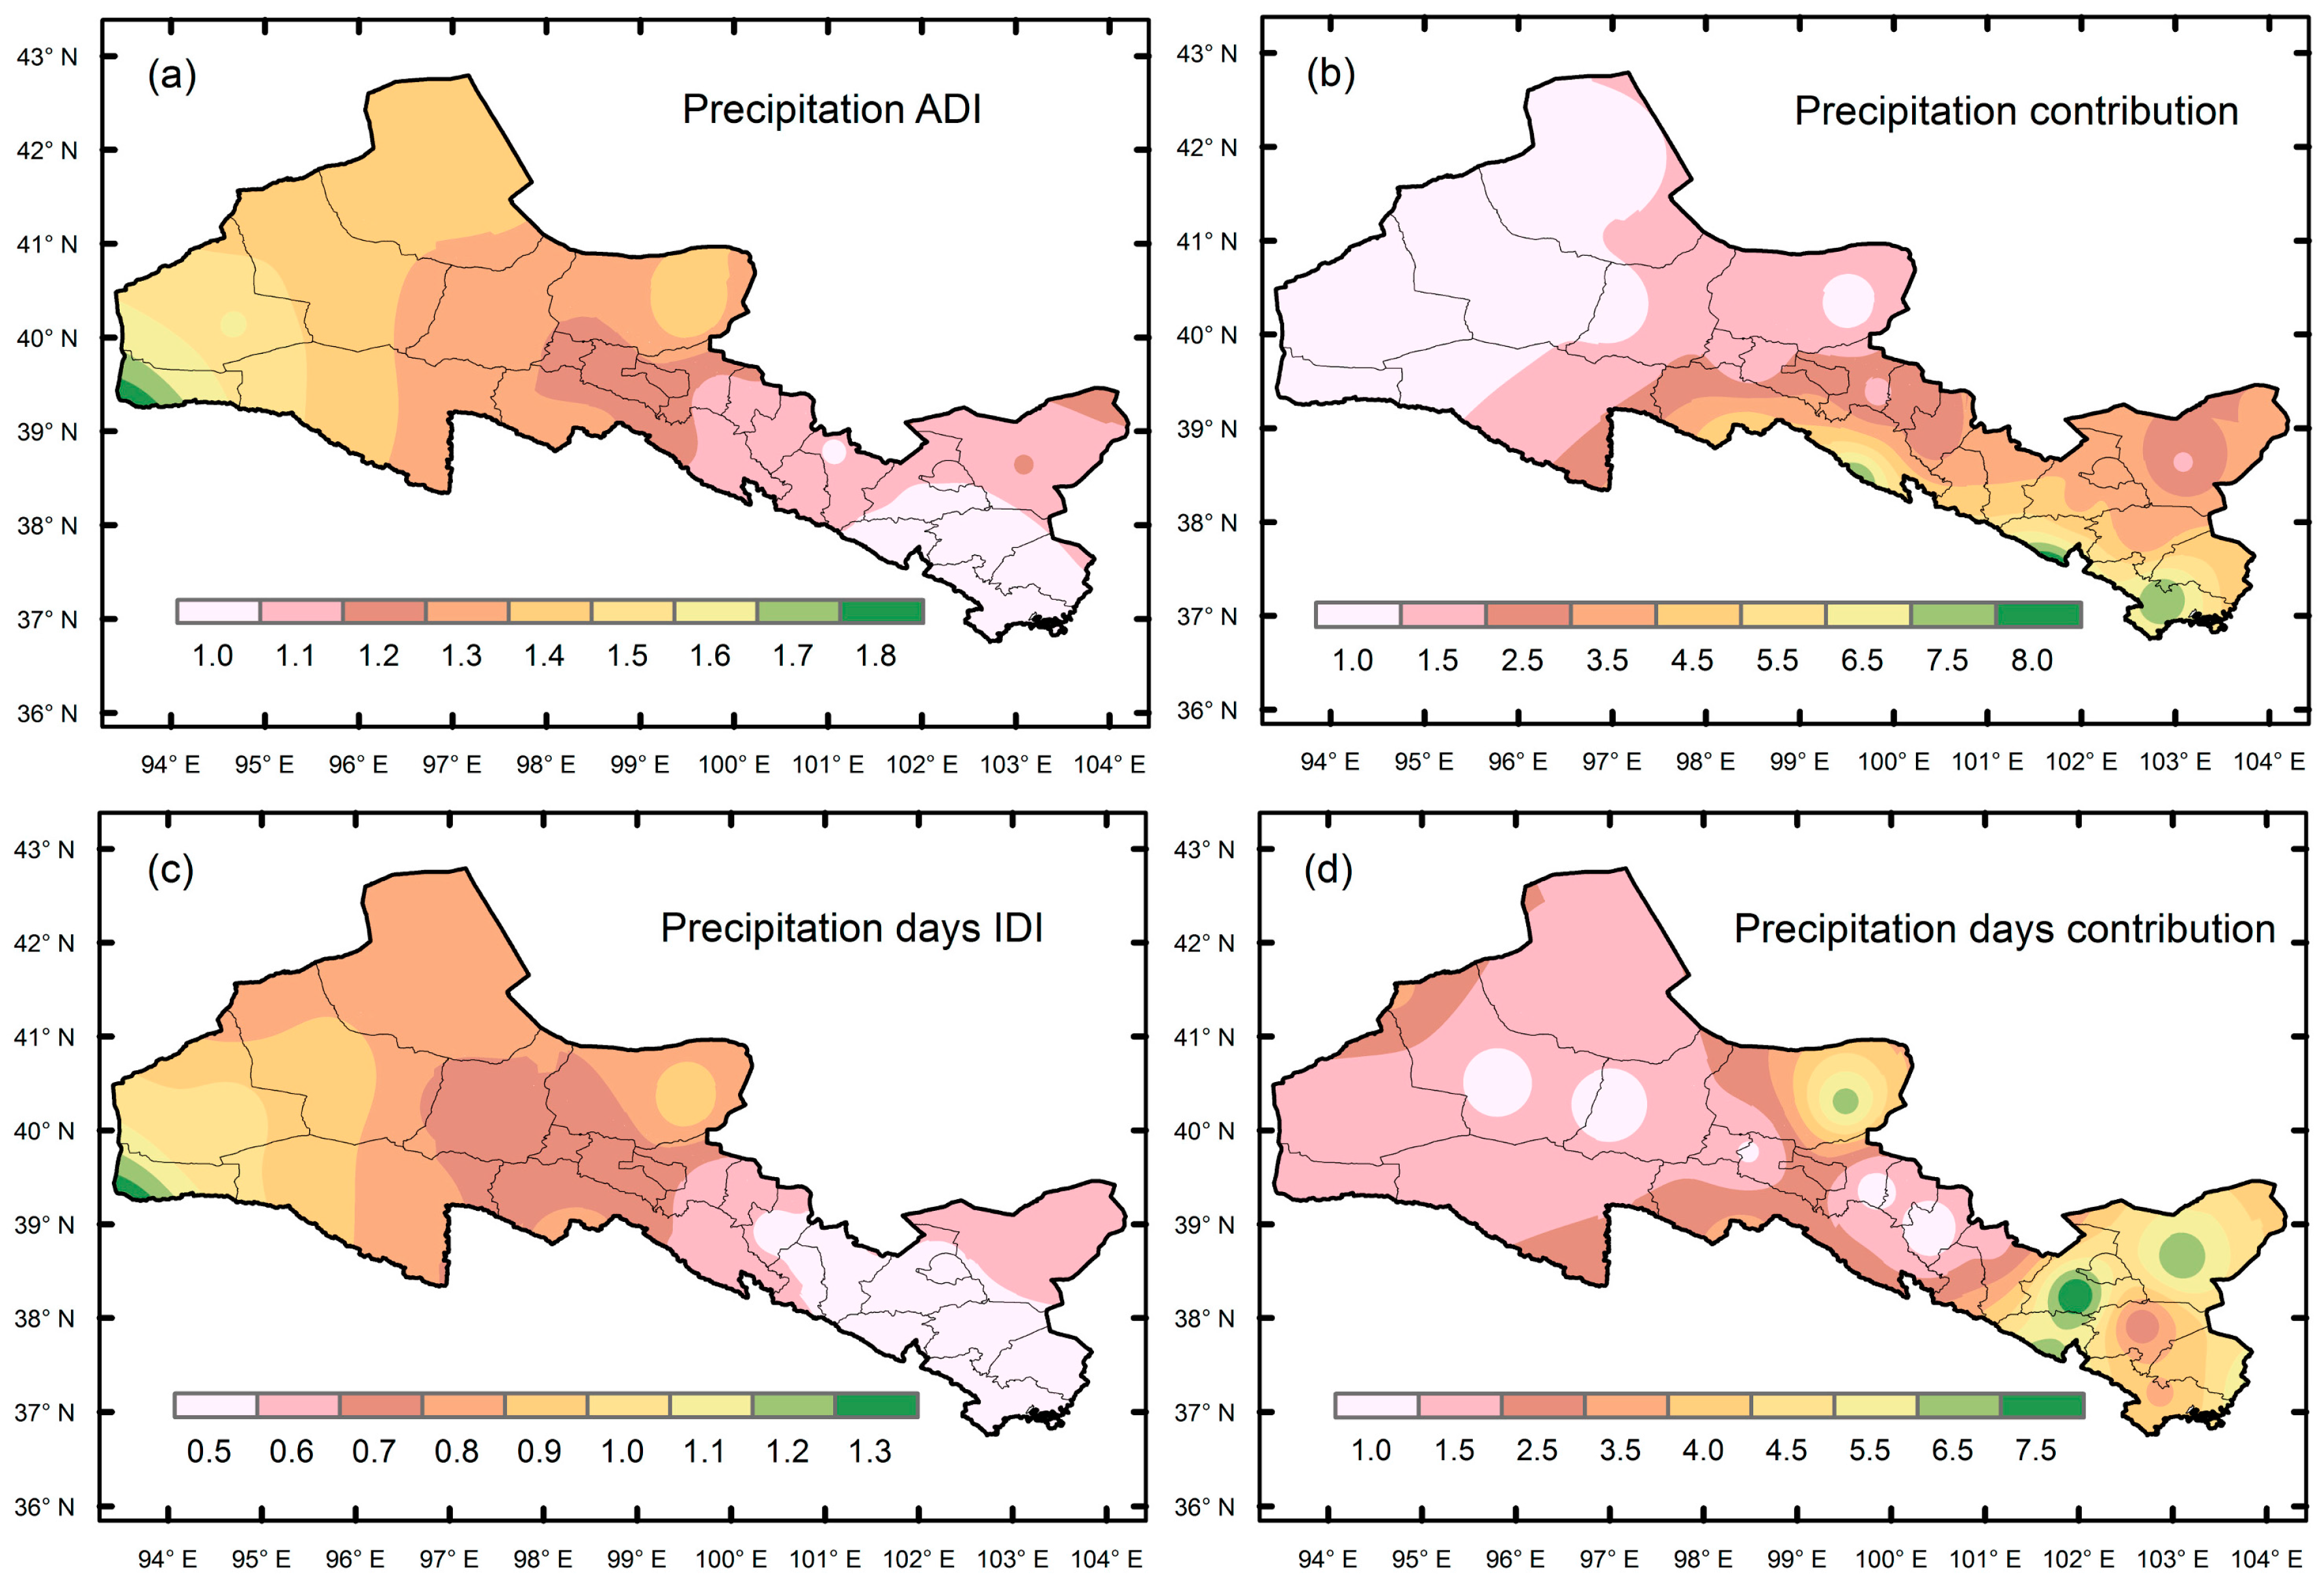
Figure 9.
(a) Mean decadal apportionment disorder index of precipitation time series at different timescales; (b) same as (a), but for mean decadal intensity disorder index.
Figure 9.
(a) Mean decadal apportionment disorder index of precipitation time series at different timescales; (b) same as (a), but for mean decadal intensity disorder index.
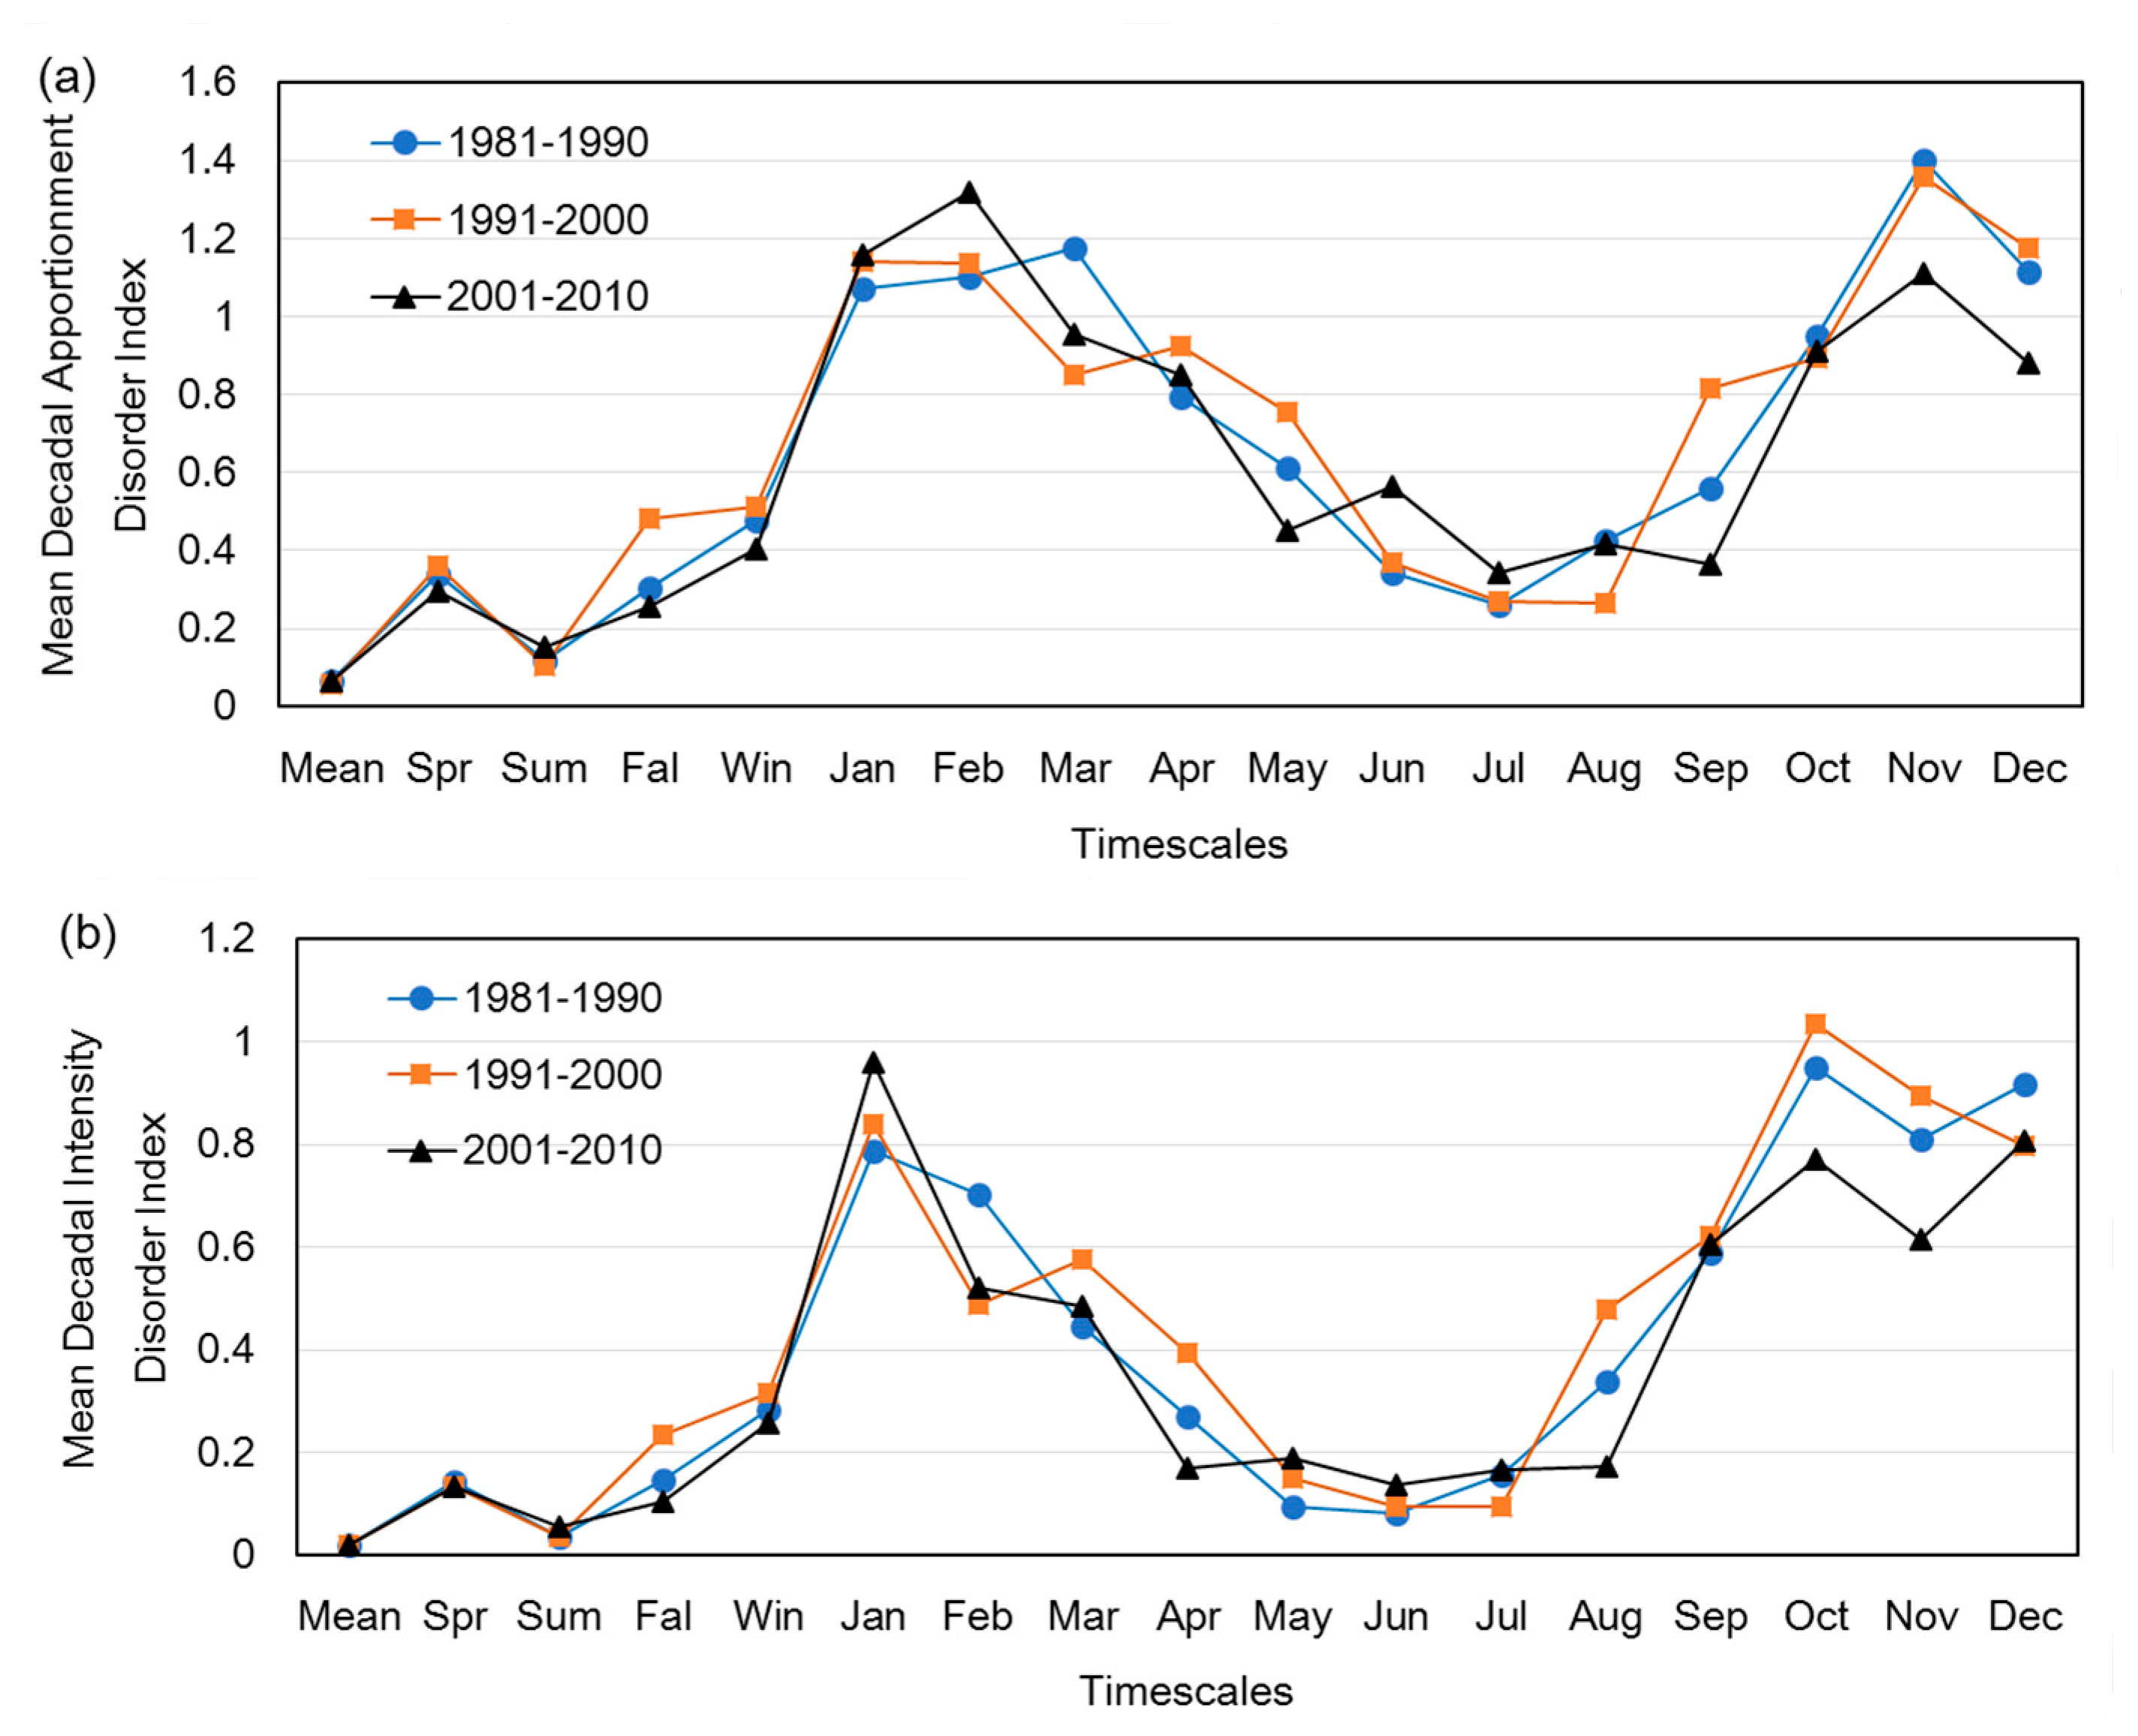
Figure 10.
A comparison between crop and precipitation indices for the counties in the middle of the Hexi corridor.
Figure 10.
A comparison between crop and precipitation indices for the counties in the middle of the Hexi corridor.
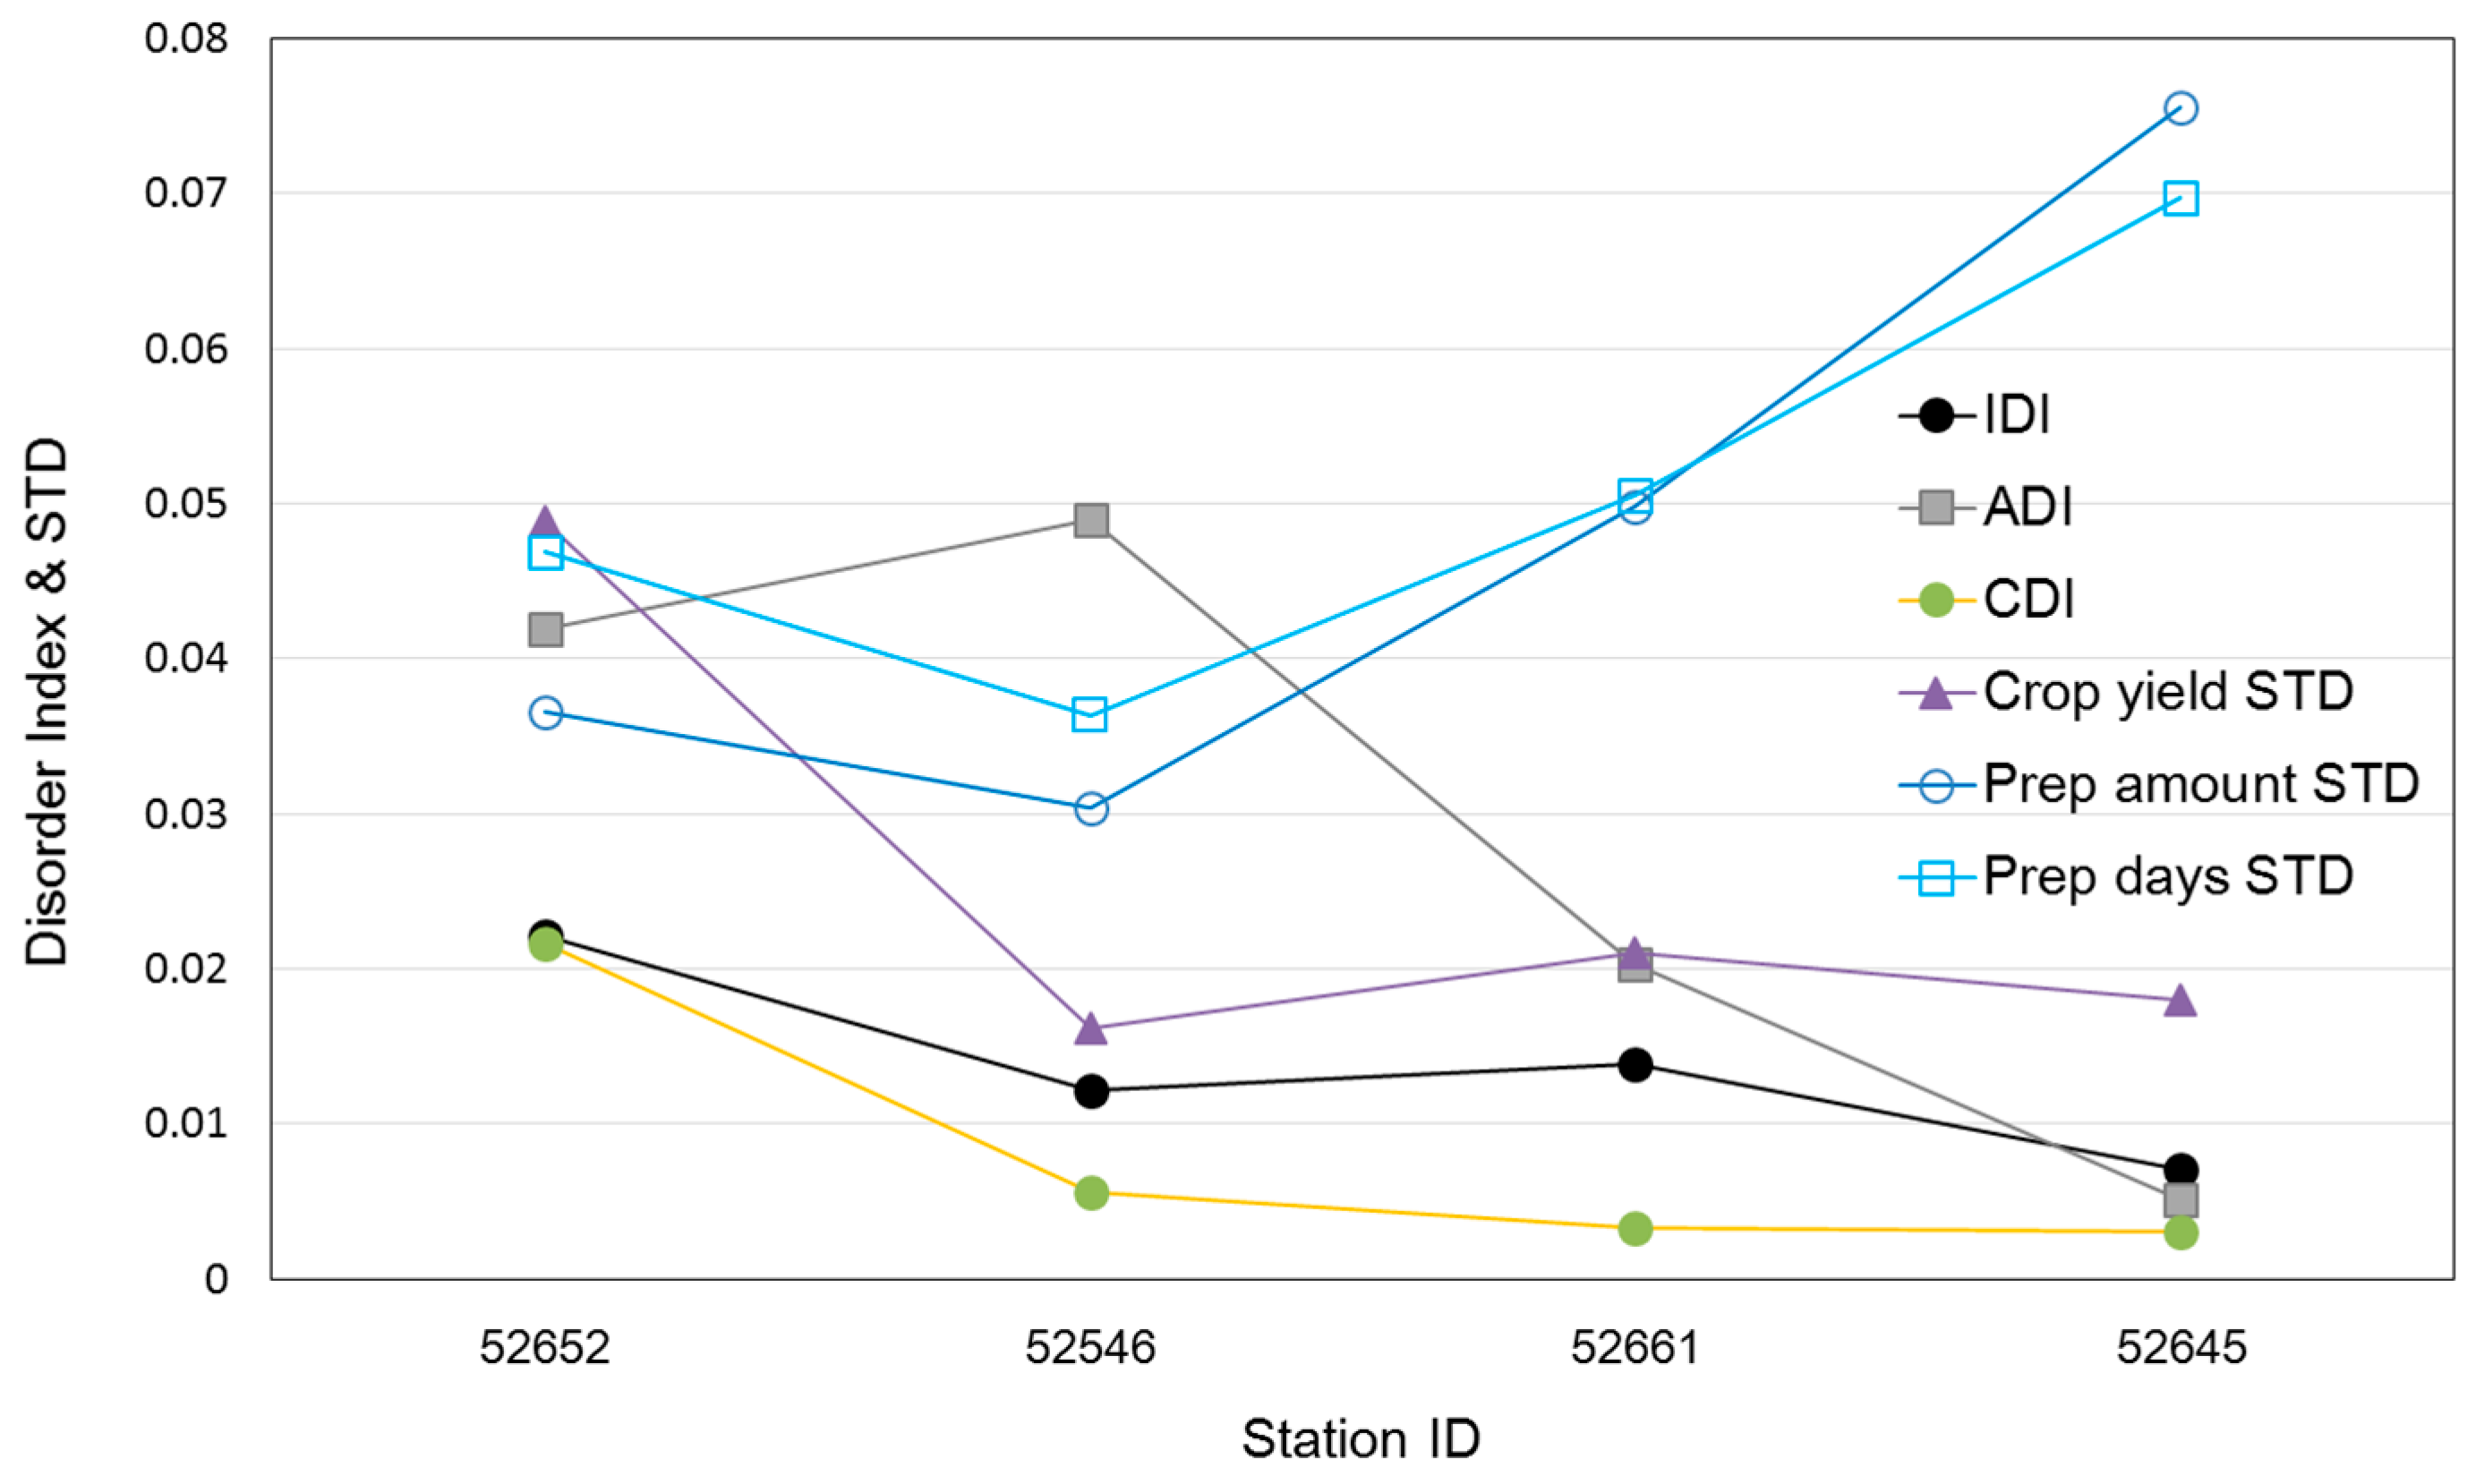
Figure 11.
(a) Mean decadal apportionment disorder index of monthly temperature time series; (b) same as (a), but for wind speed.
Figure 11.
(a) Mean decadal apportionment disorder index of monthly temperature time series; (b) same as (a), but for wind speed.

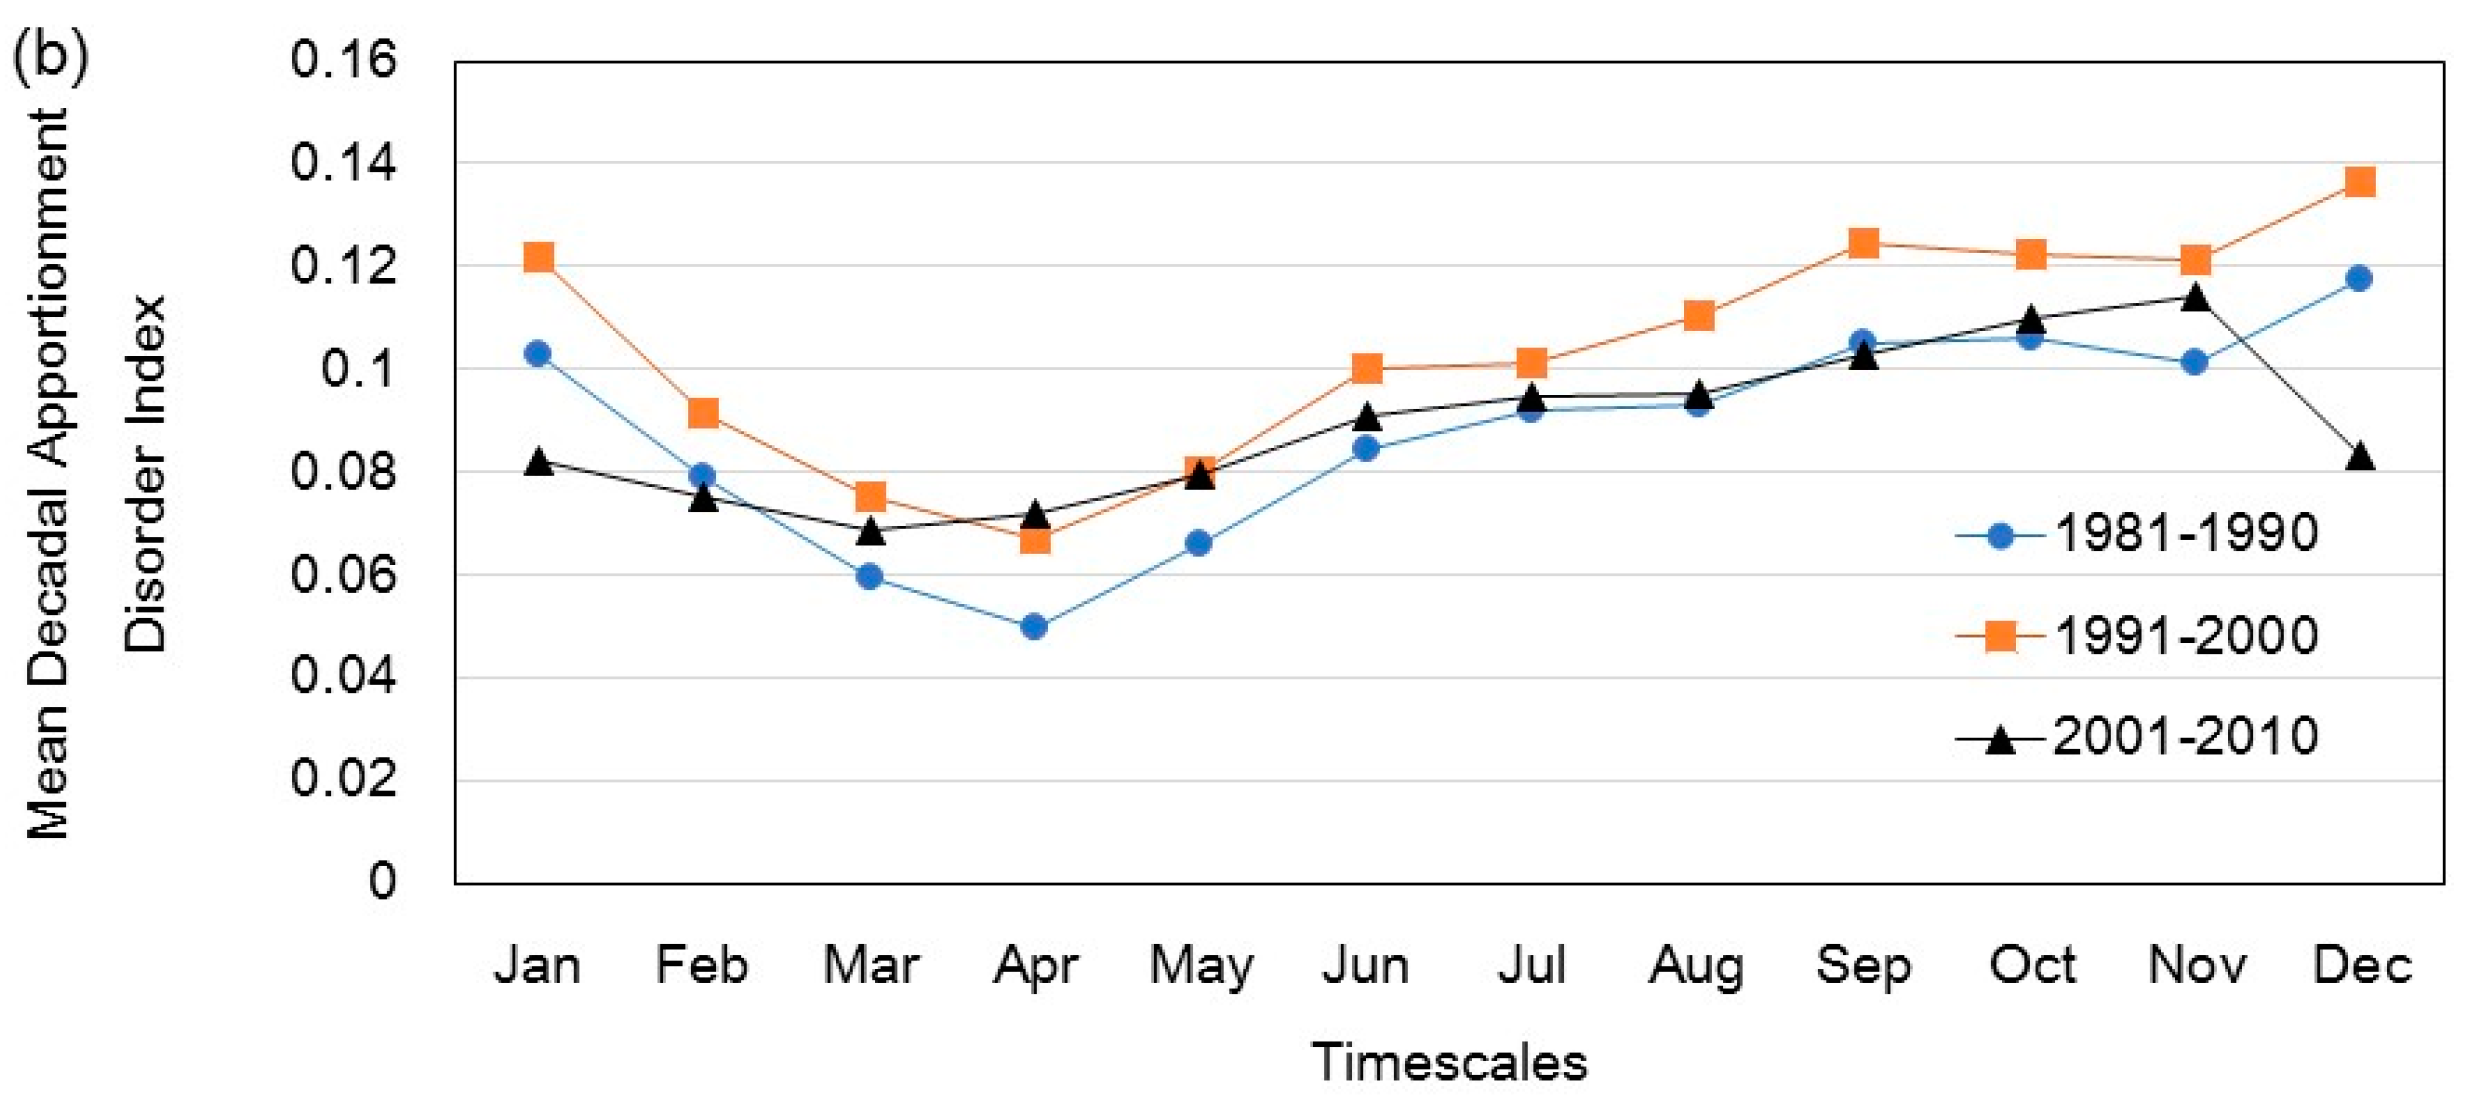
Figure 12.
The relationships between temperature and precipitation on a monthly timescale for the studied stations.
Figure 12.
The relationships between temperature and precipitation on a monthly timescale for the studied stations.

Figure 13.
The comparisons between temperature, wind speed, crops, and precipitation disorder index for the counties in the middle of the Hexi corridor.
Figure 13.
The comparisons between temperature, wind speed, crops, and precipitation disorder index for the counties in the middle of the Hexi corridor.

Table 1.
Geophysical information of 29 meteorological stations.
| Station No. | Station ID | Latitude (Decimal Degrees) | Longitude (Decimal Degrees) |
|---|---|---|---|
| 1 | 52267 | 41.95 | 101.07 |
| 2 | 52313 | 41.53 | 94.67 |
| 3 | 52323 | 41.80 | 97.03 |
| 4 | 52378 | 41.37 | 102.37 |
| 5 | 52418 | 40.15 | 94.68 |
| 6 | 52424 | 40.53 | 95.77 |
| 7 | 52436 | 40.27 | 97.03 |
| 8 | 52446 | 40.30 | 99.52 |
| 9 | 52495 | 40.17 | 104.80 |
| 10 | 52533 | 39.77 | 98.48 |
| 11 | 52546 | 39.37 | 99.83 |
| 12 | 52576 | 39.13 | 101.41 |
| 13 | 52602 | 38.75 | 93.33 |
| 14 | 52633 | 38.80 | 98.42 |
| 15 | 52645 | 38.42 | 99.58 |
| 16 | 52652 | 38.93 | 100.43 |
| 17 | 52657 | 38.18 | 105.25 |
| 18 | 52661 | 38.80 | 101.08 |
| 19 | 52674 | 38.23 | 101.97 |
| 20 | 52679 | 37.92 | 102.67 |
| 21 | 52681 | 38.63 | 103.08 |
| 22 | 52737 | 37.37 | 97.37 |
| 23 | 52754 | 37.33 | 100.13 |
| 24 | 52765 | 37.38 | 101.62 |
| 25 | 52787 | 37.20 | 102.87 |
| 26 | 52797 | 37.18 | 104.05 |
| 27 | 53502 | 39.47 | 105.45 |
| 28 | 53513 | 40.45 | 107.25 |
| 29 | 53602 | 38.50 | 105.40 |
Table 2.
Statistical properties for precipitation time series (1981–2010) of the analyzed 29 stations.
Table 2.
Statistical properties for precipitation time series (1981–2010) of the analyzed 29 stations.
| Station No. | Station ID | ATP/MTP (mm) | ATD/MTD (Day) | ||||||
|---|---|---|---|---|---|---|---|---|---|
| Max. | Min. | Mean | STD | Max. | Min. | Mean | STD | ||
| 1 | 52267 | 77.3/45.5 | 7.0/0 | 34.2/2.8 | 18.2/5.7 | 32/15 | 10/0 | 19.9/1.7 | 5.4/2.1 |
| 2 | 52313 | 95.3/40.9 | 16.9/0 | 50.5/4.2 | 19.5/6.9 | 42/10 | 22/0 | 30.0/2.5 | 5.7/2.1 |
| 3 | 52323 | 114.9/56.7 | 30.1/0 | 63.8/5.3 | 26.5/9.2 | 60/13 | 23/0 | 33.8/2.8 | 7.9/2.5 |
| 4 | 52378 | 105.2/54.6 | 13.9/0 | 42.1/3.5 | 23.9/7.2 | 26/10 | 12/0 | 18.4/1.5 | 3.6/1.8 |
| 5 | 52418 | 105.3/81.7 | 11.6/0 | 42.6/3.5 | 21.4/7.2 | 34/10 | 14/0 | 22.4/1.9 | 4.8/2.0 |
| 6 | 52424 | 83.6/53.0 | 19.0/0 | 50.8/4.2 | 15.7/6.8 | 40/10 | 19/0 | 25.6/2.1 | 5.2/2.2 |
| 7 | 52436 | 123.0/53.3 | 33.6/0 | 66.5/5.5 | 19.6/7.8 | 49/11 | 25/0 | 35.2/2.9 | 5.9/2.4 |
| 8 | 52446 | 108.5/58.6 | 28.4/0 | 60.4/5.0 | 21.6/8.6 | 42/14 | 19/0 | 30.8/2.6 | 6.2/2.7 |
| 9 | 52495 | 187.5/76.9 | 42.8/0 | 104.5/8.7 | 38.9/13.9 | 53/13 | 21/0 | 36.6/3.0 | 6.9/3.0 |
| 10 | 52533 | 157.3/67.8 | 41.4/0 | 88.4/7.4 | 30.3/10.9 | 60/13 | 28/0 | 39.4/3.3 | 7.5/2.8 |
| 11 | 52546 | 191.0/69.7 | 54.9/0 | 119.0/9.9 | 30.4/12.6 | 64/16 | 35/0 | 49.1/4.1 | 7.3/3.3 |
| 12 | 52576 | 197.6/98.0 | 76.6/0 | 134.8/11.2 | 30.8/16.7 | 65/16 | 34/0 | 48.8/4.1 | 7.9/3.6 |
| 13 | 52602 | 35.8/19.5 | 5.2/0 | 15.4/1.3 | 7.2/2.6 | 22/8 | 6/0 | 12.9/1.1 | 4.3/1.5 |
| 14 | 52633 | 404.4/152.4 | 180.7/0 | 309.7/25.8 | 57.7/33.5 | 109/23 | 74/0 | 88.3/7.4 | 10.3/6.3 |
| 15 | 52645 | 602.3/151.0 | 274.9/0 | 426.4/35.5 | 75.5/41.5 | 159/28 | 100/0 | 125.5/10.5 | 13.9/7.4 |
| 16 | 52652 | 216.3/90.3 | 71.6/0 | 132.6/11.0 | 36.6/14.4 | 73/15 | 37/0 | 53.9/4.5 | 9.4/3.4 |
| 17 | 52657 | 573.1/162.4 | 331.0/0 | 415.1/34.6 | 61.5/40.1 | 139/26 | 87/0 | 112.0/9.3 | 12.7/7.1 |
| 18 | 52661 | 301.2/107.8 | 97.8/0 | 202.6/16.9 | 49.8/20.8 | 93/17 | 51/0 | 68.4/5.7 | 10.1/3.8 |
| 19 | 52674 | 294.6/128.0 | 110.5/0 | 211.7/17.6 | 40.4/22.3 | 95/20 | 52/0 | 73.4/6.1 | 11.9/4.5 |
| 20 | 52679 | 251.3/111.9 | 101.6/0 | 171.0/14.3 | 40.8/17.8 | 83/14 | 46/0 | 60.9/5.1 | 7.9/3.6 |
| 21 | 52681 | 202.0/73.2 | 52.0/0 | 113.2/9.4 | 29.9/13.1 | 53/14 | 24/0 | 39.7/3.3 | 7.9/3.0 |
| 22 | 52737 | 354.9/145.1 | 128.4/0 | 214.3/17.9 | 58.1/24.2 | 87/20 | 36/0 | 59.8/5.0 | 12.2/4.5 |
| 23 | 52754 | 535.7/162.3 | 263.7/0 | 411.9/34.3 | 61.2/40.6 | 141/26 | 89/0 | 110.7/9.2 | 11.9/7.5 |
| 24 | 52765 | 730.7/201.2 | 404.0/0 | 531.1/44.3 | 72.3/44.2 | 153/26 | 107/0 | 130.8/10.9 | 13.7/6.9 |
| 25 | 52787 | 543.3/172.2 | 274.0/0 | 407.0/33.9 | 58.6/36.4 | 183/27 | 112/0 | 140.5/11.7 | 13.7/5.8 |
| 26 | 52797 | 298.4/95.4 | 94.8/0 | 179.8/15.0 | 54.3/19.1 | 77/16 | 42/0 | 56.1/4.7 | 9.7/3.9 |
| 27 | 53502 | 189.1/94.5 | 56.8/0 | 101.8/8.5 | 34.1/13.7 | 46/13 | 22/0 | 33.0/2.8 | 6.2/2.8 |
| 28 | 53513 | 267.9/193.6 | 55.9/0 | 148.9/12.4 | 48.7/21.5 | 52/15 | 22/0 | 36.6/3.0 | 7.4/3.0 |
| 29 | 53602 | 347.3/103.8 | 126.2/0 | 213.7/17.8 | 55.3/22.3 | 65/15 | 37/0 | 53.2/4.4 | 7.1/3.3 |
© 2017 by the authors. Licensee MDPI, Basel, Switzerland. This article is an open access article distributed under the terms and conditions of the Creative Commons Attribution (CC BY) license (http://creativecommons.org/licenses/by/4.0/).
Share and Cite
MDPI and ACS Style
Cheng, L.; Niu, J.; Liao, D. Entropy-Based Investigation on the Precipitation Variability over the Hexi Corridor in China. Entropy 2017, 19, 660. https://doi.org/10.3390/e19120660
AMA Style
Cheng L, Niu J, Liao D. Entropy-Based Investigation on the Precipitation Variability over the Hexi Corridor in China. Entropy. 2017; 19(12):660. https://doi.org/10.3390/e19120660
Chicago/Turabian StyleCheng, Liang, Jun Niu, and Dehai Liao. 2017. "Entropy-Based Investigation on the Precipitation Variability over the Hexi Corridor in China" Entropy 19, no. 12: 660. https://doi.org/10.3390/e19120660
Note that from the first issue of 2016, this journal uses article numbers instead of page numbers. See further details here.