
Application of the Fuzzy Oil Drop Model Describes Amyloid as a Ribbonlike Micelle


1
Department of Bioinformatics and Telemedicine, Collegium Medium, Jagiellonian University, Lazarza 16, 31-530 Krakow, Poland
2
Chair of Medical Biochemistry, Collegium Medicum, Jagiellonian University, Kopernika 7, 31-034 Krakow, Poland
*
Author to whom correspondence should be addressed.
Entropy 2017, 19(4), 167; https://doi.org/10.3390/e19040167
Submission received: 6 March 2017
/
Revised: 7 April 2017
/
Accepted: 11 April 2017
/
Published: 14 April 2017
(This article belongs to the Section Information Theory, Probability and Statistics)
Abstract
:We propose a mathematical model describing the formation of micellar forms—whether spherical, globular, cylindrical, or ribbonlike—as well as its adaptation to protein structure. Our model, based on the fuzzy oil drop paradigm, assumes that in a spherical micelle the distribution of hydrophobicity produced by the alignment of polar molecules with the external water environment can be modeled by a 3D Gaussian function. Perturbing this function by changing the values of its sigma parameters leads to a variety of conformations—the model is therefore applicable to globular, cylindrical, and ribbonlike micelles. In the context of protein structures ranging from globular to ribbonlike, our model can explain the emergence of fibrillar forms; particularly amyloids.
1. Introduction
The formation of amyloids is often addressed by studies focused on prion diseases [1]. Indeed, amyloids cause pathological conditions in humans and animals—such as CJD (Creutzfeldt–Jakob disease) [2] or Alzheimer’s disease [3]. Such conditions, frequently referred to as “misfolding diseases”, are the result of improper protein folding [4].
Structural changes which lead to the formation of fibrillar forms are peculiar in that they are not triggered by mutations [5]: under certain conditions a “correct” sequence may adopt a conformation which promotes linear elongation and prevents the formation of a globular protein. Despite a multitude of studies, the exact mechanism behind this process (including the specific conditions which promote formation of amyloid fibrils) remains a mystery [6].
Analysis of protein conformations based on the fuzzy oil drop model is based on the assumption that in a “perfect” protein, hydrophobicity peaks at the geometric center of the molecule. Hydrophobicity is then assumed to decrease along with distance from the center, becoming close to 0 at the molecular surface. This distribution, mathematically expressed by a 3D Gaussian, is referred to as “idealized” or “theoretical” [7]. It ensures solubility and can only be achieved if folding occurs in an aqueous environment. On the other hand, the actual (observed) distribution of hydrophobicity in proteins often reveals deviations from the idealized Gaussian, which are thought to be function-related. A local deficit of hydrophobicity typically marks a ligand binding cavity [8] while excess hydrophobicity—if present on the surface—may indicate a complexation site [9,10]. Other models oriented on micellar organization deal with dynamic forms [11], including micellar aggregates studied in the context of membrane proteins [12,13]. Studies of micellar forms and their applications in drug transport can be found in [14,15,16,17,18,19]. Notably, the ability to construct a co-micelle (i.e., a micelle capable of incorporating other molecules, including drugs) is a useful tool in ensuring the delivery of drugs [20]. Analysis of micellar structures also touches upon the formation of amyloids [21]. The behavior of membrane and amyloid structures in the presence of detergents (expected to increase the solubility of fibrillar aggregates) is the subject of numerous publications [22,23,24].
The micelle is chemically defined as an aggregate of bi-polar molecules (surfactants) distributed in a water environment. Micelles are formed through aggregation, minimizing unfavorable entropic effects by internalizing hydrophobic portions of participating molecules while simultaneously exposing their hydrophilic fragments. In terms of the final outcome of this process, a micelle can be defined as a structure where hydrophobicity peaks at the center and adopts near-zero values on the surface.
This work proposes a mathematical model describing micelles which consists of individual organic molecules, including proteins. Clearly, proteins may adopt a variety of conformations—from a regular sphere, through elongated globules, all the way to cylindrical or ribbonlike forms. Our analysis focuses on the structural forms referred to as amyloids, which, under fuzzy oil drop criteria, qualify as ribbonlike micelles. It is shown that the modification of the 3D Gaussian function can be applied to describe all of these structural forms. In subsequent sections we will apply the following definitions: “micelle”—association of surfactant molecules; “protein micelle”—protein molecule treated as a micellar structure, consisting of peptide residues with varying hydrophobicity.
2. Materials and Methods
2.1. Data
Our analysis is based on the set of peptides discussed in [25] and extended with an additional amyloid structure verified experimentally via solid-state Nuclear magnetic resonance (NMR) (2MXU)—β a4 protein 42-residue β amyloid fibril [26]. The complete list of proteins under consideration is given in Table 1.
2.2. Fuzzy Oil Drop Model
The fuzzy oil drop model is thoroughly described in [34], while its application in the analysis of amyloid structures is presented in [35,36].
This work focuses on micellar structures comprising individual polar molecules, regarded as structurally analogous to proteins. We show that by modifying the theoretical Gaussian we can apply the theoretical model to a wide variety of micellar forms, including proteins.
The 3D Gaussian (which, according to the model, expresses theoretical hydrophobicity) peaks at the center of the molecule and assumes near-zero values on its surface. Any cross-section of this distribution produces a corresponding 2D Gaussian. This type of distribution is observed in many real-world proteins, where hydrophobic residues congregate at the center of the protein body while hydrophilic residues are exposed on the surface.
Both hydrophobicity distribution profiles: theoretical (T—given by the Gaussian) and observed (O—computed by summing up hydrophobic interactions between each residue and its neighbors in a 9 Å radius) can be compared quantitatively. Quantitative expression of the differences between the expected (T) and observed (O) distribution is enabled by the Kullback–Leibler divergence entropy formula [37]:
The value of DKL expresses the distance between the observed (p) and target (p0) distributions, the latter of which is given by the 3D Gaussian (T). The observed distribution (p) is referred to as O.
For the sake of simplicity, we introduce the following notation:
Given that DKL is a measure of entropy, it must be compared to a reference value. In order to facilitate meaningful comparisons we introduce another boundary distribution, referred to as “uniform” or “R”, which corresponds to a situation where each effective atom possesses the same observed hydrophobicity (1/N, where N is the number of residues in the chain). This distribution is deprived of any form of hydrophobicity concentration at any point in the protein body:
Comparing O|T and O|R tells us whether the given protein (O) more closely approximates the theoretical (T) or uniform (R) distribution. Proteins for which O|T > O|R are regarded as lacking a prominent hydrophobic core. To further simplify matters, we introduce the following relative distance (RD) criterion:
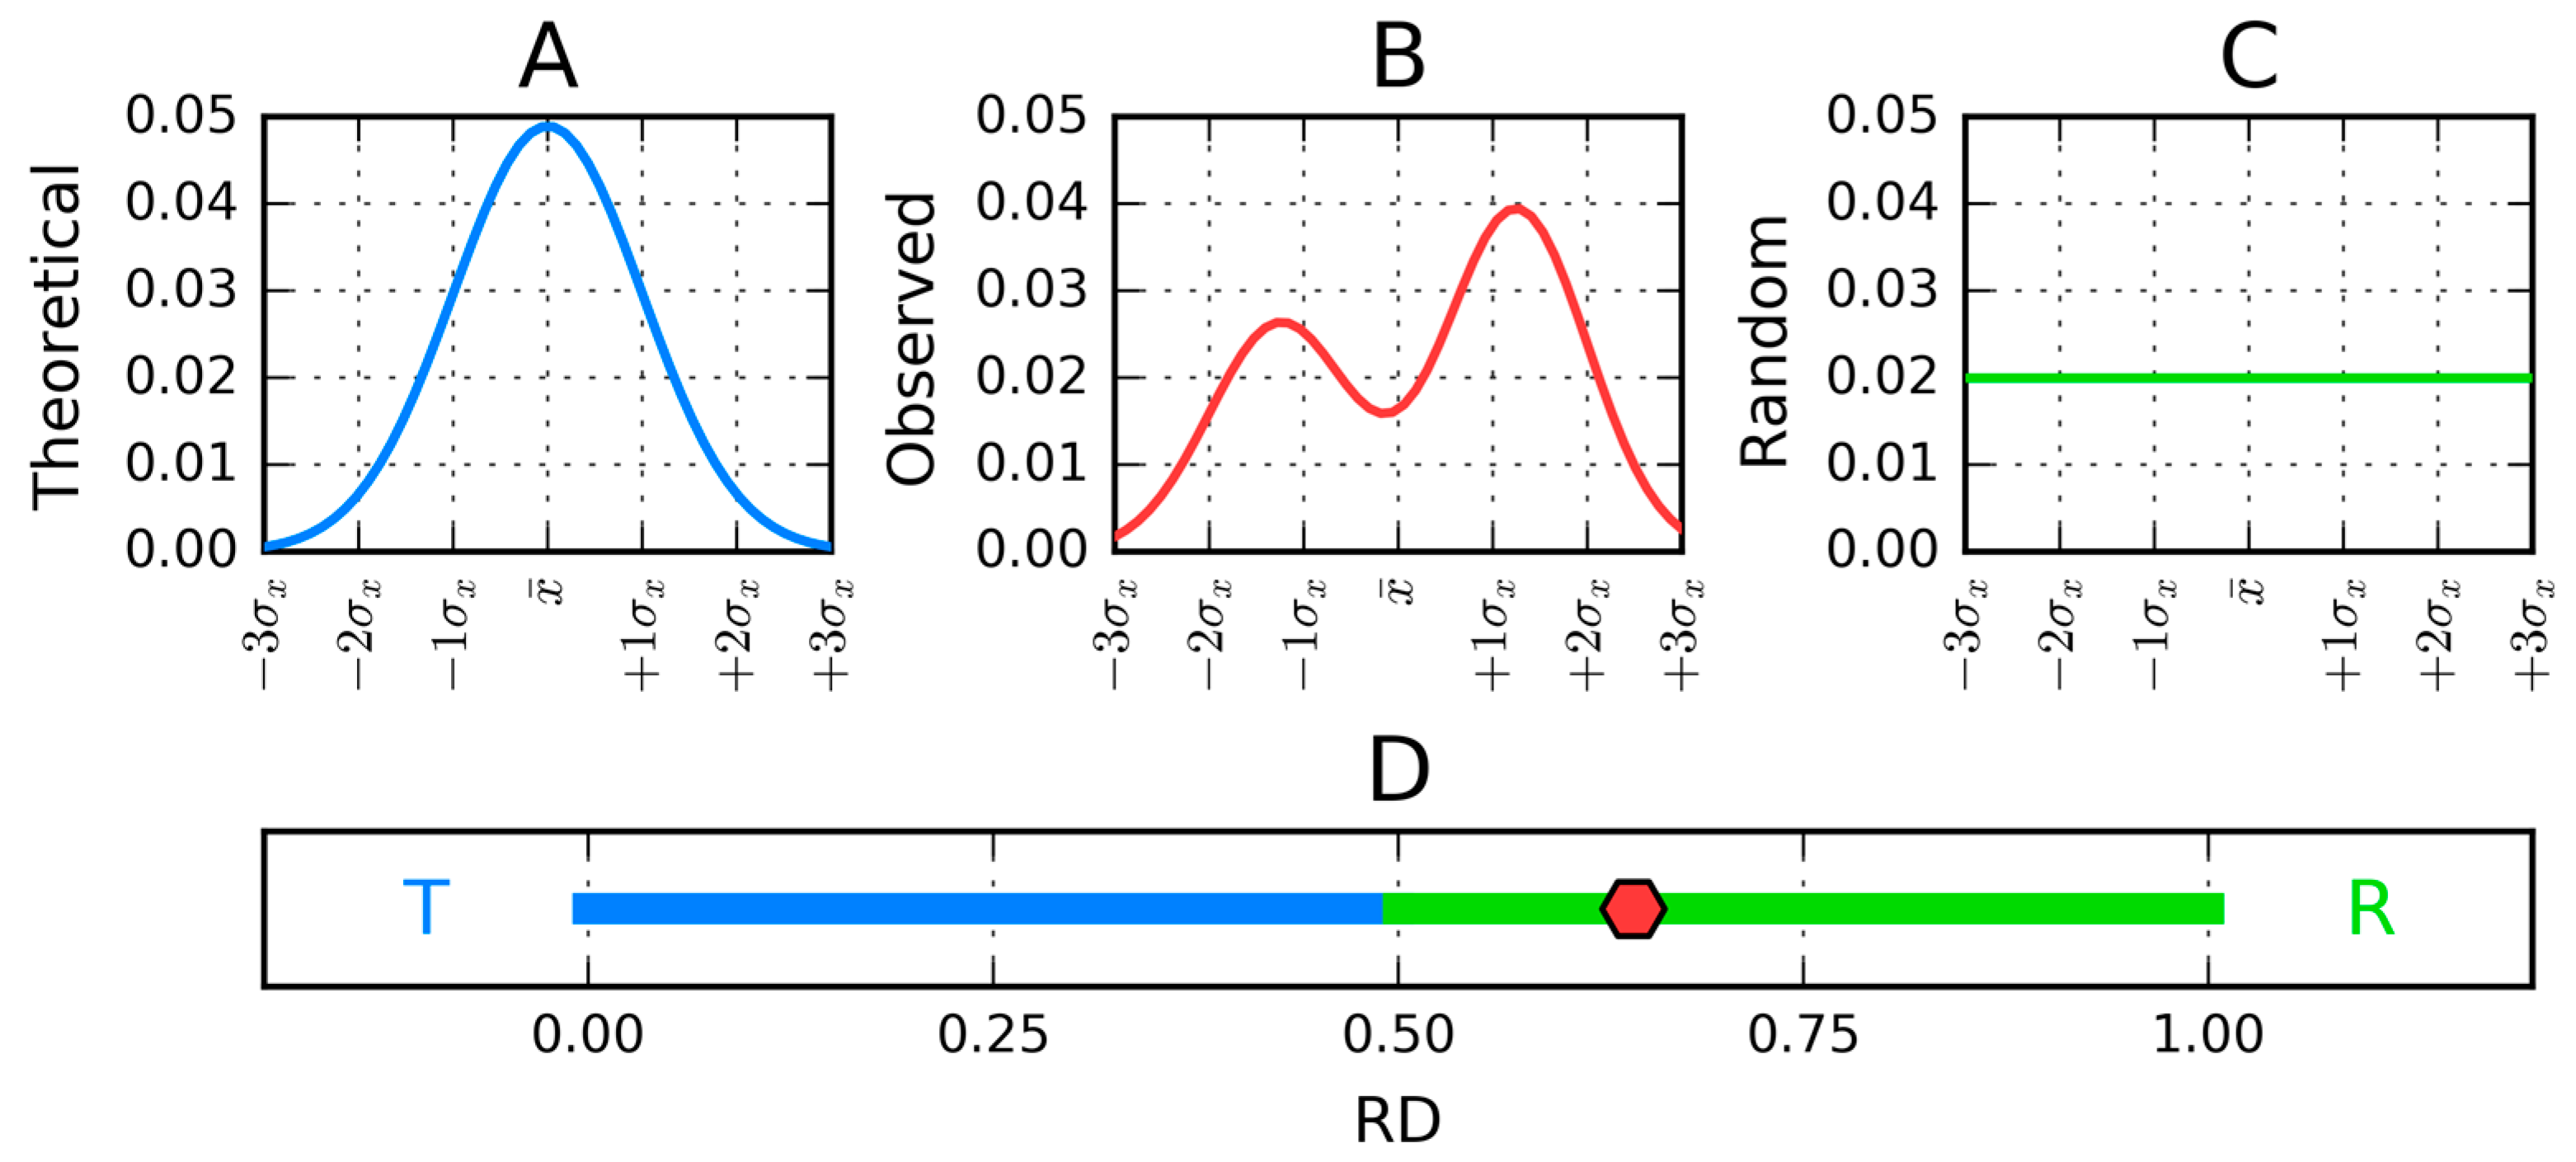
The interpretation or RD in graphical form is depicted in Figure 1.
When the analysis is restricted to a specific fragment of the chain (e.g., a secondary fold), the observed distribution can also be compared to a reference distribution which reflects the intrinsic hydrophobicity (H) of each residue (as listed in [35]). In such cases, O/R is replaced by O/H, i.e., the distance between the observed distribution and the intrinsic hydrophobicity (H) distribution for the given fragment of the polypeptide. The goal of this calculation is to determine the extent to which intrinsic hydrophobicity influences the final distribution, or, in other words—to what extent each residue participates in the generation of a common hydrophobic core. The following sections list two distinct values of RD: RD(R) and RD(H), respectively—this enables us to determine whether the conformation of the given fragment is aligned with the molecule-wide hydrophobic core or dominated by the intrinsic hydrophobicity of its component residues. When RD(R) < RD(H), RD(R) > 0.5, and RD(H) > 0.5, the fragment is assumed to deviate from the Gaussian distribution in favor of the intrinsic distribution. High values of all three parameters (as exhibited by some proteins) point to good alignment between the theoretical Gaussian and the observed distribution [35].
In addition to the above, we calculate the correlation coefficients for the theoretical (Gaussian) vs. observed distribution (O–T), for the Gaussian vs. intrinsic distribution (T–H) and for the observed vs. intrinsic distribution (O–H). Comparing all three coefficients reveals the factors which determine the conformational preferences of a given fragment.
2.3. Modeling the Micellar Structure with a 3D Gaussian Function
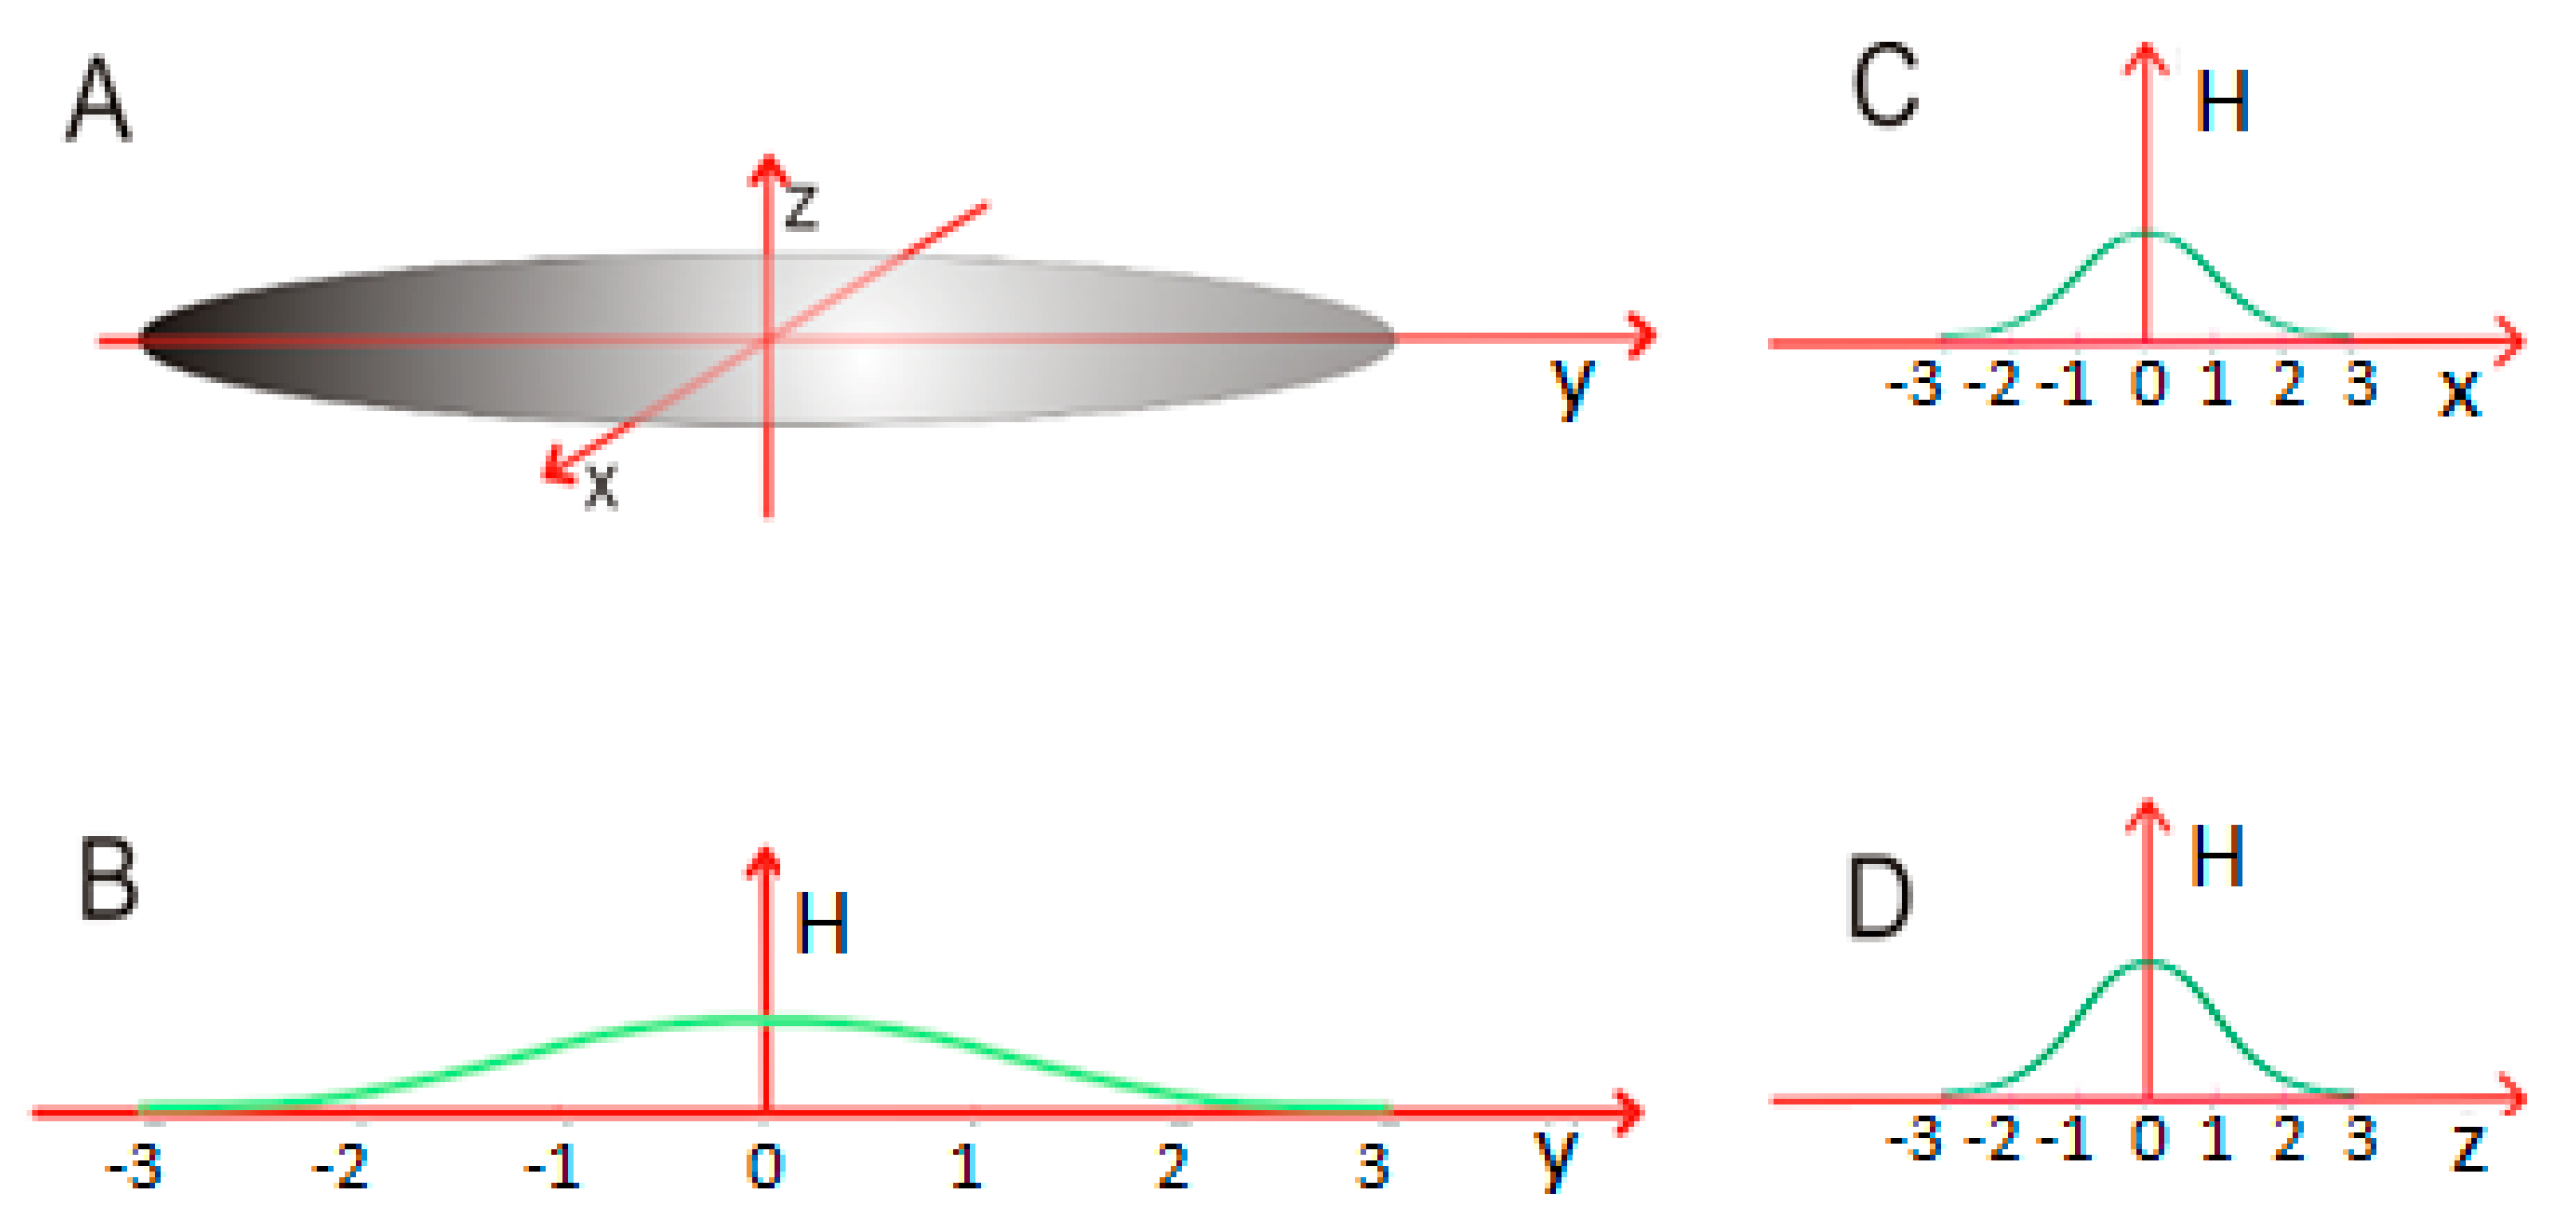
A spherical micelle can be described by a Gaussian function where all three sigma parameters adopt identical values (σx = σy = σz). This situation is depicted in Figure 2.
In this case, we are dealing with a “standard” spherical micelle, where—in order to avoid entropically disadvantageous contact with water—hydrophobic fragments are directed towards the center of the cluster while polar fragments are exposed on its surface (Figure 2A).
In a globular micelle, one of the sigma parameters (for example σy—as shown in Figure 3) is greater than the other two, which results in an elongated structure. This can be mathematically expressed as σy > σx = σz.
Further increases in σy produce an even more elongated globular form.
Cylindrical micelle—once σy reaches a high enough value, the central portion of the capsule starts to resemble a cylinder, with a nearly uniform cross-section radius. This can be expressed as σy >> σx = σz. The central portion is adequately described by a two-dimensional Gaussian function which no longer depends on the values of Y (as shown in Figure 4A).
Ribbonlike micelle—the situation changes qualitatively as σy becomes ever greater, along with an increase in one of the remaining parameters (for example, σy >>>> σx > σz, as shown in Figure 5). This stretches out the micelle into a ribbon-like structure whose width corresponds to the length of a single structural unit, while the thickness (Z axis) reflects the thickness of the unit molecule.
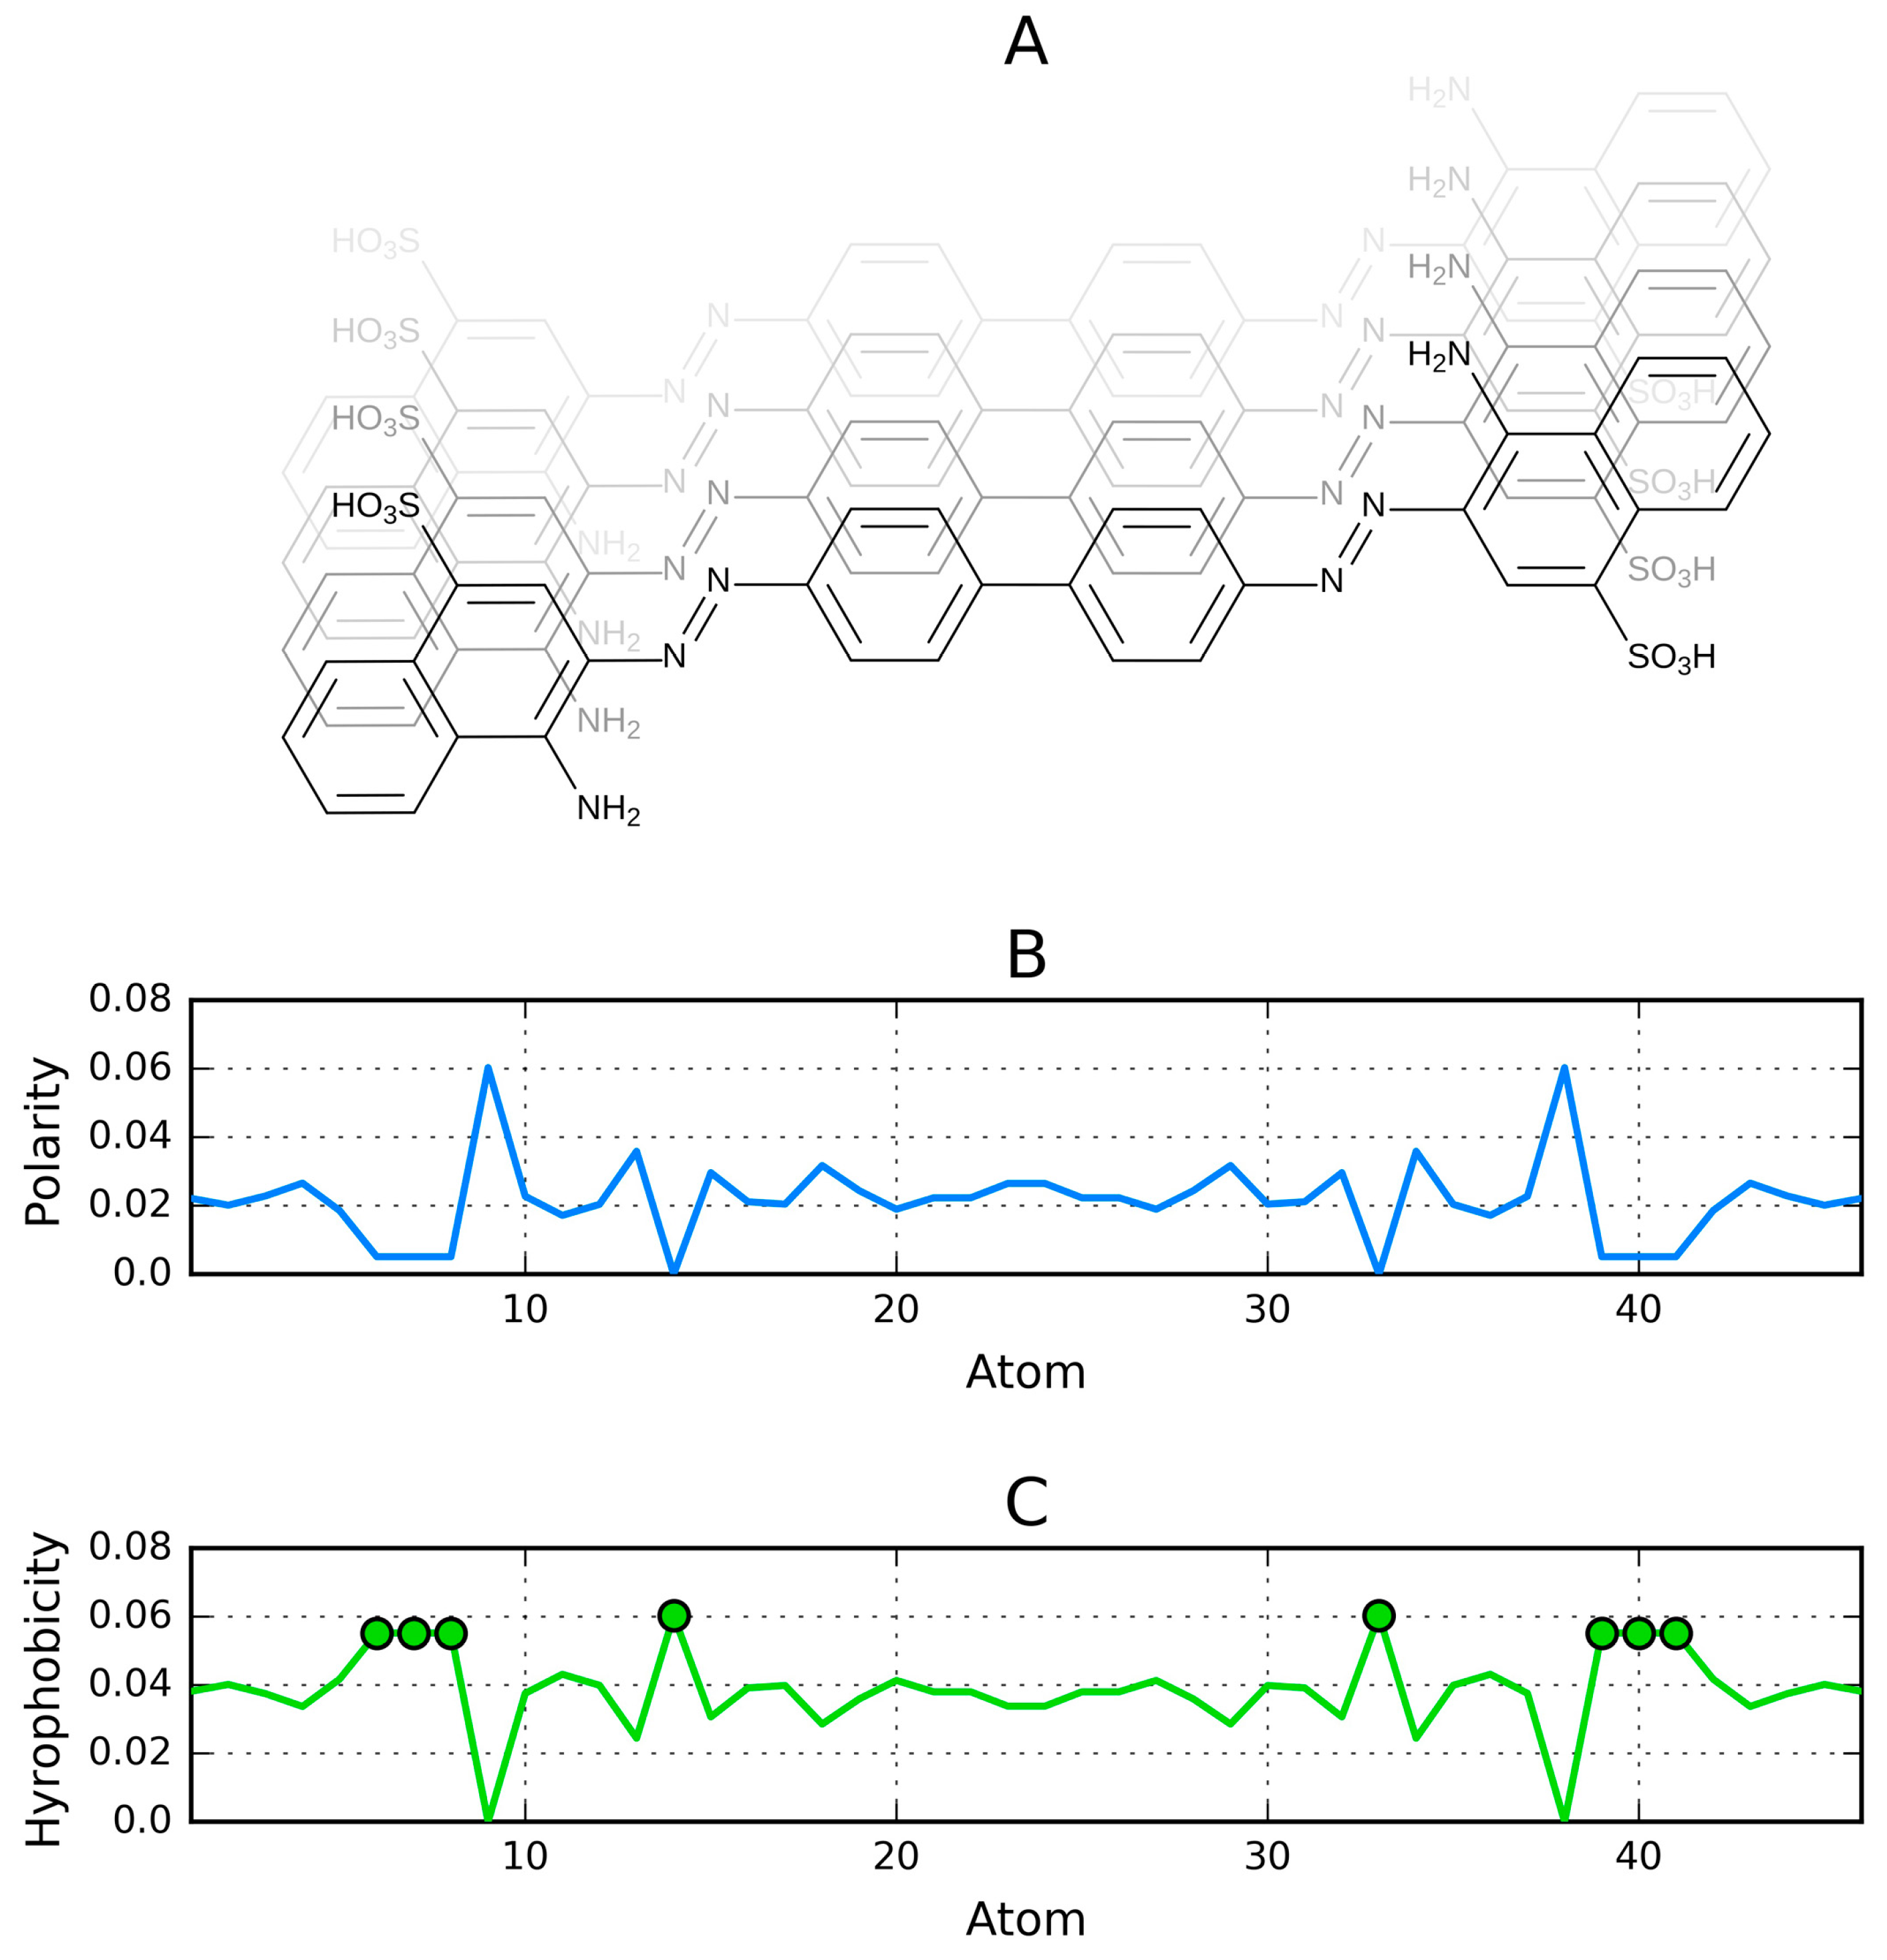
In a ribbonlike micelle the actual distribution of hydrophobicity may deviate from the Gaussian function, depending on the specific properties of the unit molecule (Figure 5E). An example is provided by Congo red—a dye which exhibits four distinct local hydrophobicity peaks (Figure 6). Note that our analysis assumes a planar molecule, which is a simplification (in an actual Congo red molecule the benzidine group is angled, resulting in a spiral twist, which we do not take into account).
Figure 6 illustrates a ribbonlike micelle made up of Congo red molecules. Figure 6A shows a single dye molecule and the placement of polar groups with its phantom copy. Figure 6B depicts the distribution of charges [38]. Figure 6C reflects the distribution of hydrophobicity, calculated by flipping the chart shown in Figure 6B, on the assumption that the hydrophobicity is equivalent to “non-charge”. The values shown in Figure 6C are calculated as follows: the absolute values of partial charges were normalized (PC). The pseudo-hydrophobicity was expressed as 1-PC. Finally, Figure 6D reveals the aggregation of highly hydrophobic areas in successive molecules. This type of aggregation persists even though actual Congo red molecules adopt a spiral (rotated) conformation due to the presence of an angled bond in their benzidine group.
As shown in Figure 6D, the distribution of hydrophobicity may deviate from the regular pattern given by the Gaussian function—even though we can explicitly design a molecule which presents hydrophilic residues at both ends. In this case, the observed distribution is heavily dependent on the location of individual fragments comprising the unit molecule (Figure 5E).
As previously stated, ribbonlike micelles satisfy σy >>>> σx > σz. The length of the micelle is determined by σy, which can be arbitrarily large. The width, determined by σx, corresponds to the length of the unit molecule (26 Å in the case of Congo red), while σz expresses the size of the unit molecule in its transverse plane.
Describing the protein structure with a 3D Gaussian Function—The spectrum of ellipsoid forms discussed in this section can be applied to protein structures. We begin by aligning the protein in such a way that its geometric center lies at the origin of the coordinate system. The molecule is then rotated so that its long diagonal coincides with the Y axis, while in the XZ plane the line connecting the most distal atoms (typically effective atoms, i.e., averaged-out positions of all atoms belonging to a given residue) runs parallel to the X axis. We then assume that the size of the molecule along each principal axis is equivalent to the corresponding sigma parameter, yielding a 3D Gaussian which fully encapsulates the protein body. This “fuzzy oil drop” model has been applied in the analysis of a variety of globular proteins [39,40].
Spherical protein micelle—a spherical structure can be obtained by directing hydrophobic residues towards the center of the protein body along with the exposure of hydrophilic residues, with all three sigma parameters adopting identical values. Several such proteins have been identified—the list includes antifreeze [39] and downhill [40] proteins.
The vast majority of proteins and protein domains can be characterized as globular proteins with the values of sigma parameters differing somewhat (σy > σx > σz). The list is very long and many such structures have been analyzed in our previous publications. From the point of view of the variability of sigma parameters, micelles comprised of proteins are much more variable than those which consist of identical surfactants. The difference between surfactant- and protein-based micelles lies in the way in which micellar forms are generated. The protein “micelle” is distinct in that it has a different number of degrees of freedom than a micelle consisting of individual surfactants. Identical organic molecules are capable of generating a highly symmetrical structure (for instance, each transverse cross-section of a cylindrical micelle exhibits an identical distribution of hydrophobicity). Likewise, the stability of such micelles is constant throughout the aggregate (this applies equally to spherical, globular, cylindrical, and ribbonlike micelles).
In a polypeptide, covalent bonds between residues (analogous to individual molecules in surfactant micelles) and the limited rotational freedom about the Φ and Ψ angles mean that structural flexibility is greatly restricted—even though the overall goal, i.e., the internalization of hydrophobic residues, remains the same. Micelles composed of proteins are therefore imperfect globules, but can nevertheless be modeled with the use of a suitably adjusted Gaussian function. Proteins can assemble into highly ordered micelles (with a fuzzy-oil-drop-like distribution of hydrophobicity in the molecule), striking a balance between local disorder and general order. Such local disorder in micellar organization is only possible in protein micelles. Surfactant micelles are constructed by freely-moving independent molecules, resulting in highly ordered micellar forms.
Cylindrical protein micelle—this structural form occurs in proteins which comprise β-helix motifs (also referred to as solenoids). Here we describe a lyase—bacterial chondroitinase b pectate lyase (PDB ID: 1DBG) [33] and cell adhesion proteins such as Bordetella pertussis virulence factor p. 69 (PDB ID: 1DAB) [27]. Figure 7A illustrates the solenoid fragment of lyase (1DBG) as an example of a cylindrical protein micelle.
Ribbonlike protein micelle—it is interesting to consider a boundary case where σy >>>> σx > σz. In order to study ribbonlike micelles consisting of polypeptides, such as those depicted in Figure 7B,C, we must first make several additional assumptions.
If we limit the value of the σx parameter as proportional to the average length of a β strand (by analogy to unit molecules forming an organic micelle—such as Congo red, where the width of the micelle is equivalent to the length of the dye molecule), and furthermore assume that σz is proportional to the thickness of the β sheet (or two layers thereof—see Figure 7B), we arrive at a structure similar to the one presented in Figure 8.
Leveraging the fuzzy oil drop model to identify amyloidogenic properties in proteins is discussed in [36]. The presented work focuses on mathematical formulations of amyloidogenesis, expressed as a fringe case of 3D Gaussian variability.
Ribbonlike protein micelles (satisfying σy >>>> σx > σz) have some peculiar properties. Instead of the length of the entire unit molecule, we consider the length of a single β strand (Figure 6). A hypothetical distribution of residues corresponding to the chart shown in Figure 8 can be proposed: regardless of the distribution of hydrophobicity along each individual β fragment, the resulting distribution favors the formation of a ribbonlike micelle, with linear propagation (Y axis) of an identical (or highly similar) distribution of hydrophobicity along the β component (X axis) (Figure 5C,E).
The sequence of residues forming a β strand may vary and does not always satisfy the abovementioned criterion. Examples include conformations referred to as β sandwiches and β barrels (Figure 5C,E).
3. Results
3.1. Distribution of Hydrophobicity in Short Segments of Amyloid-Forming Proteins
Short peptides may adopt conformations such as the basic cross-β-sheet, composed of tightly-packed repetitive β-sheets. Some examples of parallel and antiparallel structures are described in [25]. Figure 9 illustrates the distribution of hydrophobicity (hydrophobicity parameters) in systems comprised of adjacent parallel β-sheets. These distributions follow the intrinsic hydrophobicity ascribed to each amino acid (see [36] for an applicable scale). Figure 10 illustrates the corresponding distribution in antiparallel systems.
Figure 9 reveals an obvious tendency for highly hydrophobic areas to propagate linearly. This is due to the parallel arrangement of similar (identical) polypeptide chain fragments. Hydrophobic interactions appear to have a dominant effect on the conformational properties of the resulting structure, overriding charge distribution (note that polar residues will also be placed in close contact with one another). In such cases, charge-charge interactions may be decreased significantly via easy access to water, since the fibril does not generate any compact globular feature.
Linear propagation of highly hydrophobic areas, as shown in Figure 6D, outlines the analogies between ribbonlike micelles formed by dye molecules and those formed by polypeptides. The end result (shown in Figure 10) can be explained on the grounds of the fuzzy oil drop model as a boundary case (σy >>>> σx > σz).
The spiral twist in Beta-amyloids should be taken into account as the consequence of Cα atom chirality. The local minimum on the Ramachandran map for Beta-structural forms is not localised for Phi = 180 and Psi = 180 degrees. Additionally, Beta-amyloids are constructed by polypeptides of the identical sequence. As a consequence, the identical charges are within close distance. The presence of water decreases repulsion, however the increase of distance in twisted forms additionally supports the decrease of repulsion. This spiral twist is not observed in 2MXU despite the presence of short Beta-fragments with identical sequences. This spiral twist is impossible due to the stabilization role of other Beta-sheets present in this amyloid. We assume that isolated Beta-sheets from 2MXU could represent the spiral twist.
3.2. Amyloid Structure in the Context of the Fuzzy Oil Drop Model
The reference amyloid structure considered in this work is the human amyloid β (Aβ(1–42)), exemplified by 2MXU [26,41,42]. Only the 11–42 fragment has been deposited, with its conformational properties determined using solid-state NMR [43].
The system consists of 12 polypeptide chains, with 32 residues each (11–42). Each chain contains three β strands (12–18, 24–32, 36–41).
The PDB structure enables the calculation of protein properties based on the fuzzy oil drop model. RD(R) and RD(H) parameters listed in Table 2 approach unity when the structure deviates from the theoretical distribution in favor of either the uniform or the intrinsic distribution. Correlation coefficients expressing the relation between intrinsic and observed hydrophobicity reveal that the final conformation is dominated by intrinsic properties of each residue—the system does not generate a common hydrophobic core surrounded by a hydrophilic shell.
Fragments 12–18 and 24–32 in both approaches (as part of the complex and as individual units) represent clear discordance versus the uni-centric distribution of hydrophobicity showing strong influence of intrinsic hydrophobicity which determines their structure. The symptoms proving this interpretation are values of RD above 0.5. The β-sheet 35–41 is located on the surface of the ellipsoid. Thus it is expected to represent low hydrophobicity values. The profiles on Figure 11 show low levels of theoretical hydrophobicity (see C-terminal fragment of each chain) but the observed hydrophobicity demonstrates the contrast status of high hydrophobicity. This is why the correlation coefficients for ρ(H–T) and ρ(T–O) are high, but the range of these quantities is different. The RD values for this case are the largest in respect to the RD status of all the other β-sheets. The same interpretation of the parameters describe this β-sheet treated as the individual unit. The RD values are extremely high. It means that the distribution has nothing in common with the uni-centric concentration of hydrophobicity. The high correlation coefficients appear in this case due to the linear relation, but the compared values represent a completely different range of values (for example H parameters are from the range 0.0025–0.004, while the expected T parameters are from the range 0.0004–0.0014). The linear relation is observed, however the ranges of the compared values are highly different.
The different status of individual chains in 2MXU as expressed by the RD values is the consequence of differences in the 3D Gauss function in certain areas. When the linear form is overlapped by the globular one there is a certain location with an occasional better fit of these two forms. Chains C and D as well as A and E occupy similar symmetric positions in a complex. This is why their status is also similar (see Figure 11).
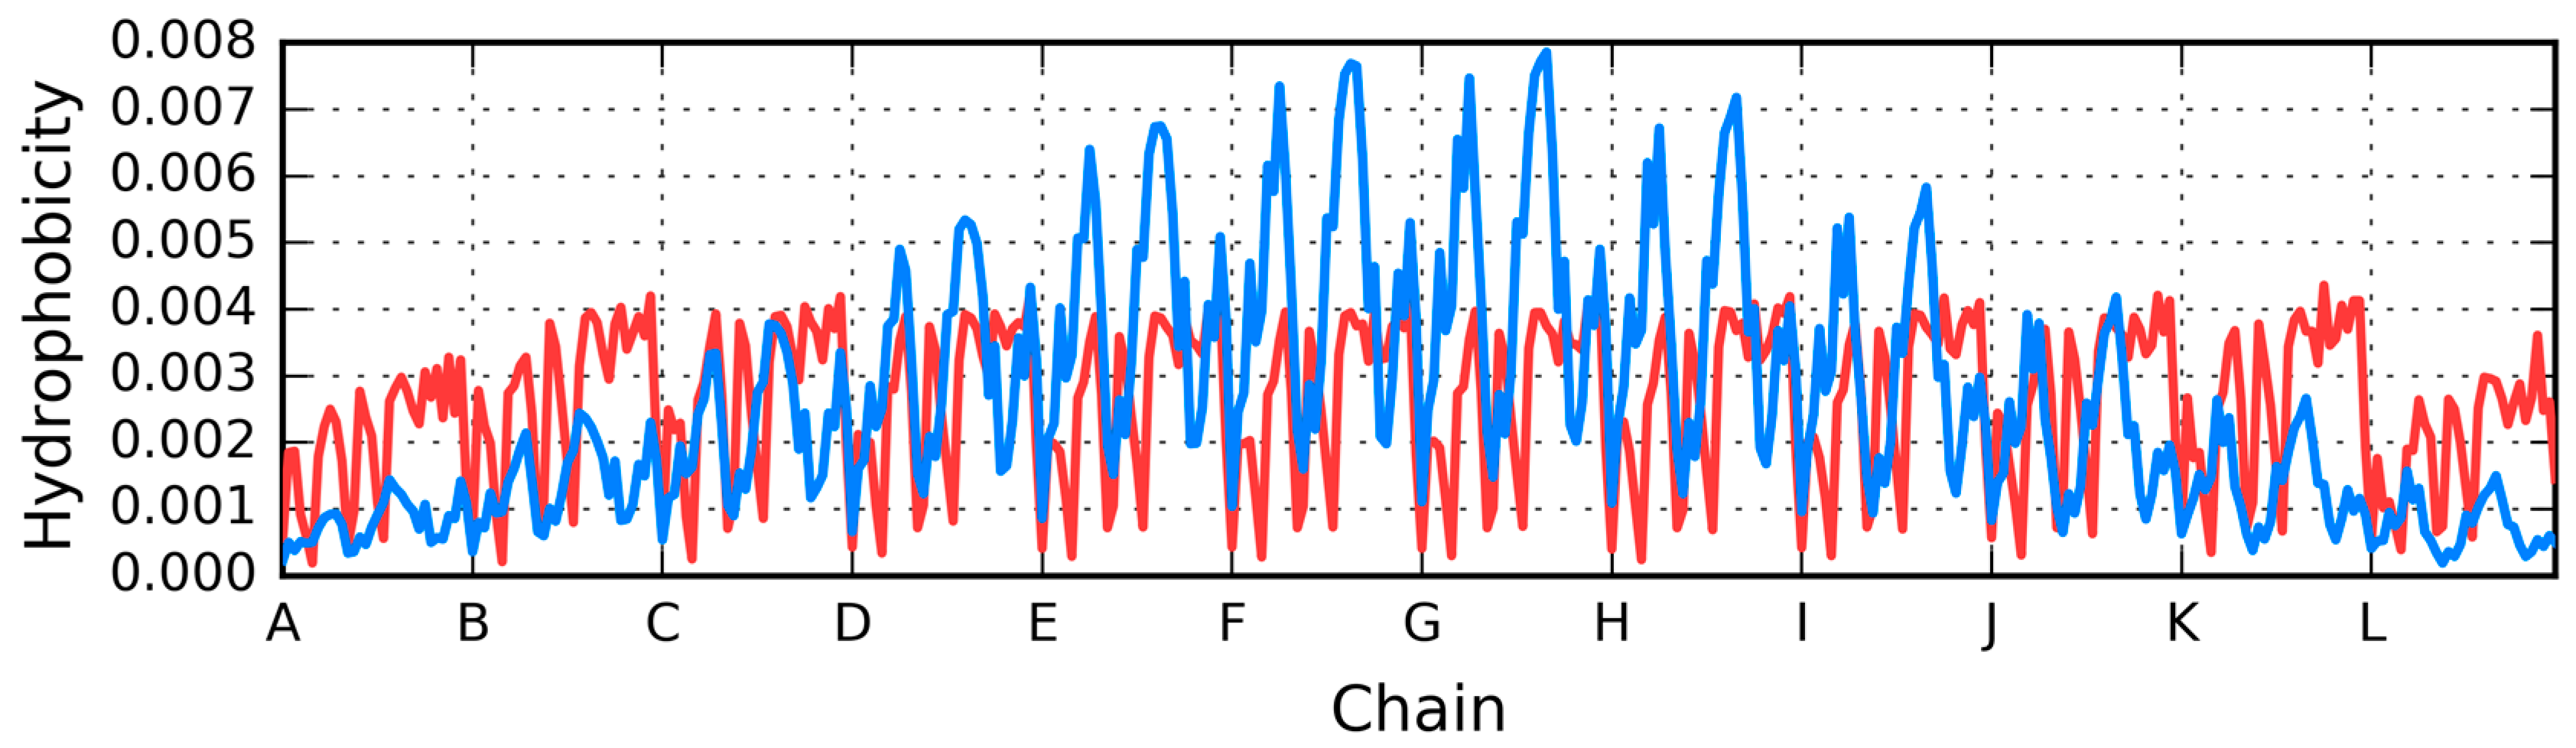
Figure 11 illustrates the theoretical (T) and observed (O) hydrophobicity distribution in the 2MXU amyloid (for the structure as deposited in PDB). The T profile in Figure 11 is symmetrical, while the O distribution shows some differences since the structure of the chains is not identical. The theoretical distribution expects the hydrophobicity concentration in a central part of the molecule and low hydrophobicity on the area close to the surface. The zig-zag form of the theoretical distribution is due to polypeptide going back and forth from one surface site to the opposite one. A small progression of stepwise changes can be seen particularly in the fragment 29–42 (C-terminal fragment of each chain). This is the reason for the different parameters given in Table 2.
Comparing both distributions (T and O) reveals that no prominent hydrophobic core is present. Instead, the observed distribution appears highly uniform. According to the fuzzy oil drop model, hydrophobicity is expected to taper off at each end of the complex, forming a hydrophilic shell which ensures solubility. In the presented case, however, the decrease in hydrophobicity at both ends is caused simply by the absence of another adjacent chain. The observed distribution describes a micellar system—it corresponds to our definition of a cylindrical micelle where the central part exhibits similar properties in each transverse cross section.
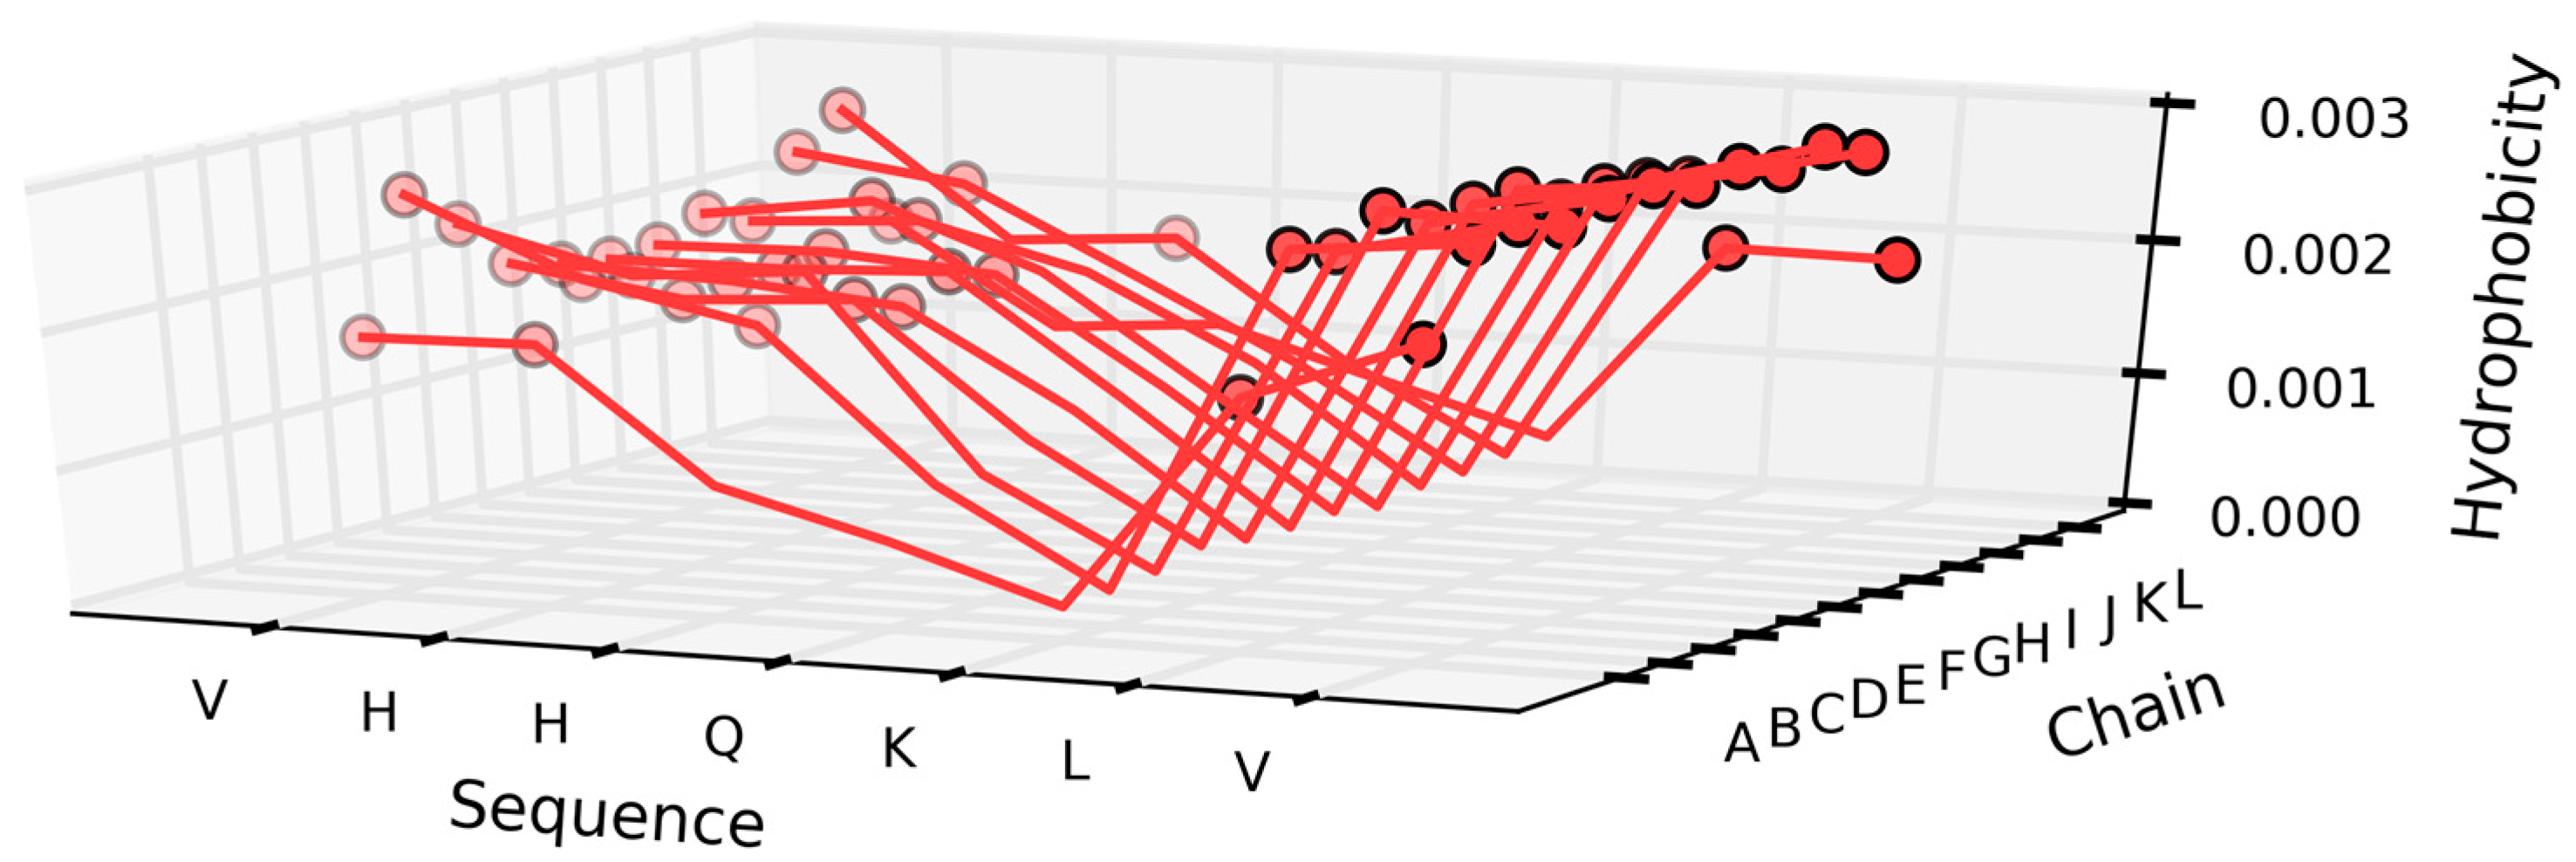
The β strands present in the chain are also characterized by a distribution of hydrophobicity which does not resemble a soluble protein. The β sheet at 36–41 (in all chains) is somewhat accordant, but nevertheless deviates from the theoretical expectations. Examples of such discordance—as well as their scope—are illustrated in Figure 12.
The profiles shown in Figure 12A visualise the change of hydrophobicity along the long diagonal of the complex. The low levels represent the expected low hydrophobicity expected in the terminal peptides. The highest profile represents the central peptides which are expected to be the highest concentration of hydrophobicity. The green line expresses the intrinsic hydrophobicity of each fragment. The red lines (Figure 12B) visualise the observed distribution. The majority of the profiles visualise the high level of hydrophobicity common for all the peptides. The two lower ones are different due to the lack of a neighbour at the terminal positions. The red lines visualise the status of the polypeptide chain fragments as the result of clearly following the intrinsic hydrophobicity against the theoretical expectation.
Further analysis of the distributions presented in Figure 13A suggests a major local hydrophobicity deficiency at position 28. In contrast, positions 24–26, where low hydrophobicity would be expected, are instead found to be of higher hydrophobicity. This particular fragment is exposed on the surface and therefore greatly reduces protein solubility. We should also note that similar deviations are present in each individual chain, likely as a result of interactions with adjacent chains.
In conclusion, the distribution of observed hydrophobicity points to the lack of an encapsulating hydrophilic “shell” (as evidenced by the initial and final peptide in the complex). Instead, linear propagation is ensured by close proximity of β strands characterized by identical hydrophobicity distribution profiles. This phenomenon underscores the fundamental importance of hydrophobic interactions.
The charts presented in Figure 13 also reveal that—in addition to the two distinct peaks of hydrophobicity—each chain contains a local minimum which disrupts the formation of a common, central core. The fragment at 36–41 (Table 2) is characterized by high correlation coefficients (O vs. H, O vs. T, and T vs. H) suggesting good agreement between the observed and theoretical distribution—however, this observation is not borne out by the values of RD, which instead evidence significant deviations from T.
To conclude, the presented results indicate that the lack of a prominent hydrophobic core, along with exposure of the hydrophobic residues, promote the formation of fibrillar structures. Applying the same mechanism to other proteins reveals a local ordering which is inconsistent with the fuzzy oil drop model and instead resembles an amyloid. Similarities between the distributions illustrated in Figure 11 and Figure 12, and the one presented in Figure 13 should be noted—clearly, both cases favor linear propagation of similarly ordered fragments [25]. The lack of a hydrophilic shell (cf. Figure 11—low hydrophobicity in terminal sections) prevents “closure” and, consequently, enables linear propagation of the complex.
Treating Beta-sheets as independent ribbon-like micelles gives the following Gaussian function parameters: σx can be calculated as 1/6 of the Beta-structural fragment which is 2.6 Å (for the 12–18 fragment), 2.8 Å (for the 24–32 fragment), and 2.5 Å (for the 36–41 fragment), σy is infinitely large for the real fibril (in our limited example this parameter is equal to 9 Å) and σz is proportional to the averaged side chain length in the Beta-structural fragment.
Similar distributions have been identified in transthyretin where some β strands remain consistent with the model while others deviate from it in favor of a distribution based on the intrinsic hydrophobicity of individual residues [36].
3.3. Cylindrical Micelle in Proteins
As mentioned in Table 1, a cylindrical micelle can be observed in proteins which contain solenoid-like fragments. We have selected two examples for analysis: a lyase—bacterial chondroitinase b pectate lyase (PDB ID: 1DBG) [33] and a cell adhesion protein—Bordetella pertussis virulence factor p. 69 (PDB ID: 1DAB) [27]. Linear propagation in both proteins is visualised in Figure 14. In order to prevent infinite propagation, a “stop” signal is necessary. This role appears to fall to the short fragments highlighted in Figure 15 (red coloring).
A review of various “stop” signals employed by proteins which exhibit a linear distribution of hydrophobicity is presented in [44].
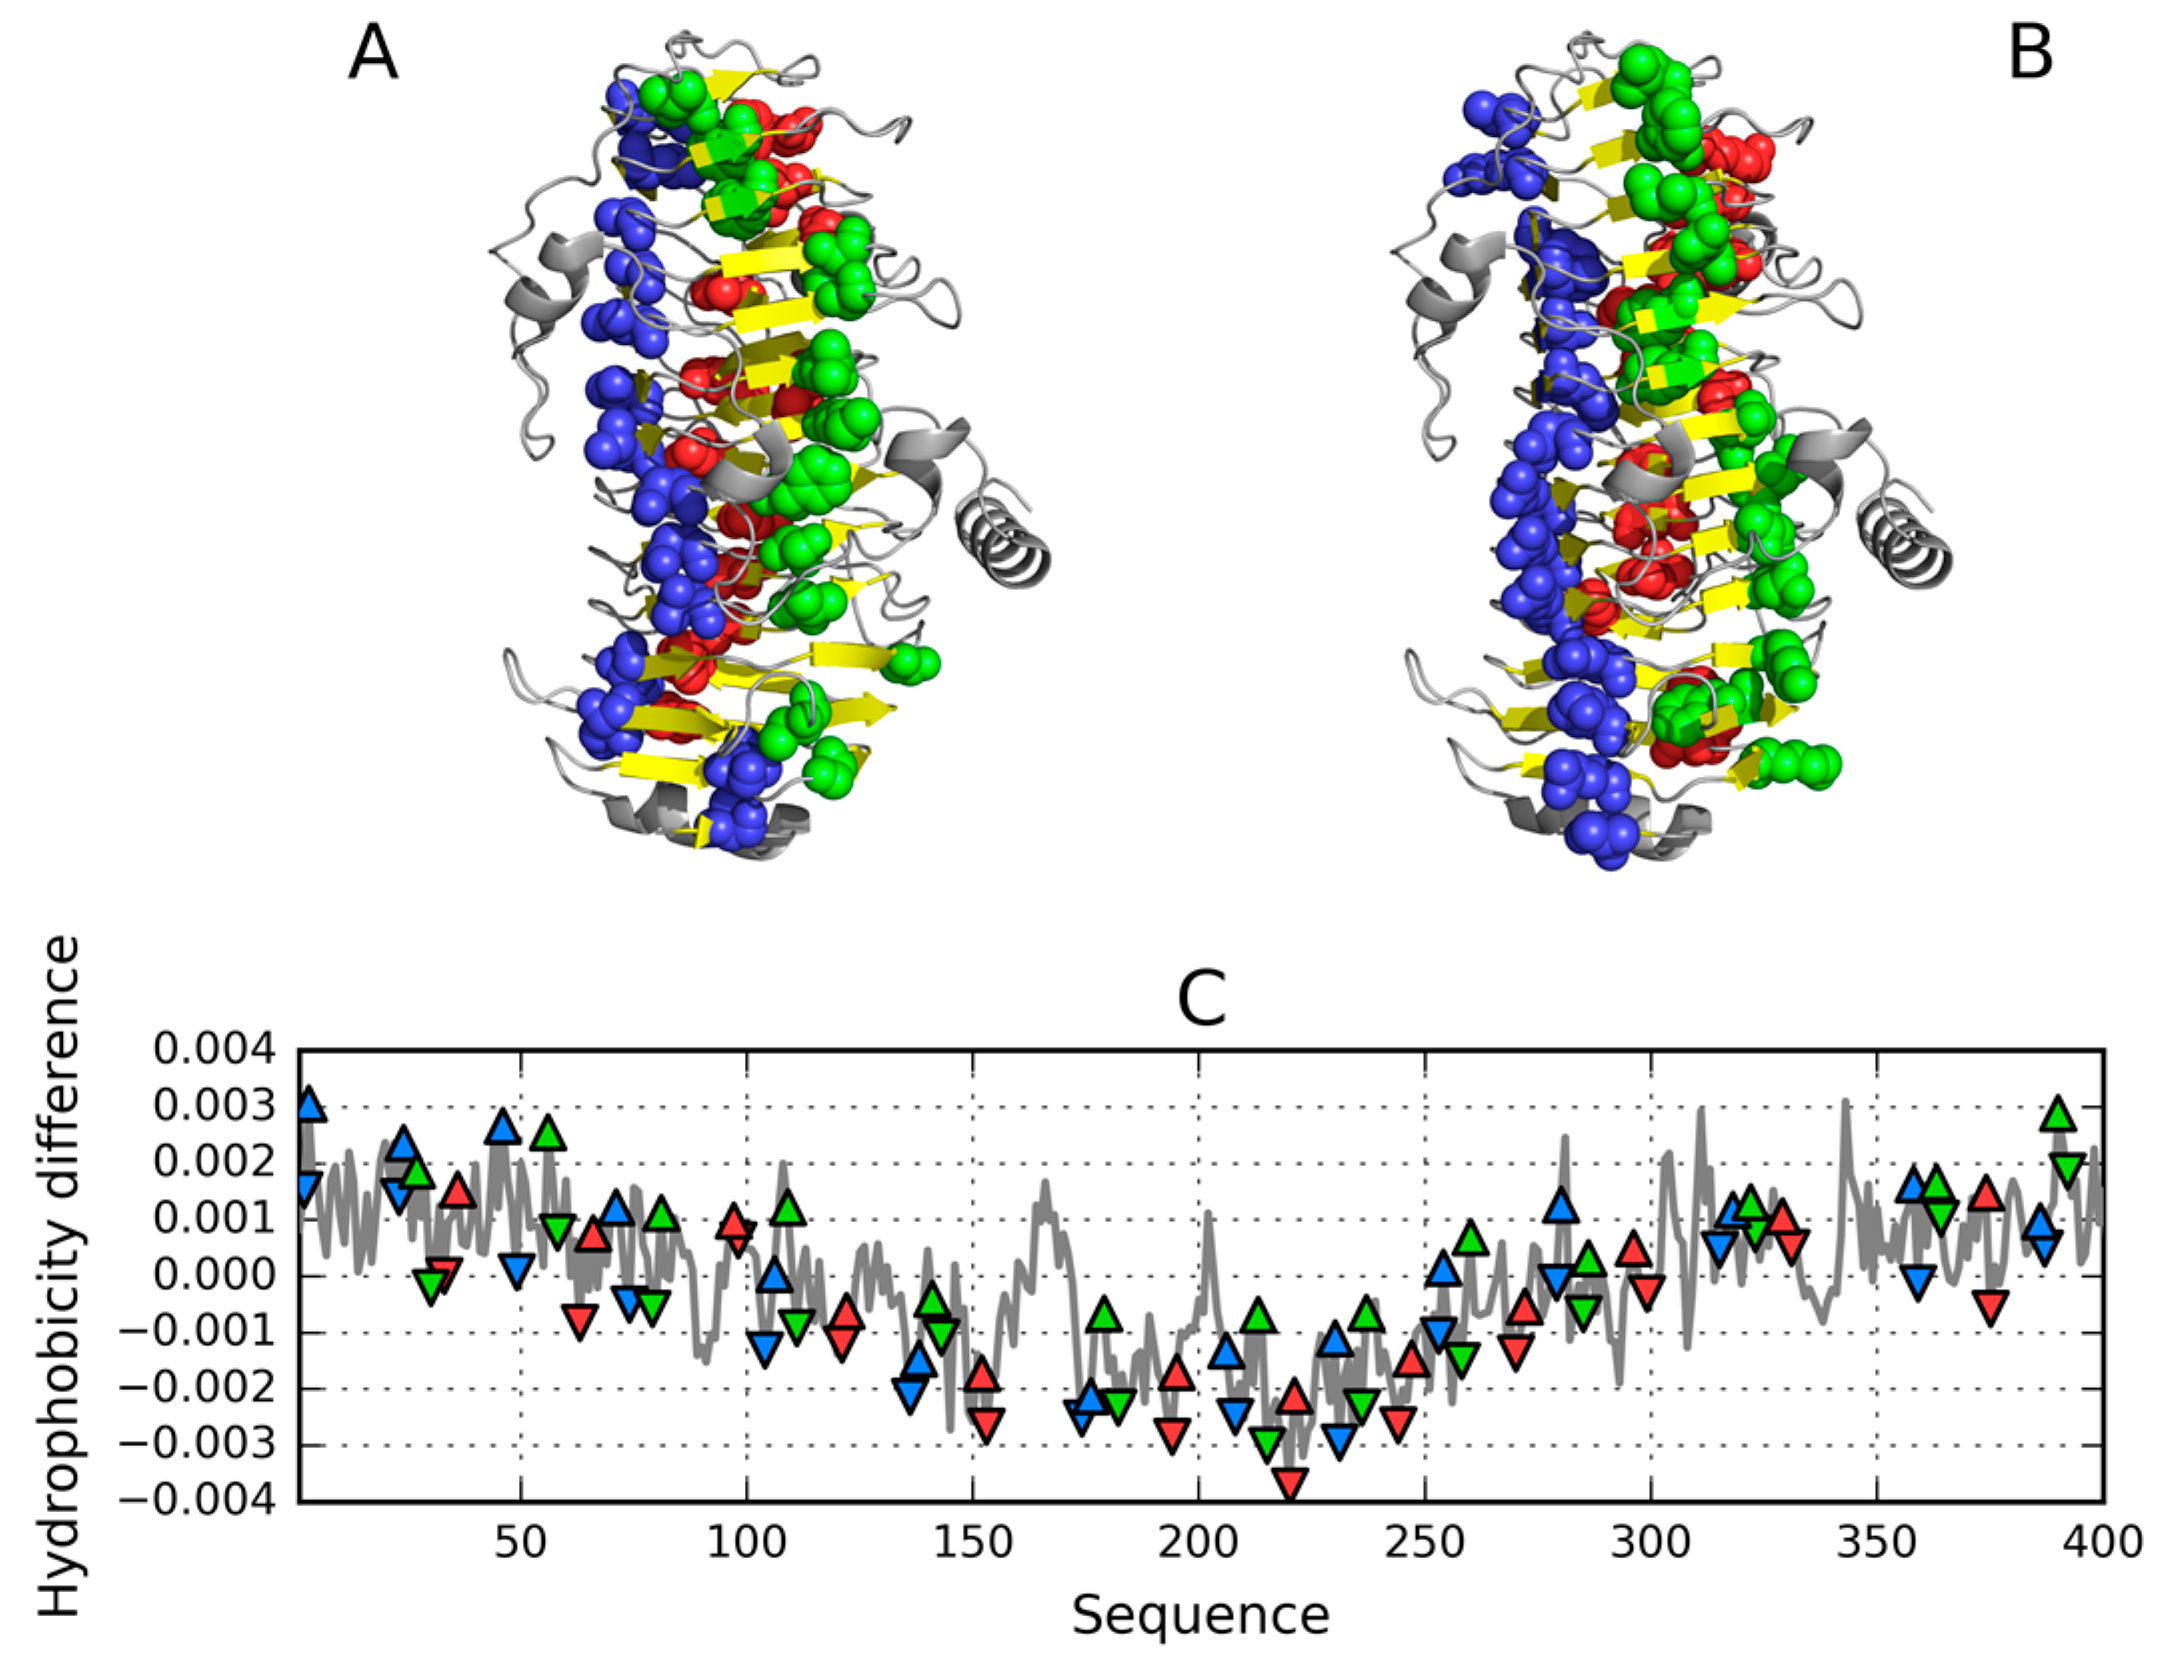
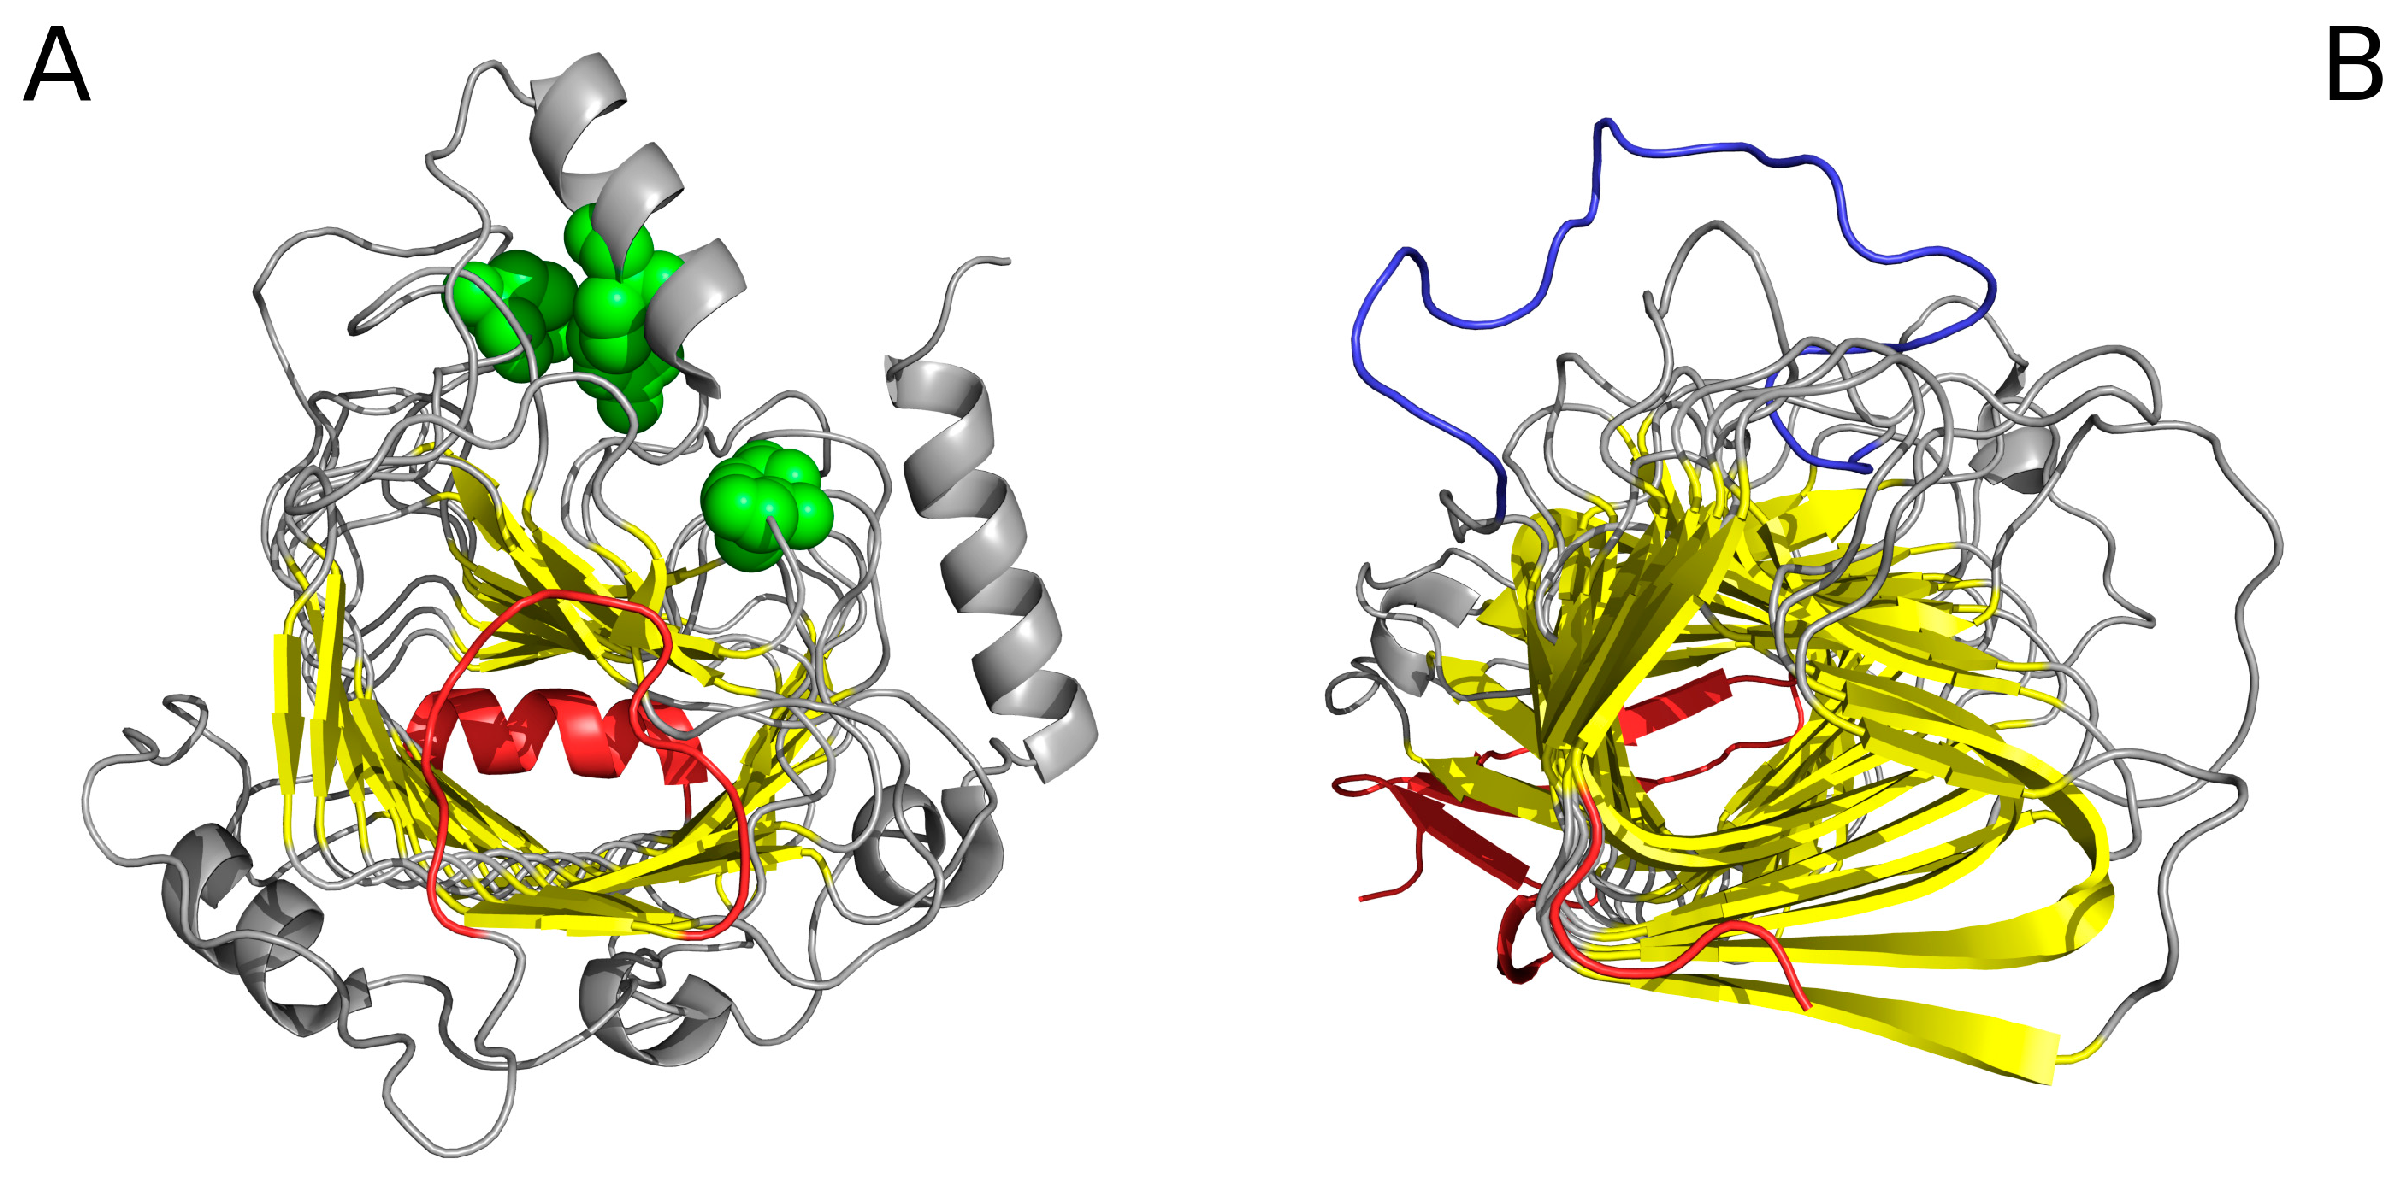
Figure 14 reveals a linear arrangement of successive hydrophobic (A) and hydrophilic (B) bands. Such propagation might continue indefinitely in the absence of a “stop” signal. As the protein under consideration is found in healthy organisms, it must be protected against amyloid clustering. The corresponding “stop” fragments are highlighted in Figure 15—they work by disrupting the terminal sections of the solenoid, rendering them consistent with the fuzzy oil drop model (red sections in Figure 15). In particular, the helical fragment shown in Figure 15A is recognized as an amphiphilic helix. This phenomenon may hint upon the effective means of arresting linear propagation of fibrillar aggregates in patients suffering from amyloidosis.
4. Discussion
We initially wanted to give our paper the following title: “Proteins—intelligent micelles”. While controversial, this comparison appears justified. The universal nature of the 3D Gaussian function, which—when suitably modified—can model any type of micelle consisting of surfactants or even protein molecules, may also be leveraged to explain the continuity of structural changes leading to the emergence of such structures. This common mathematical formulation enables the analysis of various proteins, from spheres, through globules, all the way to cylindrical and ribbonlike forms. Modifying the Gaussian function (by altering the relation between its sigma coefficients) reflects changes which occur in real proteins. Our analysis of proteins with varying structures and biological profiles based on the fuzzy oil drop model supports this conclusion, as reported in our to-date publications.
Most protein domains, when treated as individual units, conform to the theoretical distribution of hydrophobicity expressed by the Gaussian function. In spherical protein micelles, dominated by the interactions between residues and the water environment, the tertiary conformation remains highly consistent with the fuzzy oil drop model. Domains referred to as immunoglobulin strands, despite significant structural similarities, represent variable fuzzy oil drop characteristics—from titin (which conforms to theoretical predictions with near-perfect accuracy), through unstable fragments in immunoglobulin domains, all the way to enzymes (which may also contain immunoglobulin folds) [45]. In addition to describing structural properties, the fuzzy oil drop model also explains the effect of the water environment upon the folding process as it occurs in vivo. Hydrophobic collapse is regarded as a solution to Levinthal’s paradox [46].
Discussions concerning the fundamental role of the hydrophobic core have a long history [47], with both experimental [48] and theoretical approaches [49]. It has been shown that hydrophobic residues are very stringently segregated into the protein core [50] while exposed hydrophobicity is a driving force for protein aggregation in Huntington’s disease—along with examples of how a hydrophobic core can minimize protein aggregation. The problem of dystrophin aggregation was the subject of an analysis based on the fuzzy oil drop model [10]. It was shown that the presence of an additional domain in the interface area provides further stabilization in dystrophin.
5. Conclusions
Our research indicates that the limited quantity of information carried by the amino acid sequence is only sufficient for determining the structure of the so-called early intermediate [51]. The observed deficit is compensated by information contributed by the water environment. Accordingly, mechanisms which drive the formation of amyloid forms may be explained by referring to the properties of the surrounding water. This suggestion is corroborated by experimental studies [52]—it should also be noted that the structuralization of water has not previously been subjected to a comprehensive analysis [53].
Amyloids assume the form of ribbonlike micelles. An elongated, linearly ordered distribution of hydrophobicity may emerge when the fibril is composed of short, identical peptide sequences. Such aggregation is further promoted by the clustering of β folds which possess similar hydrophobicity profiles. As shown above, many proteins include short fragments, which (1) do not conform to the theoretical Gaussian form; (2) clearly oppose the expected distribution of hydrophobicity; (3) lack a prominent hydrophobic core and (4) are capable of aggregating with similar partners (adjacent β strands), ensuring linear propagation. This is particularly evident in amyloids generated by short peptides. When dealing with longer sequences, it is usually enough to find two non-identical fragments characterized by similar hydrophobicity distributions—aggregation and propagation of such fragments lead to elongated fibrillar forms which may grow without bound. The formation of an amyloid becomes even more probable when external conditions favour recruitment of additional molecules (or fragments).
A spherical micelle appears to “embed” itself in the natural structural environment generated by water and should be viewed as the product of the water environment acting upon the protein chain. In contrast, a ribbonlike micelle, which lacks a hydrophilic shell itself, affects the structuralization of the environment and may therefore promote biological activity. The specific nature of the force field generated by exposed hydrophobicity may explain the specificity of ligand-protein interactions, with each ligand capable of “reading” the expected structuralization of water. Such behavior relates to the so-called iceberg hypothesis which posits that proteins communicate by altering the structuralization of water in their neighborhood [54].
Experimental studies concerning amyloidogenesis point to the special role of hydrophobic residues [55,56,57]. If interactions between residues forming the sequence do not promote the formation of a common, central hydrophobic core, a different type of ordering may take hold—one in which local peaks and troughs aggregate linearly.
A discussion of issues related to protein micelles—with a particular focus on the most common type of micellar structure, i.e., a membrane, as well as the role of detergents, can be found in [57]. The opinion “more and more secreted proteins have been found to have the potential to produce extracellular amyloid deposits in multiple organs” was expressed in [58,59]. Analysis based on the structure of the observed hydrophobic core and its deformations can identify fragments whose own local profiles favor the formation of linearly propagating fibrillar structures. Recently, an opinion regarding the lack of knowledge of amyloidogenesis mechanisms is expressed in [6].
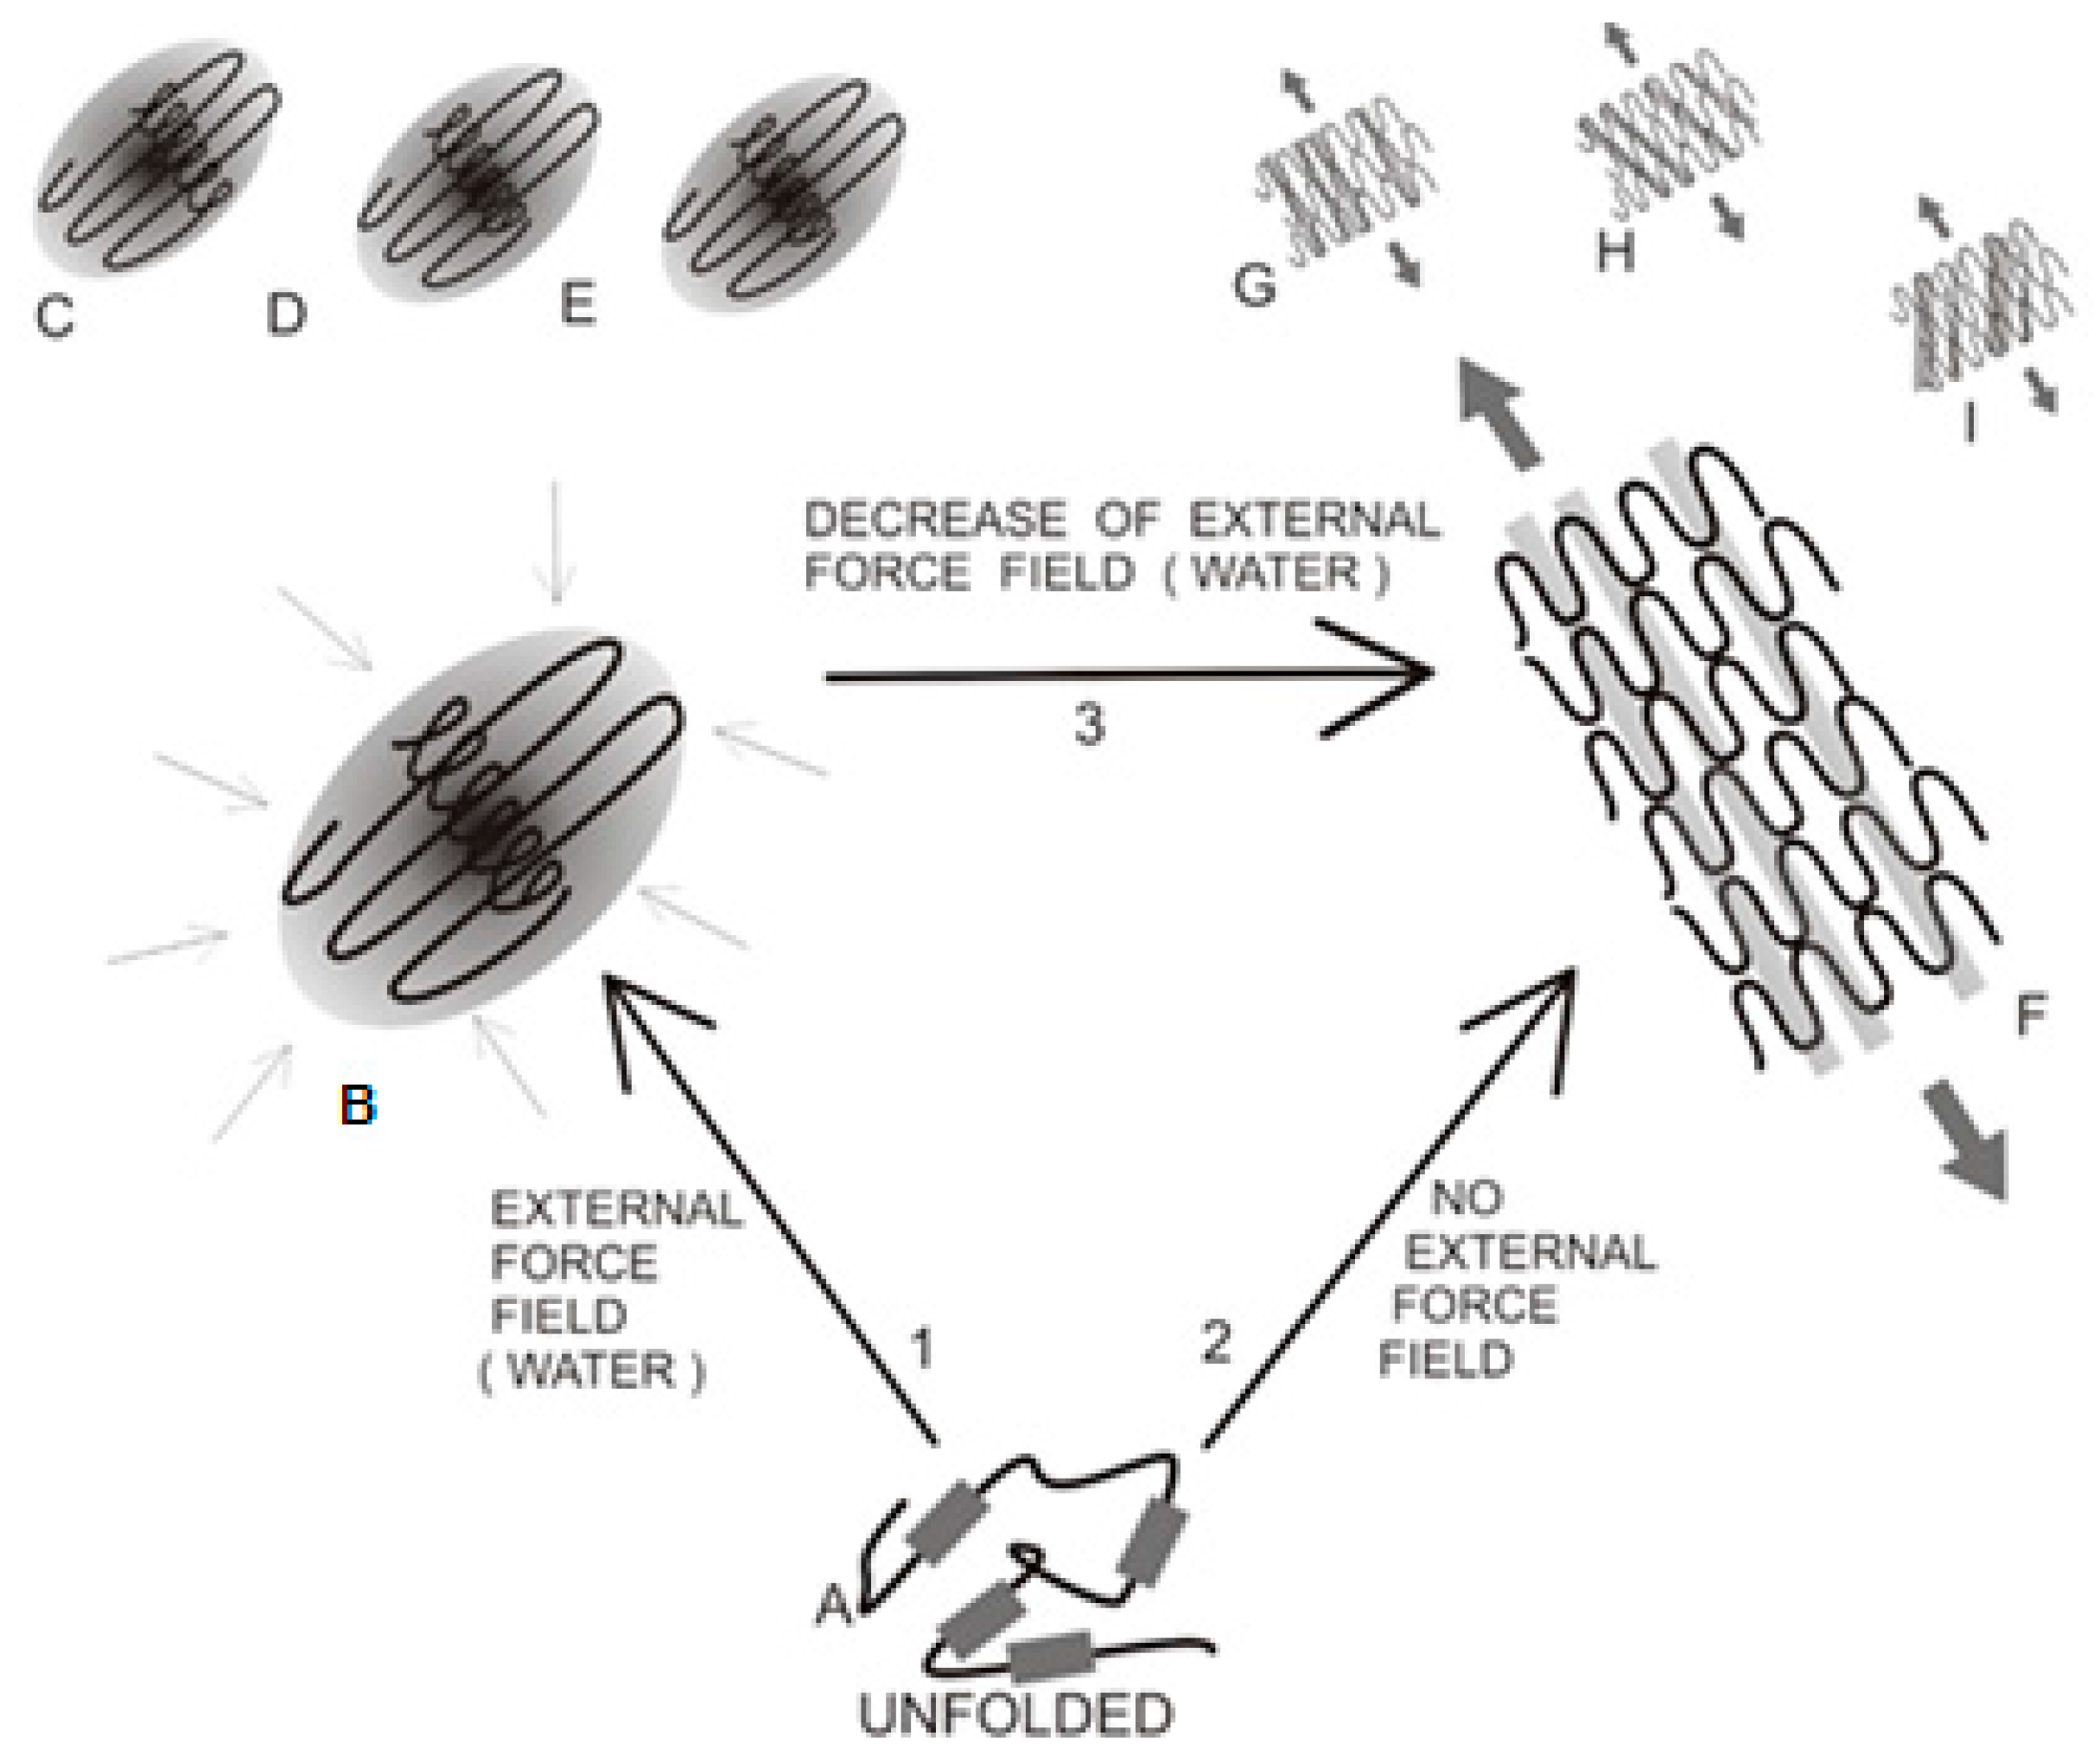
Figure 16 graphically summarizes the presented study of mechanisms responsible for generating both native and fibrillar structures.
Acknowledgments
The authors would like to express their thanks to Piotr Nowakowski and Anna Śmietańska for valuable suggestions and editorial work. This research was supported by the Jagiellonian University Medical College grant No. K/ZDS/006363 and the Polish Government—Ministry of Science and Higher Education—KNOW system of grants.
Author Contributions
Irena Roterman and Leszek Konieczny conceived and designed the experiments; Mateusz Banach performed the experiments; Irena Roterman analyzed the data; Irena Roterman wrote the paper. All authors have read and approved the final manuscript.
Conflicts of Interest
The authors declare no conflict of interest.
References
- Prusiner, S.B. Novel proteinaceous infectious particles cause scrapie. Science 1982, 216, 136–144. [Google Scholar] [CrossRef] [PubMed]
- Prusiner, S.B. Detecting madcow disease. Sci. Am. 2004, 291, 86–93. [Google Scholar] [CrossRef] [PubMed]
- Stöhr, J.; Watts, J.C.; Mensinger, Z.L.; Oehler, A.; Grillo, S.K.; DeArmond, S.J.; Prusiner, S.B.; Giles, K. Purified and synthetic Alzheimer’s amyloid β (Aβ) prions. Proc. Natl. Acad. Sci. USA 2012, 109, 11025–11030. [Google Scholar] [CrossRef] [PubMed]
- Taubes, G. Misfolding the way to disease. Science 1996, 271, 1493–1495. [Google Scholar] [CrossRef] [PubMed]
- Purkey, H.E.; Dorrell, M.I.; Kelly, J.W. Evaluating the binding selectivity of transthyretin amyloid fibril inhibitors in blood plasma. Proc. Natl. Acad. Sci. USA 2001, 98, 5566–5571. [Google Scholar] [CrossRef] [PubMed]
- Gallardo, R.; Ramakers, M.; De Smet, F.; Claes, F.; Khodaparast, L.; Khodaparast, L.; Couceiro, J.R.; Langenberg, T.; Siemons, M.; Nyström, S.; et al. De novo design of a biologically active amyloid. Science 2016, 354, 6313. [Google Scholar] [CrossRef] [PubMed]
- Konieczny, L.; Bryliński, M.; Roterman, I. Gauss-function-based model of hydrophobicity density in proteins. In Silico Biol. 2006, 6, 15–22. [Google Scholar] [PubMed]
- Banach, M.; Konieczny, L.; Roterman, I. Ligand-binding site recognition. In Protein Folding in Silico—Protein Folding Versus Protein Structure Prediction; Roterman, I., Ed.; Woodhead Publishing: Cambridge, UK, 2012; pp. 79–94. [Google Scholar]
- Banach, M.; Konieczny, L.; Roterman, I. Use of the “fuzzy oil drop” model to identify the complexation area in protein homodimers. In Protein Folding in Silico—Protein Folding Versus Protein Structure Prediction; Roterman, I., Ed.; Woodhead Publishing: Cambridge, UK, 2012; pp. 95–122. [Google Scholar]
- Dygut, J.; Kalinowska, B.; Banach, M.; Piwowar, M.; Konieczny, L.; Roterman, I. Structural Interface Forms and Their Involvement in Stabilization of Multidomain Proteins or Protein Complexes. Int. J. Mol. Sci. 2016, 17, 1741. [Google Scholar] [CrossRef] [PubMed]
- Versace, R.E.; Lazaridis, T. Modeling Protein–Micelle Systems in Implicit Water. J. Phys. Chem. B 2015, 119, 8037–8047. [Google Scholar] [CrossRef] [PubMed]
- Wimley, W.C.; Hristova, K.; Ladokhin, A.S.; Silvestro, L.; Axelsen, P.H.; White, S.H. Folding of β-sheet membrane proteins: A hydrophobic hexapeptide model. J. Mol. Biol. 1998, 277, 1091–1110. [Google Scholar] [CrossRef] [PubMed]
- Di Bartolo, N.; Compton, E.L.; Warne, T.; Edwards, P.C.; Tate, C.G.; Schertler, G.F.; Booth, P.J. Complete Reversible Refolding of a G-Protein Coupled Receptor on a Solid Support. PLoS ONE 2016, 11, e0151582. [Google Scholar] [CrossRef] [PubMed]
- Huang, R.; Xiang, L.; Liu, Y.; Deng, X.; Cao, X.; Li, L.; Yu, C.; Chen, Y.; Tang, G. Synthesis and in vitro evaluation of pH-sensitive PEG-I-dC16 block polymer micelles for anticancer drug delivery. J. Pharm. Pharmacol. 2016, 68, 751–761. [Google Scholar]
- Jaskula-Sztul, R.; Xu, W.; Chen, G.; Harrison, A.; Dammalapati, A.; Nair, R.; Cheng, Y.; Gong, S.; Chen, H. Thailandepsin A-loaded and octreotide-functionalized unimolecular micelles for targeted neuroendocrine cancer therapy. Biomaterials 2016, 91, 1–10. [Google Scholar] [CrossRef] [PubMed]
- Bar-Zeev, M.; Assaraf, Y.; Livney, Y.D. β-casein nanovehicles for oral delivery of chemotherapeutic Drug combinations overcoming P-glycoprotein-mediated multidrug resistance in human gastric cancer cells. Oncotarget 2016, 7, 23322–23334. [Google Scholar] [CrossRef] [PubMed]
- Matsumoto, Y.; Miyamoto, Y.; Cabral, H.; Matsumoto, Y.; Nagasaka, K.; Nakagawa, S.; Yano, T.; Maeda, D.; Oda, K.; Kawana, K.; et al. Enhanced efficacy against cervical carcinomas through polymeric micelles physically incorporating the proteasome inhibitor MG132. Cancer Sci. 2016, 107, 773–7781. [Google Scholar] [CrossRef] [PubMed]
- Lim, C.; Youn, Y.S.; Lee, K.S.; Hoang, N.H.; Sim, T.; Lee, E.S.; Oh, K.T. Development of a robust pH-sensitive polyelectrolyte ionomer complex for anticancer nanocarriers. Int. J. Nanomed. 2016, 11, 703–713. [Google Scholar]
- Chren, Y.; Huang, Y.; Qin, D.; Liu, W.; Song, C.; Lou, K.; Wang, W.; Gao, F. β-Cyclodextrin-Based Inclusion Complexation Bridged Biodegradable Self-Assembly Macromolecular Micelle for the Delivery of Paclitaxel. PLoS ONE 2016, 11, e0150877. [Google Scholar] [CrossRef]
- Karaca, M.; Dutta, R.; Ozsoy, Y.; Mahato, R.I. Micelle Mixtures for Coadministration of Gemcitabine and GDC-0449 to Treat Pancreatic Cancer. Mol. Pharm. 2016, 13, 1822–1832. [Google Scholar] [CrossRef] [PubMed]
- Tiana, G.; Simona, F.; Broglia, R.A.; Colombo, G. Thermodynamics of β-amyloid fibril formation. J. Chem. Phys. 2004, 120, 8307–8317. [Google Scholar] [CrossRef] [PubMed]
- Serra-Batiste, M.; Ninot-Pedrosa, M.; Bayoumi, M.; Gairí, M.; Maglia, G.; Carulla, N. Aβ42 assembles into specific β-barrel pore-forming oligomers in membrane-mimicking environments. Proc. Natl. Acad. Sci. USA 2016, 113, 10866–10871. [Google Scholar] [CrossRef] [PubMed]
- So, M.; Ishii, A.; Hata, Y.; Yagi, H.; Naiki, H.; Goto, Y. Supersaturation-Limited and Unlimited Phase Spaces Compete to Produce Maximal Amyloid Fibrillation near the Critical Micelle Concentration of Sodium Dodecyl Sulfate. Langmuir 2015, 31, 9973–9982. [Google Scholar] [CrossRef] [PubMed]
- Kohno, T.; Kobayashi, K.; Maeda, T.; Sato, K.; Takashima, A. Three-dimensional structures of the amyloid β peptide (25–35) in membrane-mimicking environment. Biochemistry 1996, 35, 16094–16104. [Google Scholar] [CrossRef] [PubMed]
- Riek, R.; Eisenberg, D.S. The activities of amyloids from a structural perspective. Nature 2016, 339, 227–235. [Google Scholar] [CrossRef] [PubMed]
- Xiao, Y.; Ma, B.; McElheny, D.; Parthasarathy, S.; Long, F.; Hoshi, M.; Nussinov, R.; Ishii, Y. Aβ(1–42) fibril structure illuminates self-recognition and replication of amyloid in Alzheimer’s disease. Nat. Struct. Mol. Biol. 2015, 22, 499–505. [Google Scholar] [CrossRef] [PubMed]
- Huang, W.; Matte, A.; Li, Y.; Kim, Y.S.; Linhardt, R.J.; Su, H.; Cygler, M. Crystal structure of chondroitinase B from Flavobacterium heparinum and its complex with a disaccharide product at 1.7 A resolution. J. Mol. Biol. 1999, 294, 1257–1269. [Google Scholar] [CrossRef] [PubMed]
- Nelson, R.; Sawaya, M.R.; Balbirnie, M.; Madsen, A.Ø.; Riekel, C.; Grothe, R.; Eisenberg, D. Structure of the cross-β spine of amyloid-like fibrils. Nature 2005, 435, 773–778. [Google Scholar] [CrossRef] [PubMed]
- Colletier, J.P.; Laganowsky, A.; Landau, M.; Zhao, M.; Soriaga, A.B.; Goldschmidt, L.; Flot, D.; Cascio, D.; Sawaya, M.R.; Eisenberg, D. Molecular basis for amyloid-β polymorphism. Proc. Natl. Acad. Sci. USA 2011, 108, 16938–16943. [Google Scholar] [CrossRef] [PubMed]
- Wiltzius, J.J.; Landau, M.; Nelson, R.; Sawaya, M.R.; Apostol, M.I.; Goldschmidt, L.; Soriaga, A.B.; Cascio, D.; Rajashankar, K.; Eisenberg, D. Molecular mechanisms for protein-encoded inheritance. Nat. Struct. Mol. Biol. 2009, 16, 973–978. [Google Scholar] [CrossRef] [PubMed]
- Liu, C.; Sawaya, M.R.; Eisenberg, D. β2-microglobulin forms three-dimensional domain-swapped amyloid fibrils with disulfide linkages. Nat. Struct. Mol. Biol. 2011, 18, 49–55. [Google Scholar] [CrossRef] [PubMed]
- Apostol, M.I.; Wiltzius, J.J.; Sawaya, M.R.; Cascio, D.; Eisenberg, D. Atomic structures suggest determinants of transmission barriers in mammalian prion disease. Biochemistry 2011, 50, 2456–2463. [Google Scholar] [CrossRef] [PubMed]
- Apostol, M.; Sawaya, M.R.; Cascio, D.; Eisenberg, D. Crystallographic studies of prion protein (PrP) segments suggest how structural changes encoded by polymorphism at residue 129 modulate susceptibility to human prion disease. J. Biol. Chem. 2010, 285, 29671–29675. [Google Scholar] [CrossRef] [PubMed]
- Emsley, P.; Charles, I.G.; Fairweather, N.F.; Isaacs, N.W. Structure of Bordetella pertussis virulence factor P.69 pertactin. Nature 1996, 381, 90–92. [Google Scholar] [CrossRef] [PubMed]
- Kalinowska, B.; Banach, M.; Konieczny, L.; Roterman, I. Application of Divergence Entropy to Characterize the Structure of the Hydrophobic Core in DNA Interacting Proteins. Entropy 2015, 17, 1477–1507. [Google Scholar] [CrossRef]
- Roterman, I.; Banach, M.; Kalinowska, B.; Konieczny, L. Influence of the Aqueous Environment on Protein Structure—A Plausible Hypothesis Concerning the Mechanism of Amyloidogenesis. Entropy 2016, 18, 351. [Google Scholar] [CrossRef]
- Kullback, S.; Leibler, R.A. On information and sufficiency. Ann. Math. Stat. 1951, 22, 79–86. [Google Scholar] [CrossRef]
- Król, M.; Borowski, T.; Roterman, I.; Piekarska, B.; Stopa, B.; Rybarska, J.; Konieczny, L. Force-field parametrization and molecular dynamics simulations of Congo red. J. Comput. Aided Mol. Des. 2004, 18, 41–53. [Google Scholar] [CrossRef] [PubMed]
- Banach, M.; Prymula, K.; Jurkowski, W.; Konieczny, L.; Roterman, I. Fuzzy oil drop model to interpret the structure of antifreeze proteins and their mutants. J. Mol. Model. 2012, 18, 229–237. [Google Scholar] [CrossRef] [PubMed]
- Roterman, I.; Konieczny, L.; Jurkowski, W.; Prymula, K.; Banach, M. Two-intermediate model to characterize the structure of fast-folding proteins. J. Theor. Biol. 2011, 283, 60–70. [Google Scholar] [CrossRef] [PubMed]
- Wada, K.; Sumi, N.; Nagai, R.; Iwasaki, K.; Sato, T.; Suzuki, K.; Hasegawa, Y.; Kitaoka, S.; Minami, Y.; Outten, F.W.; et al. Molecular dynamism of fe-S cluster biosynthesis implicated by the structure of the sufc2-Sufd2 complex. J. Mol. Biol. 2009, 387, 245–258. [Google Scholar] [CrossRef] [PubMed]
- Zhao, X. Protein structure determination by solid-state NMR. Top. Curr. Chem. 2012, 326, 187–213. [Google Scholar] [PubMed]
- Wang, S.; Munro, R.A.; Shi, L.; Kawamura, I.; Okitsu, T.; Wada, A.; Kim, S.-Y.; Hwan, K.; Jung, K.-H.; Brown, L.-S.; et al. Solid-state NMR spectroscopy structure determination of a lipid-embedded heptahelical membrane protein. Nat. Methods 2013, 10, 1007–1012. [Google Scholar] [CrossRef] [PubMed]
- Roterman, I.; Banach, M.; Konieczny, L. Stop signals preventing the linear propagation of hydrophobicity in proteins. IJMS 2017. submitted. [Google Scholar]
- Banach, M.; Konieczny, L.; Roterman, I. The fuzzy oil drop model, based on hydrophobicity density distribution, generalizes the influence of water environment on protein structure and function. J. Theor. Biol. 2014, 359, 6–17. [Google Scholar] [CrossRef] [PubMed]
- Levinthal, C. Are there pathways for protein folding. J. Chem. Phys. 1968, 65, 44–45. [Google Scholar]
- Tanford, C. Protein denaturation. Adv. Protein Chem. 1968, 23, 121–282. [Google Scholar] [PubMed]
- Agashe, V.R.; Shastry, M.C.; Udgaonkar, J.B. Initial hydrophobic collapse in the folding of barstar. Nature 1995, 377, 754–757. [Google Scholar] [CrossRef] [PubMed]
- Duan, Y.; Kollman, P.A. Pathways to a protein folding intermediate observed in a 1-microsecond simulation in aqueous solution. Science 1998, 282, 740–744. [Google Scholar] [CrossRef] [PubMed]
- Burke, M.G.; Woscholski, R.; Yaliraki, S.N. Differential hydrophobicity drives self-assembly in Huntington’s disease. Proc. Natl. Acad. Sci. USA 2003, 100, 13928–13933. [Google Scholar] [CrossRef] [PubMed]
- Jurkowski, W.; Brylinski, M.; Konieczny, L.; Wiíniowski, Z.; Roterman, I. Conformational subspace in simulation of early-stage protein folding. Proteins 2004, 55, 115–127. [Google Scholar] [CrossRef] [PubMed]
- Serpell, L.C. Alzheimer’s amyloid fibrils: Structure and assembly. Biochim. Biophys. Acta 2000, 1502, 16–30. [Google Scholar] [CrossRef]
- Biedermann, F.; Nau, W.M.; Schneider, H.-J. The hydrophobic effect revisited—Studies with supramolecular complexes imply high-energy water as a noncovalent driving force. Angew. Chem. 2014, 53, 11158–11171. [Google Scholar] [CrossRef] [PubMed]
- Ben-Naim, A. Solvent-induced interactions: Hydrophobic and Hydrophilic Phenomena. J. Chem. Phys. 1989, 90, 7412–7525. [Google Scholar] [CrossRef]
- Grimaldi, M.; Scrima, M.; Esposito, C.; Vitiello, G.; Ramunno, A.; Limongelli, V.; D’Errico, G.; Novellino, E.; D’Ursi, A.M. Membrane charge dependent states of the β-amyloid fragment Aβ (16–35) with differently charged micelle aggregates. Biochim. Biophys. Acta 2010, 1798, 660–671. [Google Scholar] [CrossRef] [PubMed]
- Rhoades, E.; Gafni, A. Micelle formation by a fragment of human islet amyloid polypeptide. Biophys. J. 2003, 84, 3480–3487. [Google Scholar] [CrossRef]
- Bisaglia, M.; Trolio, A.; Bellanda, M.; Bergantino, E.; Bubacco, L.; Mammi, S. Structure and topology of the non-amyloid-β component fragment of human alpha-synuclein bound to micelles: Implications for the aggregation process. Protein Sci. 2006, 15, 1408–1416. [Google Scholar] [CrossRef] [PubMed]
- Qin, Z.; Hu, D.; Zhu, M.; Fink, A.L. Structural chracterisation of the partially folder intermediates of an immunoglobulin Ligot chain leading to amyloid fibrillation and amorphous aggregation. Biochemistry 2007, 46, 3521–3531. [Google Scholar] [CrossRef] [PubMed]
- Selkoe, D.J. Folding proteins in fatal ways. Nature 2003, 426, 900–904. [Google Scholar] [CrossRef] [PubMed]
Figure 1.
One-dimensional representation of fuzzy oil drop model parameters. (A) The leftmost chart (blue) presents the idealized Gaussian distribution (T) while the chart on the right corresponds to the uniform distribution (R) (green). (B) Actual hydrophobicity distribution (expressed by the RD parameter—red line) for the target protein is shown in the center and marked on the axis with a red dot. According to the fuzzy oil drop model, this protein contains a well-defined hydrophobic core. (C) Uniform distribution without any concentration of hydrophobicity in any point of the protein body. Vertical axes represent hydrophobicity, while horizontal axes represent distance (in multiplicities of σx). According to the three-sigma rule, the range between 0 + 3σ and 0 − 3σ covers more than 99% of the entire probability expressed by the Gaussian—hence a range of −4σ to +4σ is plotted. (D) The bottom axis shows the full range of the RD coefficient—from 0 (perfect Gaussian) to 1 (uniform distribution with no concentration of hydrophobicity at any point in the protein body).

Figure 2.
Spherical micelle (A): a micellar structure which satisfies σx = σy = σz; (B–D): planar diagrams illustrating the distribution of hydrophobicity along each axis.
Figure 2.
Spherical micelle (A): a micellar structure which satisfies σx = σy = σz; (B–D): planar diagrams illustrating the distribution of hydrophobicity along each axis.
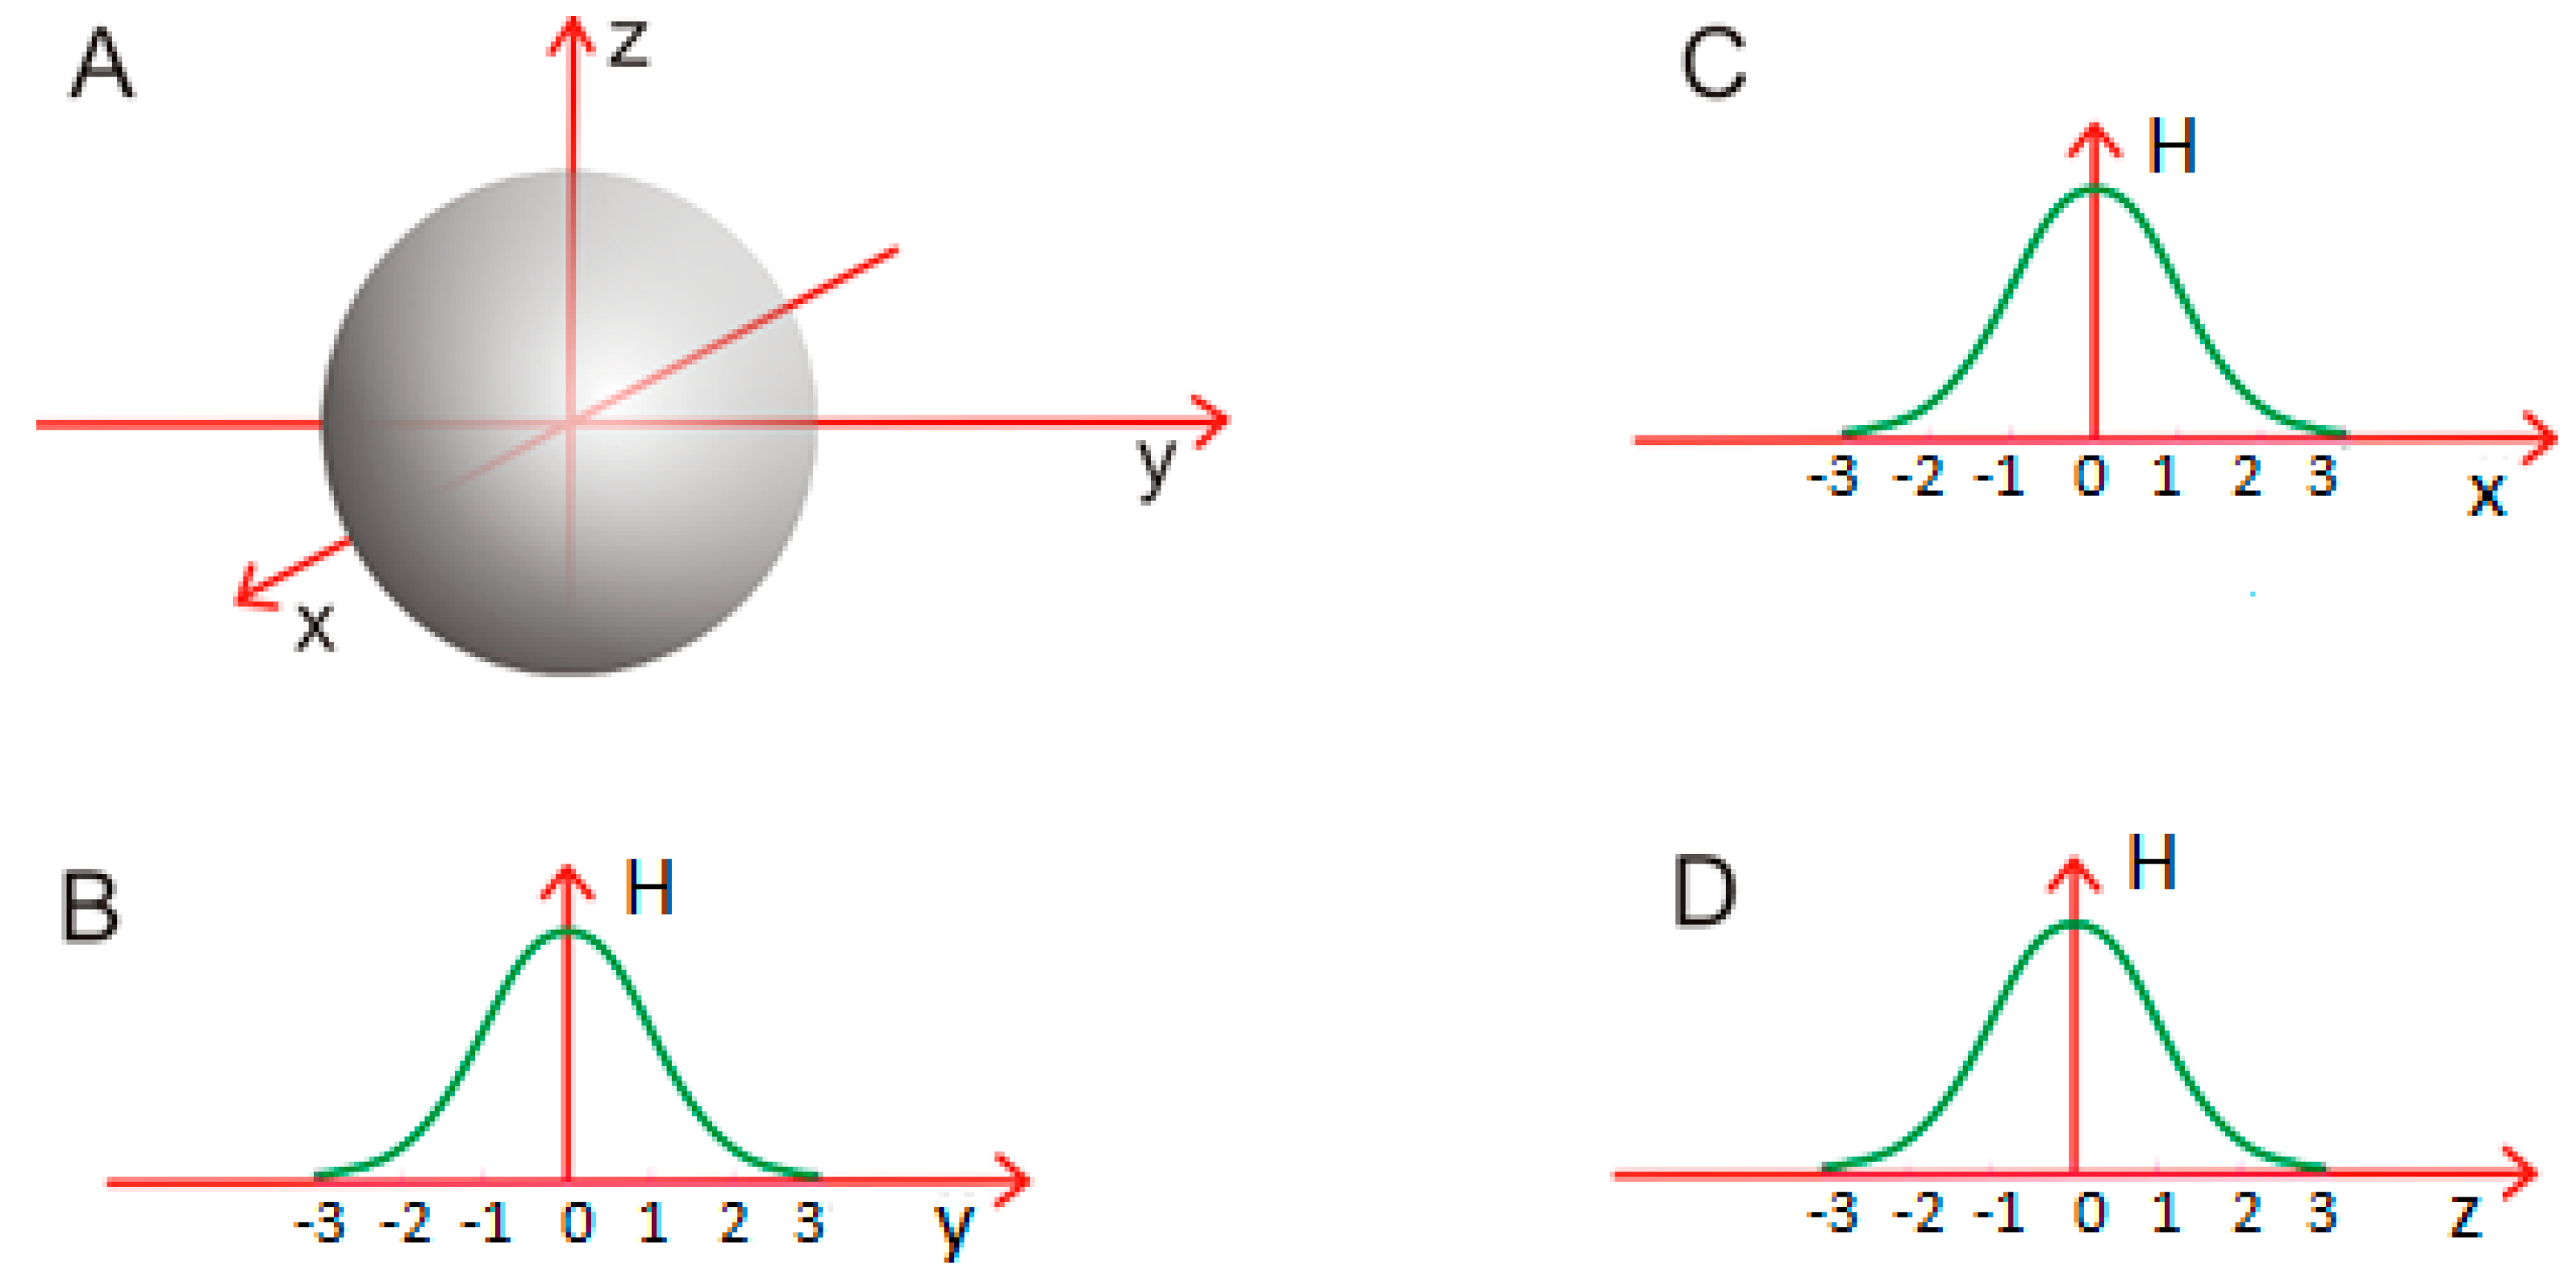
Figure 3.
An elongated globular micelle which satisfies σy > σx = σz (A); (B–D)—The distribution of hydrophobicity is stretched along the Y axis, with the remaining two axes (X and Z) unchanged. The cross-section in the XZ plane remains circular.
Figure 3.
An elongated globular micelle which satisfies σy > σx = σz (A); (B–D)—The distribution of hydrophobicity is stretched along the Y axis, with the remaining two axes (X and Z) unchanged. The cross-section in the XZ plane remains circular.
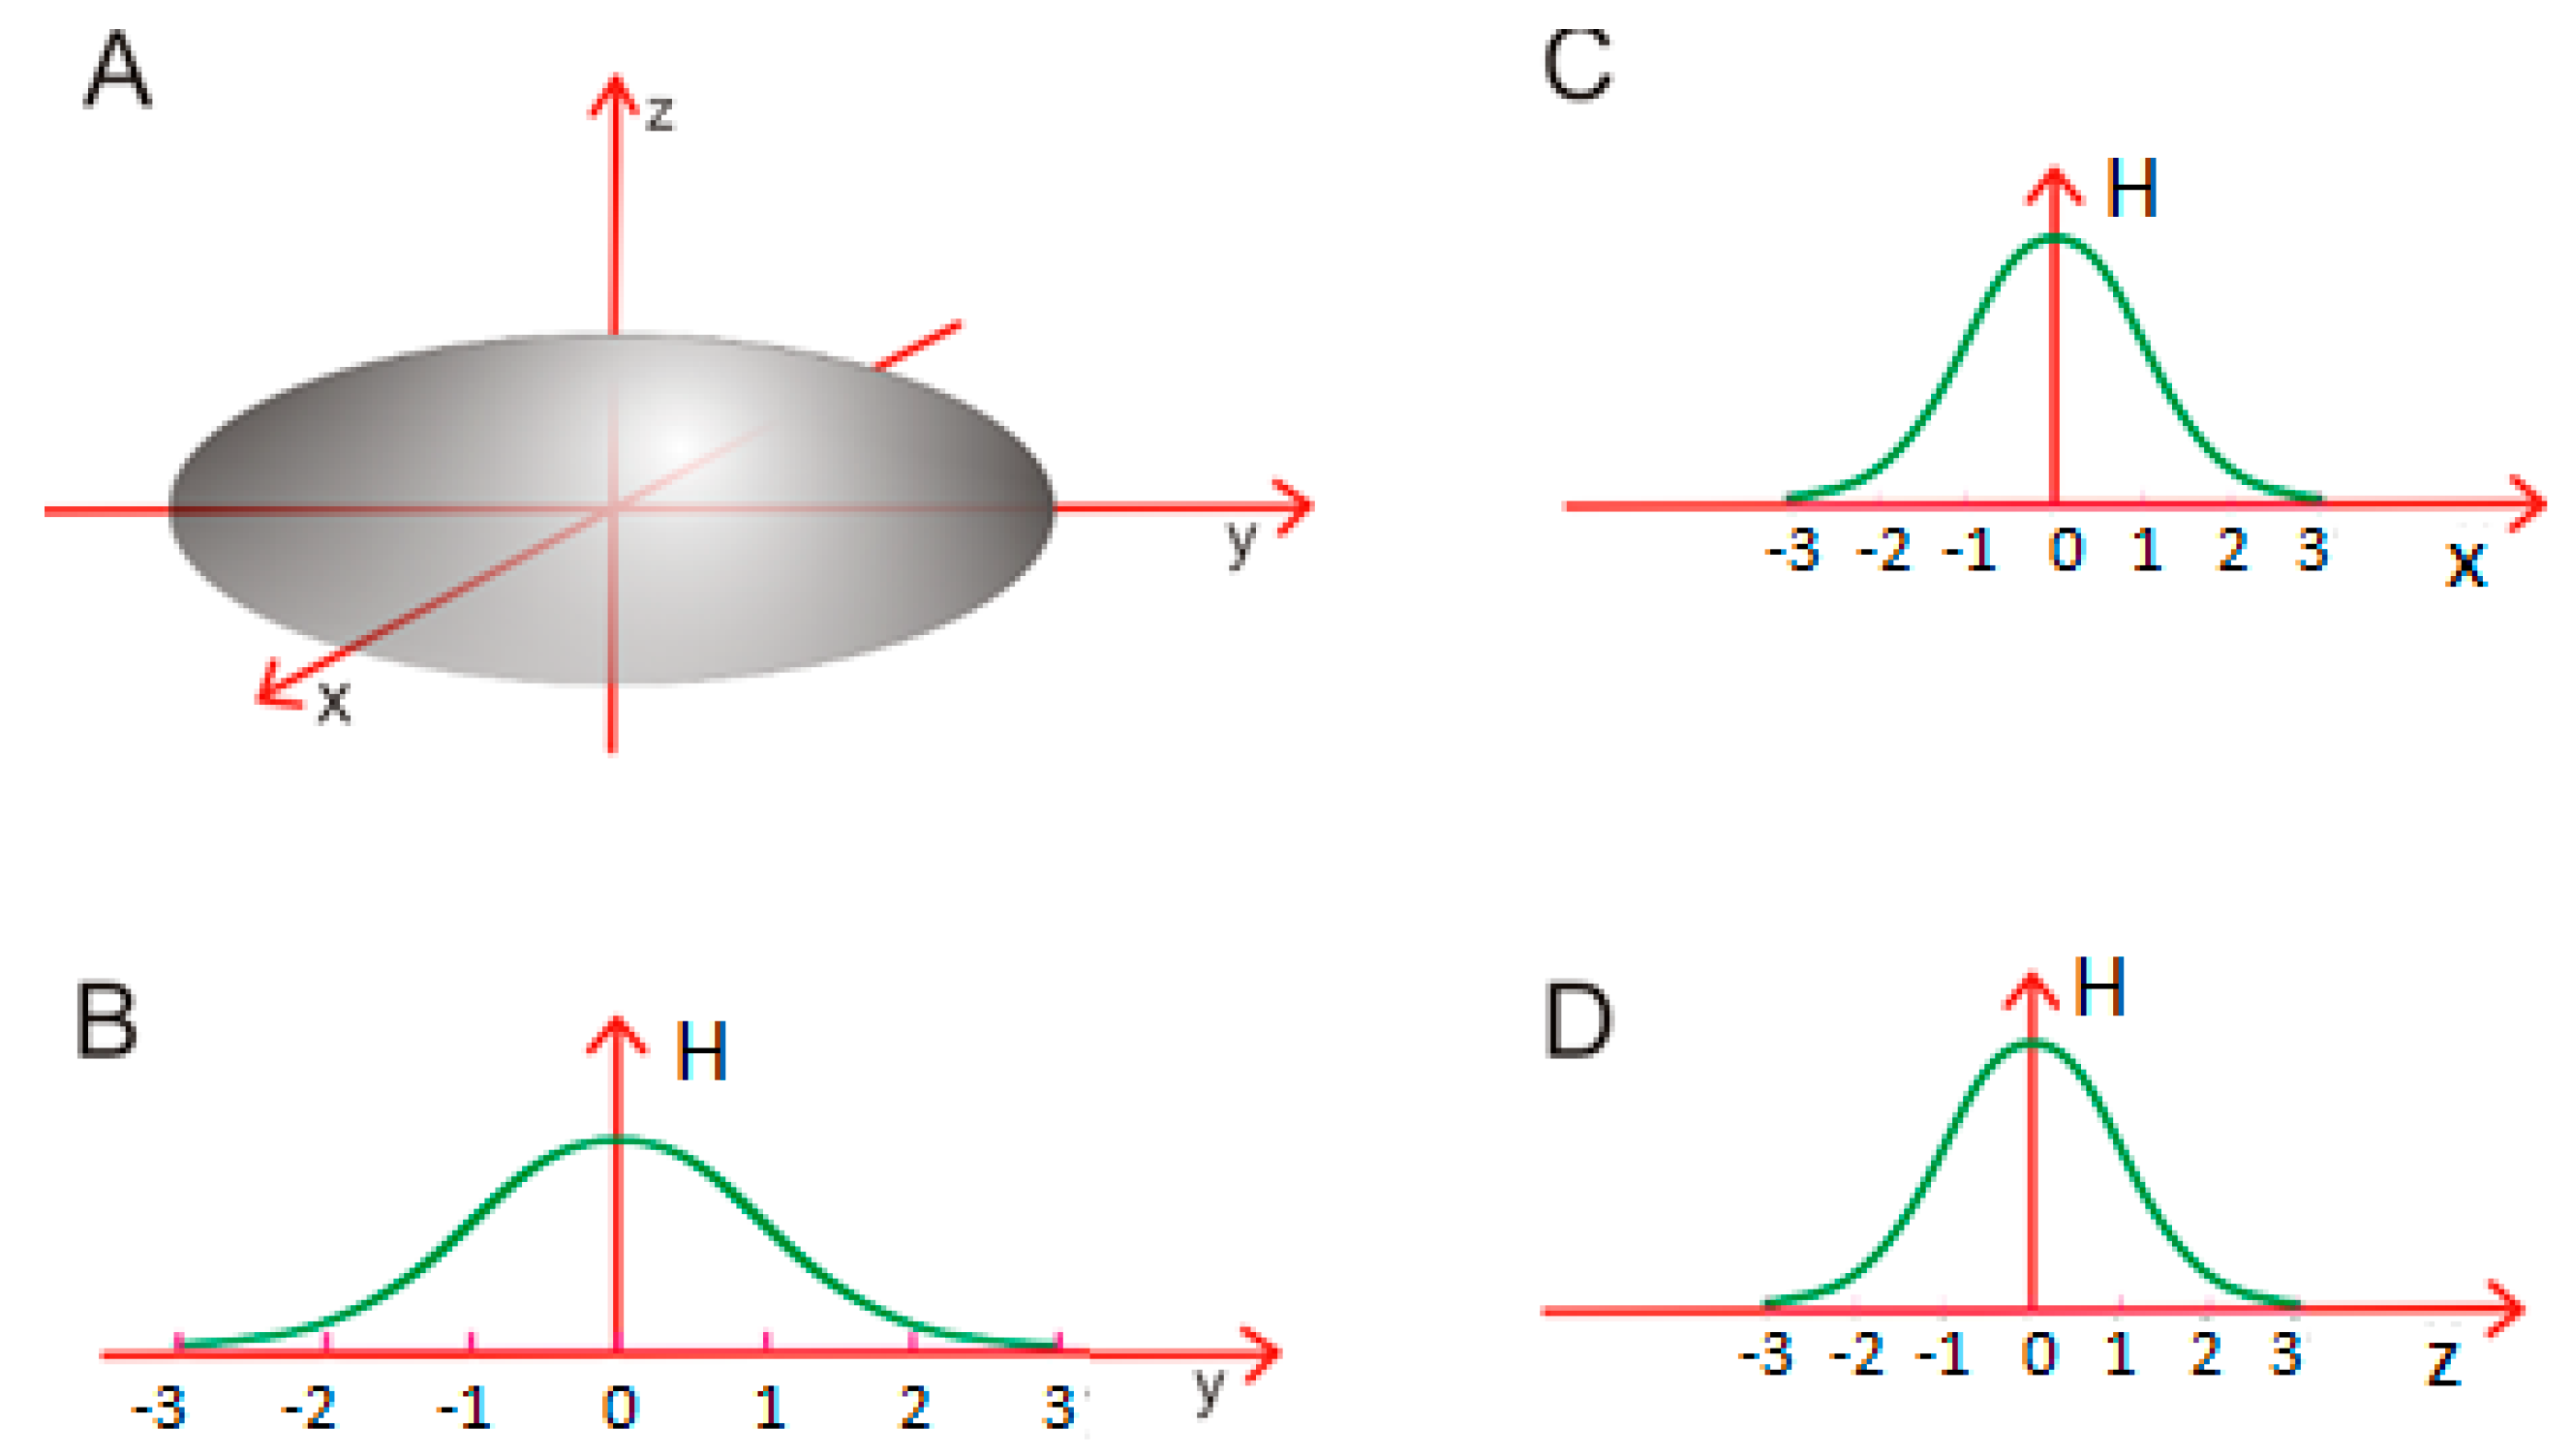
Figure 4.
A cylindrical micelle showing substantial elongation along the Y axis (A); (B–D)—changes in hydrophobicity along each axis. The XZ cross-section remains circular. This structure corresponds to σy >> σx = σz.
Figure 4.
A cylindrical micelle showing substantial elongation along the Y axis (A); (B–D)—changes in hydrophobicity along each axis. The XZ cross-section remains circular. This structure corresponds to σy >> σx = σz.

Figure 5.
A ribbonlike micelle. (A) distribution of hydrophobicity in a ribbonlike structure composed of polar molecules; (B–D) hypothetical distribution of hydrophobicity along each axis. This situation corresponds to σy >>>> σx > σz; (E) distribution along the X axis may deviate from the Gaussian.
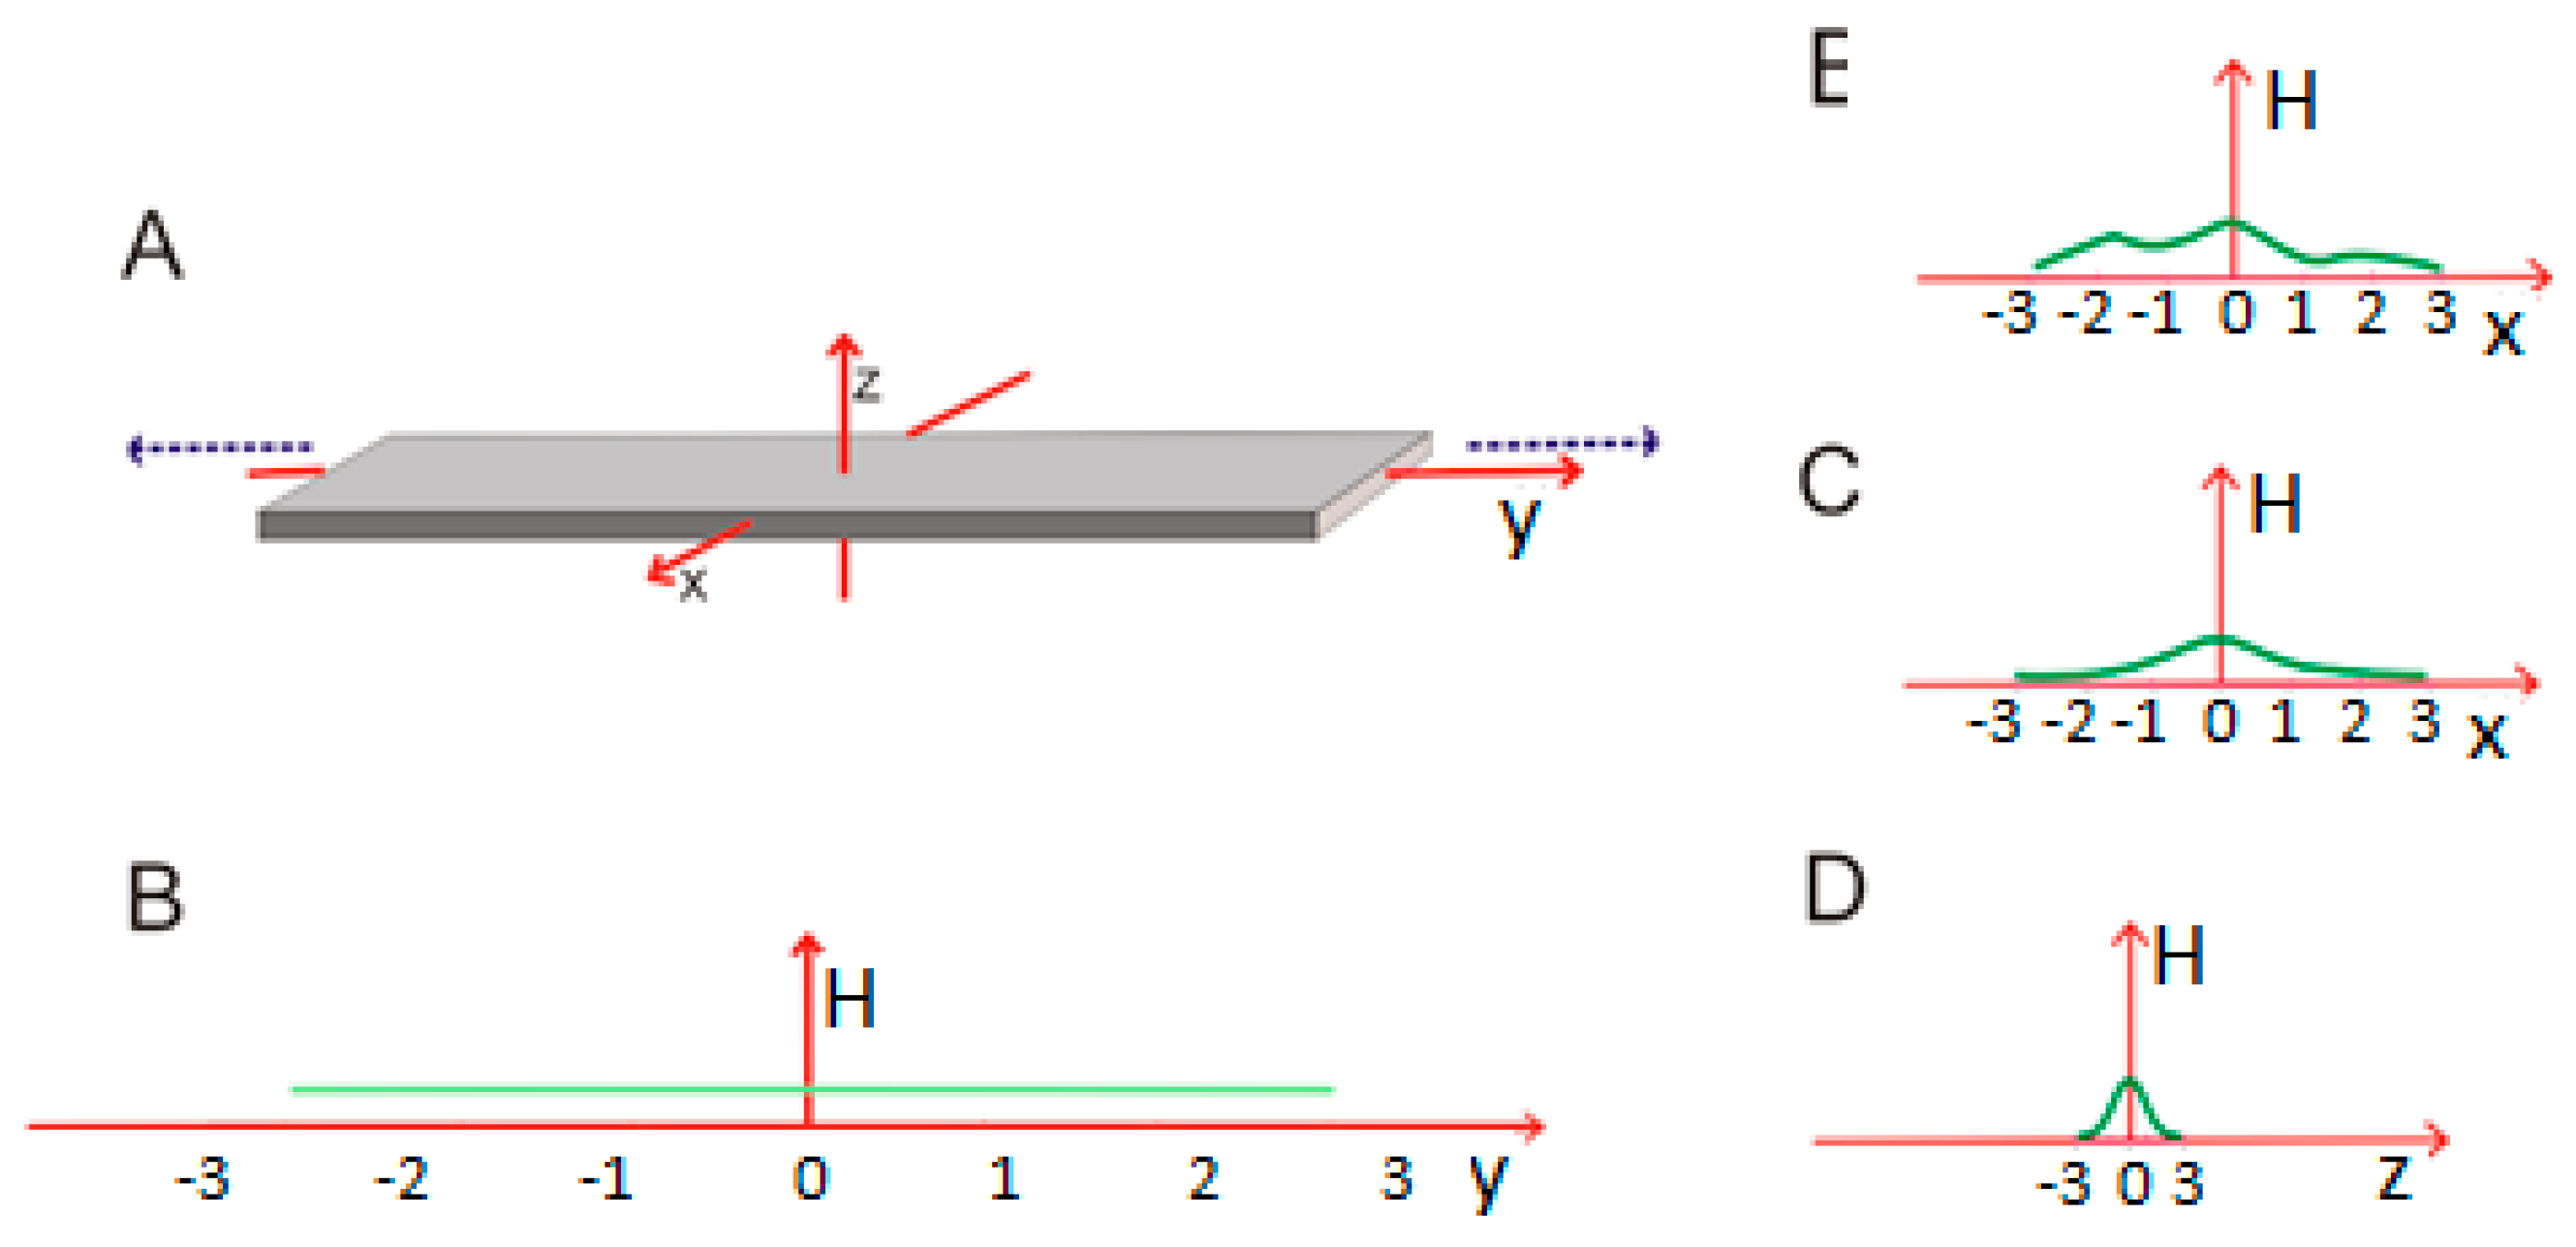
Figure 6.
Sample unit molecule (Congo red) forming a ribbonlike micelle. (A) formula of a symmetrical molecule prepared using BKChem (http://bkchem.zirael.org); (B) charge distribution (charges sorted by the X coordinate of each atom); (C) flipped charge distribution chart (assumed to reflect the distribution of hydrophobicity); (D) linear propagation of highly hydrophobic areas distinguished by circles (arbitrary units plotted on the vertical axis).

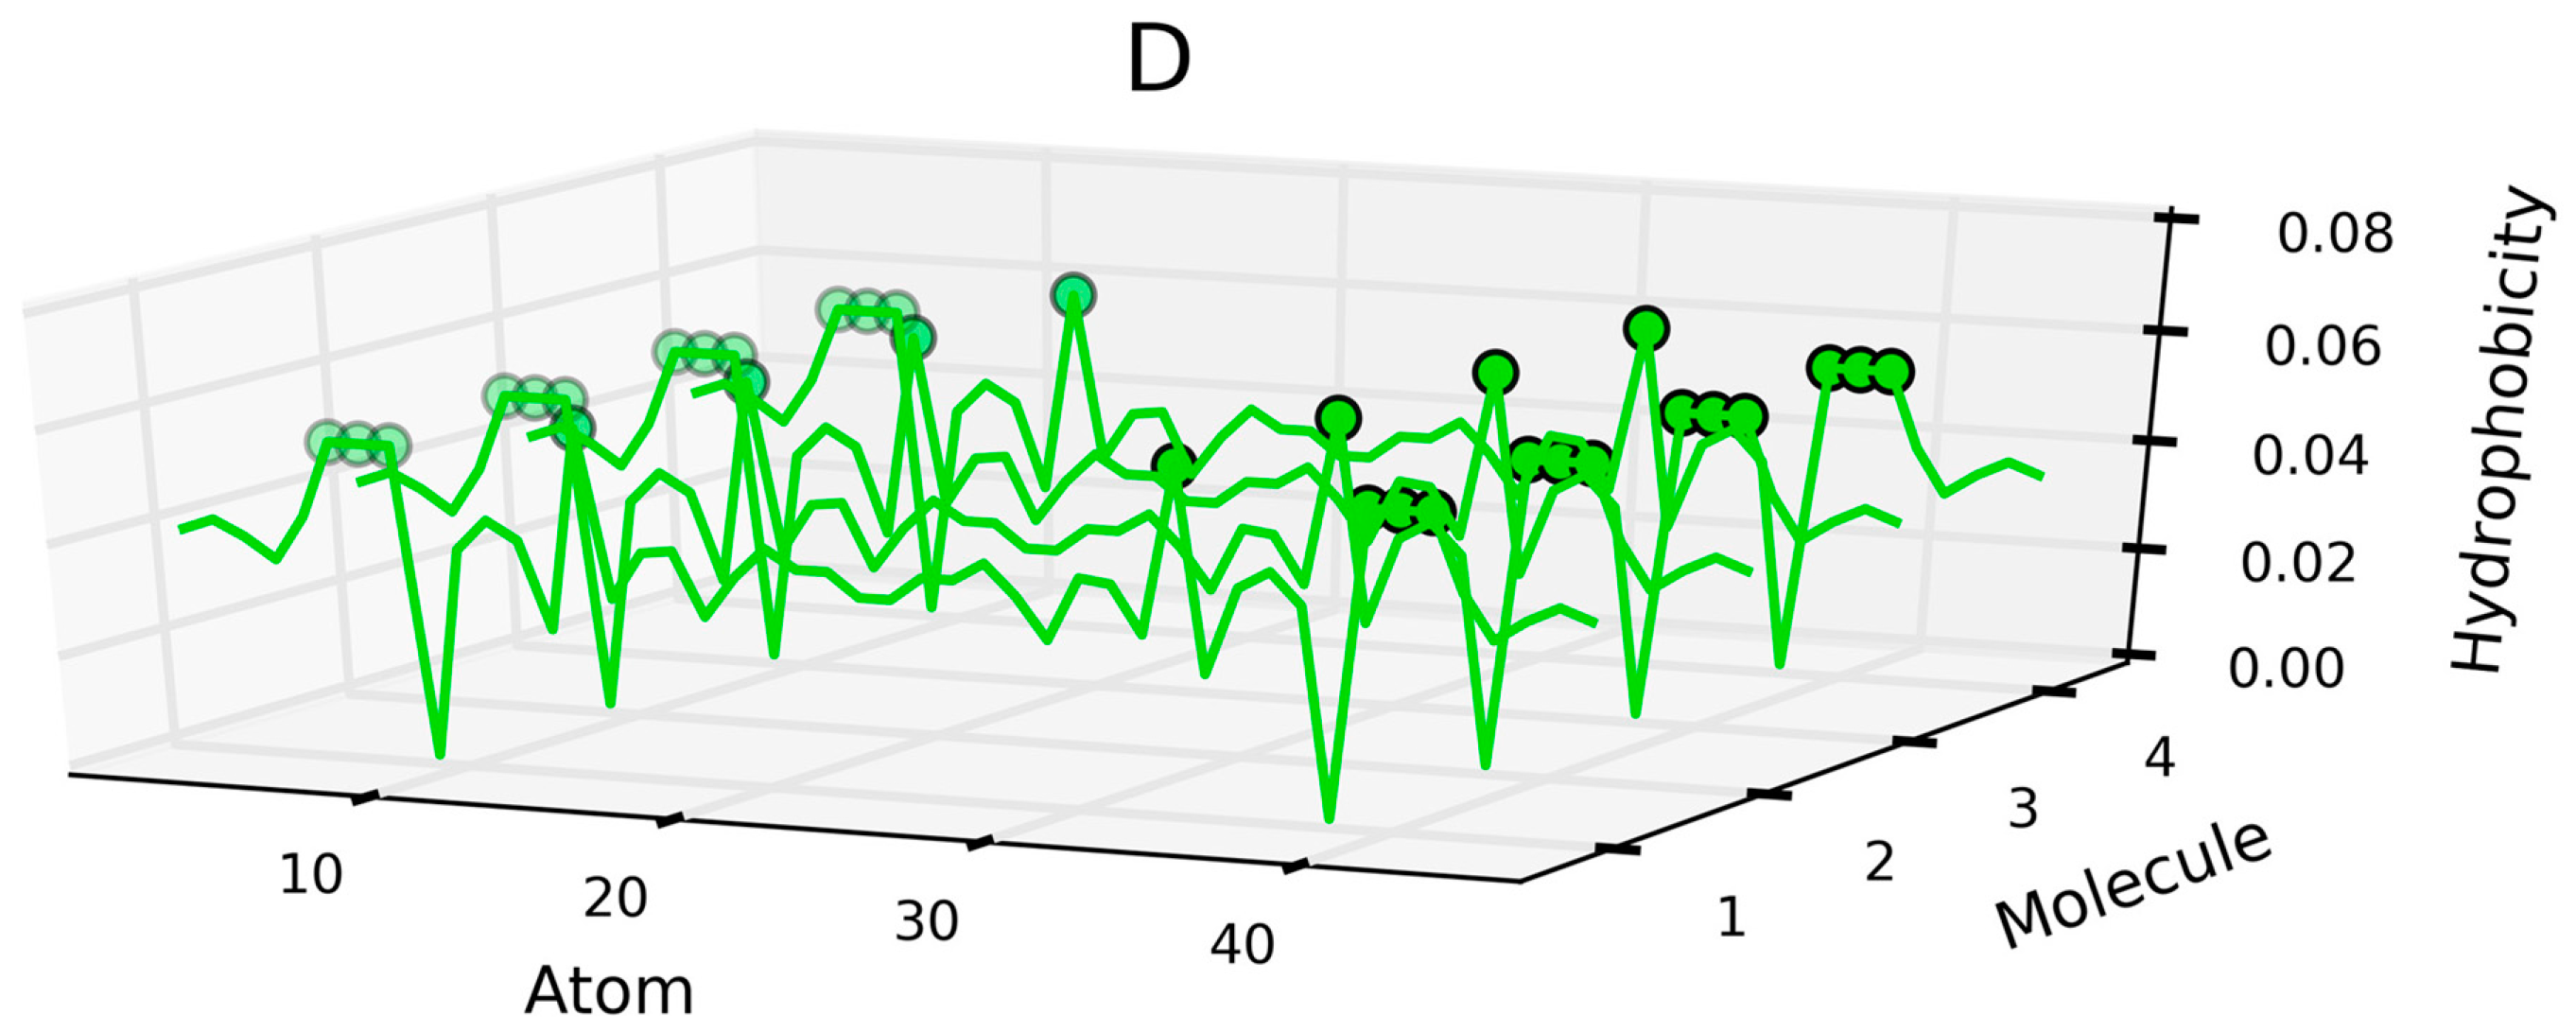
Figure 7.
Sample protein structures interpreted as micellar forms (yellow): (A) cylindrical micelle (1DAB); (B) dual-layer ribbonlike micelle (2ZU0, discussed in detail in [36]); (C) single-layer ribbonlike micelle (fragment of 2MXU [26]).
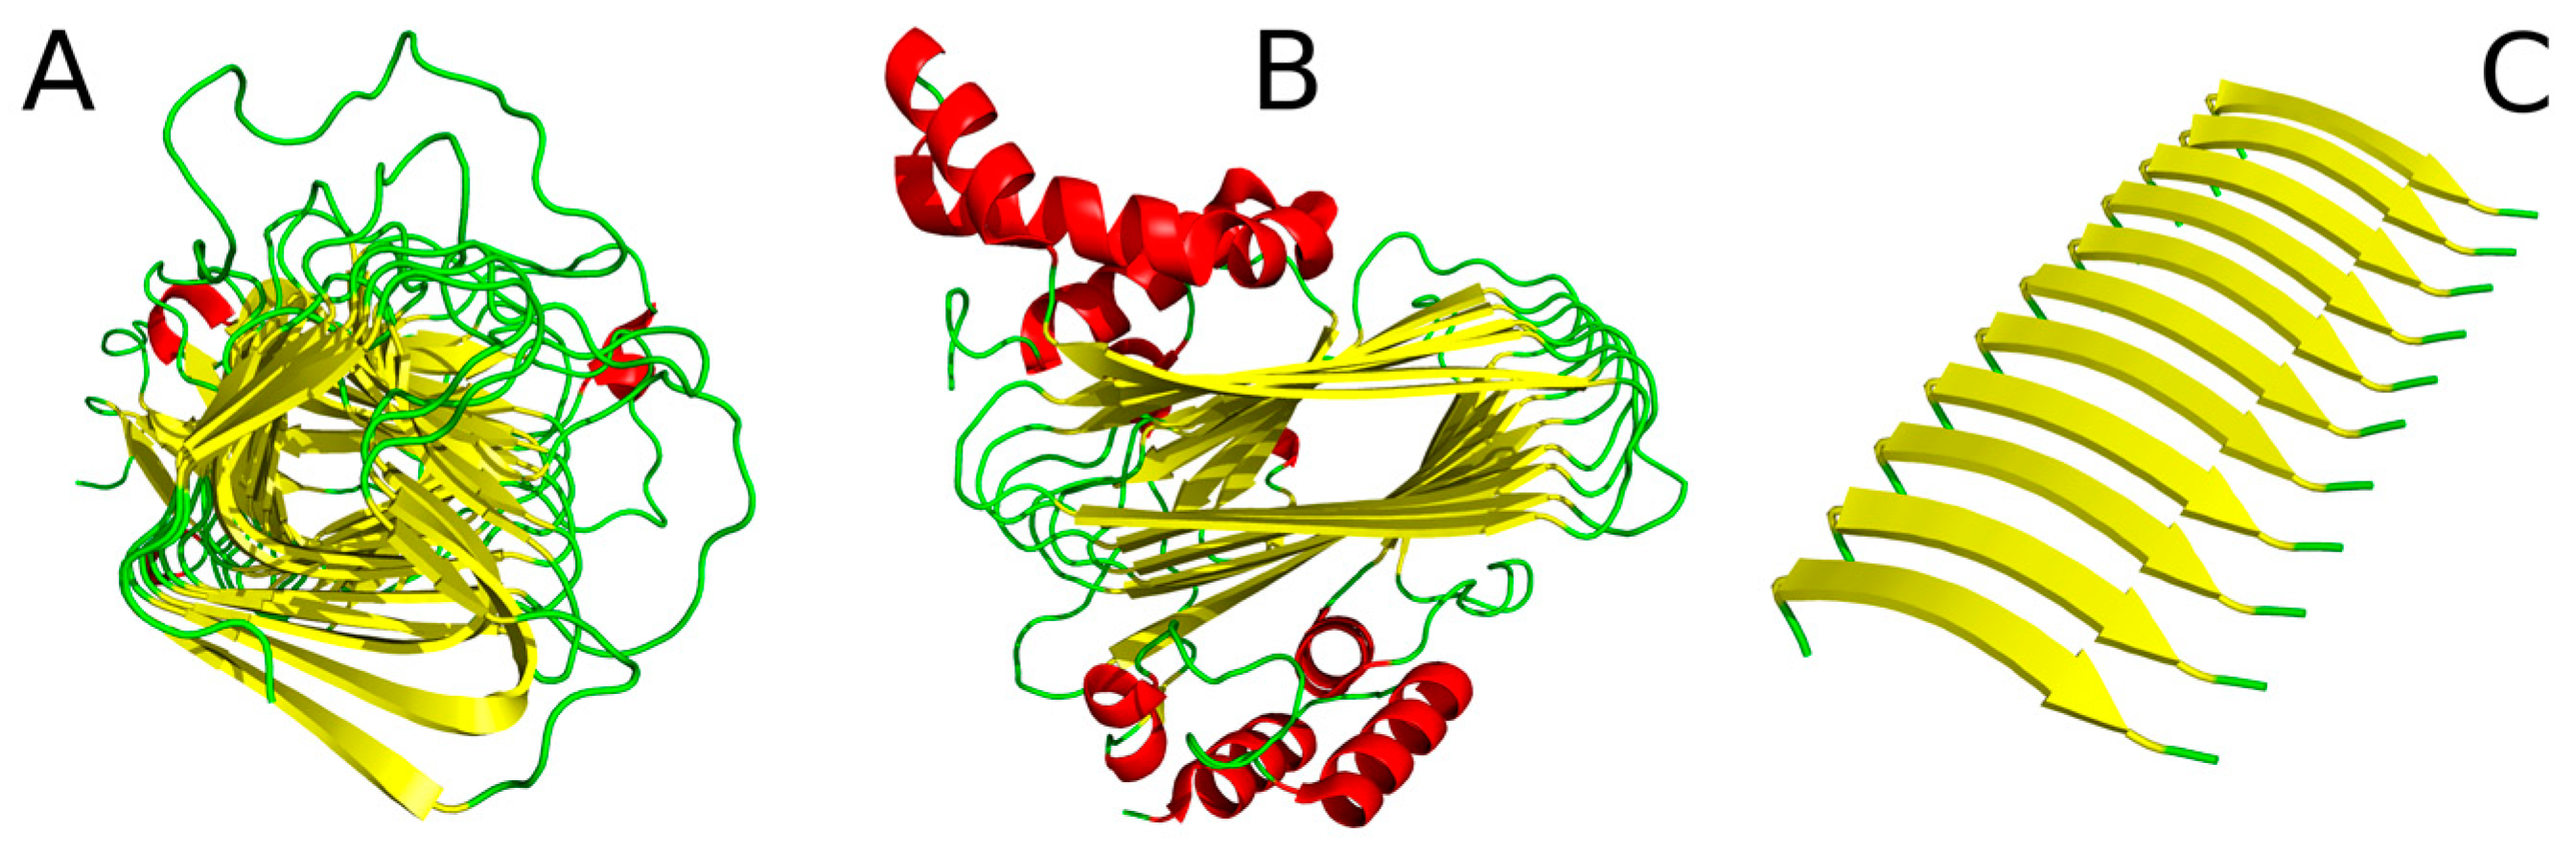
Figure 8.
The distribution of hydrophobicity (O) in cross-sections of the ribbonlike micelle (transverse axis) may deviate from the classic Gaussian. The image illustrates selected β strands (12–18) of 2MXU.
Figure 8.
The distribution of hydrophobicity (O) in cross-sections of the ribbonlike micelle (transverse axis) may deviate from the classic Gaussian. The image illustrates selected β strands (12–18) of 2MXU.

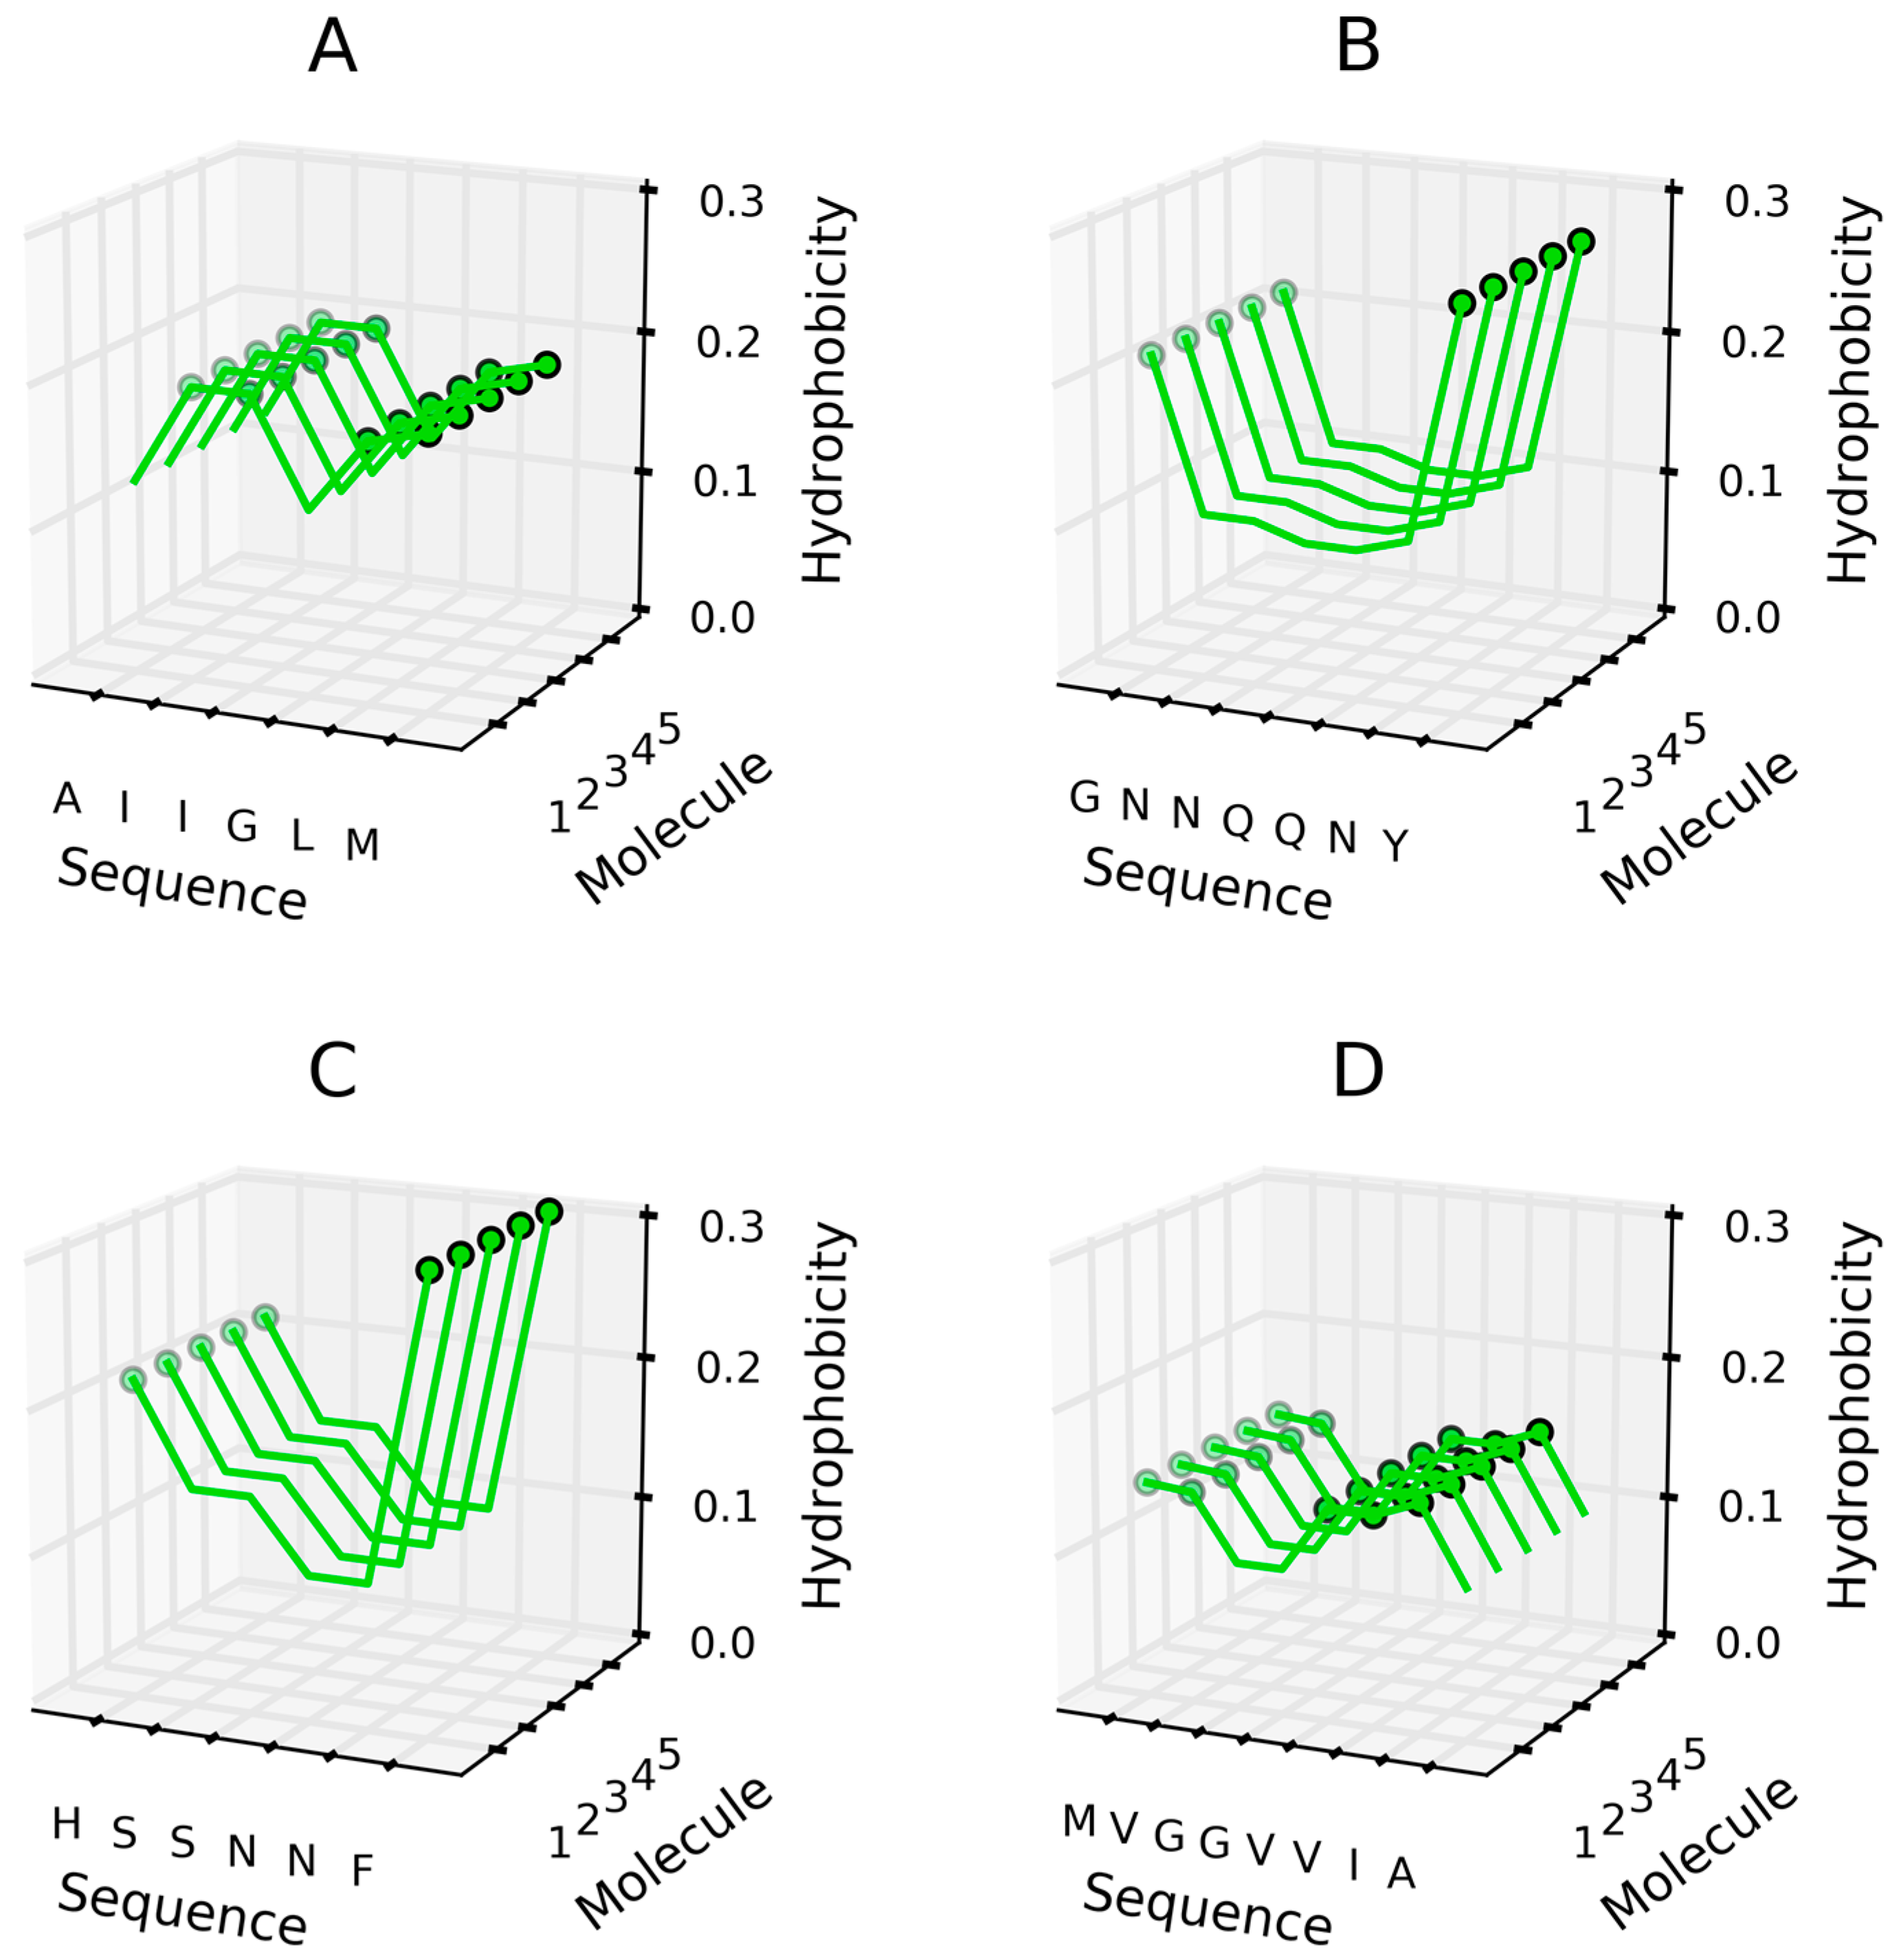
Figure 9.
Parallel β structures—hydrophobicity (H) with high hydrophobicity distinguished by circles for peptides. (A) AIIGLN sequence; (B) GNNQQNY sequence; (C) HSSNNF sequence; (D) MVGGVVIA sequence.
Figure 9.
Parallel β structures—hydrophobicity (H) with high hydrophobicity distinguished by circles for peptides. (A) AIIGLN sequence; (B) GNNQQNY sequence; (C) HSSNNF sequence; (D) MVGGVVIA sequence.

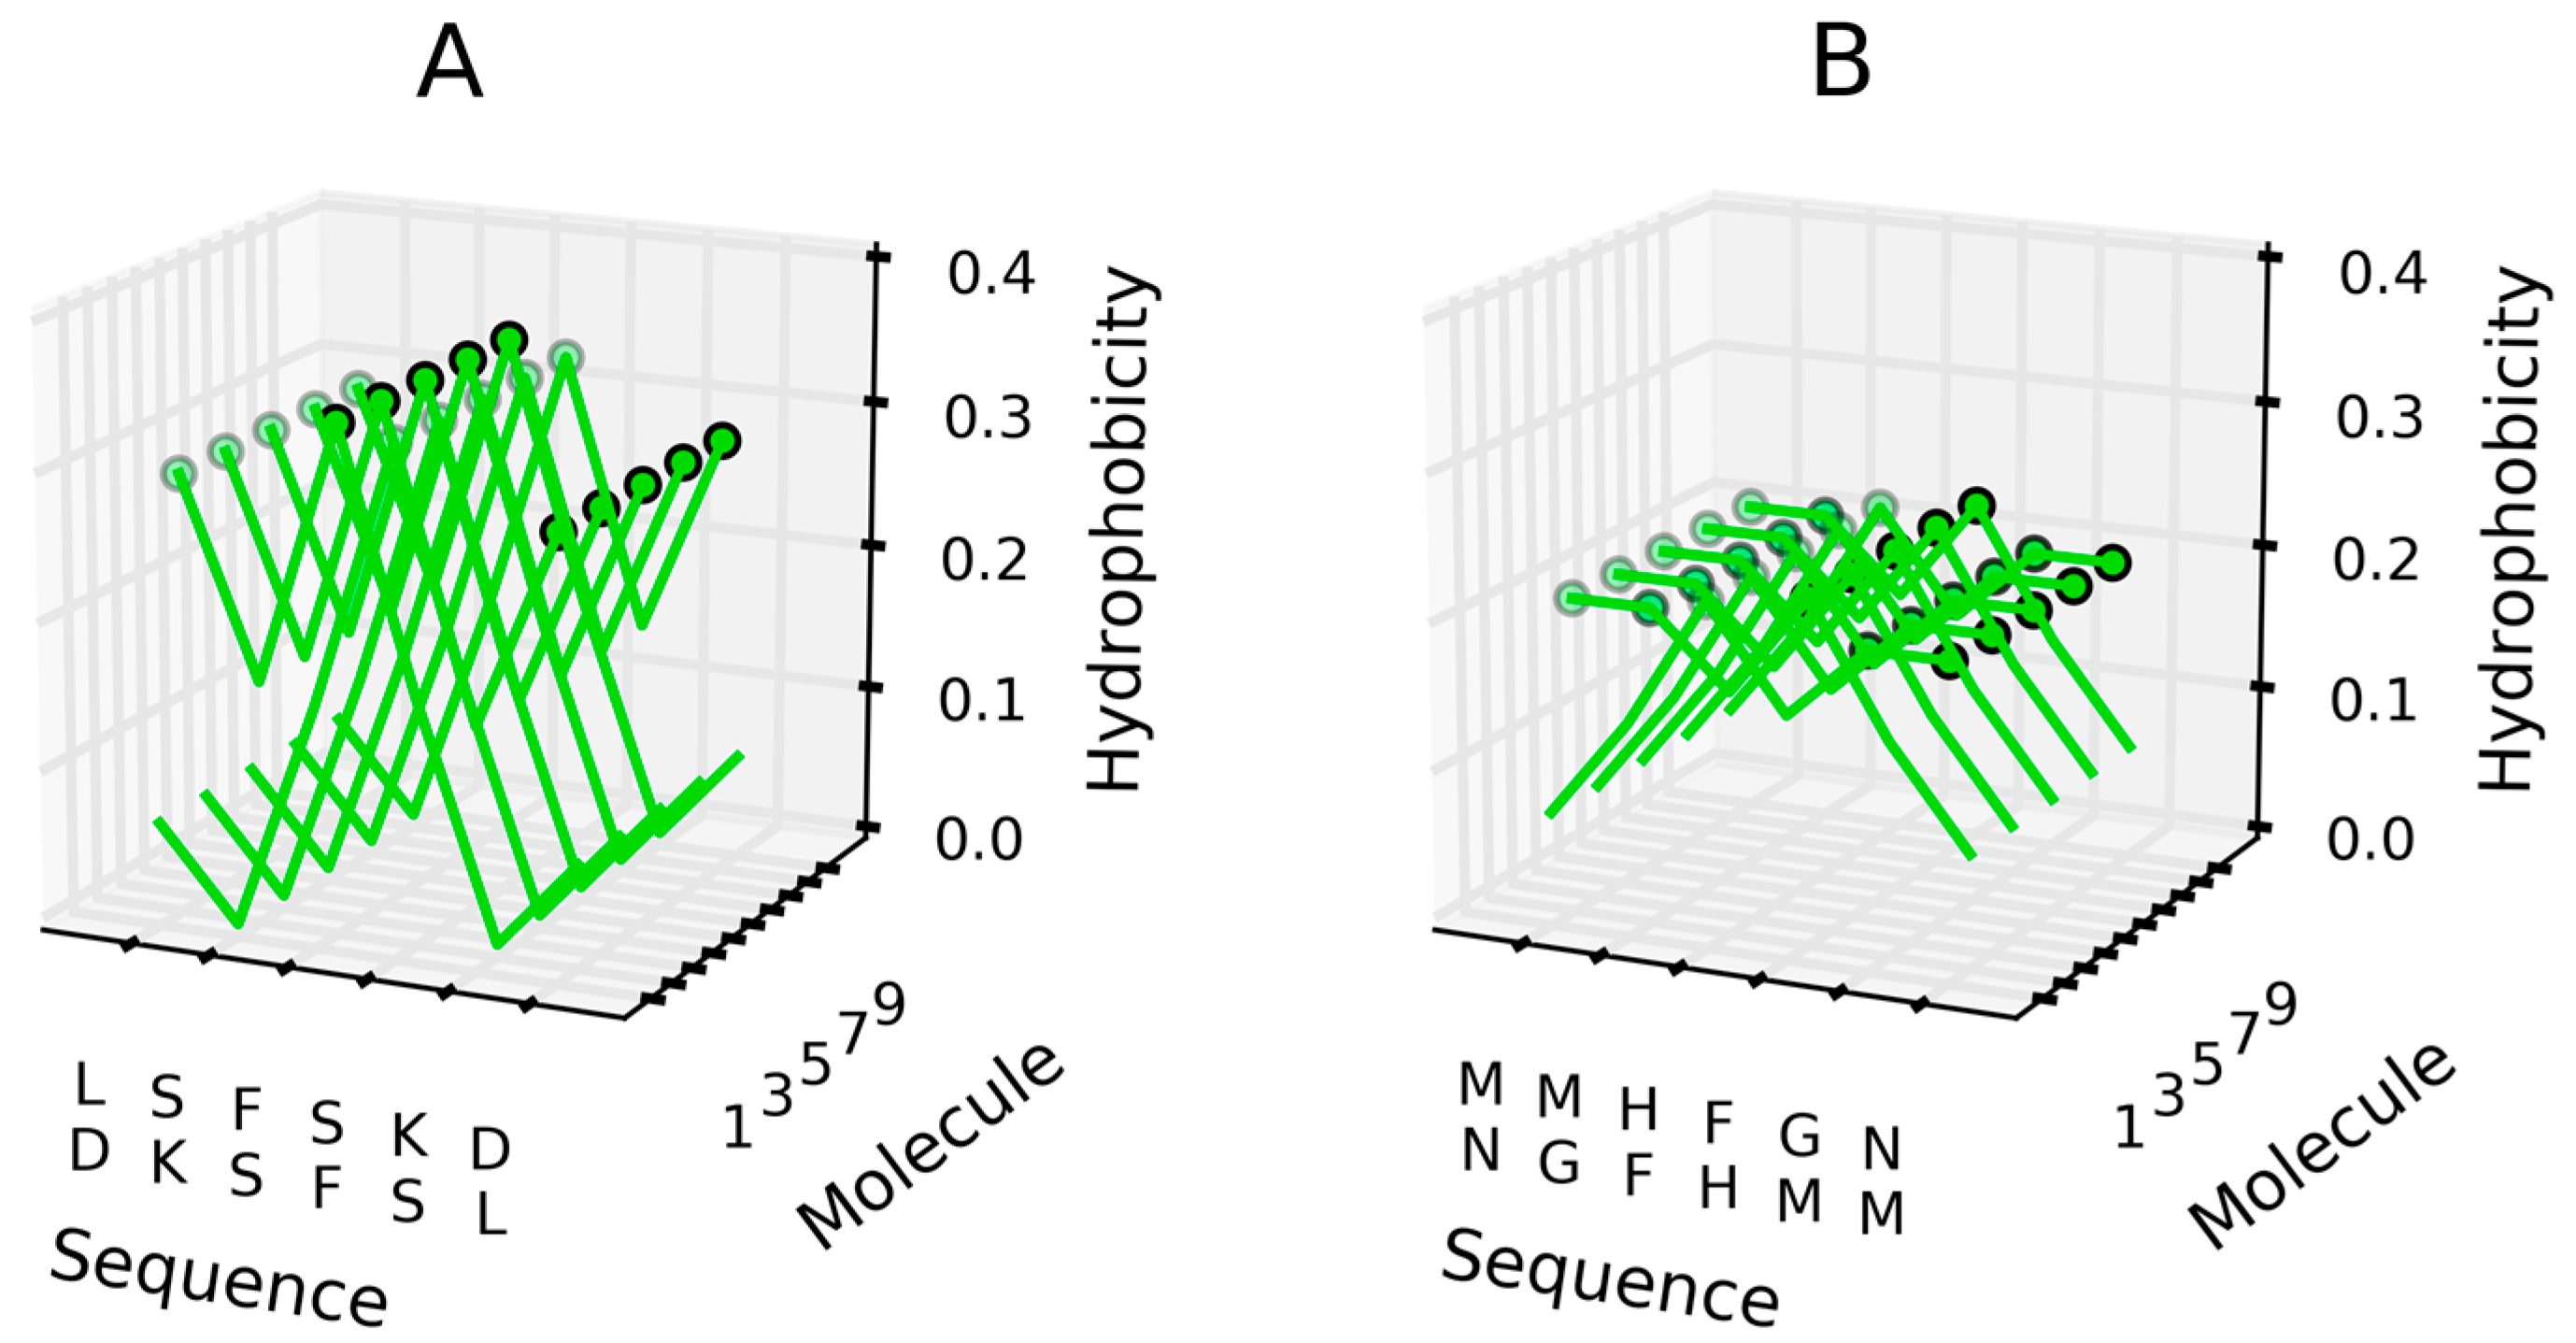
Figure 10.
Antiparallel β structures—hydrophobicity (H) with high values distinguished by circles to visualize the linear propagation as appears in: (A) LSFSKD sequence; (B) MMHFGN sequence.
Figure 10.
Antiparallel β structures—hydrophobicity (H) with high values distinguished by circles to visualize the linear propagation as appears in: (A) LSFSKD sequence; (B) MMHFGN sequence.

Figure 11.
Theoretical (blue) and observed (red) distribution of hydrophobicity in the entire complex (2MXU).
Figure 11.
Theoretical (blue) and observed (red) distribution of hydrophobicity in the entire complex (2MXU).

Figure 12.
T (blue), O (red), and H (green) distribution in the 36–41 fragment (β-sheet). (A) comparison of theoretical (T) and intrinsic (H) distributions; (B) comparison of observed (red) and intrinsic (green) hydrophobicity to visualize the observed hydrophobicity following the intrinsic hydrophobicity and not following the theoretical one.
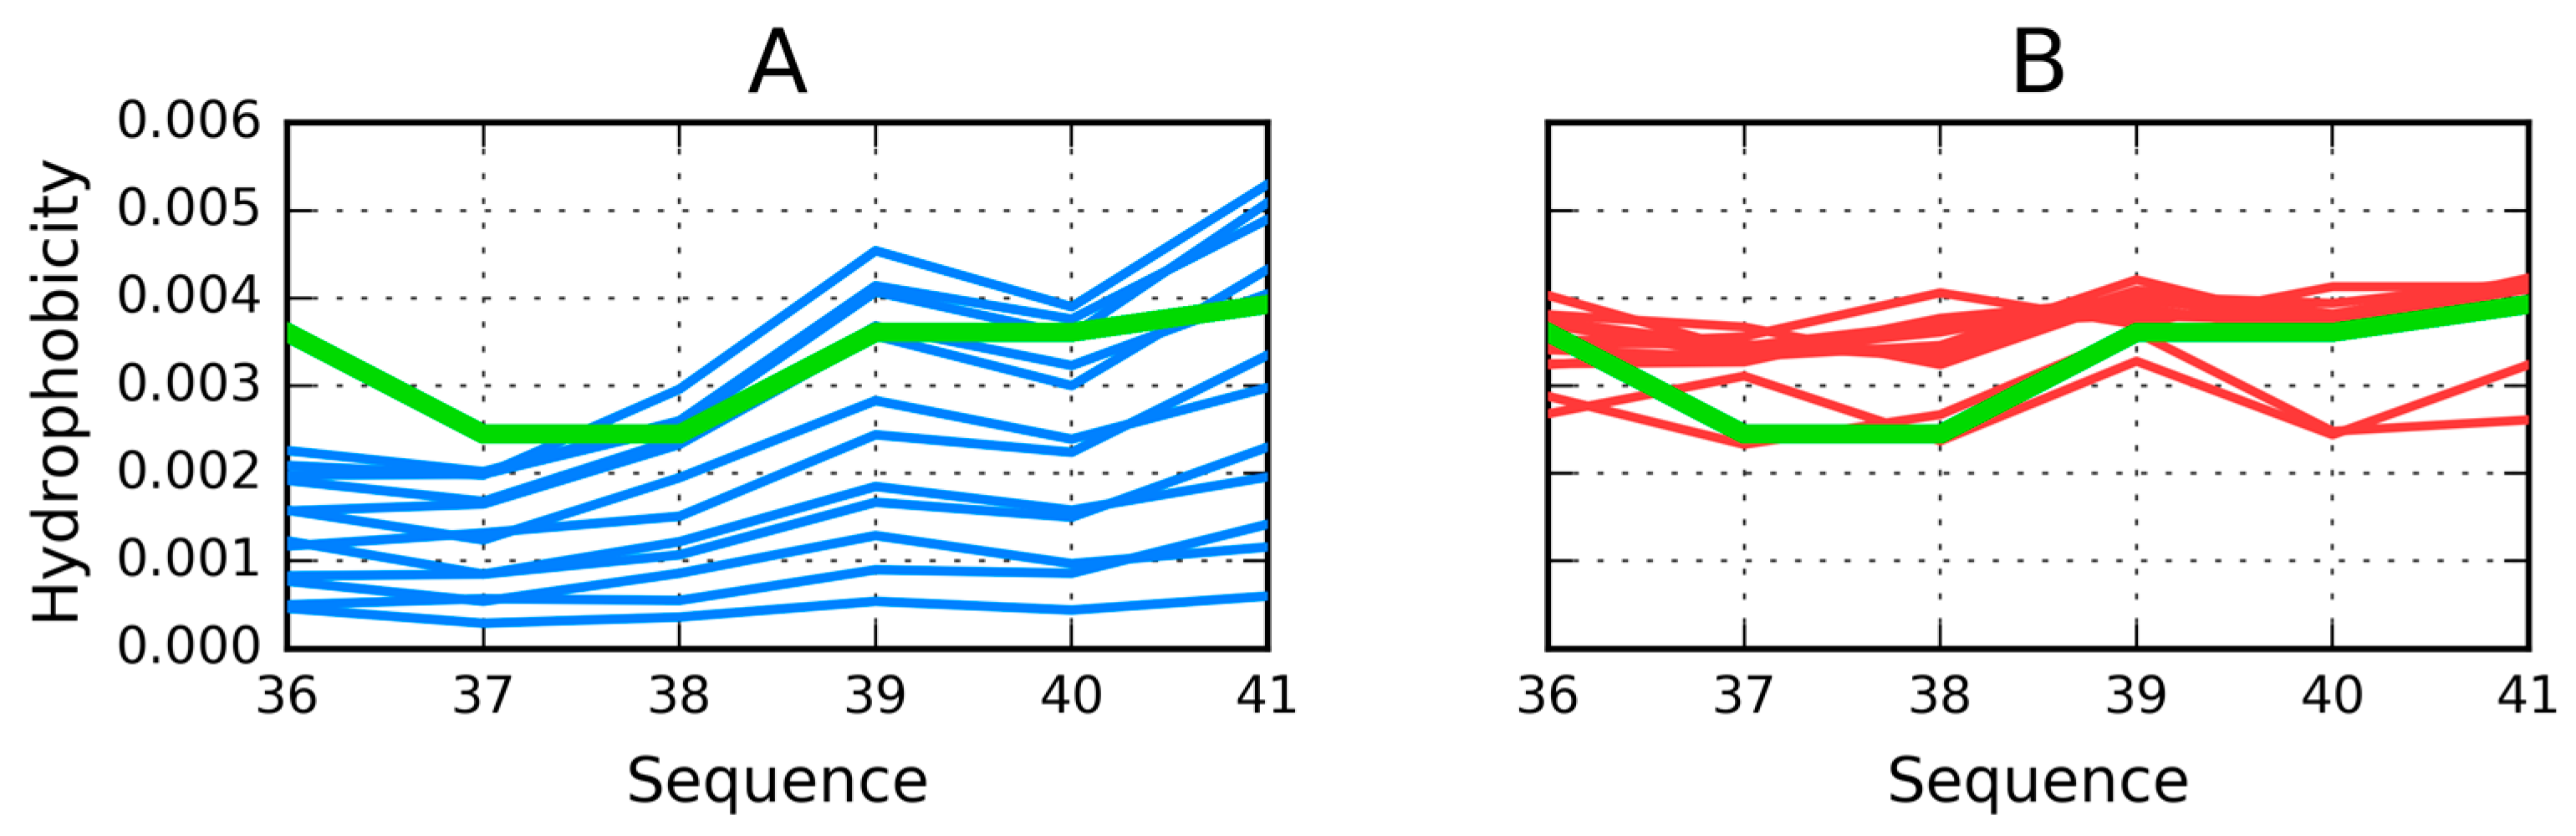
Figure 13.
Deviations from the theoretical distribution (blue) by the observed distribution (red) which follows the intrinsic distribution (green). Propagation of the shown distribution produces the two linear local maxima along the fibril. (A) 24–32 fragment; (B) 12–18 fragment.
Figure 13.
Deviations from the theoretical distribution (blue) by the observed distribution (red) which follows the intrinsic distribution (green). Propagation of the shown distribution produces the two linear local maxima along the fibril. (A) 24–32 fragment; (B) 12–18 fragment.
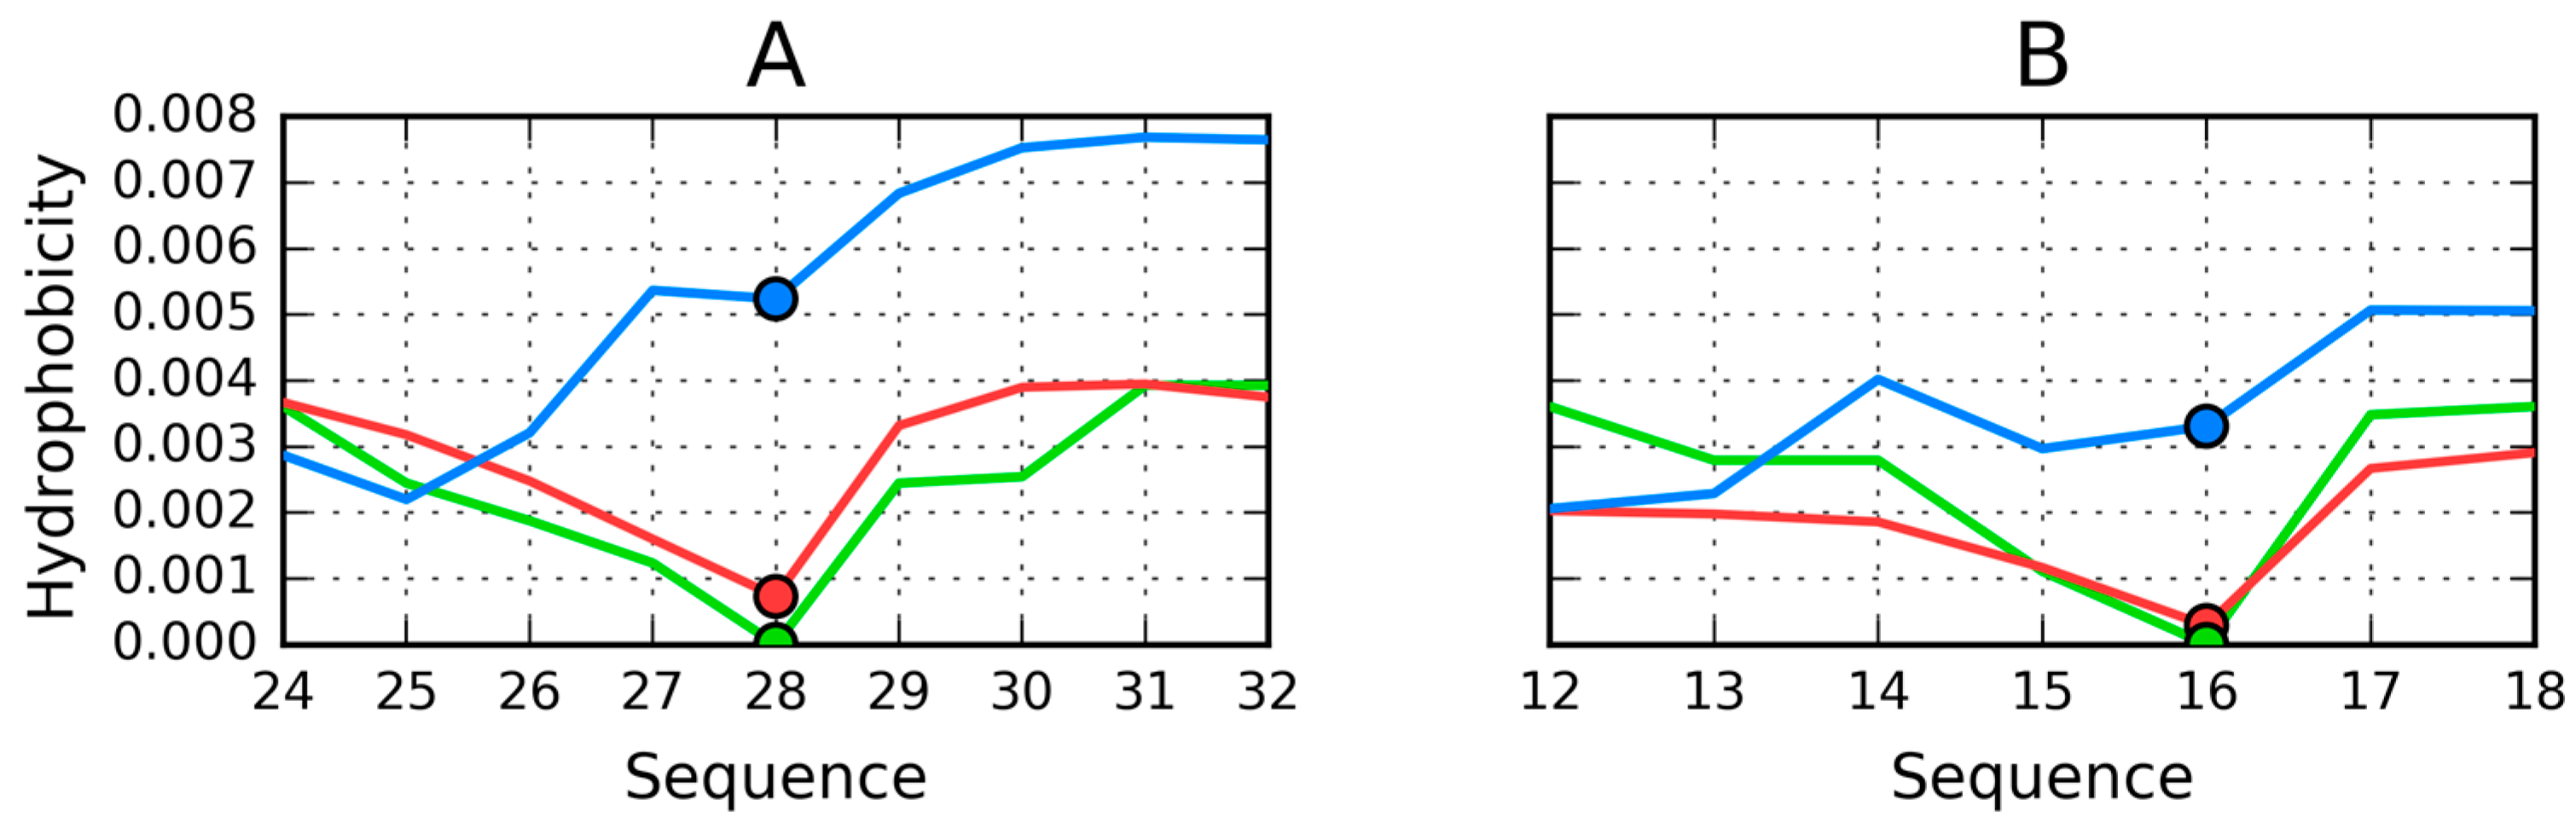
Figure 14.
Hydrophobic (A) and hydrophilic (B) residues in 1DBG. vdW (van der Waals) presentation has been applied in both images to highlight selected residues participating in specific β sheets—coding system shown in (C). Note the linear arrangement of hydrophobic and hydrophilic bands. The hydrophobicity difference shown in (C) expresses the subtraction of T from O (O−T). Triangle markers denote the maxima and minima in a particular β-sheet. Colors as applied in A and B, respectively.

Figure 15.
“Stop” signals (distinguished in red) which accompany the solenoids. (A) lyase (1DBG): N-terminal helix preventing further propagation of the fibrillar structure and a loose loop which disrupts linear ordering; green—residues believed to mediate biological activity; (B) cell adhesion protein (1DAB): short β strand and C-terminal loop preventing propagation of fibrillar forms in either direction; dark blue—fragment believed to mediate interaction with epithelial cells [27] (GGXXP)5.

Figure 16.
Polypeptide chain folding process, starting with a disordered structure (A); Thick lines represent the hydrophobic fragments of the chain. Path 1 leads to a centralized hydrophobic core surrounded by a hydrophilic shell, which is consistent with the fuzzy oil drop model (B); producing individual soluble molecules. This structure is generated through interactions between the protein chain and its water environment (inward-pointing arrows). Each molecule folds on its own, achieving a fuzzy-oil-drop-compliant state (C–E); In contrast, path 2 is not affected by the external environment (or, alternatively, takes place in an environment which has been structurally altered), leading to conformations dominated by the intrinsic hydrophobicity of each participating residue. The result is an ordered sequence of hydrophobic (grey bars) and hydrophilic (white bars) zones. This conformation favors linear propagation (F); which can be either parallel (F,G) or oblique (H,I).

Table 1.
List of proteins discussed in this publication.
| Peptide Protein | Characteristics | Sequence | Characteristics | Reference |
|---|---|---|---|---|
| Ribbonlike Micelle | ||||
| 1YJP | prion | GNNQQNY | parallel | [27] |
| 2Y3J | amyloid beta | AIIGLM | parallel | [28] |
| 3FPO | Islet Amyloid polypeptide | HSSNNF | parallel | [29] |
| 3LOZ | macroglobulin | LSFSKD | antiparallel | [30] |
| 3NVE | prion | MMHFGN | antiparallel | [31] |
| 2Y3K | amyloid beta | MVGGVVIA | antiparallel | [32] |
| 3NHC | prion | GYMLGS | antiparallel | [29] |
| Cylindrical Micelle Composed of Ribbonlike Micelles | ||||
| 2MXU | human amyloid β (Aβ(1-42)) | 42 aa | parallel | [26] |
| Cylindrical Micelle | ||||
| 1DBG | Solenoid | parallel | [33] | |
| 1DAB | Solenoid | parallel | [27] | |
Table 2.
Relative distance (RD) parameters calculated as the relative distance between reference distributions (T vs. R and T vs. H) for the complete structure deposited in PDB with ID 2MXU. The three rightmost columns list the correlation coefficients. Values indicating significant deviation from the idealized distribution (expected for a protein which undergoes folding in water) have been given in bold. The underscored values show good agreement between all three sets of parameters, although RD reveals significant discordance versus the theoretical distribution. Position β-sheet fragment—β-sheet treated as part of the complex; β-sheet—each β-sheet treated as an individual unit independent of the rest of the chains.
| RD | Correlation Coefficient | ||||
|---|---|---|---|---|---|
| 2MXU | RD(R) | RD(H) | ρ(H–T) | ρ(T–O) | ρ(H–O) |
| Complete | 0.680 | 0.756 | 0.246 | 0.364 | 0.821 |
| Chain | |||||
| A | 0.467 | 0.556 | 0.385 | 0.502 | 0.813 |
| B | 0.500 | 0.600 | 0.424 | 0.466 | 0.864 |
| C | 0.499 | 0.597 | 0.410 | 0.476 | 0.876 |
| D | 0.496 | 0.580 | 0.409 | 0.487 | 0.857 |
| E | 0.501 | 0.609 | 0.410 | 0.486 | 0.858 |
| F | 0.513 | 0.620 | 0.404 | 0.471 | 0.849 |
| G | 0.530 | 0.640 | 0.397 | 0.429 | 0.854 |
| H | 0.544 | 0.676 | 0.387 | 0.394 | 0.852 |
| I | 0.567 | 0.672 | 0.380 | 0.349 | 0.842 |
| J | 0.595 | 0.711 | 0.365 | 0.294 | 0.865 |
| K | 0.613 | 0.700 | 0.346 | 0.236 | 0.837 |
| L | 0.646 | 0.653 | 0.287 | 0.209 | 0.787 |
| β-sheet fragment | |||||
| 12–18 | 0.505 | 0.594 | 0.284 | 0.421 | 0.956 |
| 24–32 | 0.660 | 0.551 | 0.217 | 0.227 | 0.922 |
| 36–41 | 0.888 | 0.733 | 0.709 | 0.776 | 0.593 |
| β-sheet | |||||
| 12–18 | 0.655 | 0.726 | 0.136 | 0.329 | 0.920 |
| 24–32 | 0.770 | 0.684 | 0.169 | 0.265 | 0.896 |
| 36–41 | 0.947 | 0.902 | 0.997 | 0.998 | 0.999 |
© 2017 by the authors. Licensee MDPI, Basel, Switzerland. This article is an open access article distributed under the terms and conditions of the Creative Commons Attribution (CC BY) license (http://creativecommons.org/licenses/by/4.0/).
Share and Cite
MDPI and ACS Style
Roterman, I.; Banach, M.; Konieczny, L. Application of the Fuzzy Oil Drop Model Describes Amyloid as a Ribbonlike Micelle. Entropy 2017, 19, 167. https://doi.org/10.3390/e19040167
AMA Style
Roterman I, Banach M, Konieczny L. Application of the Fuzzy Oil Drop Model Describes Amyloid as a Ribbonlike Micelle. Entropy. 2017; 19(4):167. https://doi.org/10.3390/e19040167
Chicago/Turabian StyleRoterman, Irena, Mateusz Banach, and Leszek Konieczny. 2017. "Application of the Fuzzy Oil Drop Model Describes Amyloid as a Ribbonlike Micelle" Entropy 19, no. 4: 167. https://doi.org/10.3390/e19040167
Note that from the first issue of 2016, this journal uses article numbers instead of page numbers. See further details here.