6.1. Relationship between Classification Performance and Translation Quality
Reordering classifiers are generally evaluated intrinsically by measuring their accuracy. The accuracy of the classifier is the proportion of correctly classified examples. It might be assumed that there is a strong monotonic relationship between the accuracy of the classifier in the DRM and SMT performance. To be more precise, it might be assumed that there is a strong positive correlation between the accuracy of the classifier and the BLEU score, and correspondingly that there is a strong negative correlation between the accuracy of the classifier and the TER score. In order to examine the validity of this assumption, we calculate Spearman’s rank correlation coefficient () between the classifier’s accuracy and the BLEU score and also between the classifier’s accuracy and TER. shows how well the relationship between two variables can be described by a monotonic function. If , there is a perfect positive relationship between the accuracy and the BLEU score, i.e., the BLEU score increases when the accuracy of the classifier increases, and vice versa. Similarly, if , there is a perfect negative relationship between the accuracy and the TER score, i.e., the TER score decreases when the accuracy of the classifier increases, and vice versa.
The Spearman correlation between two variables (
) is equal to the Pearson correlation coefficient (
r) between their rank values, as shown in Equation (
6). In Equation (
6),
is the covariance of the rank variables, and
and
are the standard deviations of the rank variables:
Figure 2,
Figure 3,
Figure 4,
Figure 5,
Figure 6 and
Figure 7 are scatter plots.
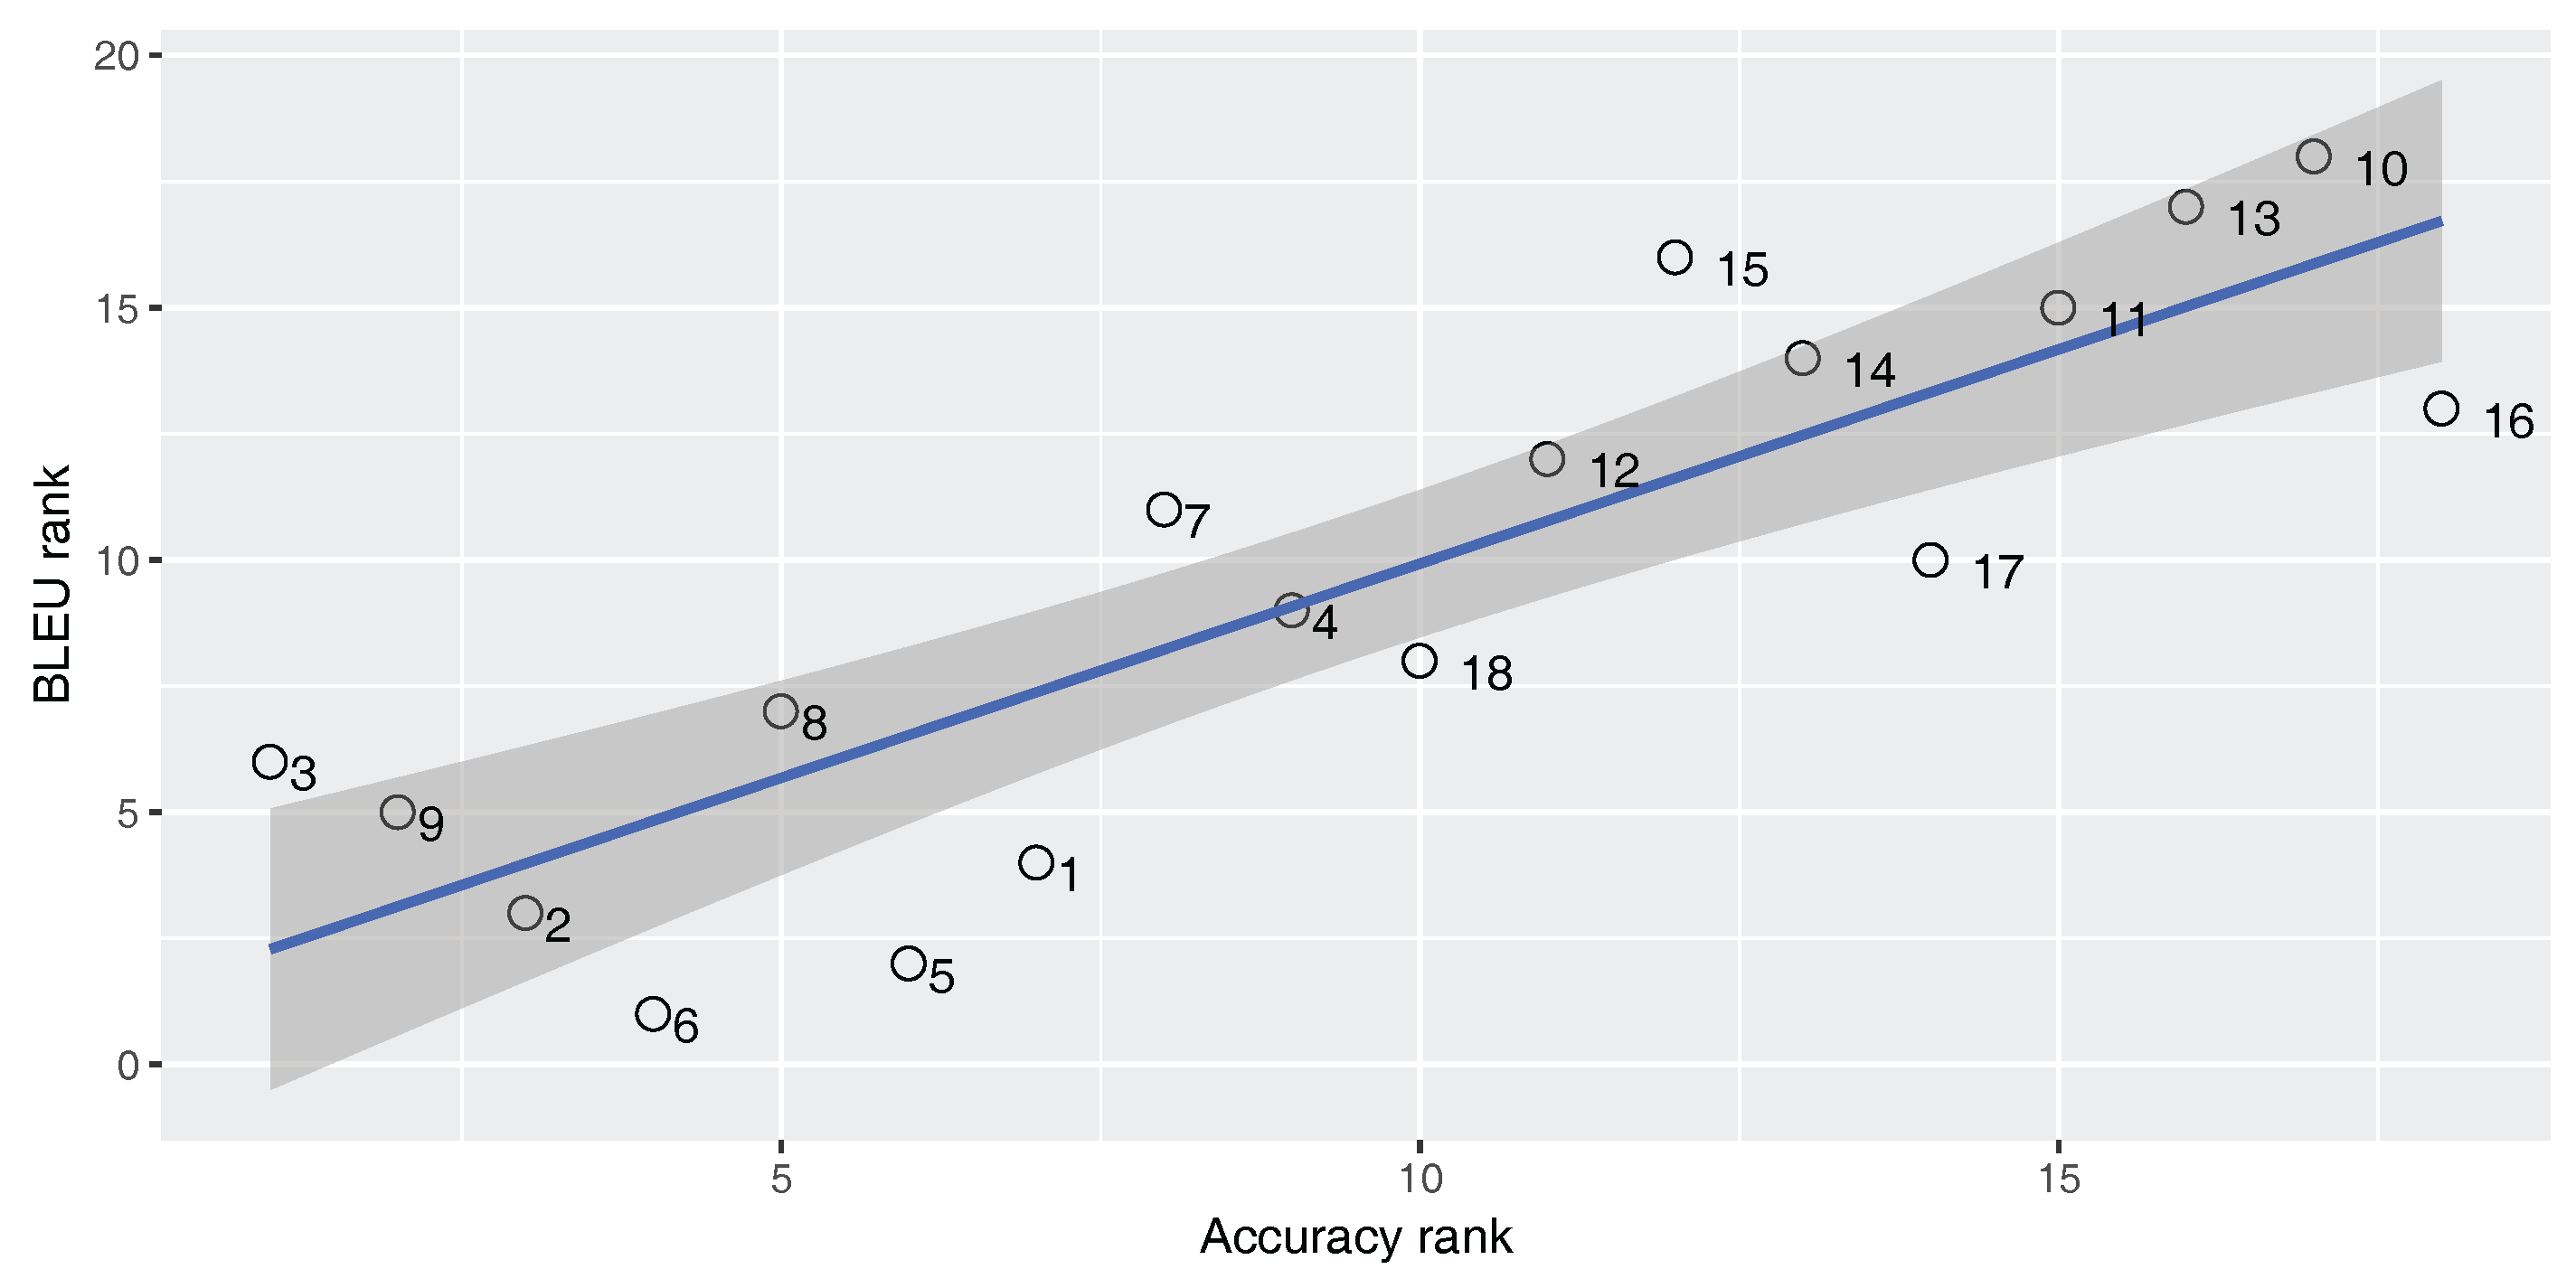
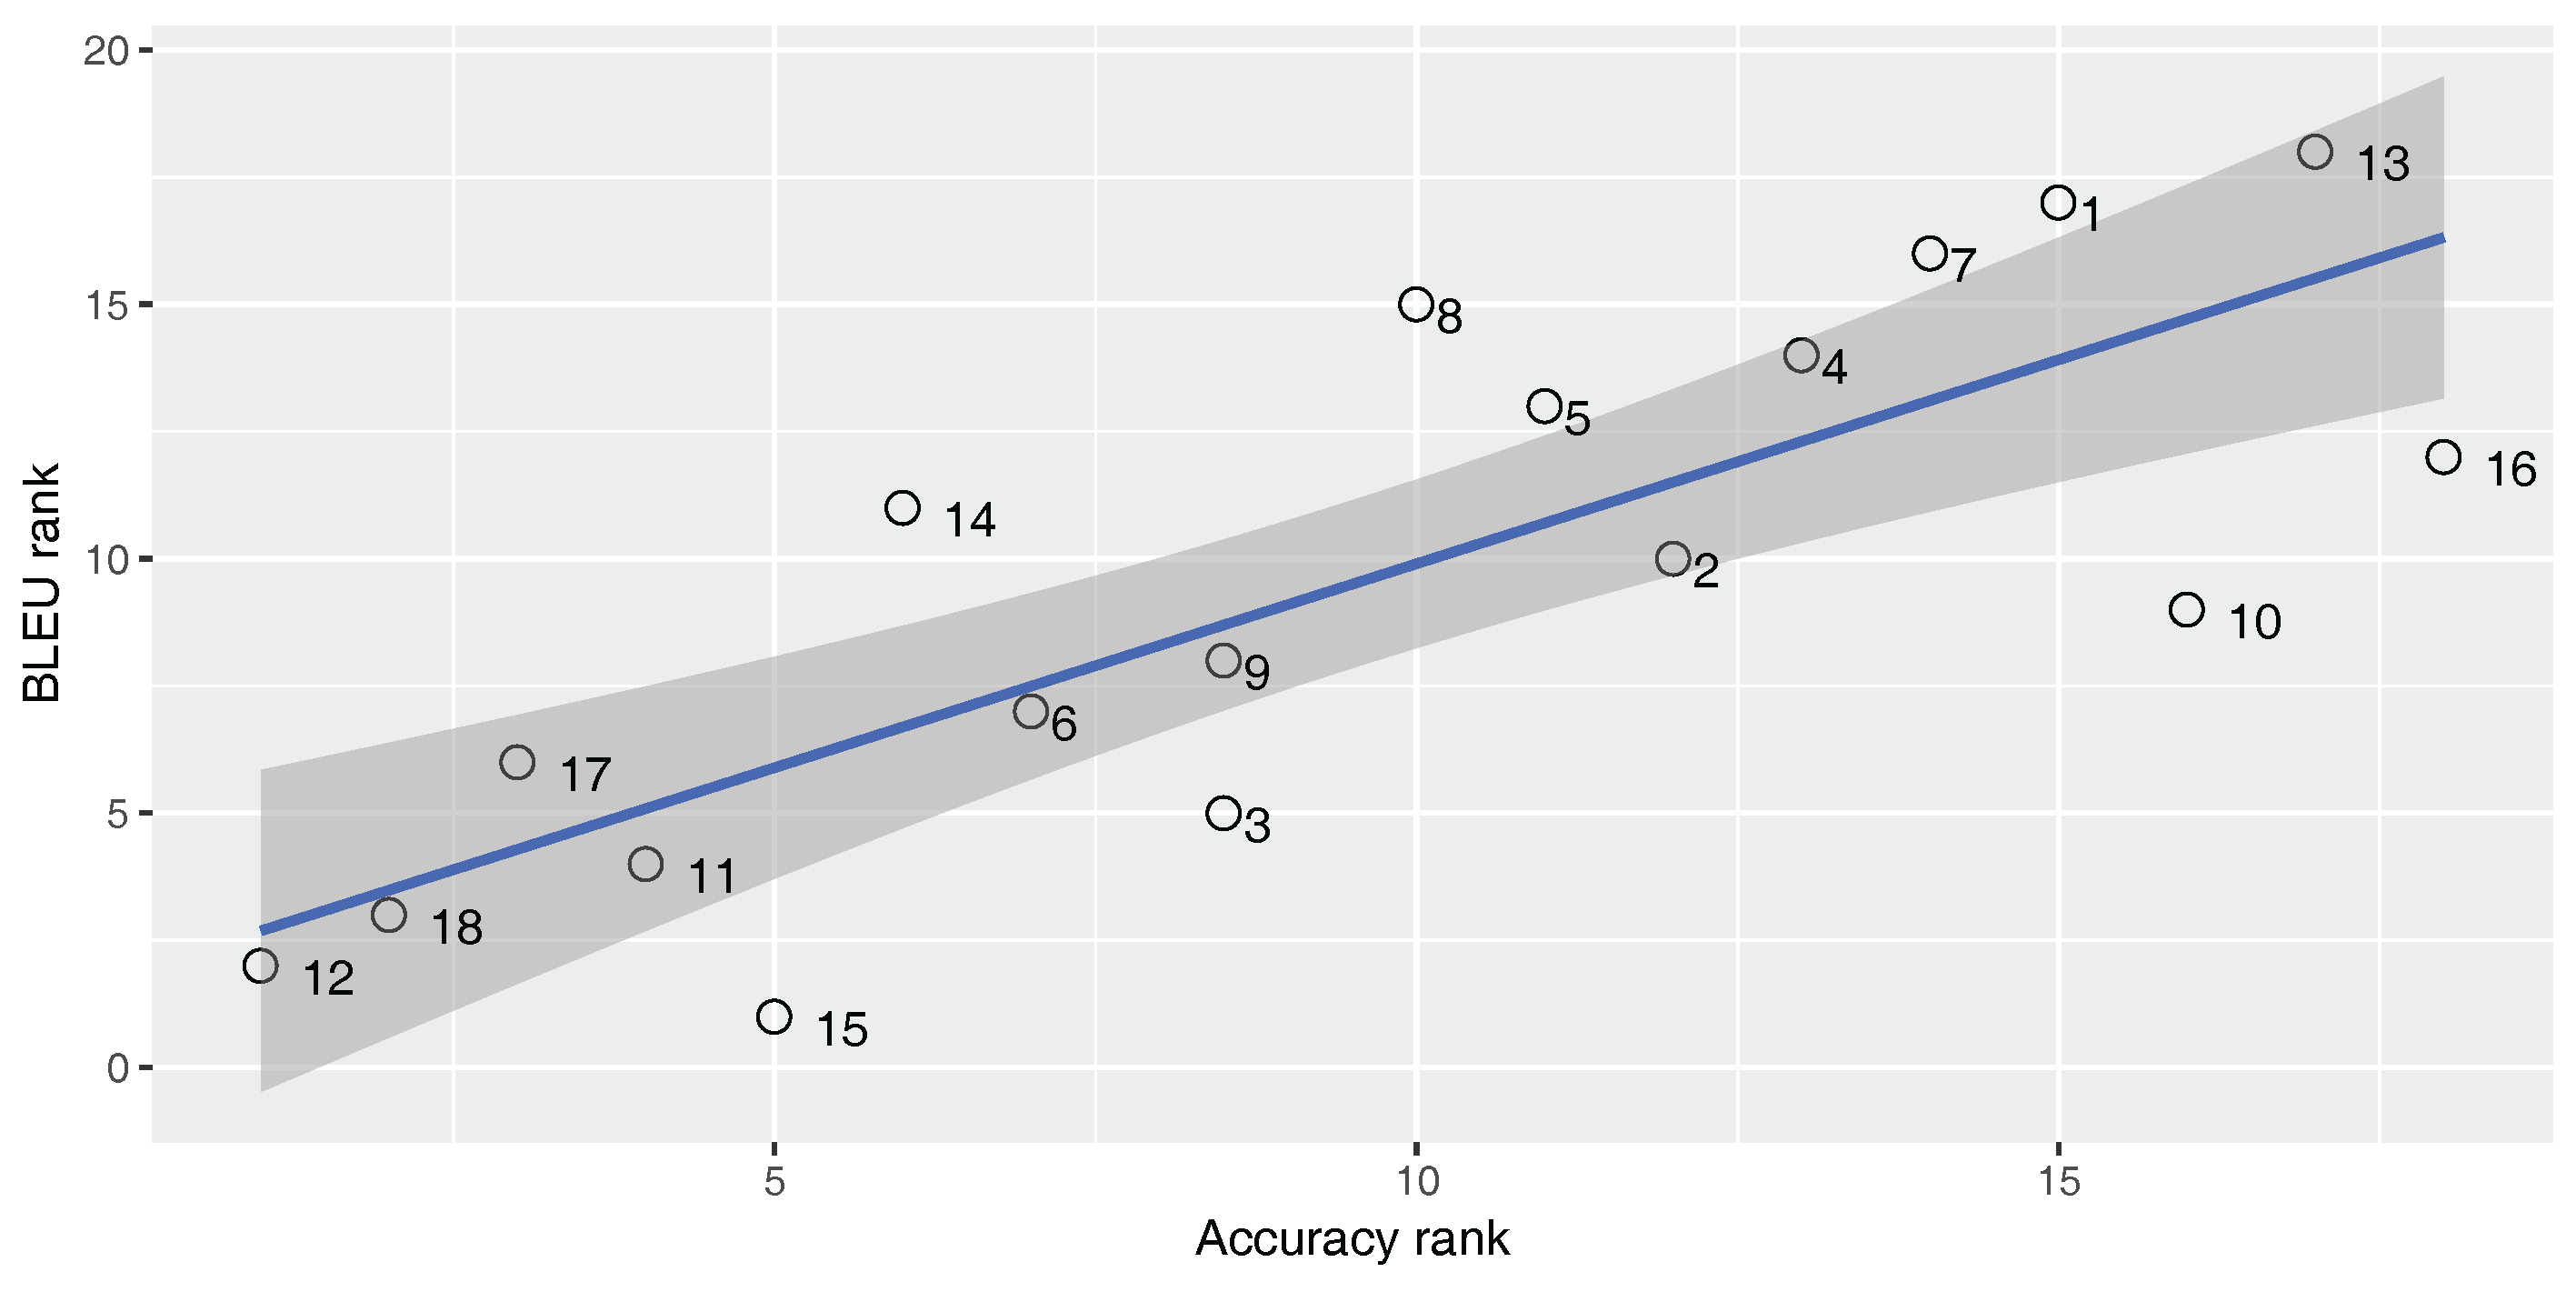
Figure 2,
Figure 3 and
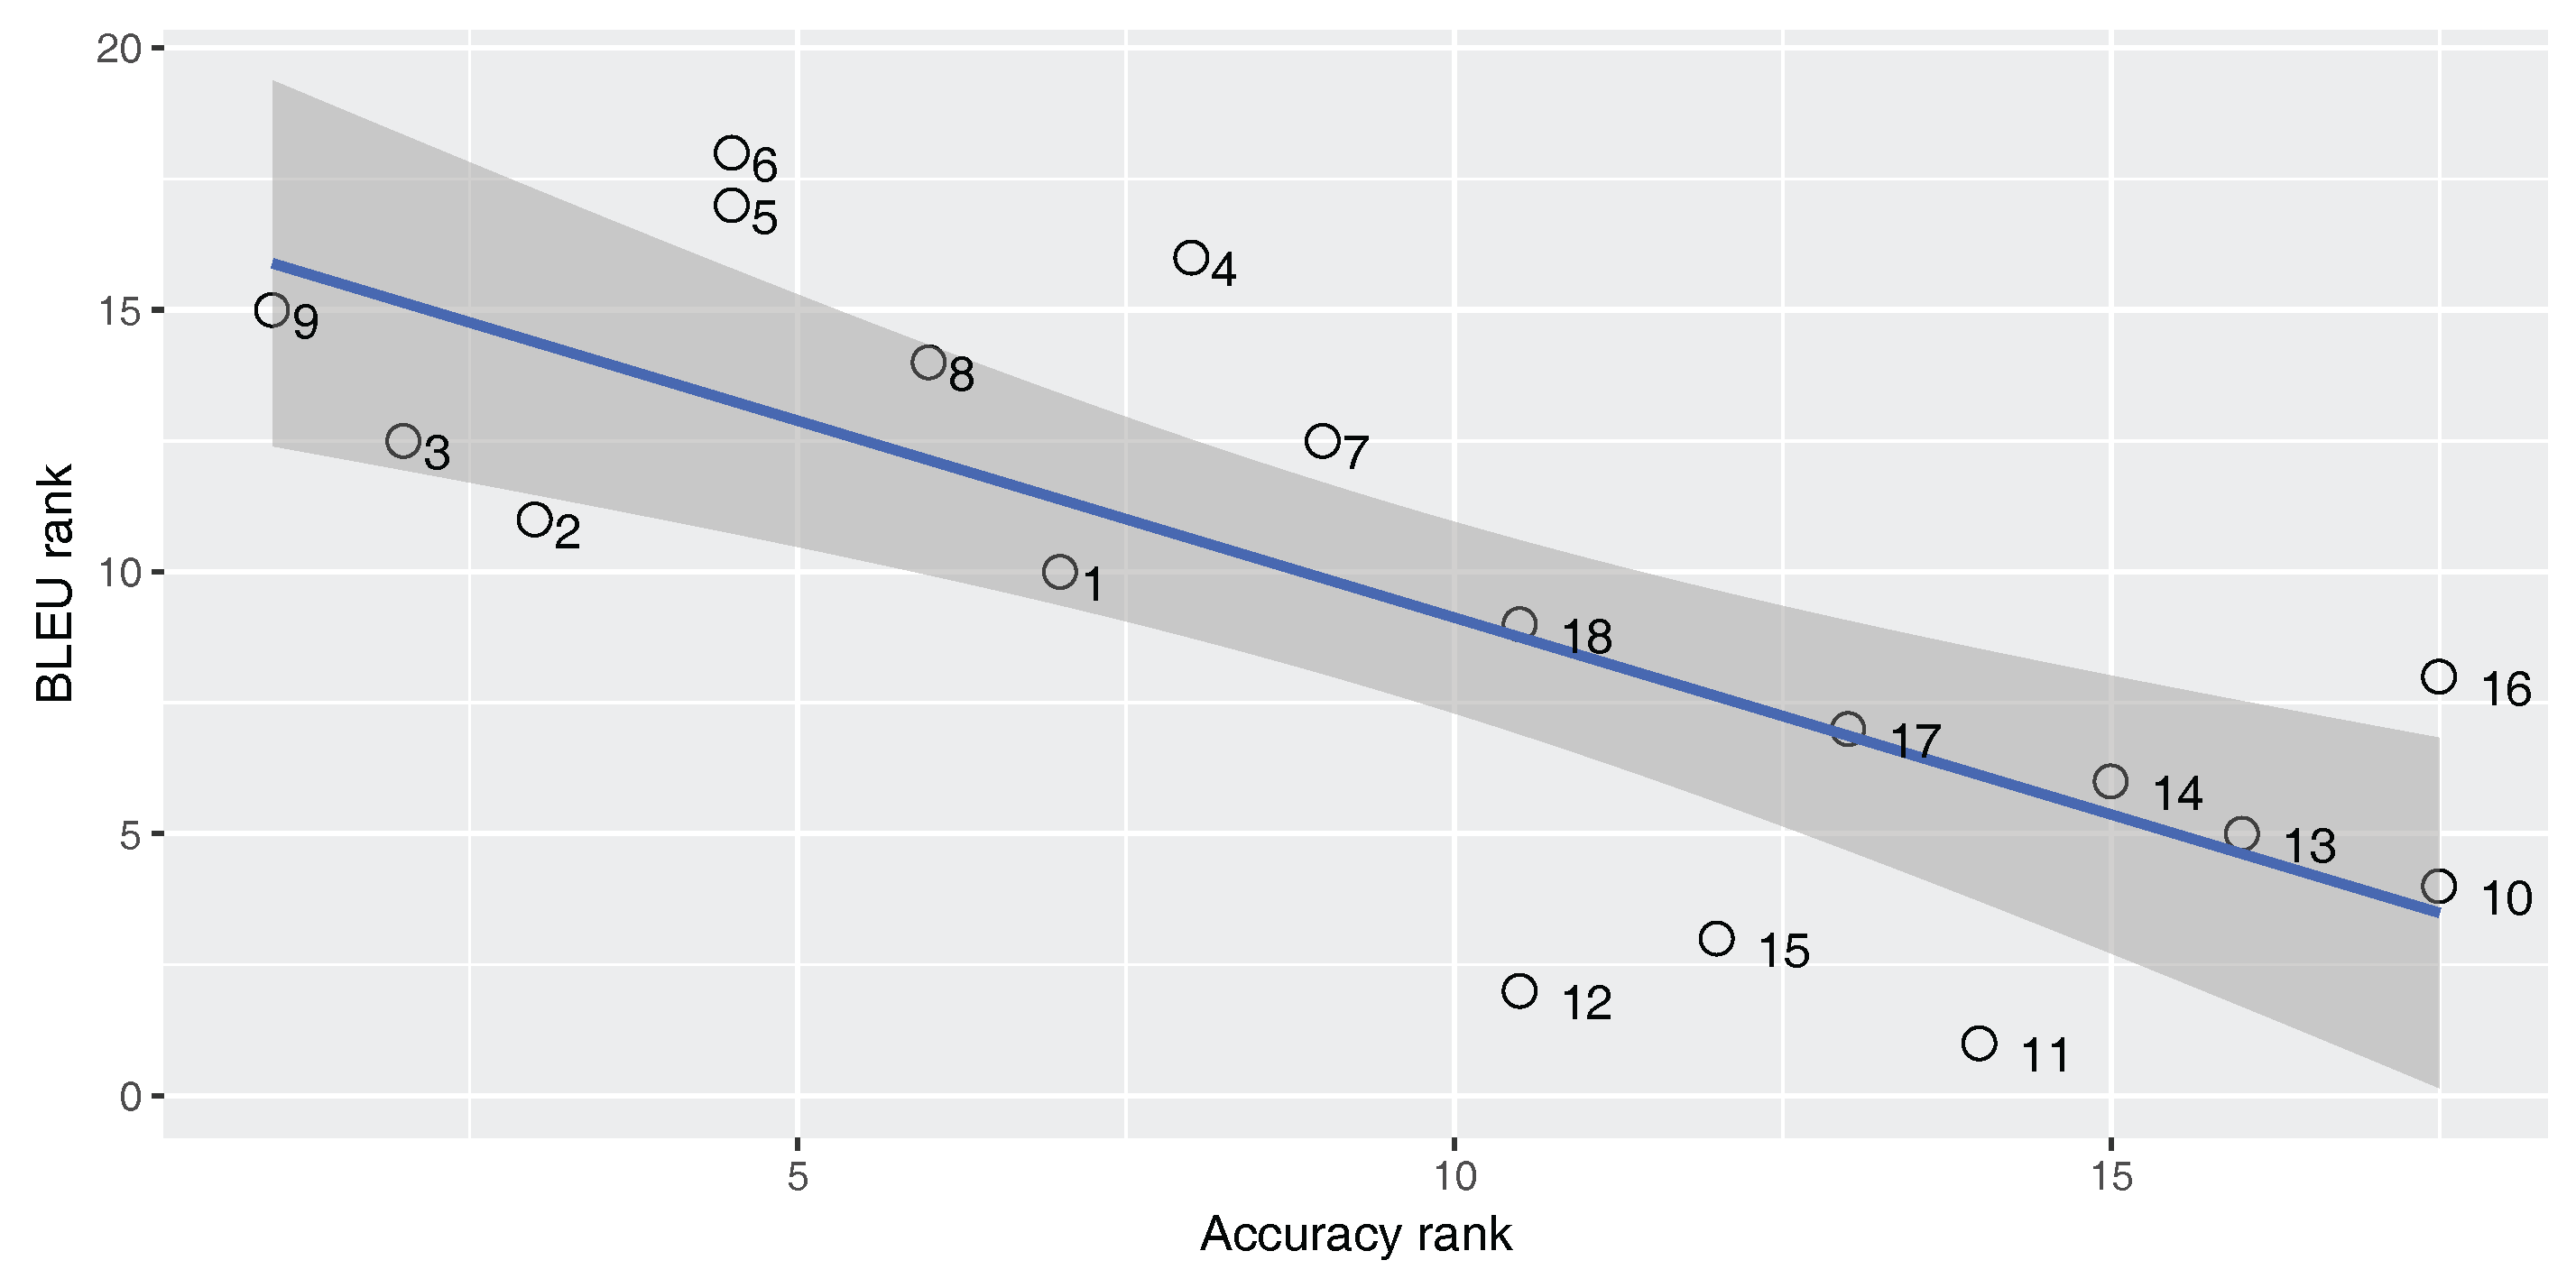
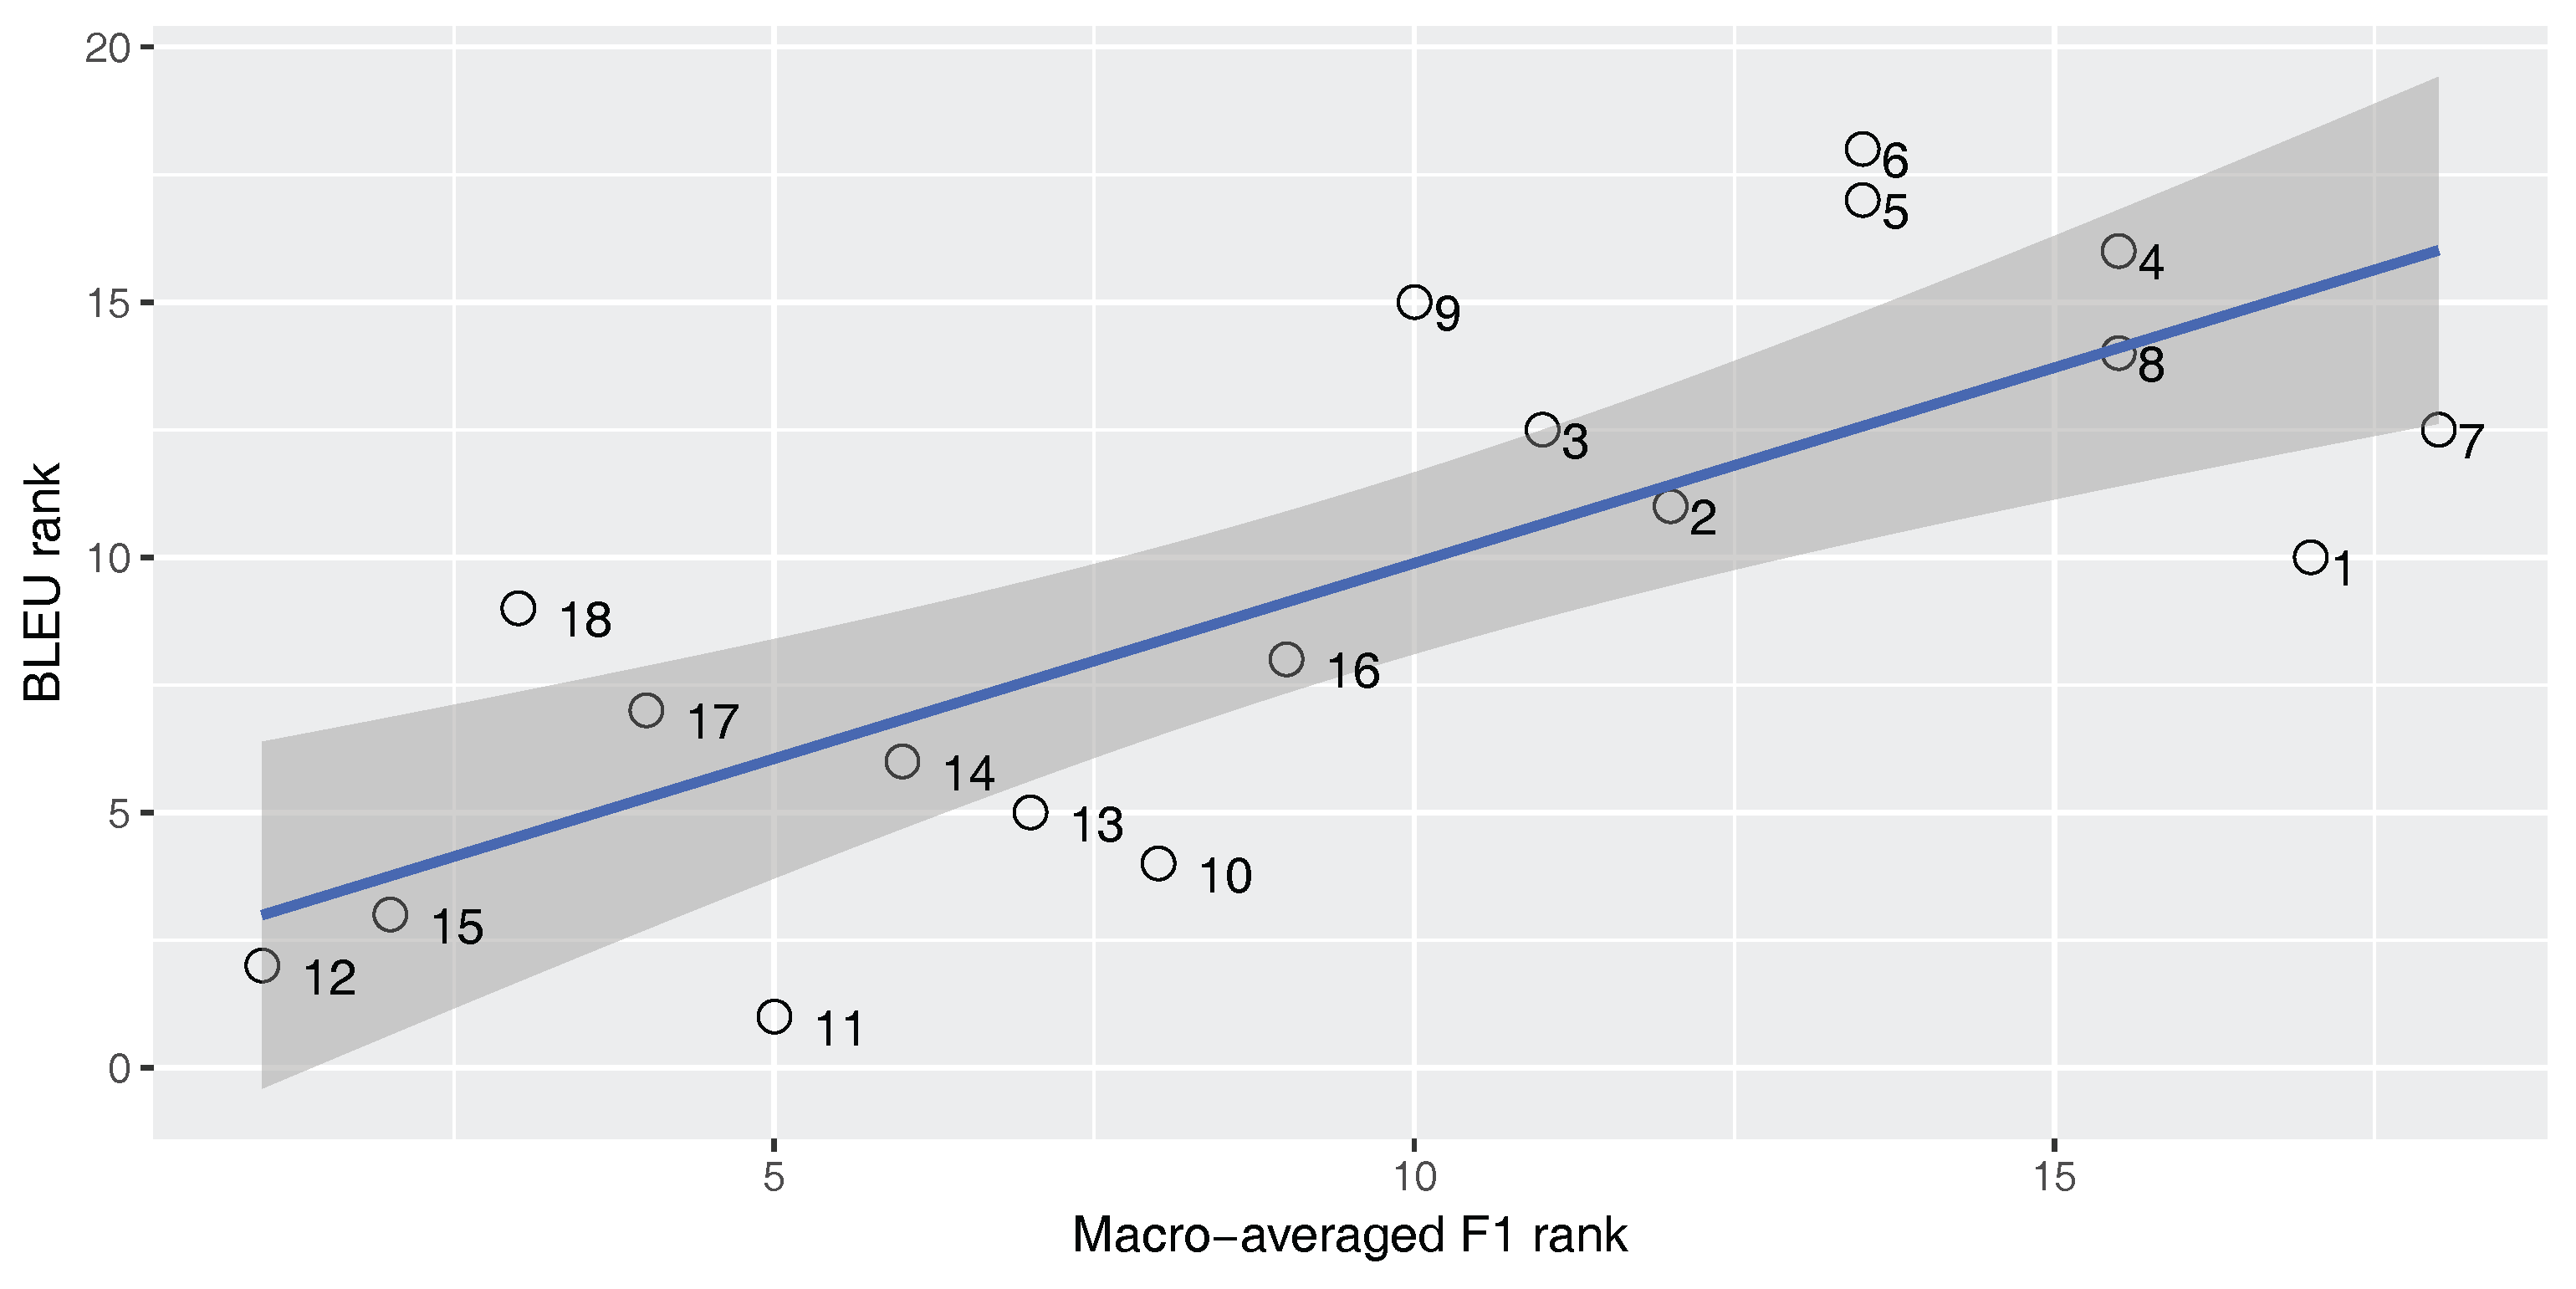
Figure 4 show Spearman’s correlation of the classifier’s accuracy and the BLEU score while
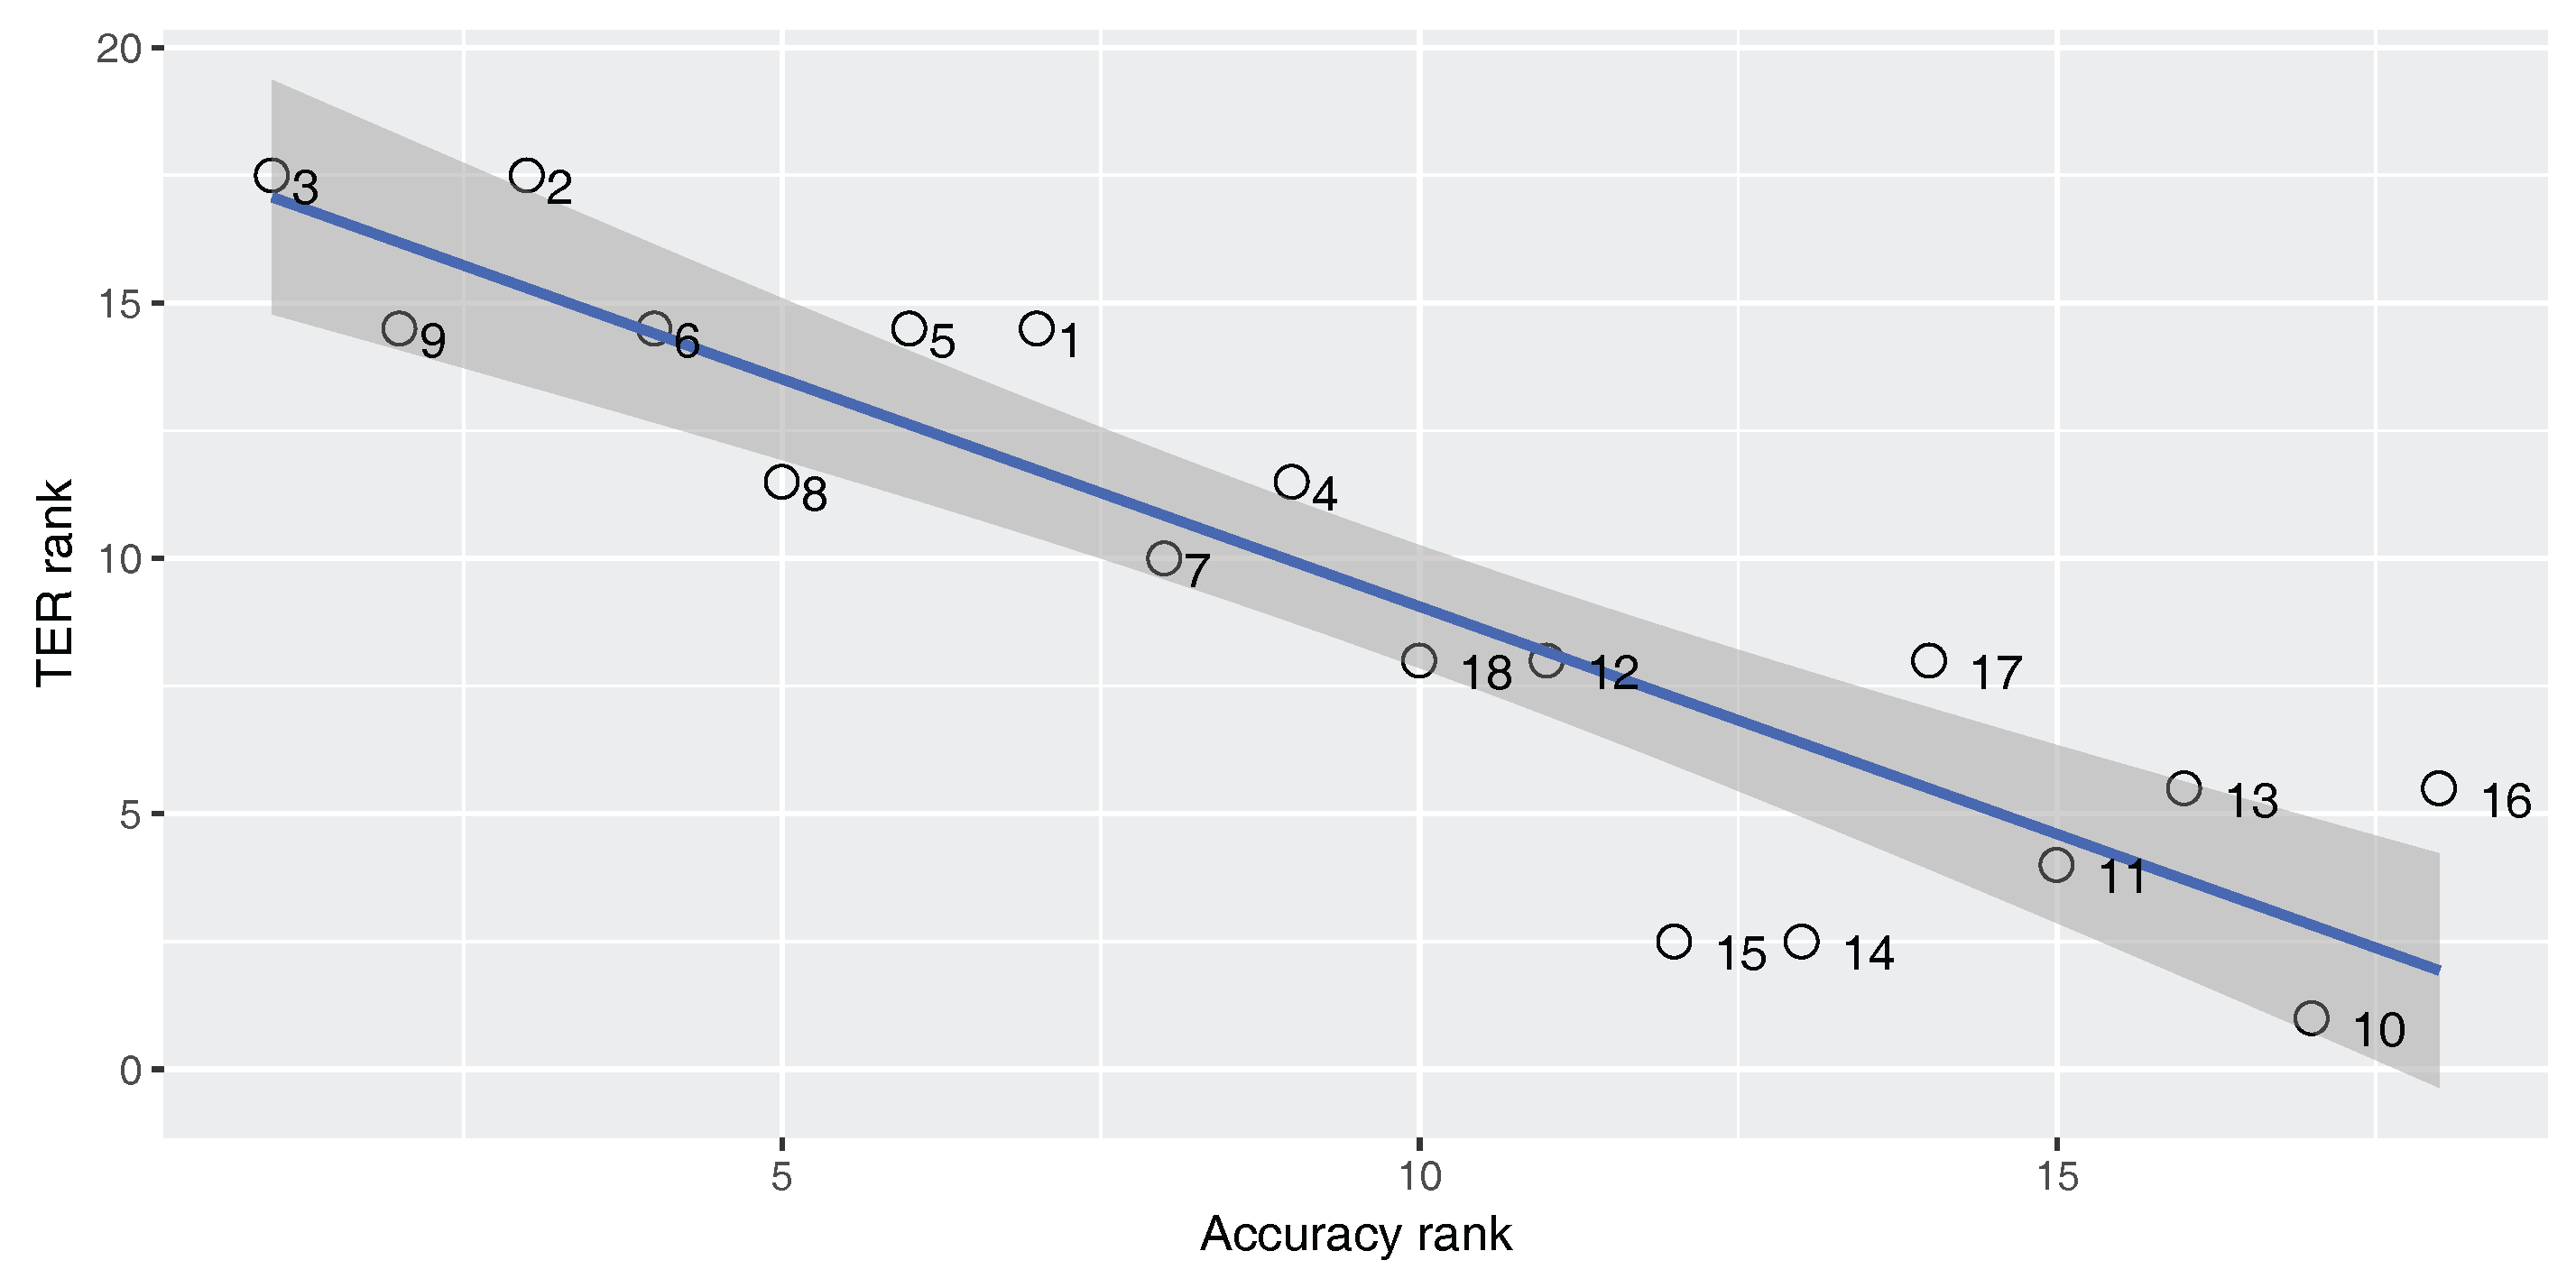
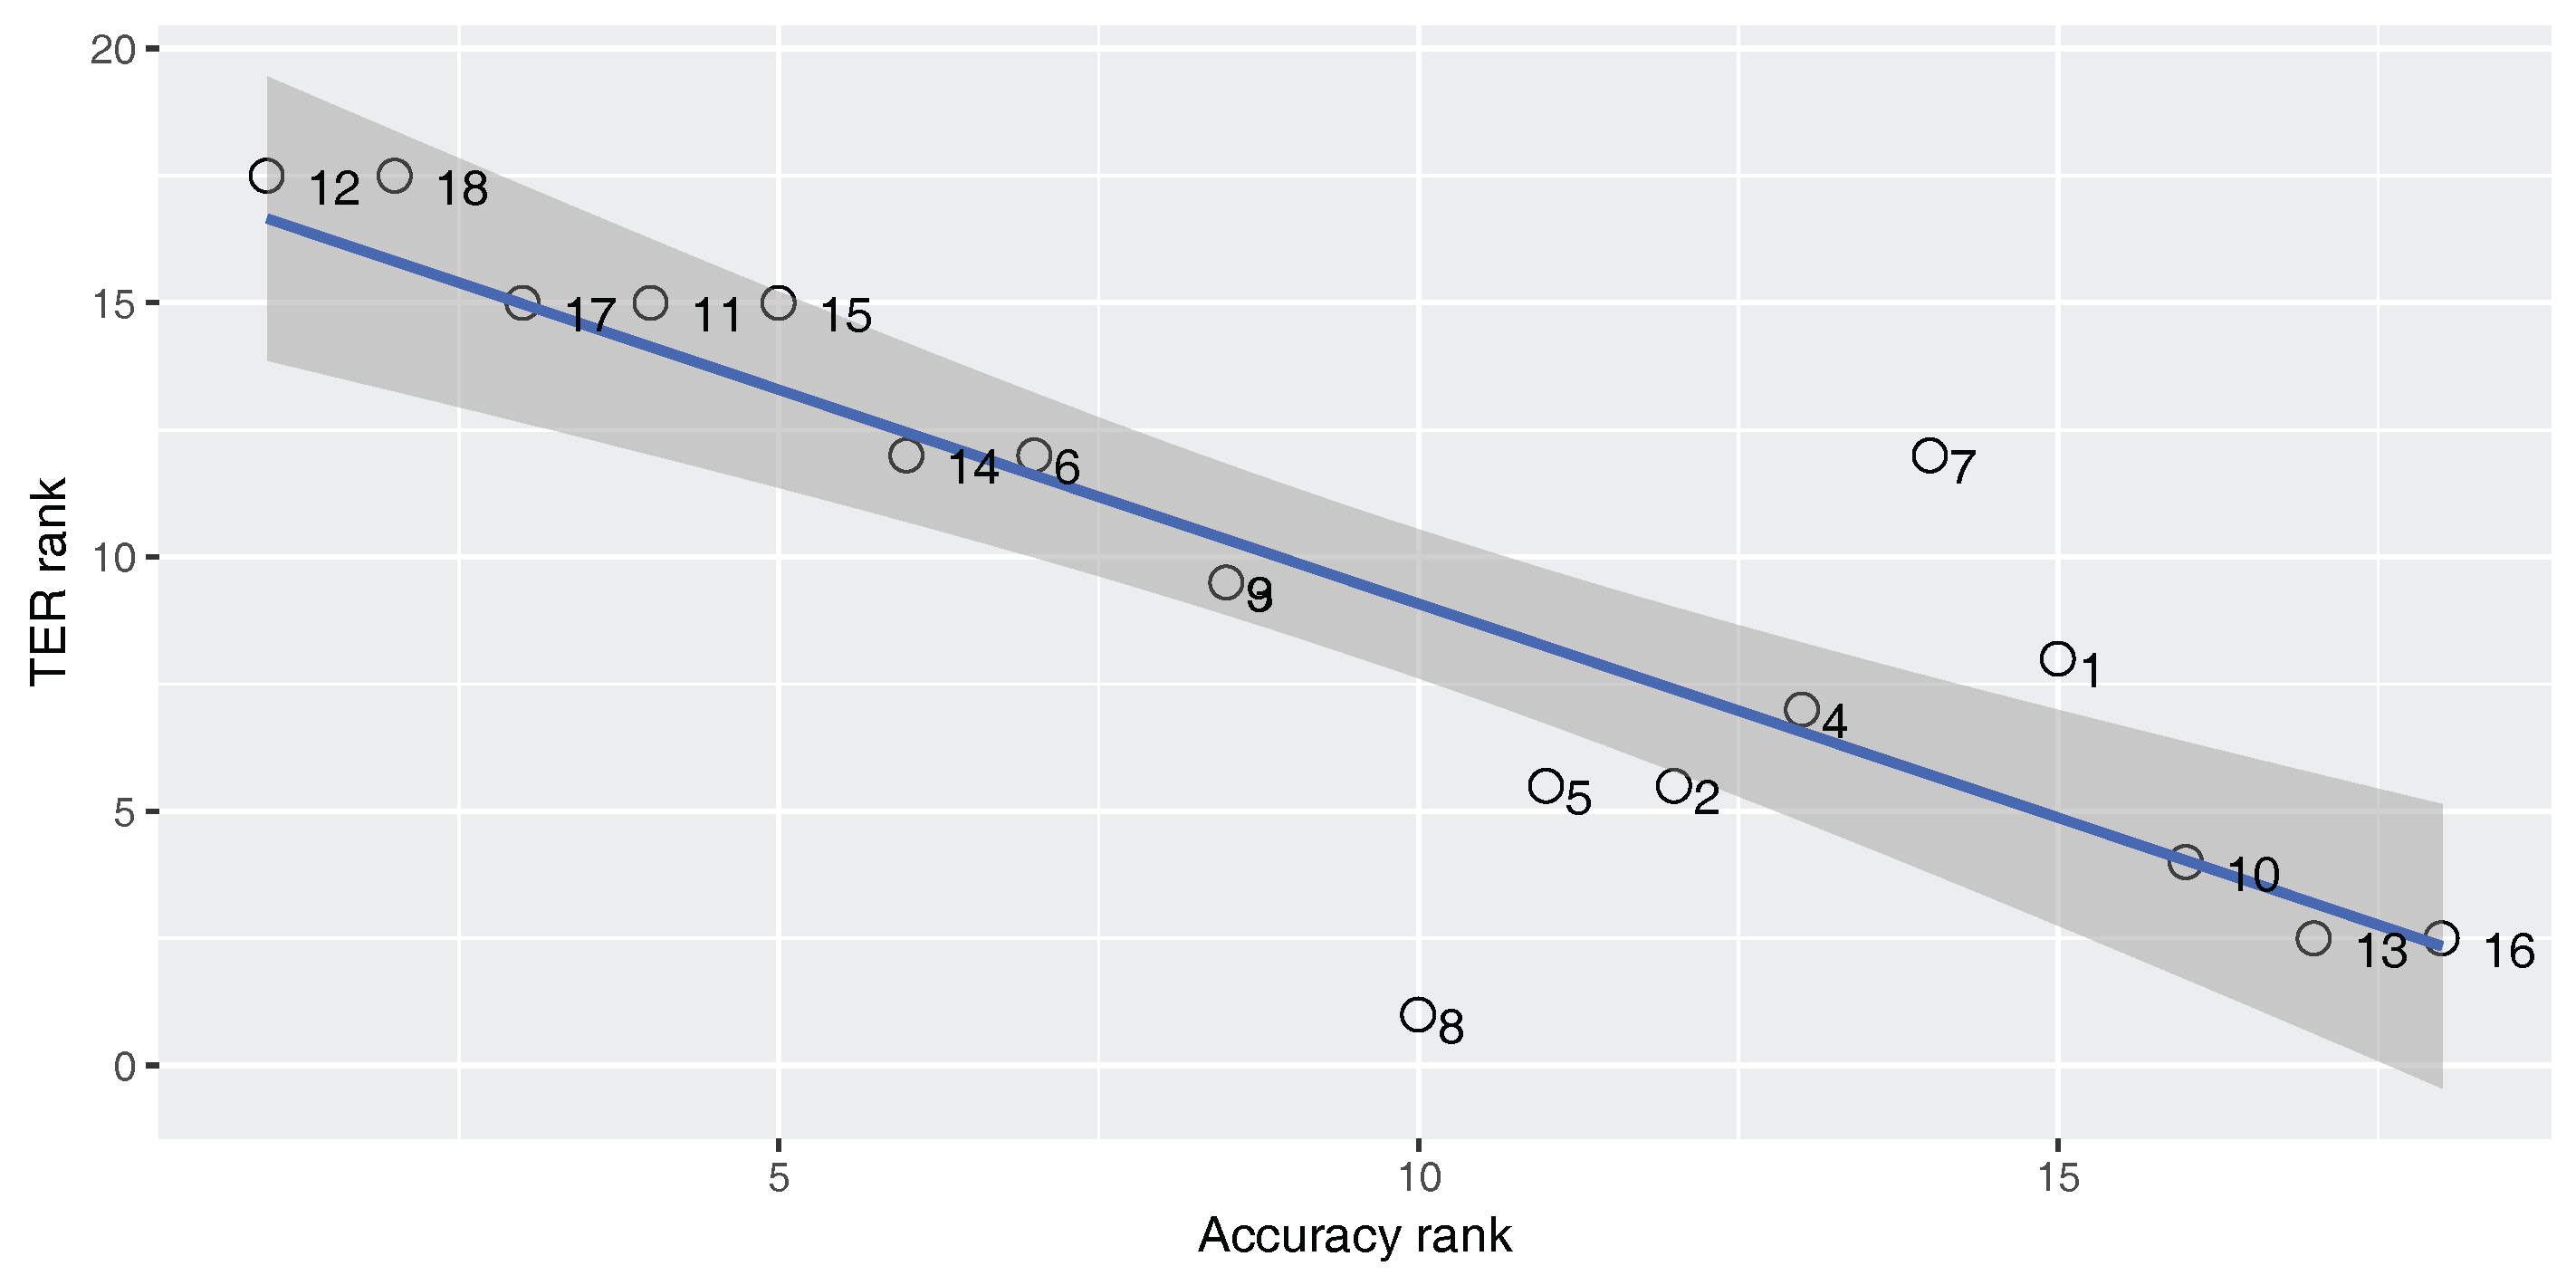
Figure 5,
Figure 6 and
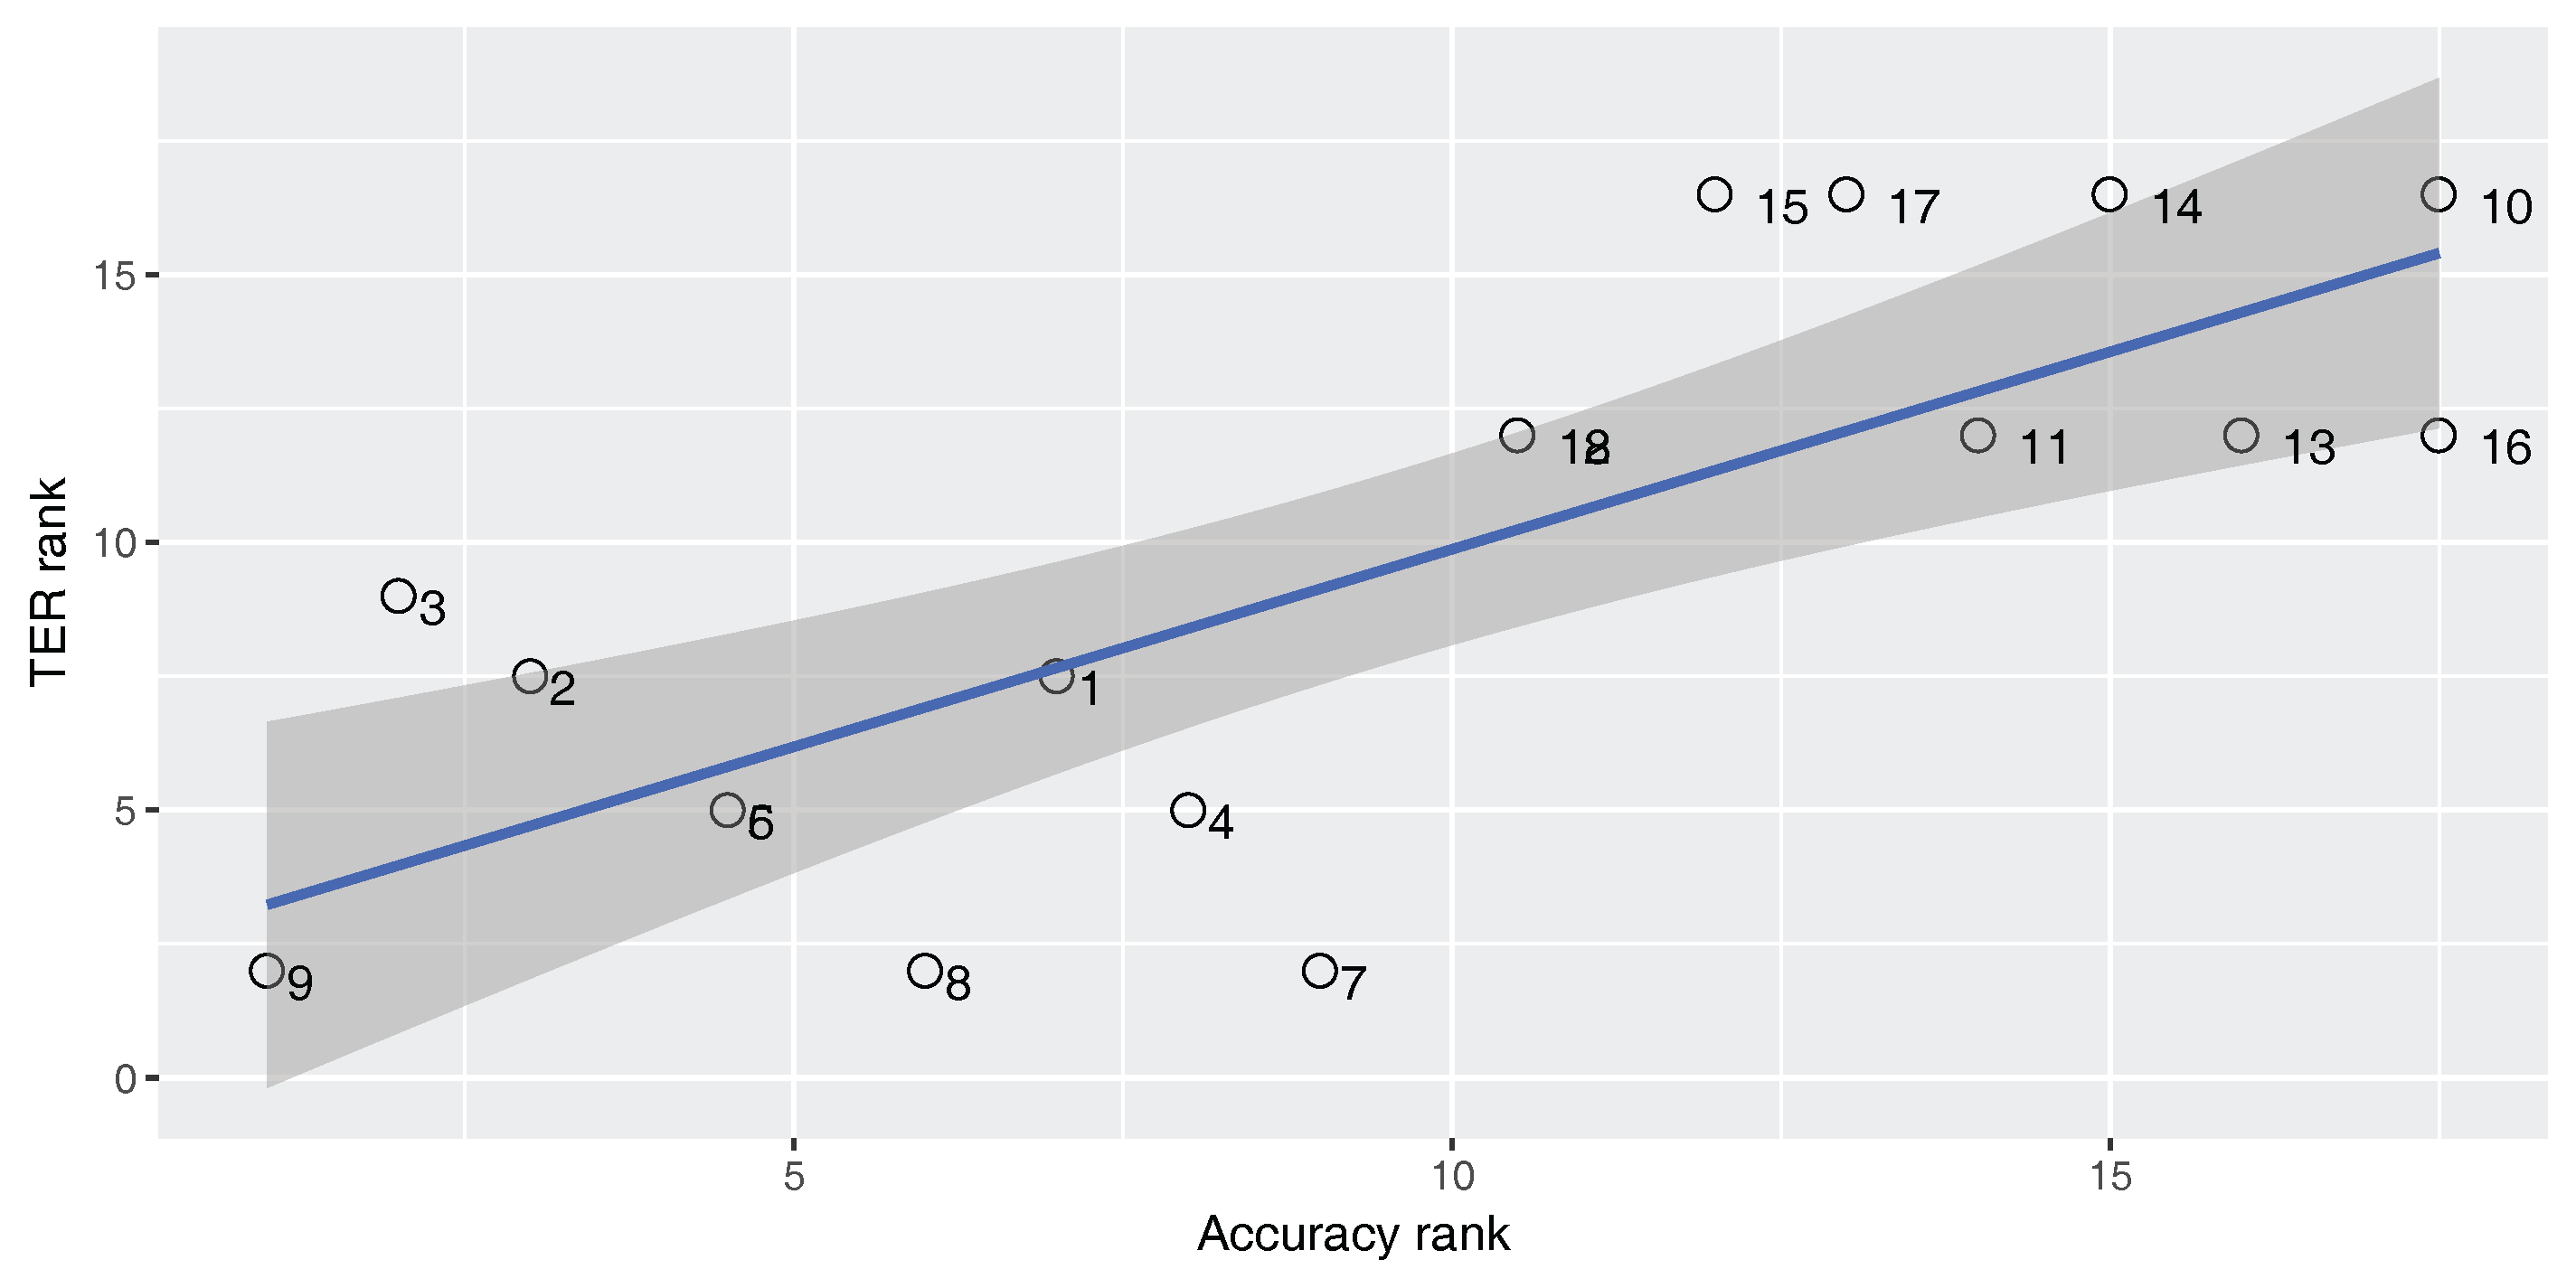
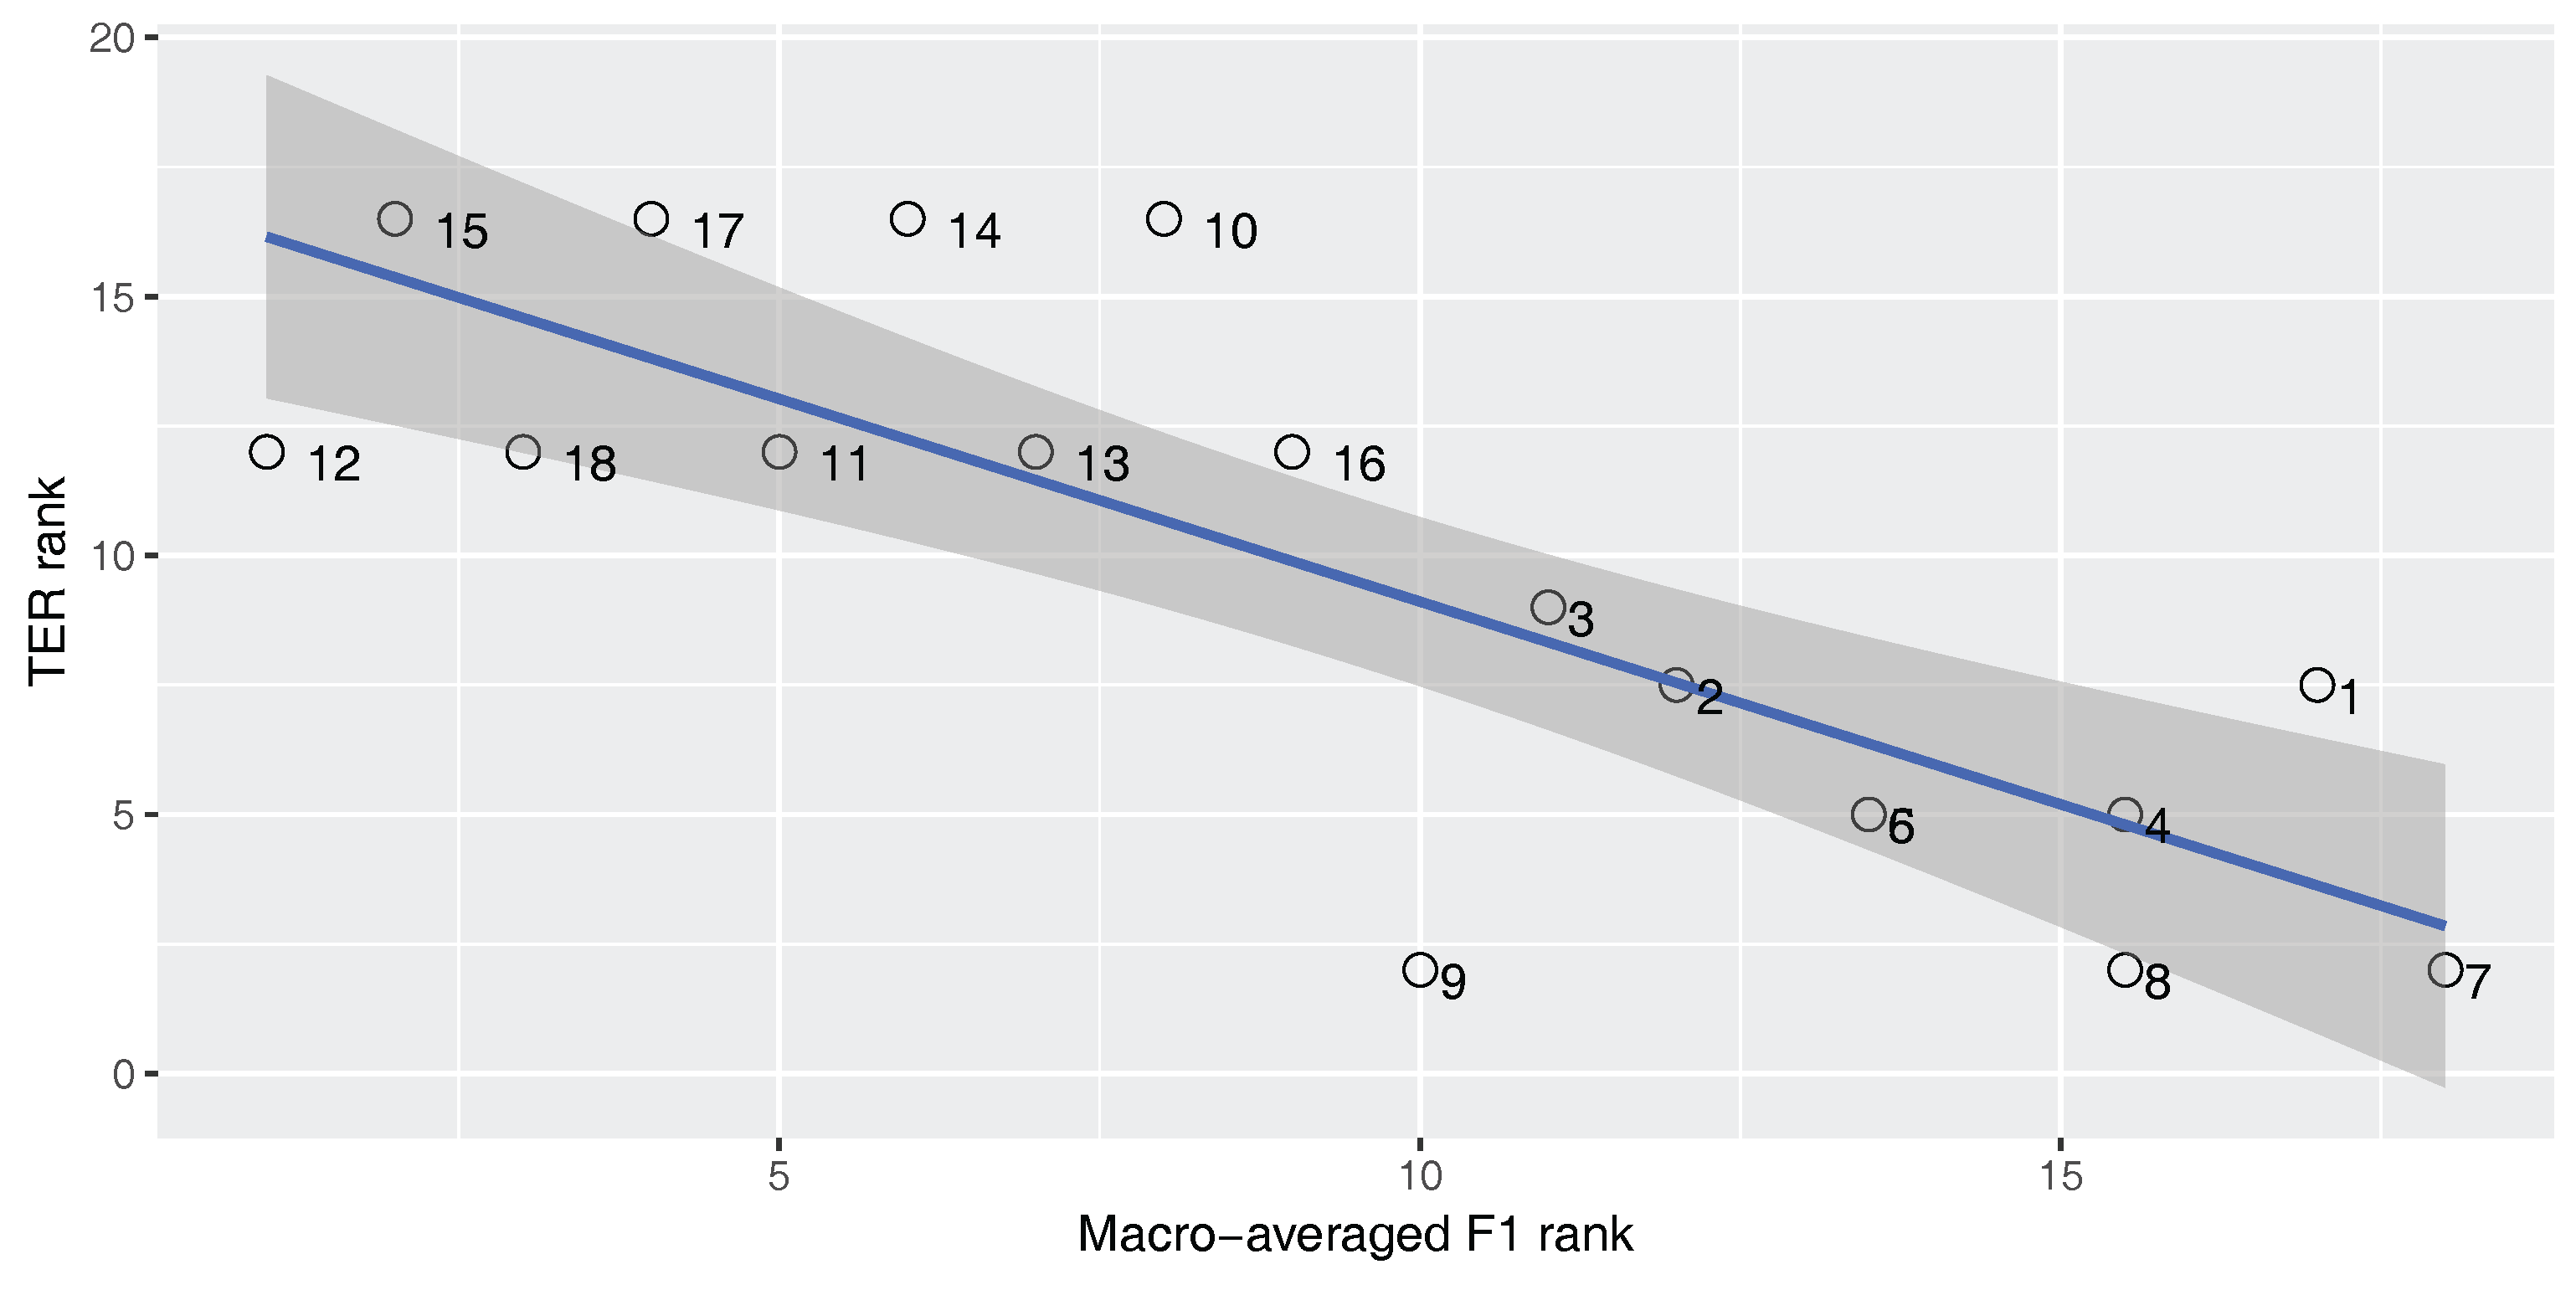
Figure 7 show Spearman’s correlation of the accuracy and TER, for each of our three parallel corpora. Data labels show the corresponding number of each classifier (No.) as shown in
Table 4. The figures include the correlation coefficient
and its
p-value as well as a regression line and its 95% confidence region. The
p-value shows the statistical significance of the correlation (
). We consider a value of
to be statistically significant. These figures have been generated with R’s library
ggplot.
An ideal metric for measuring the performance of the built-in classifier in the SMT system should have a perfect positive Spearman’s correlation with the BLEU score and a perfect negative Spearman’s correlation with the TER score. In this way, increasing classifier quality will increase the SMT performance. As
Figure 2,
Figure 3,
Figure 4,
Figure 5,
Figure 6 and
Figure 7 show, the correlation coefficient is statistically significant in all cases (
). For the En–Fa and En–Tr corpora, there is a strong positive correlation between the accuracy and the BLEU score. Furthermore, there is a strong negative correlation between the accuracy and the TER. However, the absolute values of the correlation coefficients are not equal to one. This means that there is a mismatch between classification accuracy and the SMT performance, such that higher classification accuracy does not always lead to better MT performance. Accordingly, one cannot rely solely on classification accuracy in order to select the best classifier for the DRM in the SMT system.
Strangely enough, for the En–Ar corpus, there is a strong negative correlation between the accuracy and the BLEU score and there is a strong positive correlation between the accuracy and TER. This shows that, for the En–Ar corpus, the classifier with the best accuracy will probably lead to the worst SMT performance. We hypothesize that this is because, as
Table 6 shows, the percentage of
instances is much larger than
instances in the En–Ar corpus (71% versus 21% for head-dep and 88% vs 12% for dep-dep), i.e., the En–Ar corpus is imbalanced. In imbalanced data, micro-averaged scores such as accuracy may become biased in favour of the majority class (here, the
class). Our experiments confirm this trend. We observed that for the classifiers on the En–Ar corpus, the precision of the classifier on the
class is about
, while its precision on the
class is only around
. This means that the classifier considers the majority class (here, the
class) for most of the pairs and only a limited number of reorderings can be performed by the DRM, which is why the performance of the SMT system decreases when the classifier accuracy increases.
Accuracy is a micro-averaged score and hence it is a measure of effectiveness of the classifier on the larger class. In order to measure the effectiveness of the classifier on the smaller class in imbalanced data, macro-averaged results should be computed [
39]. We investigate the relationship between macro-averaged
and the translation performance for imbalanced En–Ar corpus.
We measure macro-averaged
as shown in Equation (
7), where
and
are the
scores on
and
classes, respectively, which are computed based on Equation (
8). While micro-averaged metrics such as accuracy give equal weights to per-instance classification decisions, macro-averaged F-measure as in Equation (
7) gives equal weights to each class [
39]. Hence, macro-averaged metrics are more suitable for imbalanced data:
Figure 8 and
Figure 9 show the correlation between the macro-averaged F-score and the BLEU and TER scores for the En–Ar corpus. The correlation coefficient is statistically significant in all cases (
). As expected, for the imbalanced En–Ar corpus, there is a strong positive correlation between the macro-averaged F-score and BLEU, and there is a strong negative correlation between the macro-averaged F-score and TER.
6.2. The Impact of Classification Improvement on Translation Quality
In
Section 6.1, we showed that improving the performance of the classifier in the DRM does not automatically improve SMT quality. However, we observed that when the relative improvement in classification performance is high enough, the quality of the SMT system improves too. In order to confirm this observation, we investigate the impact of classification improvement on translation quality. To this end, for each pair of the 18 SMT systems described in
Section 5, we calculate the amount of relative improvement in classification performance and SMT quality as shown in Algorithm 1. In Algorithm 1,
shows the performance of the classifier in the DRM of SMT system
A in terms of accuracy or macro-averaged F-score.
shows the quality of SMT system
A in terms of BLEU.
and
show, respectively, the relative improvement in the classification performance and SMT quality for system A compared to system B.
For each parallel corpus, we calculate the improvement in the classification performance and SMT quality for each pair of SMT systems based on Algorithm 1. As discussed in
Section 6.1, for the imbalanced En–Ar corpus, the macro-averaged F-score shows higher correlation with BLEU in comparison to accuracy. Accordingly, for the En–Ar corpus we calculate
in terms of macro-averaged F-score while for the En–Fa and En–Tr corpora we calculate it in terms of accuracy. For all SMT systems, we calculate
in terms of BLEU.
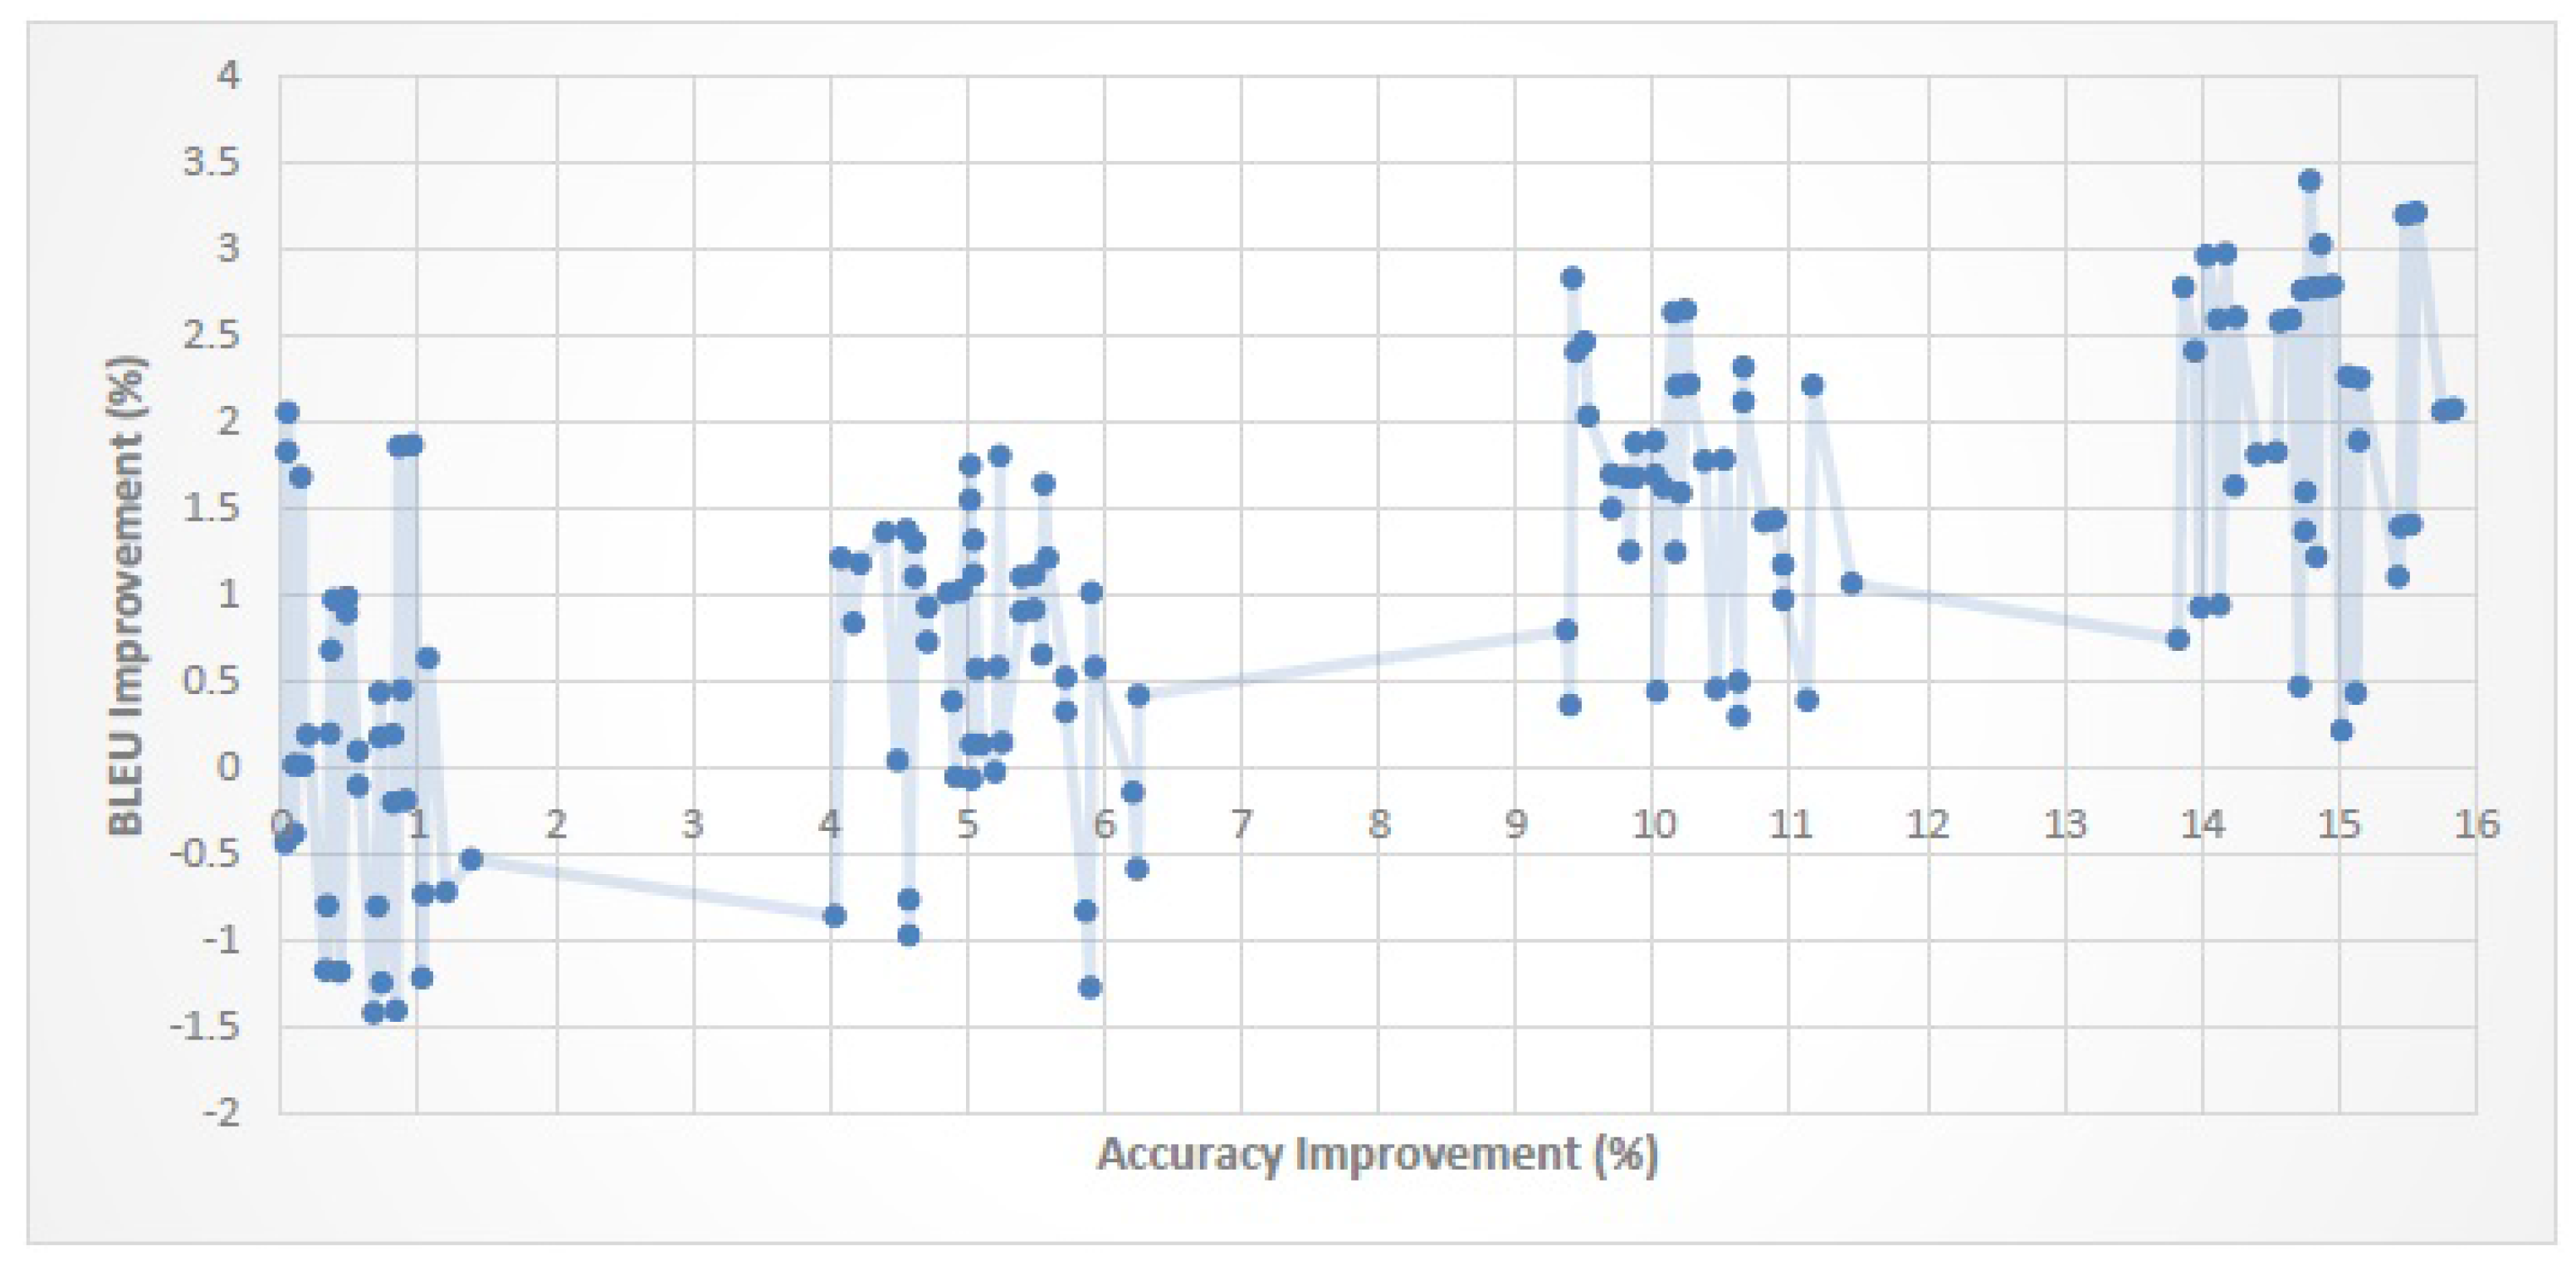
Figure 10,
Figure 11 and
Figure 12 show the relationship between the improvement in classification performance (
) with the improvement in SMT quality (
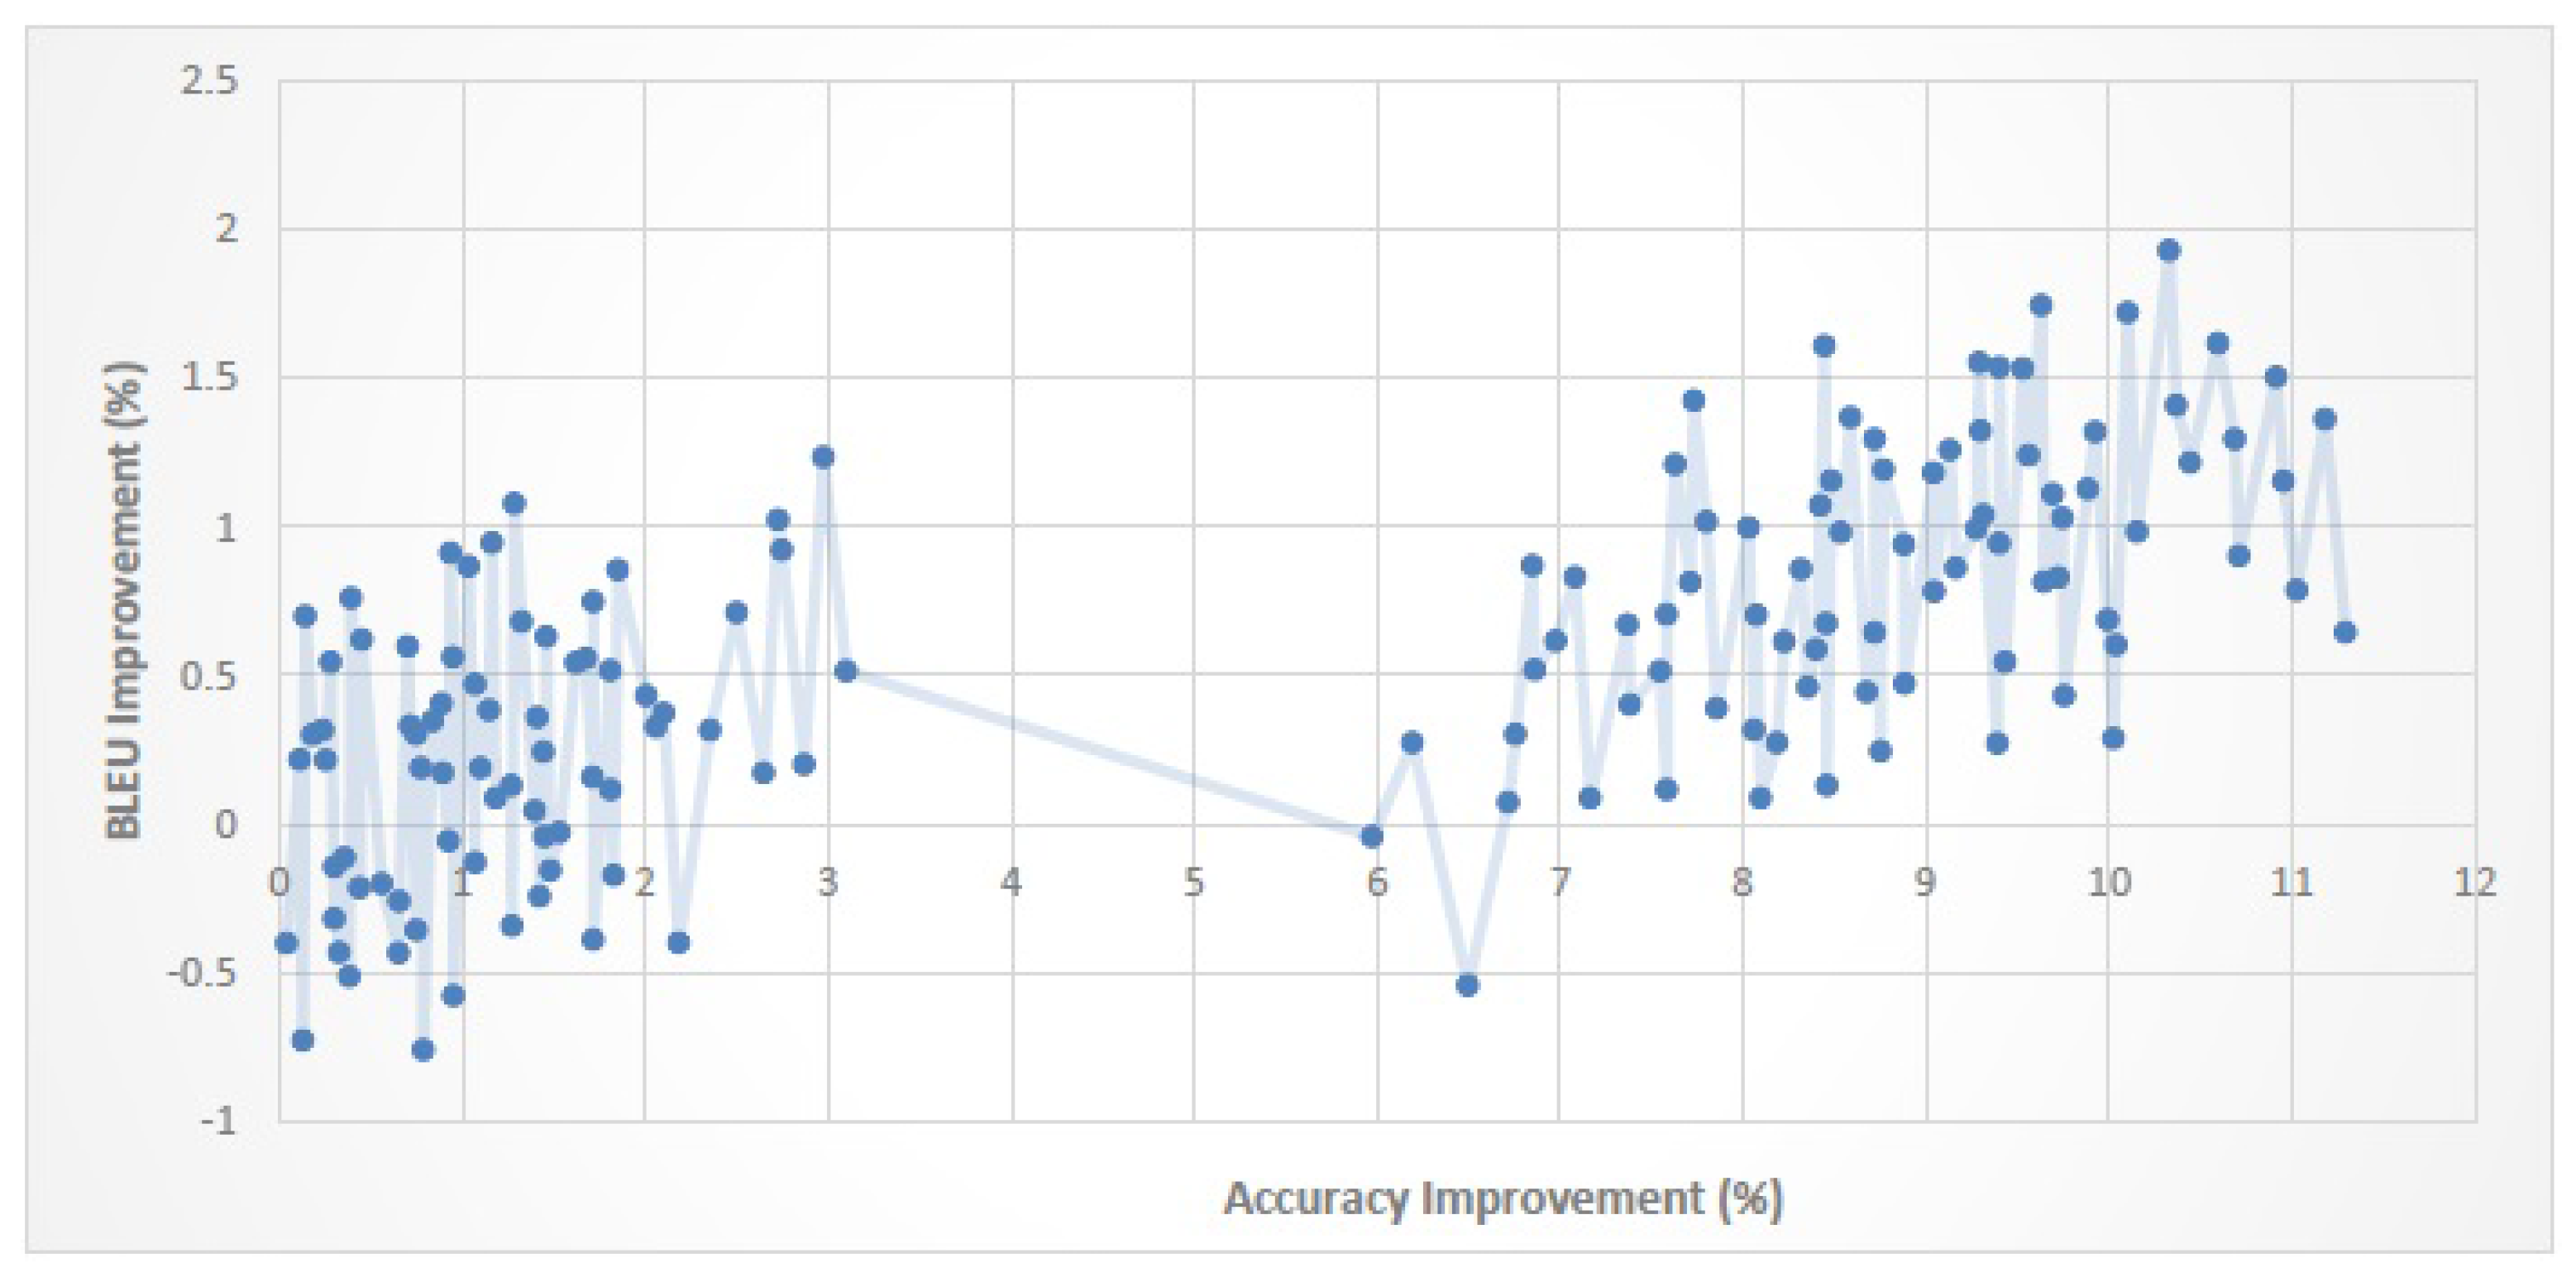
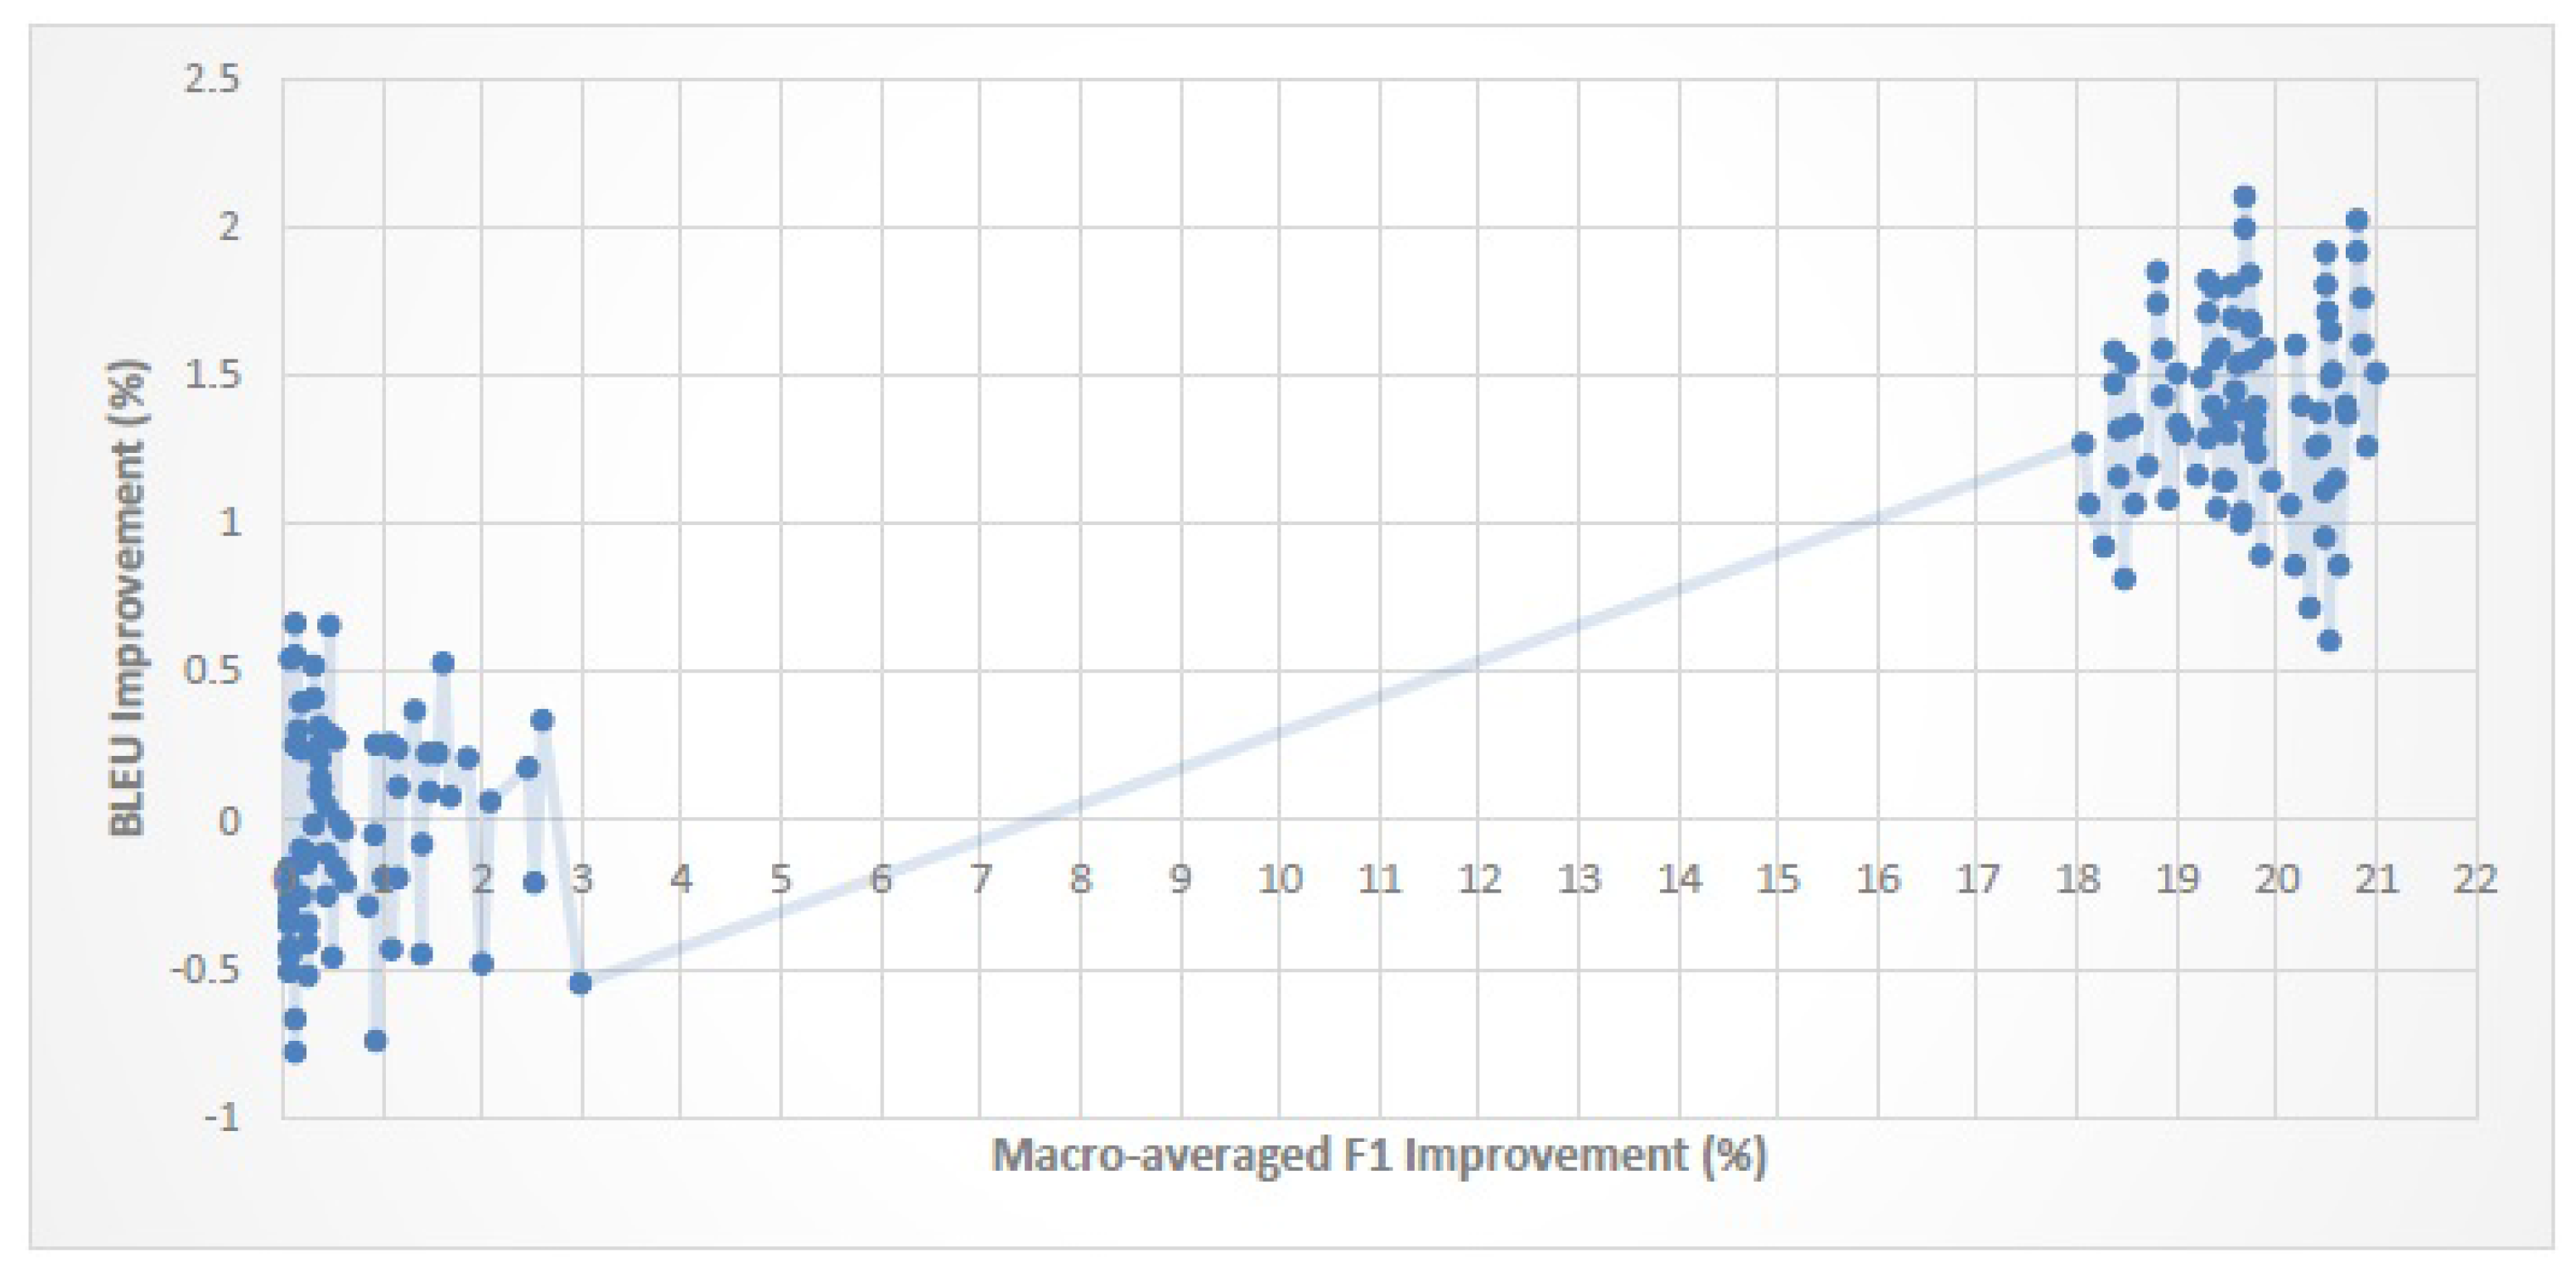
) for En–Fa, En–Ar and En–Tr corpora, respectively.
We derive the following observations from the results:
When the improvement in classification performance exceeds a certain threshold, SMT quality will improve too. For En–Fa, En–Ar and En–Tr corpora, the threshold values are 6.4%, 3% and 6.2%, respectively. This shows that, for each parallel corpus, if the amount of improvement in classification performance exceeds the corresponding threshold value, we can expect the SMT quality to improve as well.
The magnitude of the improvement in classification performance is not necessarily proportional to the magnitude of the improvement in SMT quality. That is, a higher improvement in classification performance does not always lead to a higher improvement in SMT quality.
An improvement of about 0–20% in classification performance leads to an improvement of about 0–3.5% in the BLEU score. It is worth noting that although the improvement in BLEU score is much smaller than the improvement in classification performance, it is still comparable with the BLEU improvement gained by some recent reordering models (cf.
Table 7).
| Algorithm 1 Calculating the amount of improvement in classification performance and SMT quality. |
; for do for do if ( then ; else ; end if ; ; end for end for ([0...index], [0...index]);
|


