Antioxidant Activity of Diphenylpropionamide Derivatives: Synthesis, Biological Evaluation and Computational Analysis

 , ,
, , 
Abstract
:Introduction
Results and Discussion


| Cmp. | R | (a) % inhibition ABTS + | (b) T.E A.C (µM) | (c) LD50 (ppm) [95% confidence intervals] |
|---|---|---|---|---|
 | ||||
| 1 | 4-methoxyphenyl | 3.4 | 0.8 | 4.94 [11.04/1.73] |
| 2 | 3,4-dimethoxybenzyl | 3.06 | 0.7 | 9.45 [16.25/5.43] |
| 3 | 4-morphinylphenyl | 78.19 | 20.3 | 9.66 [17.51/5.27] |
| 4 | 4-methoxybenzyl | 41.8 | 10.8 | 5.9941 [10.7/3.16] |
| 5 | 4-methoxyphenethyl- | 0.67 | 0.17 | 3.4918 [5.77/2.05] |
 | ||||
| 6(d) | 4-methoxyphenyl | n.a. | n.a. | 14.34 [54.34/4.8] |
| 7 | 3,4-dimethoxybenzyl | 7.63 | 1.98 | 11.97 [28.93/5.22] |
| 8 | 4-morpholinyphenyl | 71.4 | 18.6 | n.a. |
| 9 | 3,5-dimethoxybenzyl | 33.93 | 8.8 | 25.13 [123.08/9.36] |
| 10 | 4-fluoro- N,N-diethylbenzylamine | 4.17 | 1.08 | 1.38 [2.19/0.75] |
| 11 | 4-methoxyphenethyl- | n.a. | n.a. | 14.45 [66.38/4.35] |
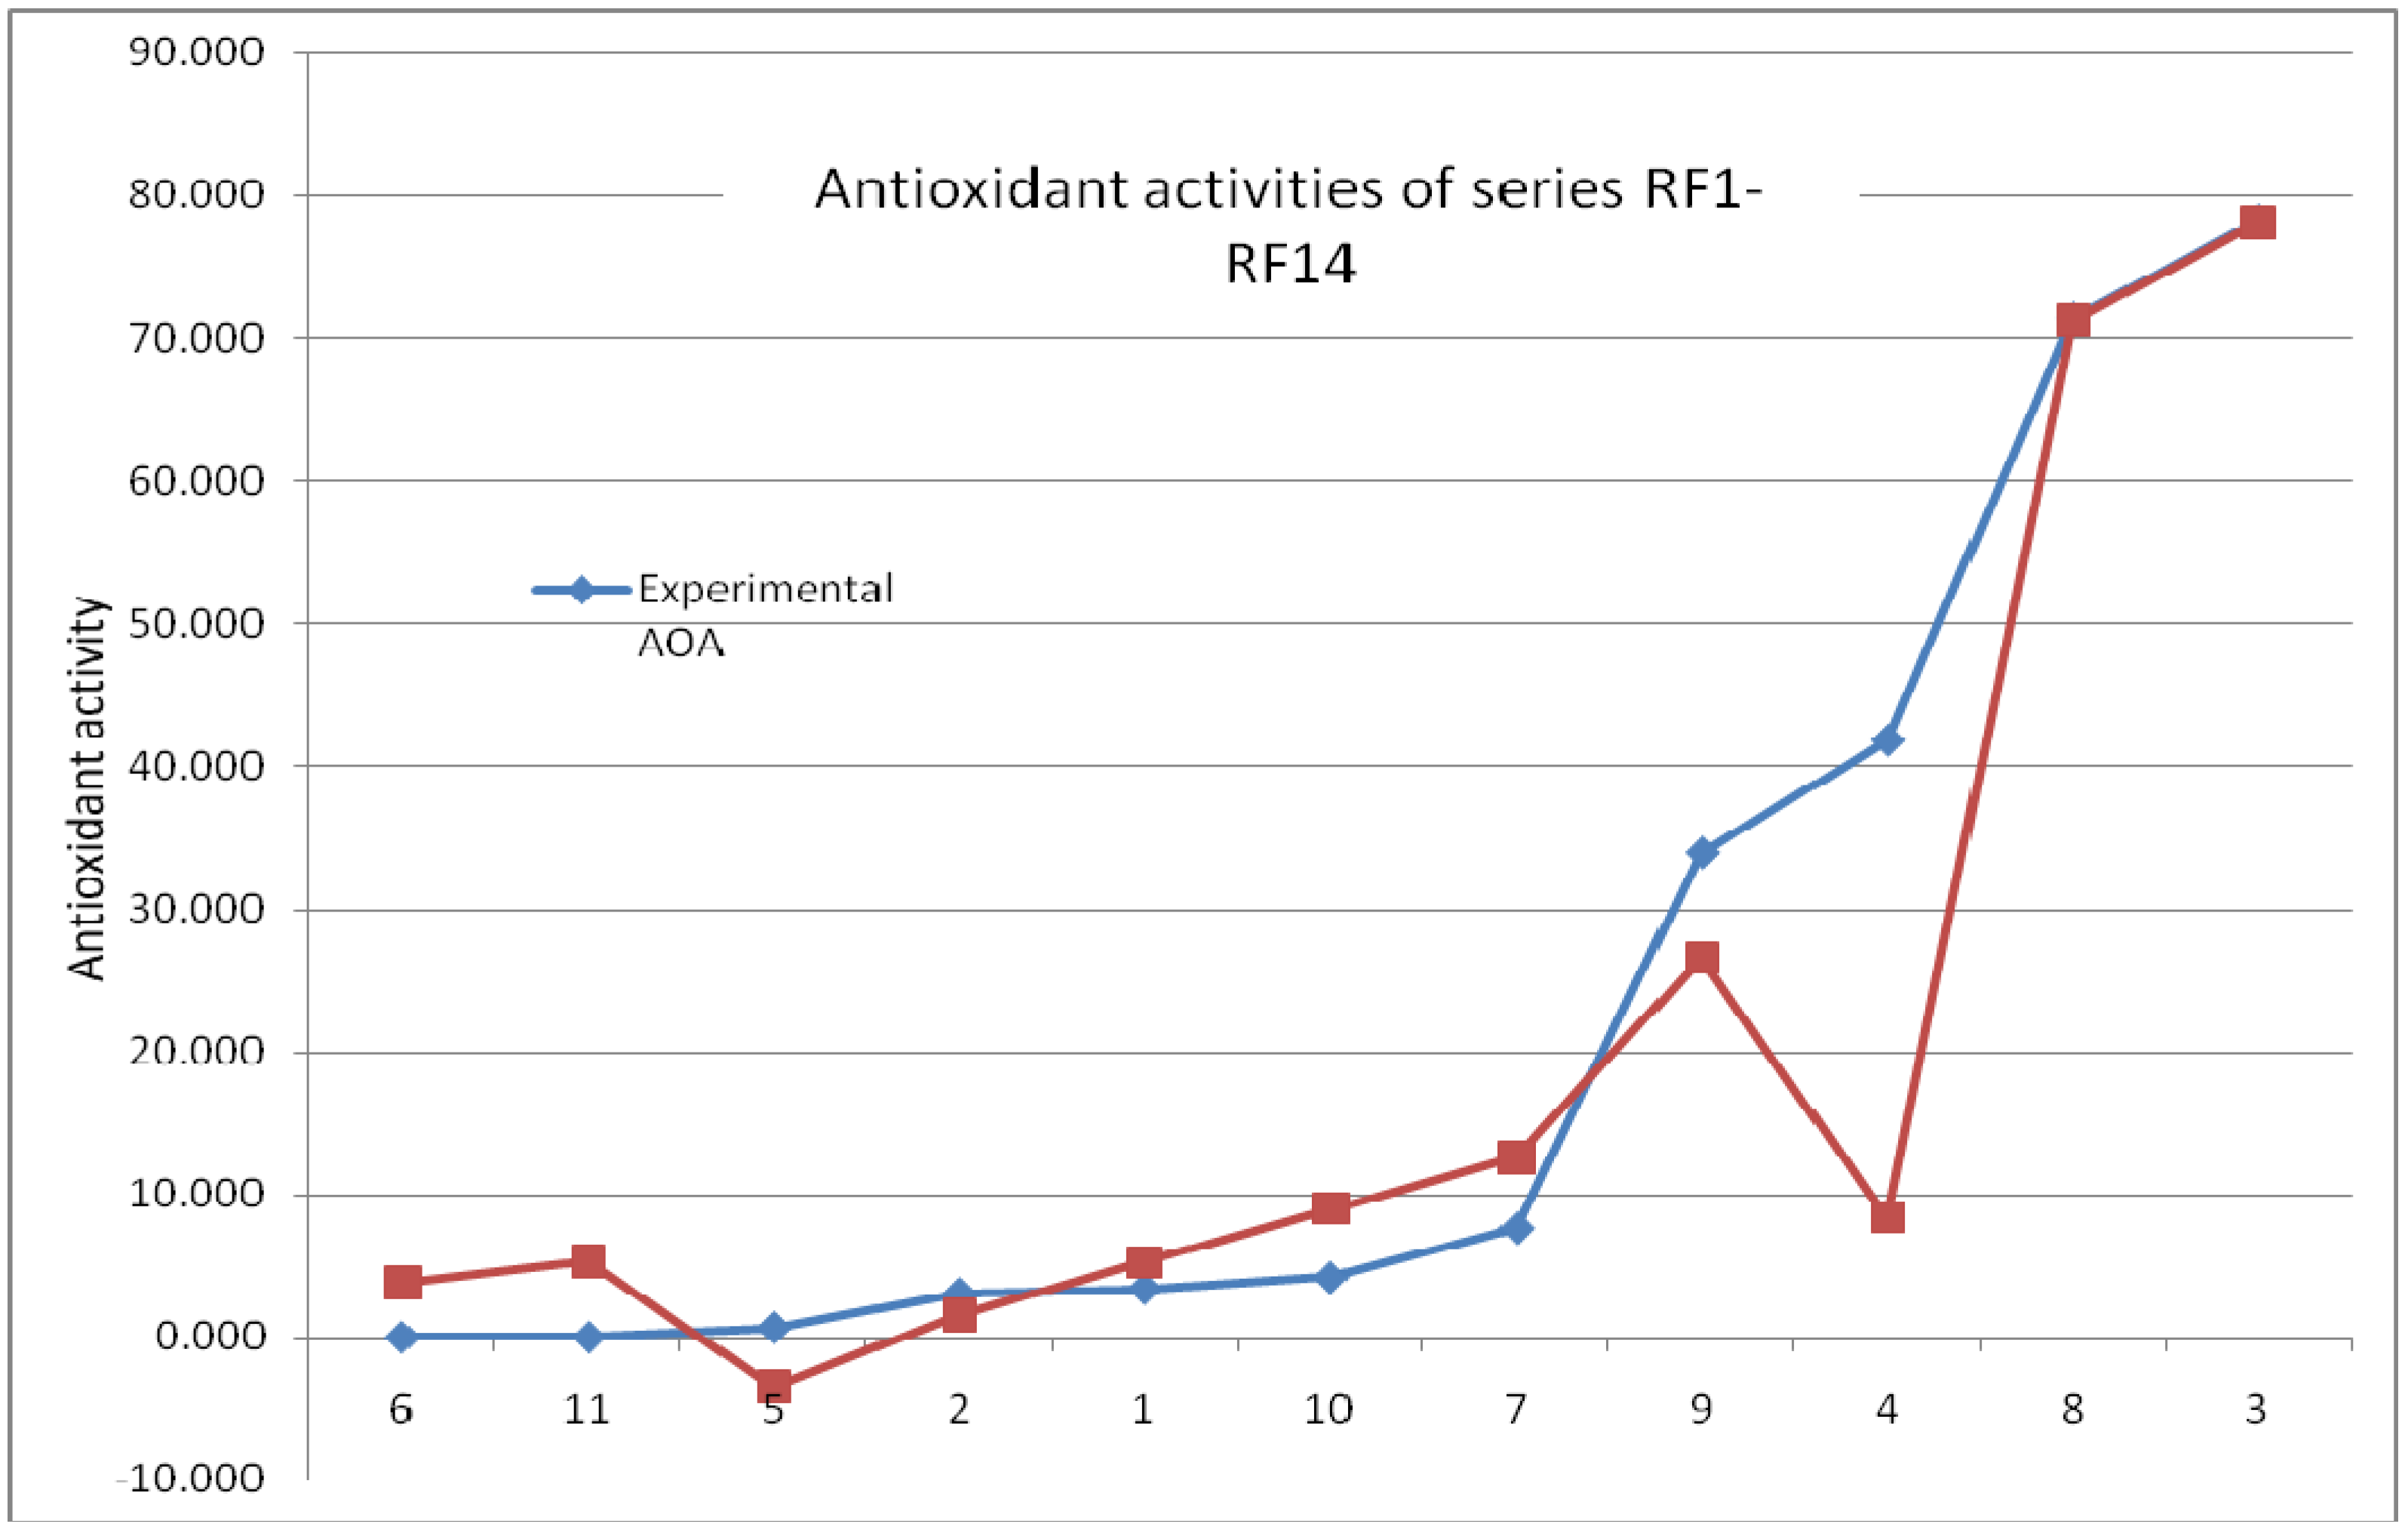
| Molecule | Experimental AOA | Dipole za | Inversion energyb | Predicted AOA | Residual AOA |
|---|---|---|---|---|---|
| 6 | 0.000 | 1.98 | 1.49 | 3.74 | 3.74 |
| 11 | 0.000 | 2.057 | 1.54 | 5.30 | 5.30 |
| 5 | 0.670 | 2.22 | 1.34 | -3.51 | -4.18 |
| 2 | 3.060 | 0.72 | 1.21 | 1.48 | -1.58 |
| 1 | 3.400 | -0.365 | 1.11 | 5.20 | 1.80 |
| 10 | 4.170 | -0.816 | 1.14 | 8.97 | 4.80 |
| 7 | 7.630 | 0.522 | 1.48 | 12.56 | 4.93 |
| 9 | 33.930 | -1.75 | 1.47 | 26.52 | -7.41 |
| 4 | 41.800 | 1.84 | 1.58 | 8.36 | -33.44 |
| 8 | 71.400 | 1.57 | 2.65 | 71.26 | -0.14 |
| 3 | 78.200 | 0.265 | 2.63 | 78.08 | -0.12 |

| In Vitro Antiproliferative Activity of Compounds | |||
| IC50 (5% confidence limits) | |||
| cmp | J774.A1 | HEK-293 | WEHI-164 |
| 3 | 8.4 (6.7-0.11) | 3.4 (2.2-4.4) | 5.4 (4.6-6.4) |
| 4 | 9.7 (1.7-14) | >10 | >10 |
| 8 | 0.14 (0.12-0.17) | 5.7 (2.3-14) | 14 (13-16) |
Conclusions
Experimental
General
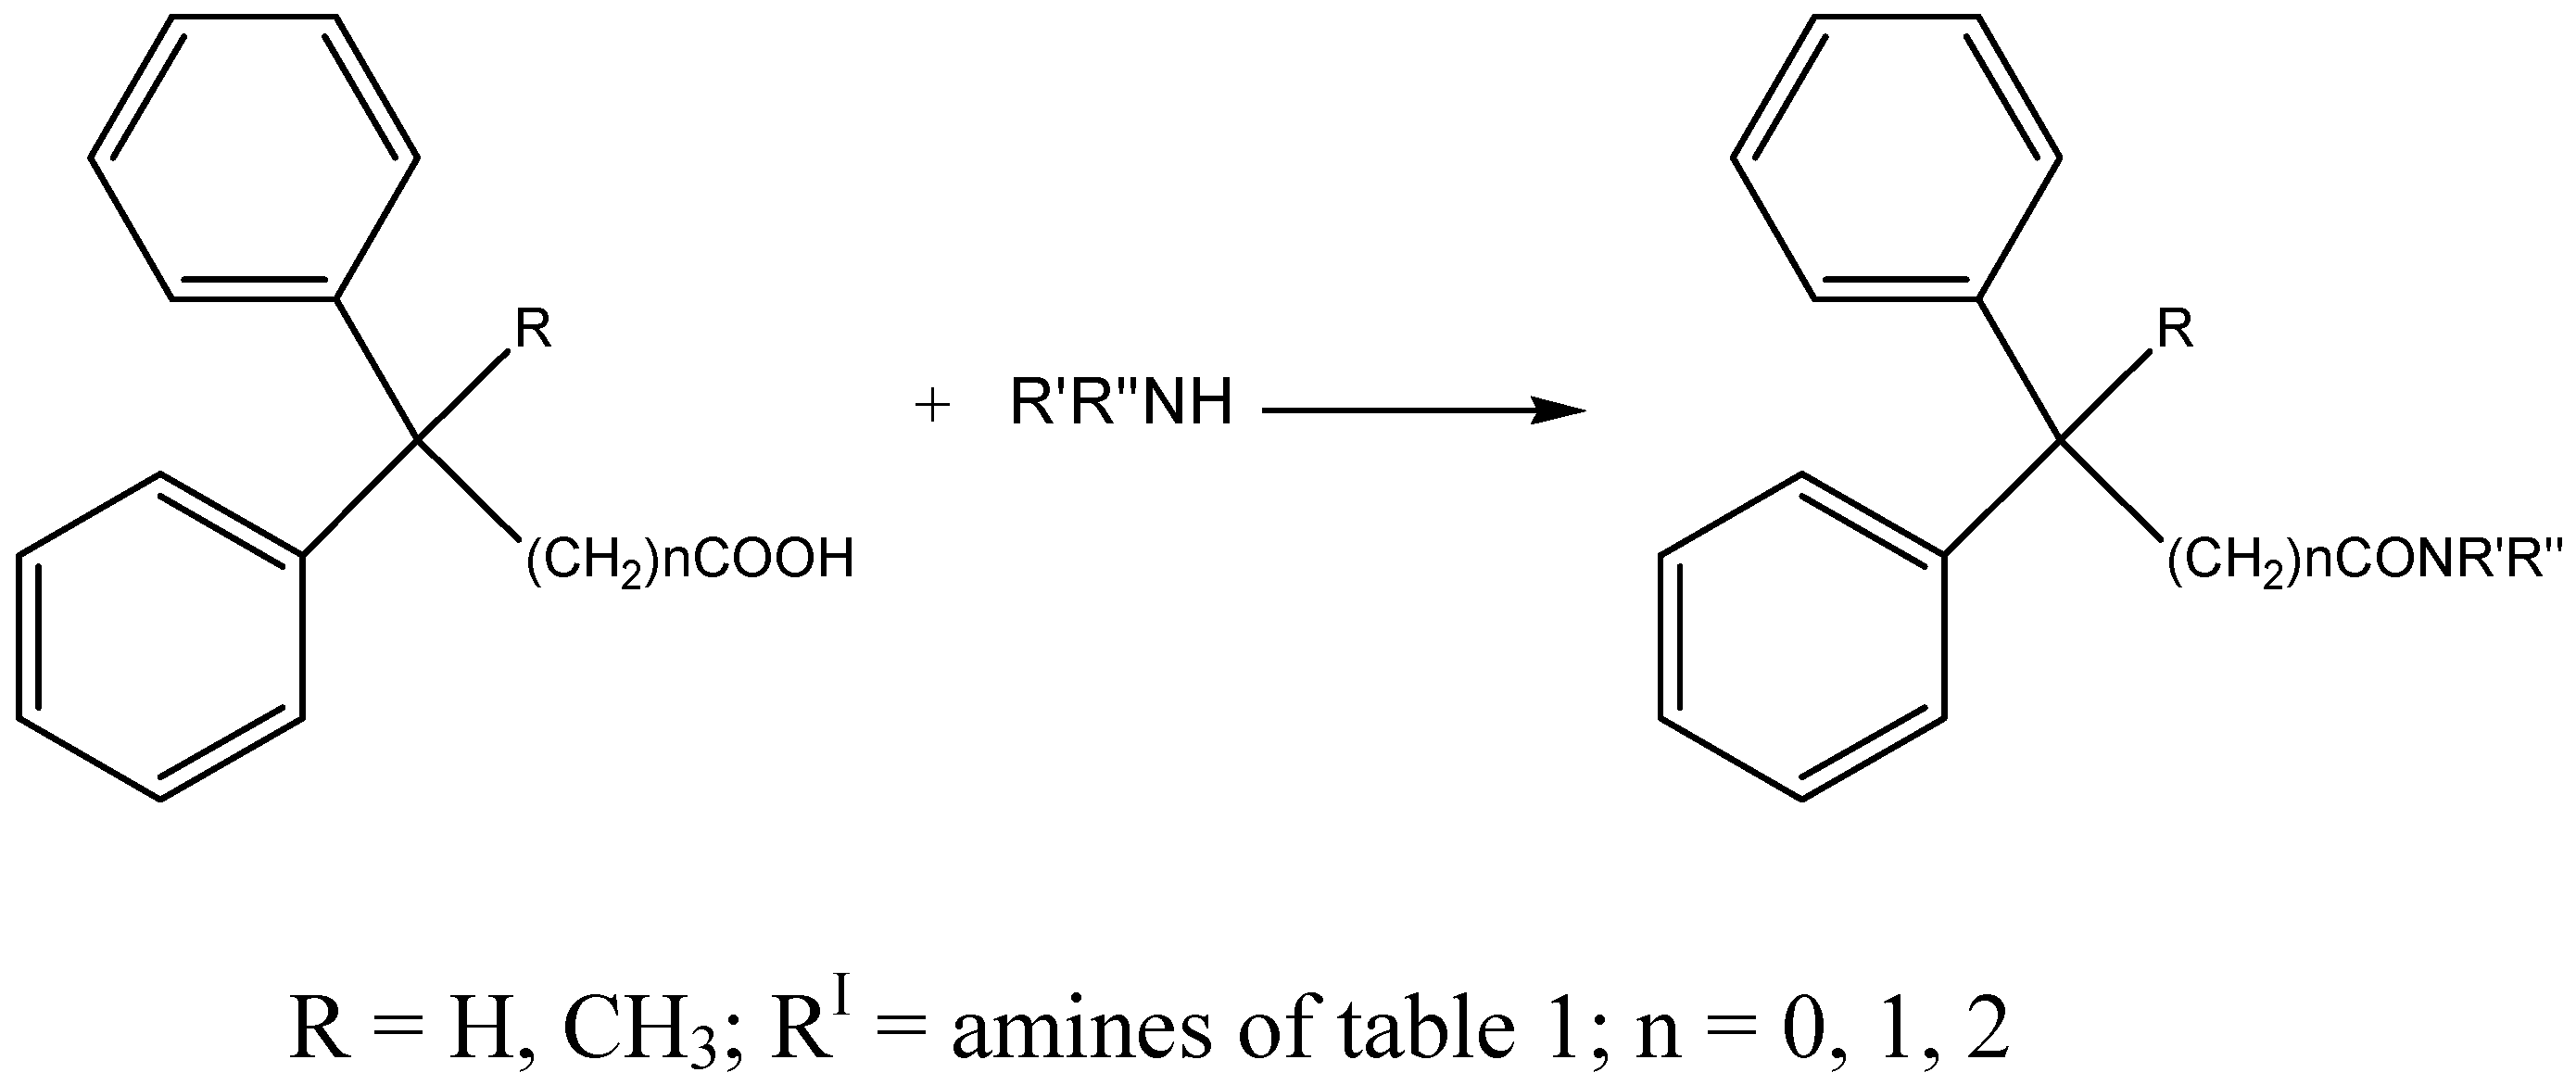
General procedure for the synthesis of compounds 1-11
Antioxidant activity assay by the ABTS method
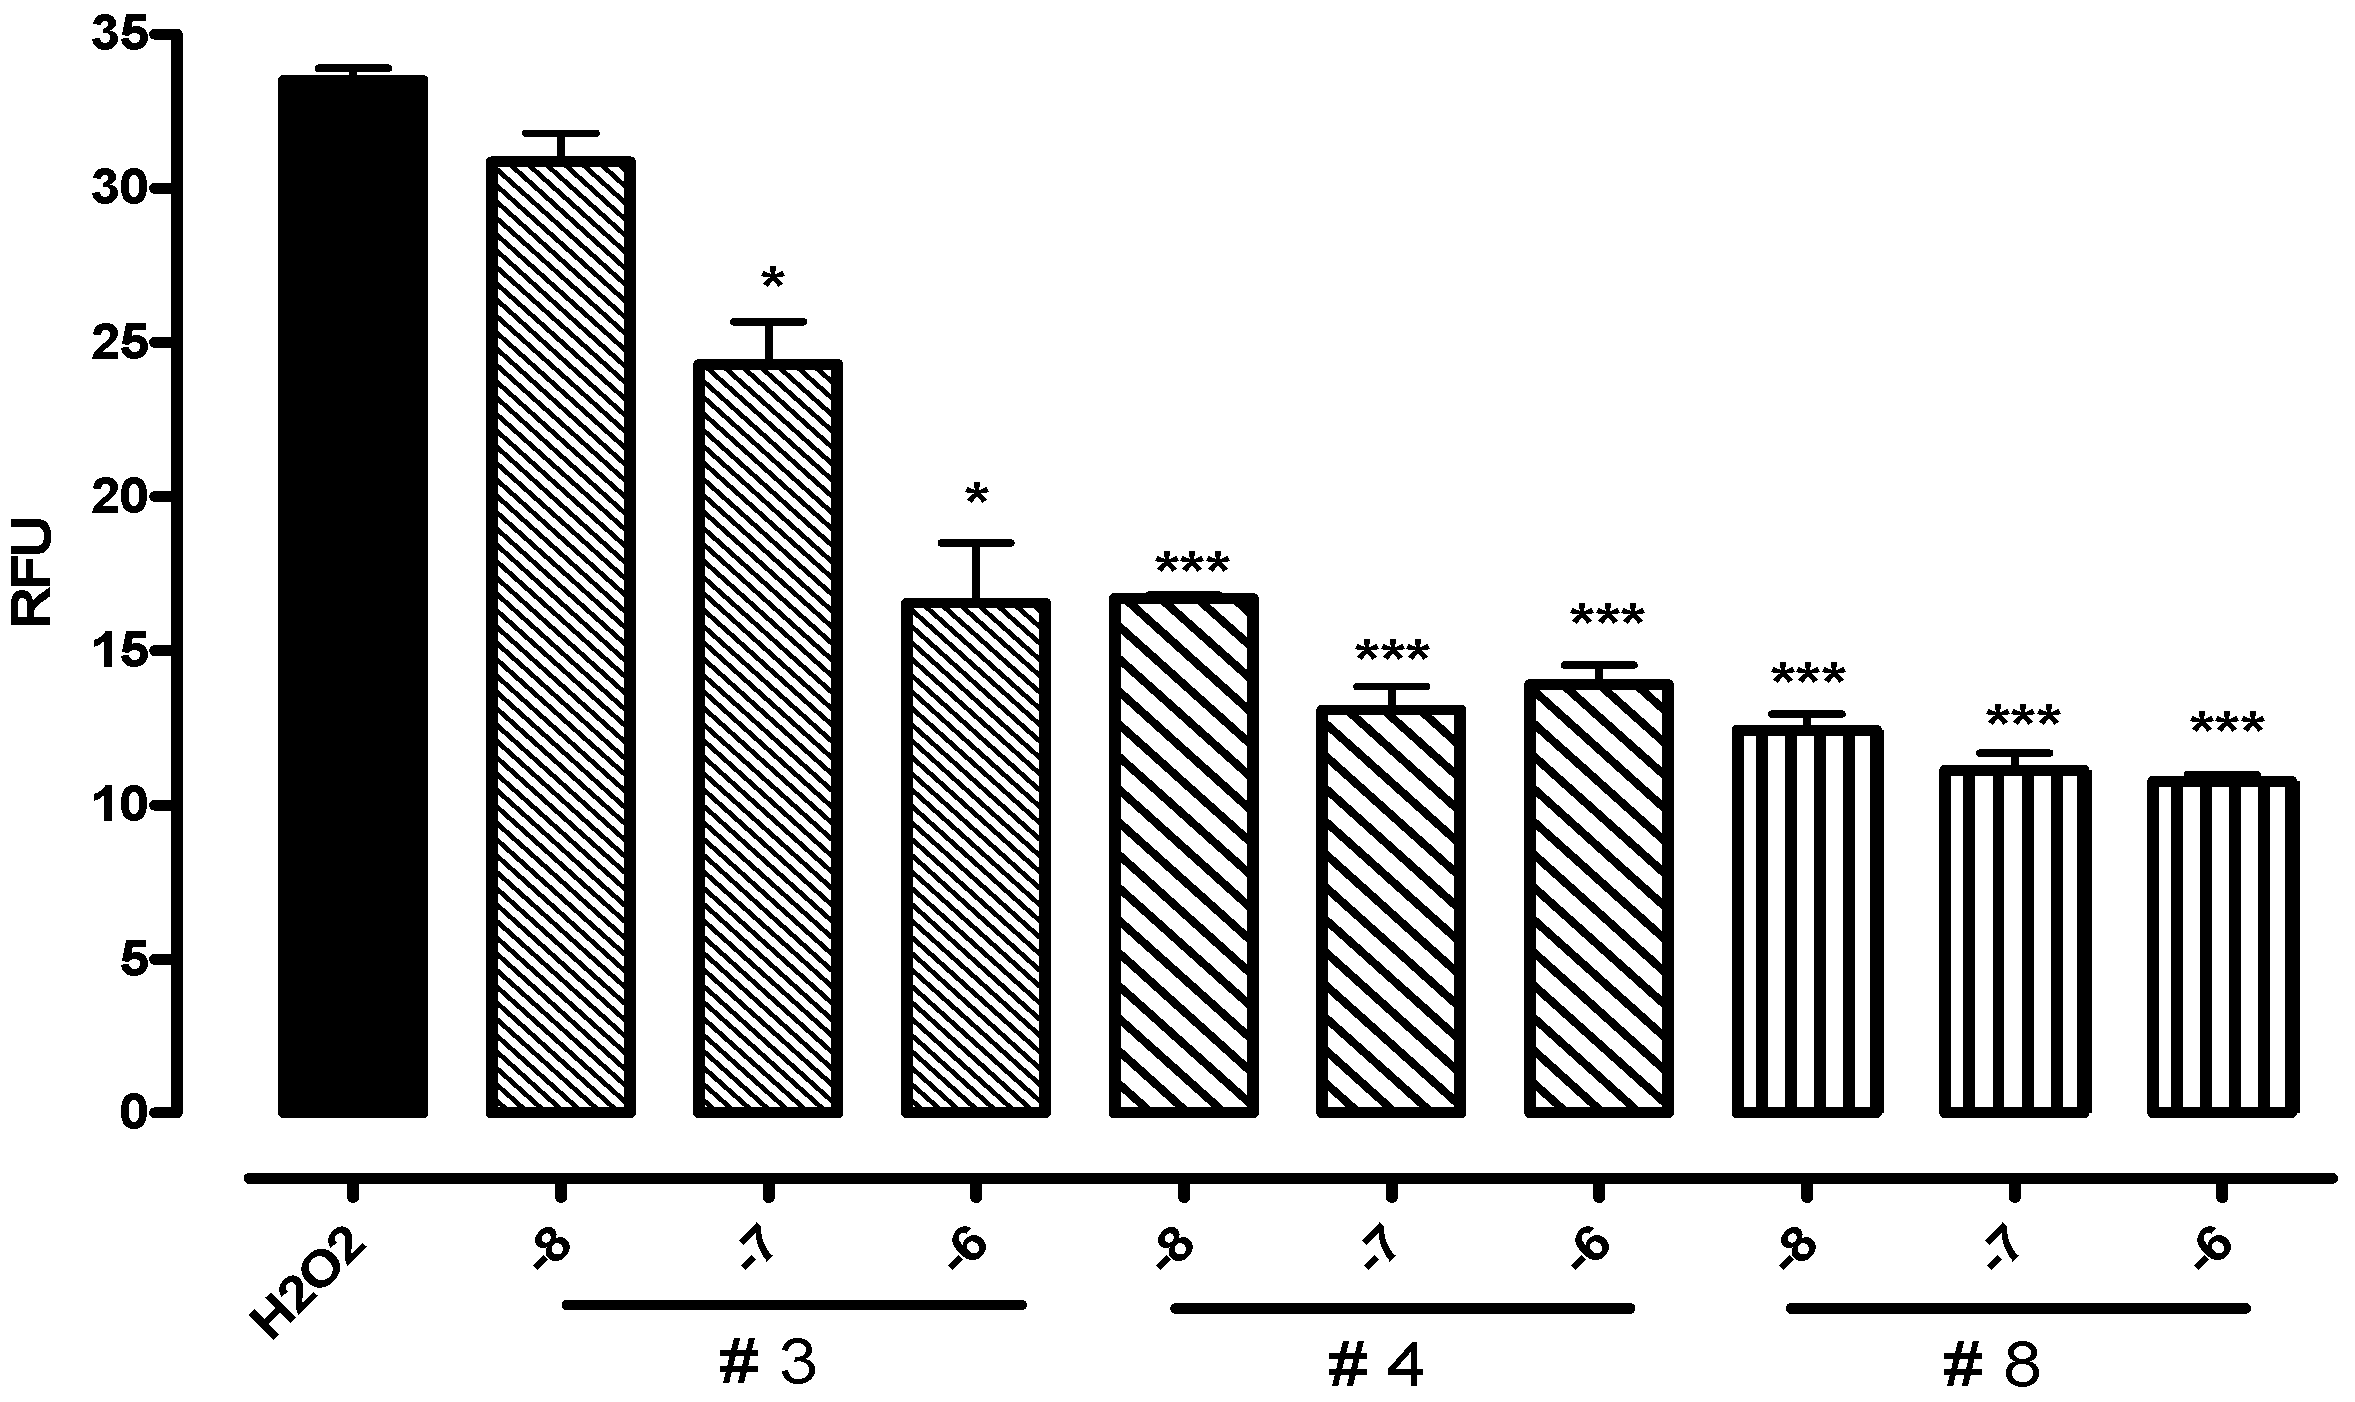
Measurement of reactive oxygen species (ROS)
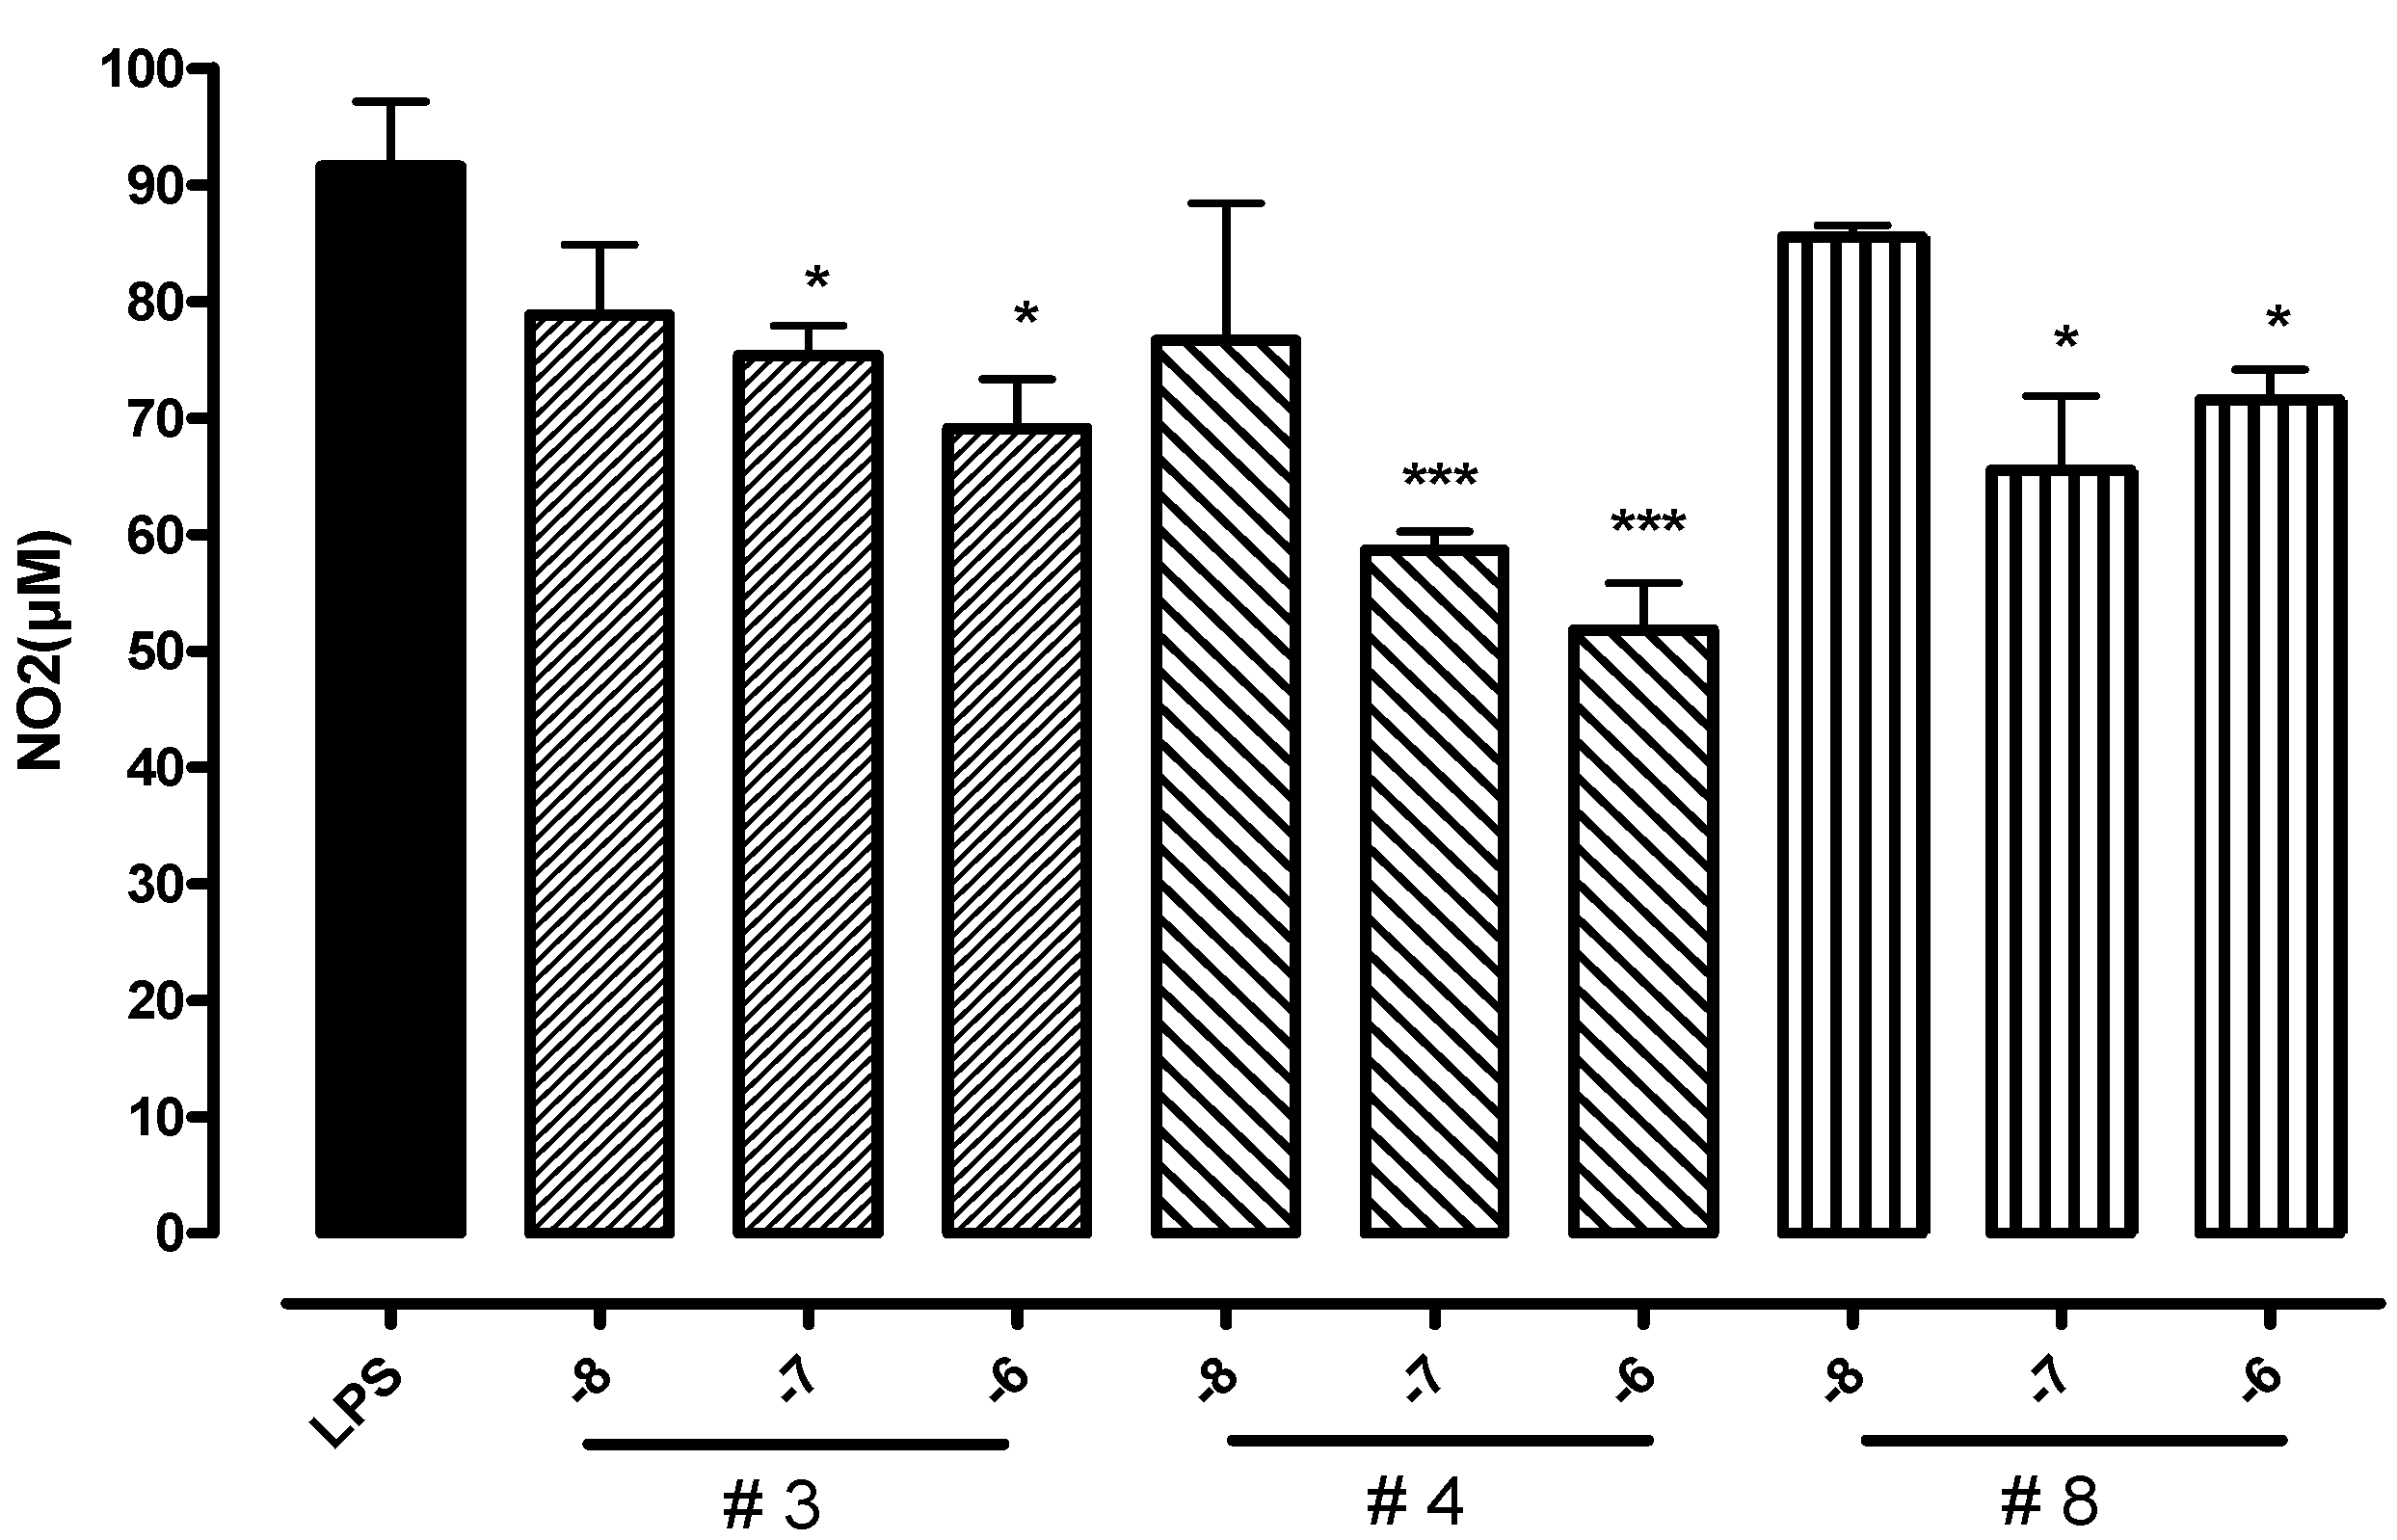
Analysis of nitrite
Antiproliferative Activity Assay
Brine Shrimp Test
Computational analysis
| Friedman LOF | 164.56185200 |
| R-squared | 0.856 |
| Significant Regression | Yes |
| Significance-of-regression F-value | 101.47 |
| Critical SOR F-value (95%) | 6.659 |
| Min expt. error for non-significant LOF (95%) | 4.262 |
References and Notes
- Ames, B.N.; Shigenaga, M.K.; Hagen, T.M. Oxidants, Antioxidants, and the Degenerative Diseases of Aging. Proc. Natl. Acad. Sci. USA 1993, 90, 7915–7922. [Google Scholar] [CrossRef] [PubMed]
- Hertog, M.G.L.; Feskens, E.J.M.; Hollman, P.C.H.; Katan, M.B.; Kromhout, D. Dietary antioxidant flavonoids and risk of coronary heart disease: the Zutphen Elderly Study. Lancet 1993, 342, 1007–1011. [Google Scholar] [CrossRef] [PubMed]
- Temple, N.J.; Gladwin, K.K. Fruits, vegetables, and the prevention of cancer: research challenges. Nutrition 2003, 19, 467–470. [Google Scholar] [CrossRef] [PubMed]
- Peters, U.; Leitzmann, M.F.; Chatterjee, N.; Wang, Y.; Albanes, D.; Gelmann, E. P.; Friesen, M. D.; Riboli, E.; Hayes, R.B. Serum Lycopene, Other Carotenoids, and Prostate Cancer Risk: a Nested Case-Control Study in the Prostate, Lung, Colorectal, and Ovarian Cancer Screening Trial. Cancer Epidemiol. Biomark. Prev. 2007, 16, 962. [Google Scholar]
- Rasulev, B.F.; Abdullaev, N.D.; Syrov, V.N.; Leszczynski, J.A. Quantitative Structure-Activity Relationship (QSAR) Study of the Antioxidant Activity of Flavonoids. QSAR Comb Sci. 2005, 24, 1056–1065. [Google Scholar]
- Amic, D.; Davidovic-Amic, D.; Beslo, D.; Rastija, V.; Lucic, B.; Trinajstic, N. SAR and QSAR of the Antioxidant Activity of Flavonoids. Curr. Med. Chem. 2007, 14, 827–845. [Google Scholar] [CrossRef] [PubMed]
- Kim, J.; Wu, D.; Hwang, D.J.; Miller, D.D.; Dalton, J.T. The para substituent of S-3-(phenoxy)-2-hydroxy-2-methyl-N-(4-nitro-3-trifluoromethyl-phenyl)-propionamides is a major structural determinant of in vivo disposition and activity of selective androgen receptor modulators. J. Pharmacol Exp. Ther. 2005, 315, 230–239. [Google Scholar]
- Ribeiro, S.T.; Freire-de-Lima, L.; Previato, J.O.; Mendonça-Previato, L.; Heise, N.; Edilson Freire de Lima, M. Toxic effects of natural piperine and its derivatives on epimastigotes and amastigotes of Trypanosoma cruzi. Bioorg. Med. Chem. Lett. 2004, 14, 3555–3558. [Google Scholar]
- Anto, R.J.; Sukumaran, K.; Kuttan, G.; Rao, M.N.A.; Subbaraju, V.; Kuttan, R. Anticancer and antioxidant activity of synthetic chalcones and related compounds. Cancer Lett. 1995, 97, 33–37. [Google Scholar] [CrossRef] [PubMed]
- Anto, R.J.; Kuttan, G.; Dinesh Babu, K.V.; Rajasekharan, K.N.; Kuttan, R. Anti-tumour and free radical scavenging activity of synthetic curcuminoids. Int. J. Pharm. 1996, 131, 1–7. [Google Scholar] [CrossRef]
- Iverson, F. Phenolic antioxidants: Health Protection Branch studies on butylated hydroxyanisole. Cancer Lett. 1995, 93, 49–54. [Google Scholar]
- Teall, M.; Harrison, T.; Moseley, J.D.; Owens, A.P.; Sadowski, S.; Cascieri, M.A. Linear amides as substance P antagonists. Bioorg. Med. Chem. Lett. 1996, 6, 1585–1588. [Google Scholar]
- Ajaiyeoba, E.O.; Abiodun, O.O.; Falade, M.O.; Ogbole, N.O.; Ashidi, J.S.; Happi, C.T. In vitro cytotoxicity studies of 20 plants used in Nigerian antimalarial ethnomedicine. Phytomed. 2006, 13, 295–298. [Google Scholar] [CrossRef]
- Santos Pimenta, L.P.; Pinto, G.B.; Takahashi, L.G.F.; e Silva; Boaventura, M.A.D. Biological screening of Annonaceous Brazilian Medicinal Plants using Artemia salina (Brine Shrimp Test). Phytomedicine 2003, 10, 209–212. [Google Scholar]
- Kapadia, G.J.; Azuine, M.A.; Tokuda, H.; Takasaki, M.; Mukainaka, T.; Konoshima, T.; Nishino, H. Chemopreventive effect of resveratrol, sesamol, sesame oil and sunflower oil in the Epstein-Barr virus early antigen activation assay and the mouse skin two-stage carcinogenesis. Pharm. Res. 2002, 45, 499–505. [Google Scholar]
- Mongelli, E.; Desmarchelier, C.; Giulietti, A.; Coussio, J.; Ciccia, G. Bioactivity of certain medicinal latexes used by the Ese'ejas. J. Ethnopharm. 1995, 47, 159–163. [Google Scholar] [CrossRef]
- Badawey, E-SAM.; Kappe, T. Potential antineoplastics. Synthesis and cytotoxicity of certain 4-chloro-3-(2-chloroethyl)-2-methylquinolines and related derivatives. Eur. J. Med. Chem. 1997, 32, 815–822. [Google Scholar]
- Nick, A.; Rali, T.; Sticher, O. Biological screening of traditional medicinal plants from Papua New Guinea. J. Ethnopharm. 1995, 49, 147–156. [Google Scholar] [CrossRef]
- Wanyoike, G.N.; Chhabra, S.C.; Lang’at-Thoruwa, C.C.; Omar, S.A. Brine shrimp toxicity and antiplasmodial activity of five Kenyan medicinal plants. J. Ethnopharm. 2004, 90, 129–133. [Google Scholar] [CrossRef]
- McLaughlin, J.L.; Rogers, L.L.; Anderson, J.E. The Use of Biological Assays to Evaluate Botanicals. Drug Information Journal. 1998, 2, 513–524. [Google Scholar]
- Miller, J.N.; Sampson, J.; Candeias, L.P.; Bramley, P.M.; Rice-Evans, C.A. Antioxidant activities of carotenes and xantophylls. FEBS Lett. 1996, 384, 240–242. [Google Scholar] [CrossRef] [PubMed]
- Miller, J.N.; Rice-Evans, C.A. Factors influencing the antioxidant activity determined by the ABTS+ radical cation assay. Free Rad. Res. 1997, 26, 195–199. [Google Scholar] [CrossRef]
- Miller, J.N.; Rice-Evans, C.A.; Davies, M.J.; Gopinathan, V.; Milner, A. A novel method for measuring antioxidant capacity and its application to monitoring the antioxidant status in premature neonates. Clin. Sci. 1993, 4, 407–412. [Google Scholar]
- Hempel, S.L.; Buettner, G.R.; O’Malley, Y.Q.; Wessel, D.A.; Flaherty, D.M. Fluorescein diacetate is superior for detecting intracellular oxidants: comparison to 2'7' dichlorodihydro-fluorescein diacetate, 5(and 6)-carboxy-2'7'-dichlorodihydrofluorescein diacetate and dihydro-rhodamine 123. Free Radic. Biol. Med. 1999, 27, 146–159. [Google Scholar] [CrossRef] [PubMed]
- Crow, J.P. Dichlorodihydrofluorescein and dihydrorhodamine 123 are sensitive indicators of peroxynitrite in vitro: implications for intracellular measurement of reactive nitrogen and oxygen species. Nitric Oxide 1997, 1, 145–157. [Google Scholar] [CrossRef] [PubMed]
- Mosmann, T.R. Rapid colorimetric assay for cellular growth and survival: application to proliferation and cytotoxicity assay. J. Immunol. Meth. 1983, 65, 55–63. [Google Scholar]
- Green, L.M.; Reade, J.L.; Ware, C.F.R. Rapid colormetric assay for cell viability: Application to the quantitation of cytotoxic and growth inhibitory lymphokines. J. Immunol. Meth. 1984, 70, 257–268. [Google Scholar] [CrossRef]
- Opipari, A.W., jr.; Hu, H.M.; Yabkowitz, R.; Dixit, V.M. The A20 zinc finger protein protects cells from tumor necrosis factor cytotoxicity. J. Biol Chem. 1992, 267, 12424–12427. [Google Scholar] [PubMed]
- Meyer, B.N.; Ferrigni, N.R.; Putnam, J.E.; Jacobsen, L.B.; Nichols, D.E.; McLaughlin, J.L. Brine shrimp: A convenient general bioassay for active plant constituents. Planta Med. 1982, 45, 31–34. [Google Scholar] [CrossRef] [PubMed]
- Finney, D.J. Probit Analysis; Cambridge University Press: Cambridge, U.K., 1971. [Google Scholar]
- Accelrys. Materials Studio 4.0, Accelrys, Inc.: San Diego, CA, USA, www.accelrys.com.
- Perdew, J.P.; Wang, Y. Pair-distribution function and its coupling-constant average for the spin-polarized electron gas. Phys. Rev. B. 1992, 45, 13244. [Google Scholar]
- Friedman, J. H. Multivariate adaptive regression splines. Anal. Stat. 1991, 19, 1–141. [Google Scholar] [CrossRef]
- Sample availability: Contact the authors.
© 2008 by MDPI (http://www.mdpi.org). Reproduction is permitted for noncommercial purposes.
Share and Cite
Urbani, P.; Ramunno, A.; Filosa, R.; Pinto, A.; Popolo, A.; Bianchino, E.; Piotto, S.; Saturnino, C.; De Prisco, R.; Nicolaus, B.; et al. Antioxidant Activity of Diphenylpropionamide Derivatives: Synthesis, Biological Evaluation and Computational Analysis. Molecules 2008, 13, 749-761. https://doi.org/10.3390/molecules13040749
Urbani P, Ramunno A, Filosa R, Pinto A, Popolo A, Bianchino E, Piotto S, Saturnino C, De Prisco R, Nicolaus B, et al. Antioxidant Activity of Diphenylpropionamide Derivatives: Synthesis, Biological Evaluation and Computational Analysis. Molecules. 2008; 13(4):749-761. https://doi.org/10.3390/molecules13040749
Chicago/Turabian StyleUrbani, Paolo, Anna Ramunno, Rosanna Filosa, Aldo Pinto, Ada Popolo, Erminia Bianchino, Stefano Piotto, Carmela Saturnino, Rocco De Prisco, Barbara Nicolaus, and et al. 2008. "Antioxidant Activity of Diphenylpropionamide Derivatives: Synthesis, Biological Evaluation and Computational Analysis" Molecules 13, no. 4: 749-761. https://doi.org/10.3390/molecules13040749
APA StyleUrbani, P., Ramunno, A., Filosa, R., Pinto, A., Popolo, A., Bianchino, E., Piotto, S., Saturnino, C., De Prisco, R., Nicolaus, B., & Tommonaro, G. (2008). Antioxidant Activity of Diphenylpropionamide Derivatives: Synthesis, Biological Evaluation and Computational Analysis. Molecules, 13(4), 749-761. https://doi.org/10.3390/molecules13040749