CoMFA, CoMSIA and Eigenvalue Analysis on Dibenzodioxepinone and Dibenzodioxocinone Derivatives as Cholesteryl Ester Transfer Protein Inhibitors

Abstract
:Introduction

Results and Discussion
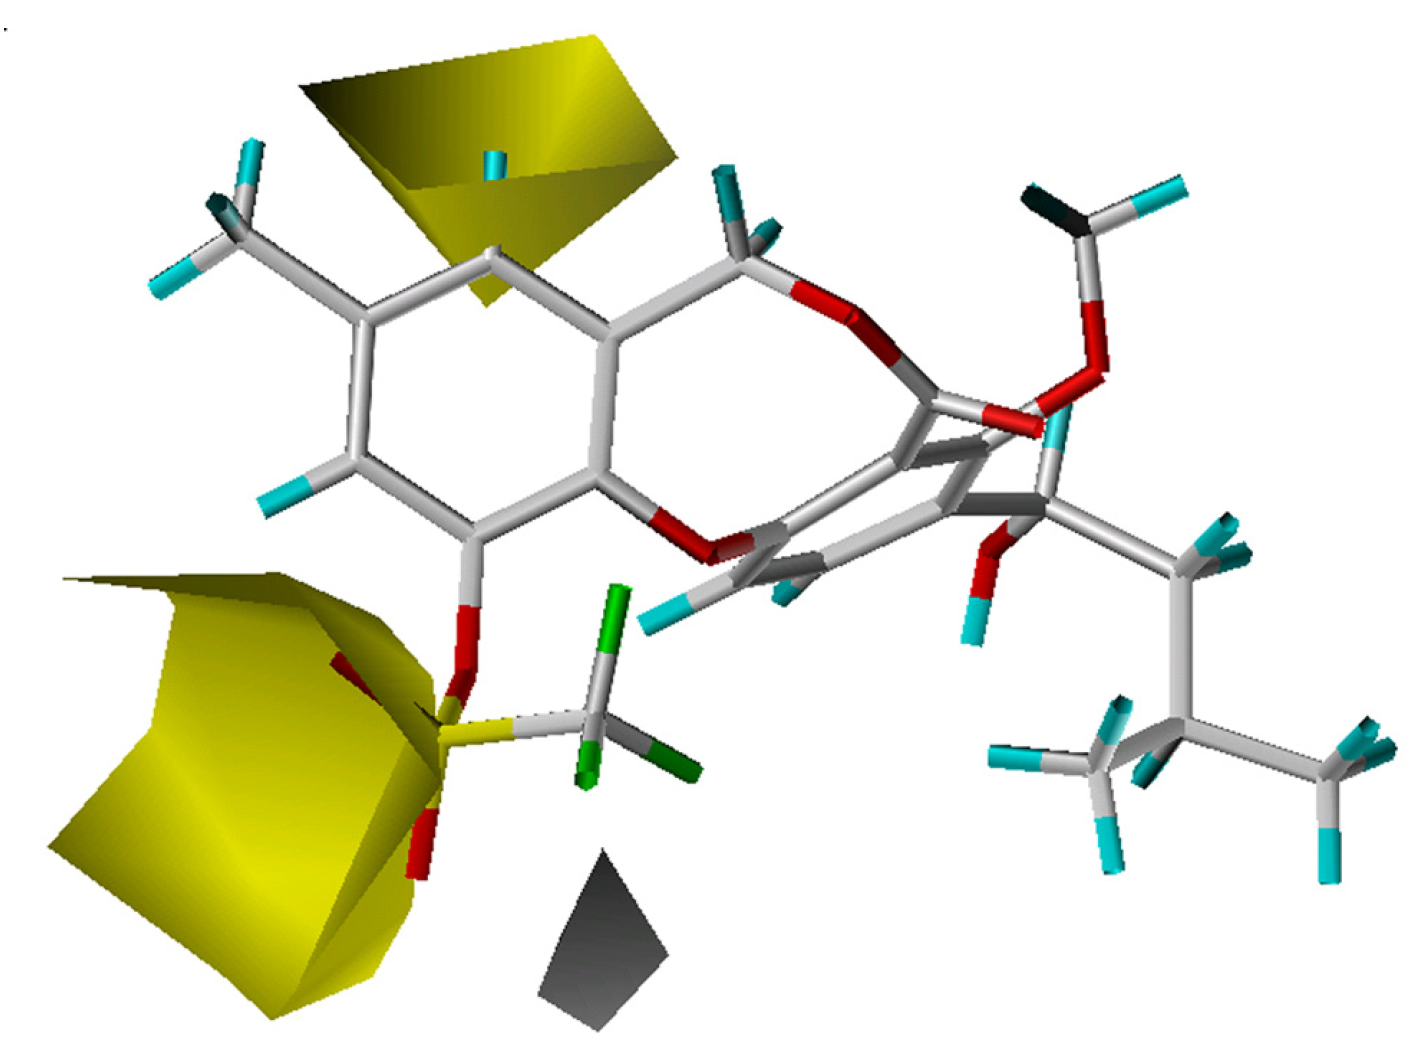
CoMFA results
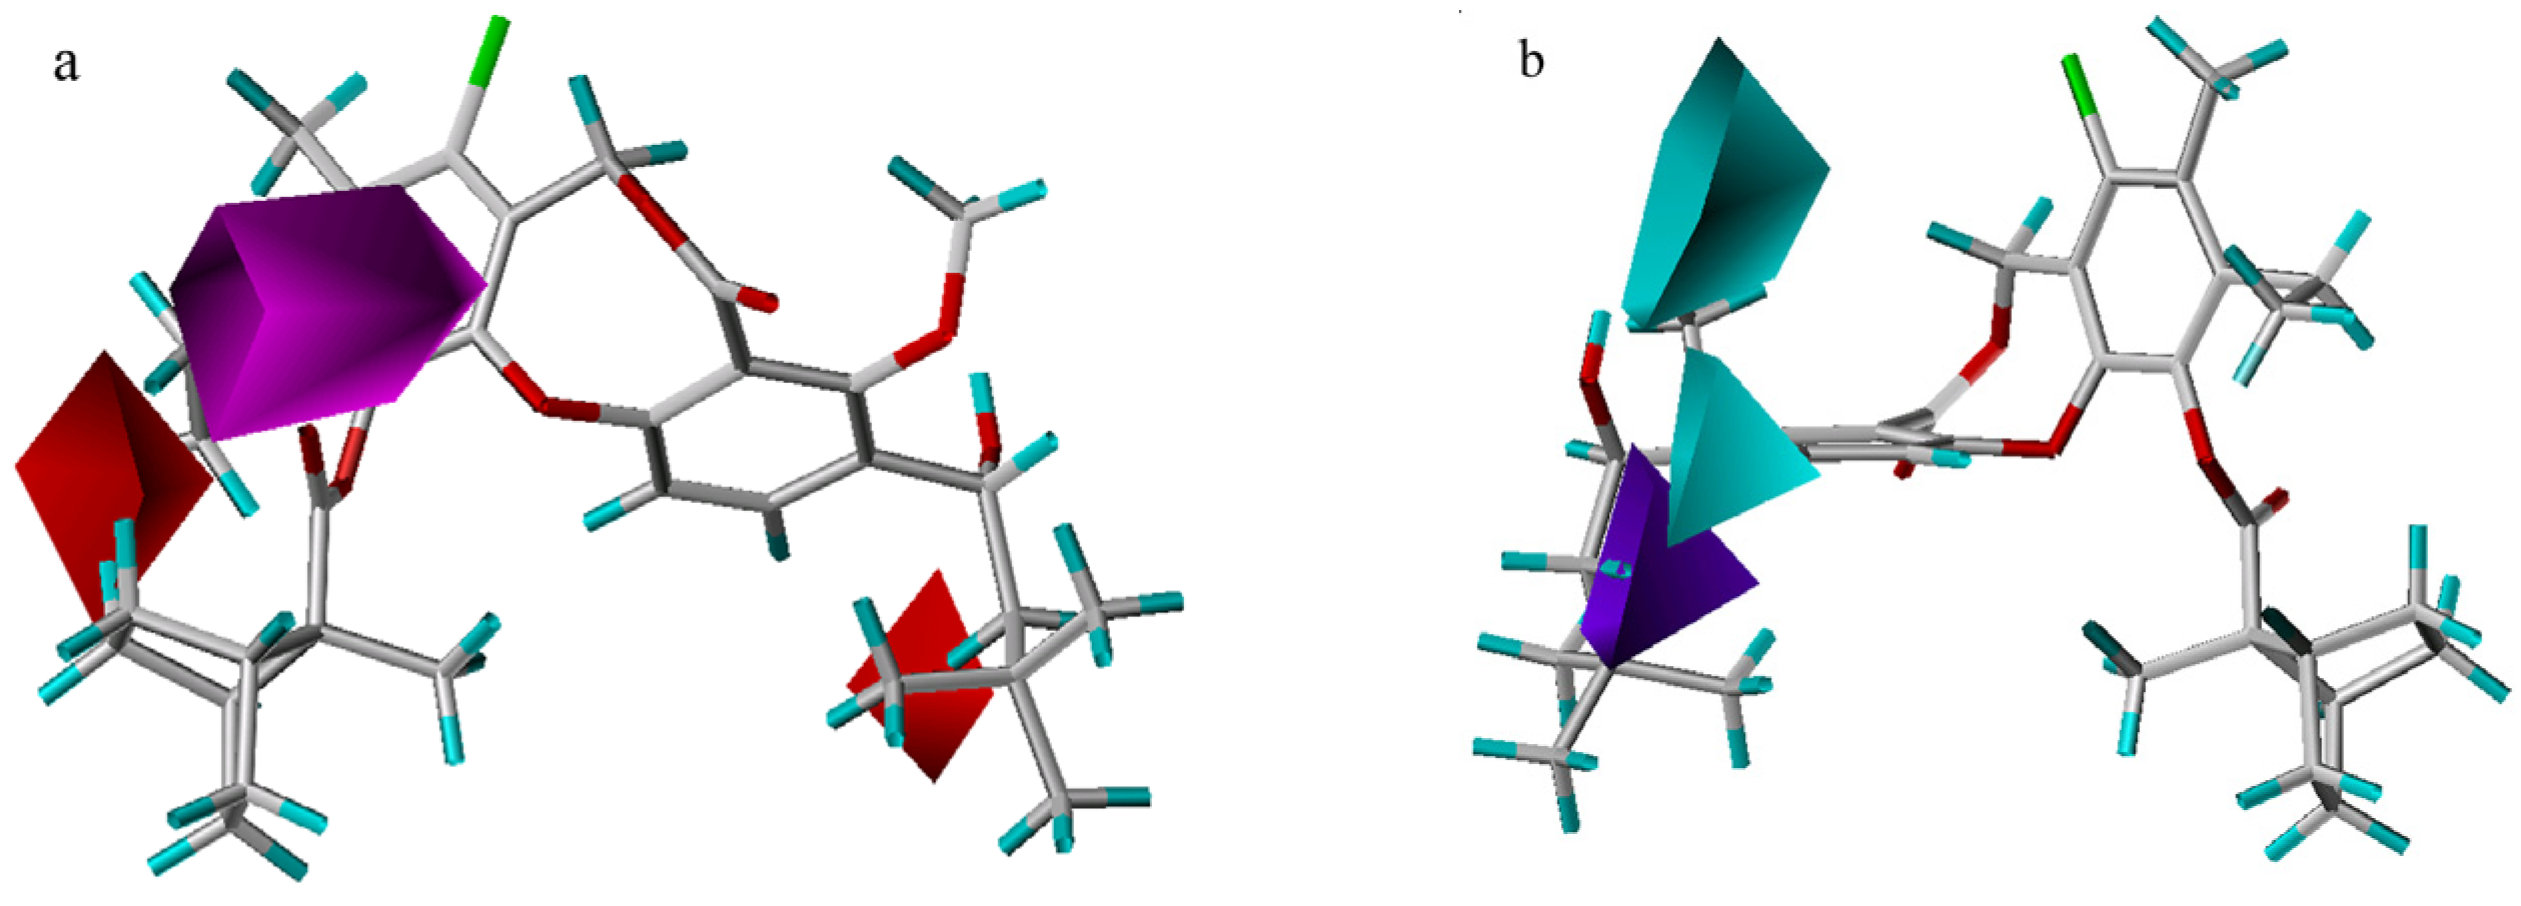
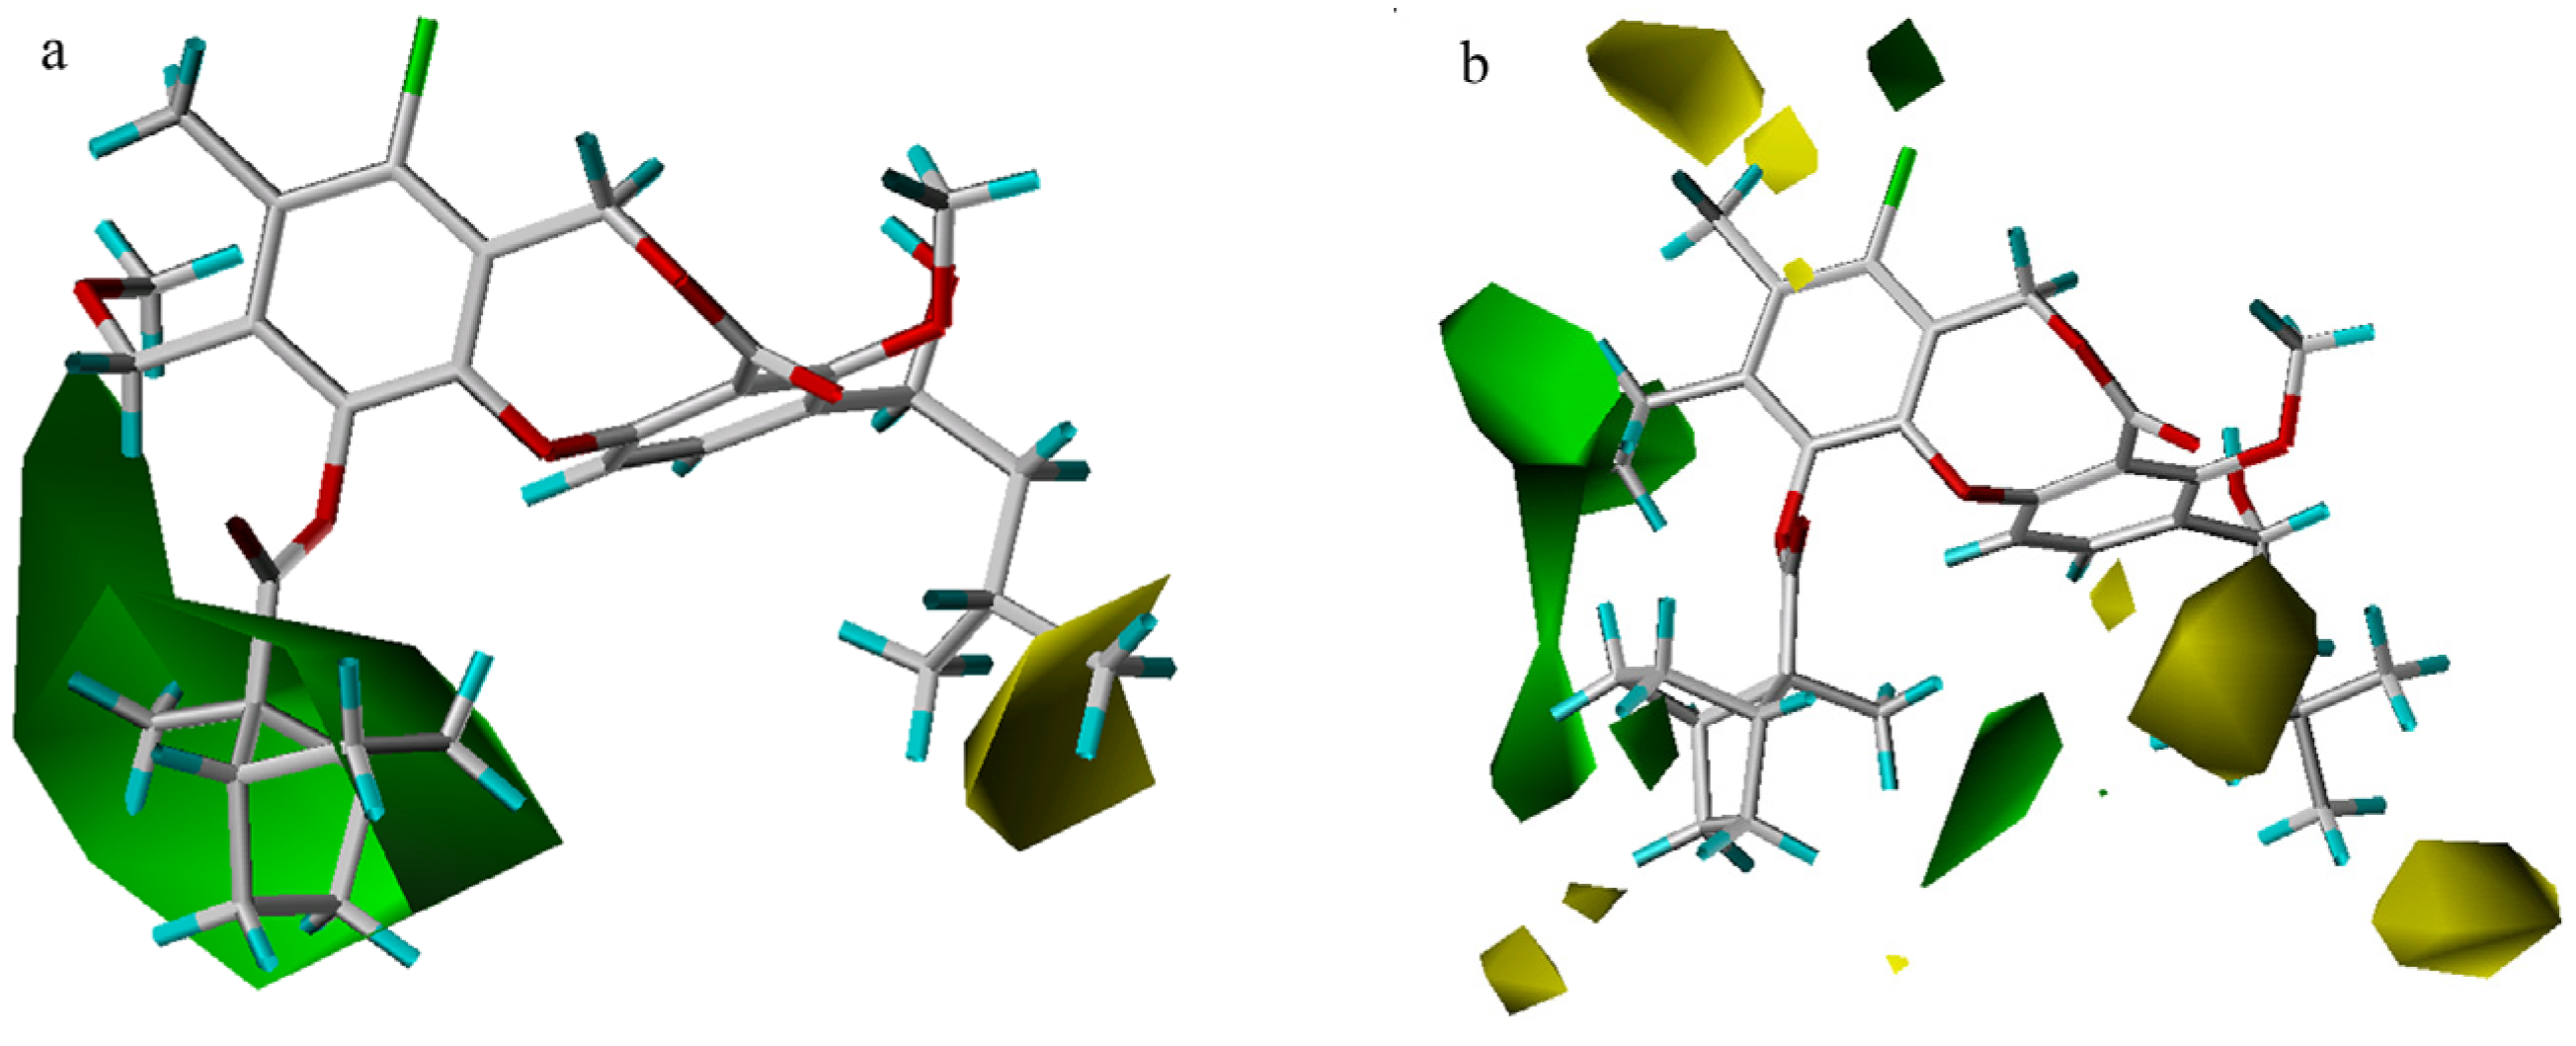
CoMSIA results
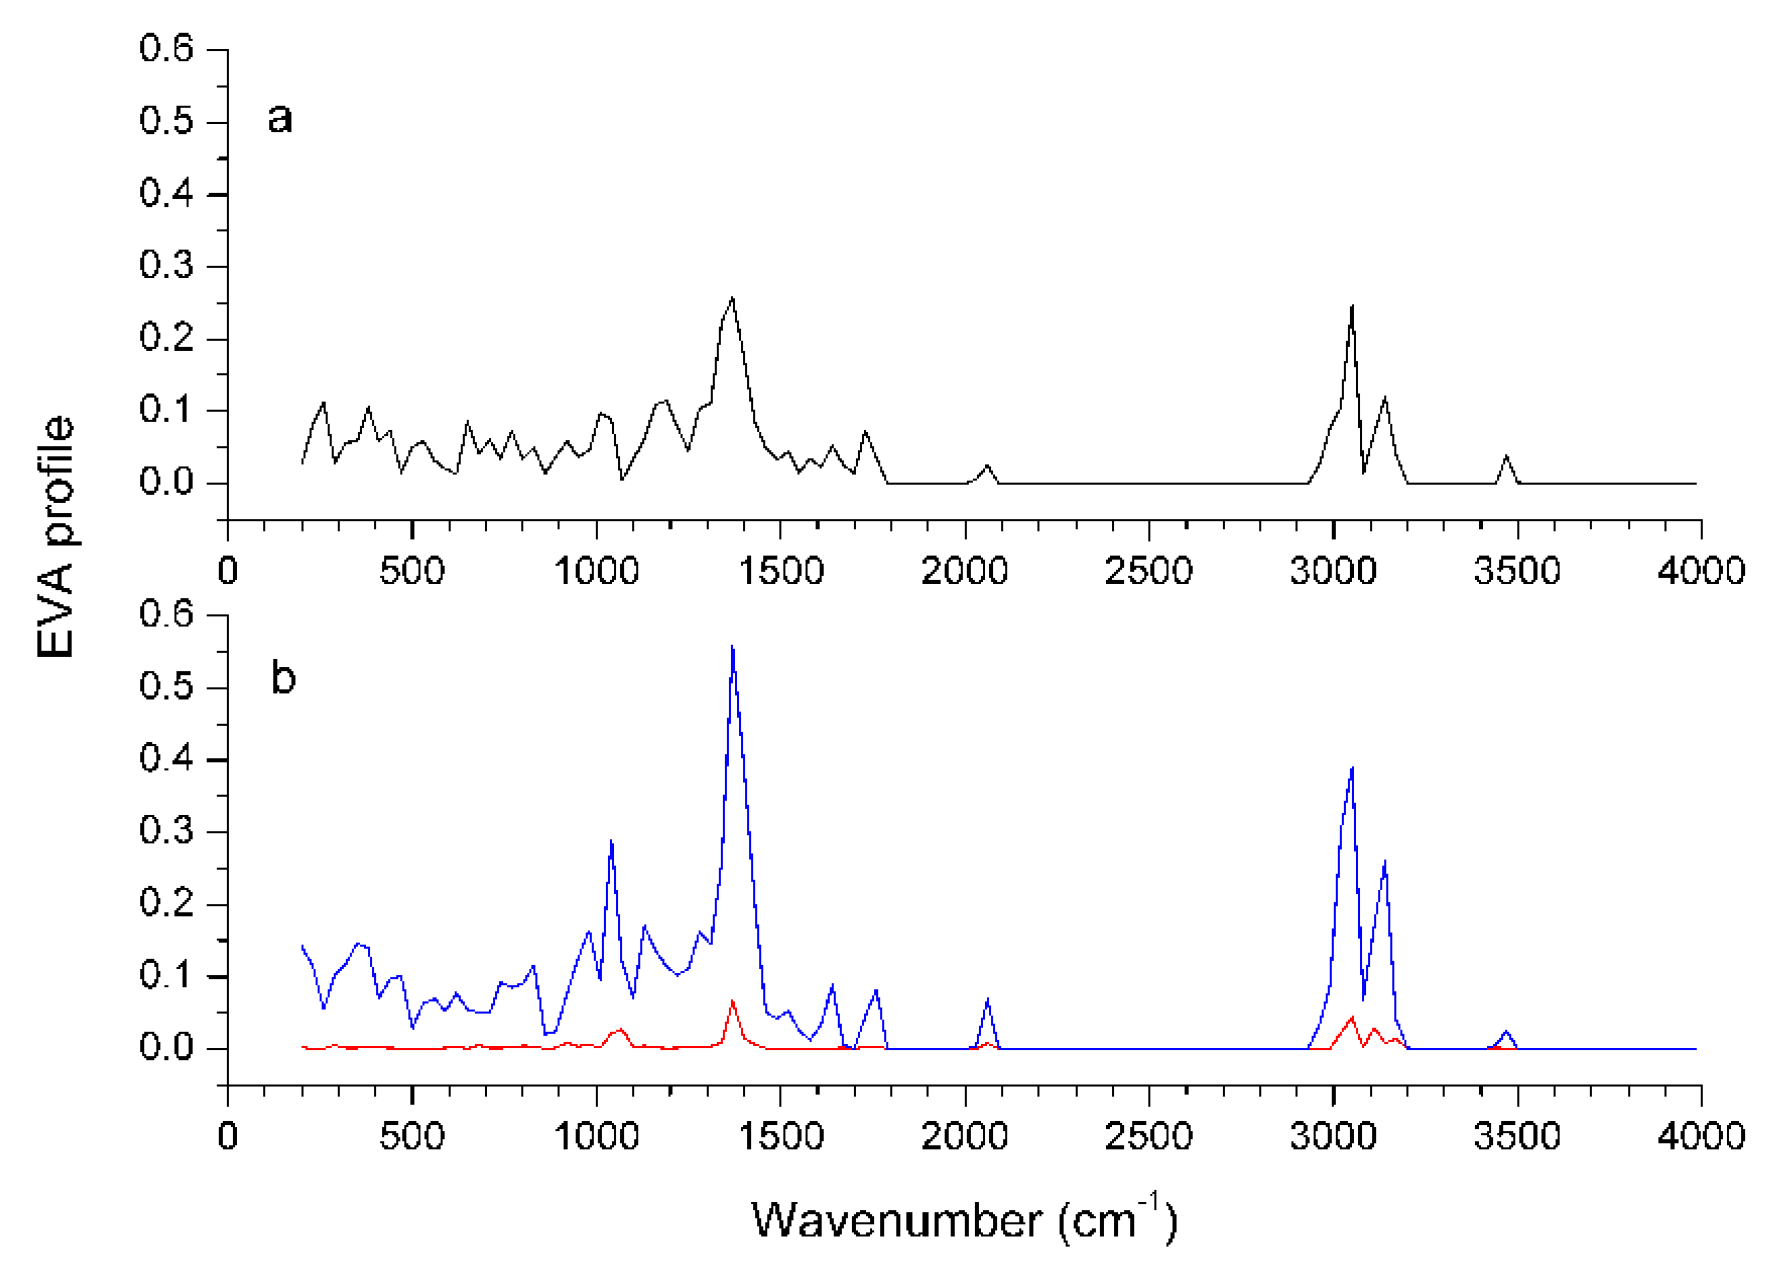
EVA results

| CoMFA | CoMSIA | EVA | |
|---|---|---|---|
| Components | 3 | 3 | 2 |
| q2 | 0.724 | 0.740 | 0.754 |
| Conventional r2 | 0.922 | 0.842 | 0.834 |
| Standard error of estimate | 0.254 | 0.361 | 0.367 |
| F values | 225.181 | 101.238 | 146.138 |
| Bootstrapping | |||
| r2bootstrapping | 0.922±0.019 | 0.845±0.031 | 0.857±0.028 |
| Standard error of estimate bootstrapping | 0.240±0.113 | 0.338±0.143 | 0.322±0.137 |
| Progress scrambling | |||
| Q2 | 0.493 | 0.597 | 0.639 |
| cSDEP | 0.646 | 0.576 | 0.540 |
| dq2′/dr2yy′ | 0.924 | 1.042 | 0.952 |
| Predictive r2 | 0.823 | 0.782 | 0.571 |
| Fraction | |||
| Steric | 0.594 | 0.204 | |
| Electrostatic | 0.406 | 0.166 | |
| Hydrophobic | 0.303 | ||
| Hydrogen bond donor | 0.139 | ||
| Hydrogen bond acceptor | 0.187 |

Validation of models
| Compd | Obsd pIC50 | CoMFA | CoMSIA | EVA | |||
|---|---|---|---|---|---|---|---|
| predicted | residual | predicted | residual | predicted | residual | ||
| E3 | 6.00 | 5.64 | 0.36 | 5.45 | 0.55 | 5.45 | 0.55 |
| E8 | 5.30 | 5.23 | 0.07 | 5.09 | 0.21 | 5.17 | 0.13 |
| E12 | 5.22 | 5.66 | -0.44 | 5.25 | -0.03 | 5.62 | -0.40 |
| E22 | 6.15 | 5.87 | 0.28 | 5.78 | 0.37 | 5.67 | 0.48 |
| E23 | 6.70 | 6.44 | 0.26 | 6.61 | 0.09 | 6.12 | 0.58 |
| E27 | 5.70 | 6.05 | -0.35 | 6.39 | -0.69 | 6.02 | -0.32 |
| E32 | 6.00 | 5.86 | 0.14 | 6.29 | -0.29 | 5.78 | 0.22 |
| E39 | 7.22 | 6.82 | 0.40 | 7.34 | -0.12 | 7.10 | 0.12 |
| E40 | 7.00 | 6.72 | 0.28 | 7.25 | -0.25 | 6.40 | 0.60 |
| E49 | 7.22 | 7.49 | -0.27 | 7.44 | -0.22 | 7.86 | -0.64 |
| E70 | 6.10 | 6.15 | -0.05 | 6.03 | 0.07 | 5.79 | 0.31 |
| E73 | 6.70 | 6.44 | 0.26 | 6.69 | 0.01 | 6.18 | 0.52 |
| E74 | 6.70 | 6.75 | -0.05 | 6.91 | -0.21 | 6.93 | -0.23 |
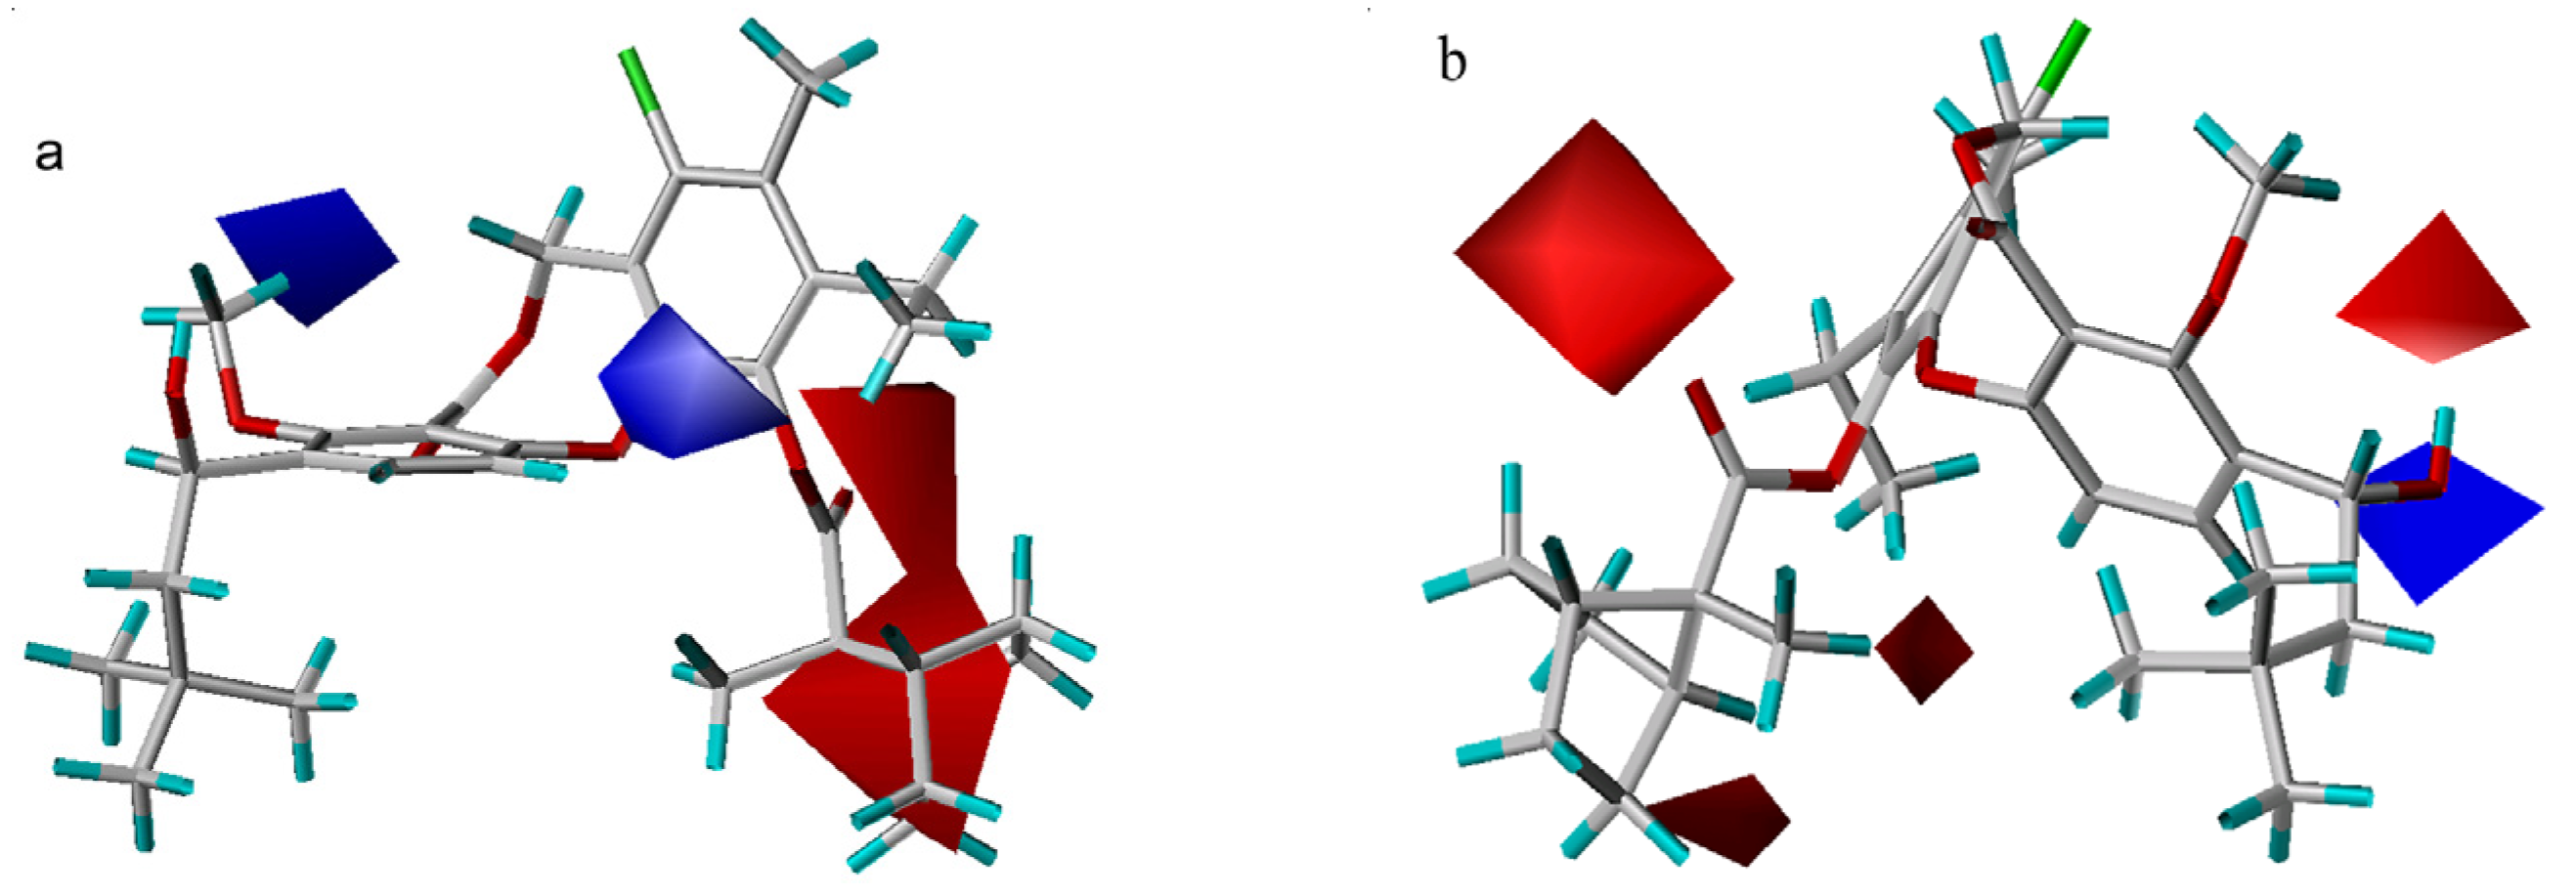
3D-QSAR contour analysis


Graphical interpretation of EVA Results

Conclusions
Experimental
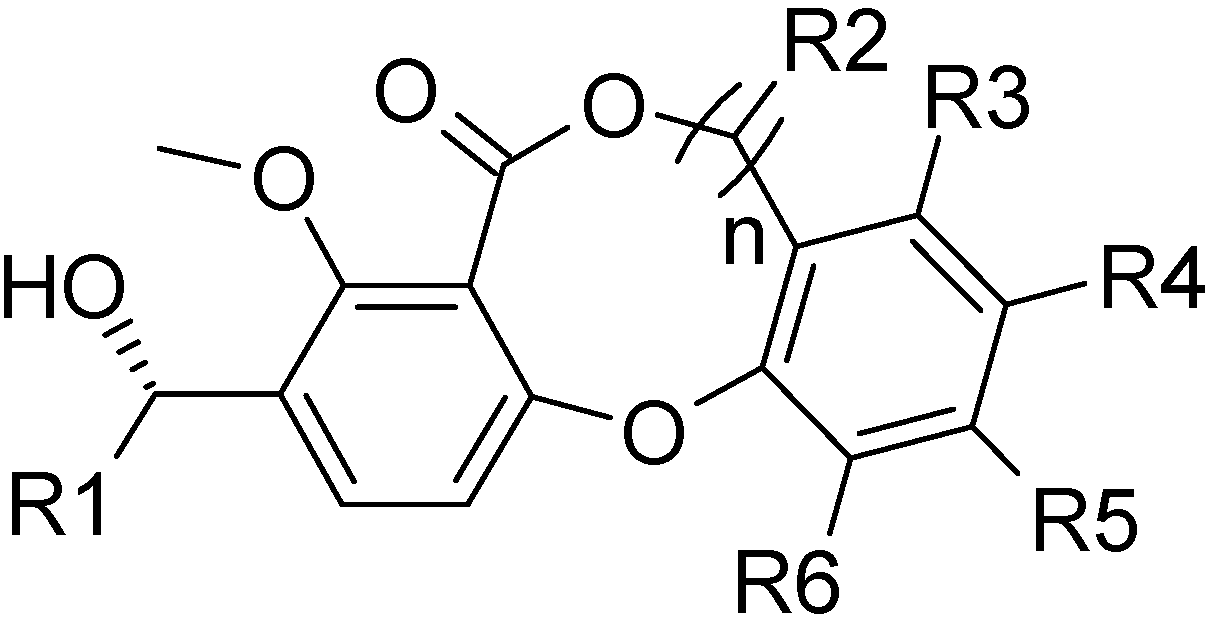
Data sets for analysis
| Compd | R1 | n | R2 | R3 | R4 | R4 | R6 | pIC50 |
|---|---|---|---|---|---|---|---|---|
| 1 | CH2CH(CH3)2 | 0 | – | H | CH3 | H |  | 6.10 |
| 2 | CH2CH(CH3)2 | 0 | – | H | CH3 | H |  | 6.05 |
| 3a | CH2CH(CH3)2 | 0 | – | H | CH3 | H |  | 6.00 |
| 4 | CH2CH(CH3)2 | 0 | – | CH=CH2 | CH3 | H | OMe | 6.00 |
| 5 | CH2CH(CH3)2 | 0 | – | H | CH3 | H |  | 5.70 |
| 6 | CH2CH(CH3)2 | 0 | – | H | CH3 | H |  | 5.52 |
| 7 | CH2CH(CH3)2 | 0 | – | H | CH3 | H |  | 5.40 |
| 8a | CH2CH(CH3)2 | 0 | – | H | CH3 | H |  | 5.30 |
| 9 | CH2CH(CH3)2 | 0 | – | H | CH3 | H |  | 5.30 |
| 10 | CH2CH(CH3)2 | 0 | – | H | CH3 | H |  | 5.22 |
| 11 | CH2CH(CH3)2 | 0 | – | H | CH3 | H |  | 5.22 |
| 12a | CH2CH(CH3)2 | 0 | – | H | CH3 | H |  | 5.22 |
| 13 | CH2CH(CH3)2 | 0 | – | H | CH3 | H |  | 5.22 |
| 14 | CH2CH(CH3)2 | 0 | – | H | CH3 | H |  | 5.10 |
| 15 | CH2CH(CH3)2 | 0 | – | H | CH3 | H |  | 4.92 |
| 16 | CH2CH(CH3)2 | 0 | – | H | CH3 | H |  | 4.89 |
| 17 | CH2CH(CH3)2 | 0 | – | H | CH3 | H |  | 4.80 |
| 18 | CH2CH(CH3)2 | 0 | – | H | CH3 | H |  | 4.74 |
| 19 | CH2CH(CH3)2 | 0 | – | Br | CH3 | Br | OMe | 4.70 |
| 20 | CH2CH(CH3)2 | 1 | H | H | CH3 | H |  | 6.6 |
| 21 | CH2CH(CH3)2 | 1 | H | CH3 | CH3 | CH3 |  | 6.7 |
| 22a | CH2CH(CH3)2 | 1 | H | H | CH3 | H | (CH3)2CHSO2O | 6.15 |
| 23a | CH2CH(CH3)2 | 1 | H | Cl | CH3 | Cl |  | 6.70 |
| 24 | CH2C(CH3)3 | 1 | H | H | CH3 | H |  | 5.82 |
| 25 | CH2CH(CH3)2 | 1 | H | H | CH3 | H |  | 5.70 |
| 26 | CH2CH(CH3)2 | 1 | H | F | CH3 | H |  | 6.30 |
| 27a | CH2CH(CH3)2 | 1 | H | H | CH3 | H |  | 5.70 |
| 28 | CH2CH(CH3)2 | 1 | H | CN | CH3 | H |  | 5.52 |
| 29 | CH2CH(CH3)2 | 1 | CH3 | H | CH3 | H |  | 5.30 |
| 30 | CH2CH(CH3)2 | 1 | H | Br | CH3 | Br |  | 6.00 |
| 31 | CH2CH(CH3)2 | 1 | H | H | CH3 | H |  | 5.82 |
| 32a | CH2CH(CH3)2 | 1 | H | H | CH3 | H |  | 6.00 |
| 33 | CH2CH(CH3)2 | 1 | H | H | CH3 | H |  | 6.15 |
| 34 | CH2CH(CH3)2 | 1 | H | Cl | CH3 | H |  | 6.52 |
| 35 | CH2CH(CH3)2 | 1 | H | Cl | CH3 | Br |  | 7.15 |
| 36 | CH2CH(CH3)2 | 1 | H | Cl | CH3 | Br |  | 6.60 |
| 37 | CH2CH(CH3)2 | 1 | H | Br | CH3 | Br |  | 7.00 |
| 38 | CH2CH(CH3)2 | 1 | H | CH3 | CH3 | CH3 |  | 6.82 |
| 39a | CH2CH(CH3)2 | 1 | H | Cl | CH3 | Cl |  | 7.22 |
| 40a | CH2CH(CH3)2 | 1 | H | Cl | CH3 | Cl |  | 7.00 |
| 41 | CH2CH(CH3)2 | 1 | H | H | CH3 | H |  | 6.70 |
| 42 | CH2CH(CH3)2 | 1 | H | Cl | CH3 | Cl |  | 6.52 |
| 43 | CH2CH(CH3)2 | 1 | H | H | CF2H | H |  | 5.30 |
| 44 | CH2CH(CH3)2 | 1 | H | Br | CH3 | Cl |  | 7.15 |
| 45 | CH2CH(CH3)2 | 1 | H | H | CH3 | Cl |  | 7.12 |
| 46 | CH2CH(CH3)2 | 1 | H | Cl | CH3 | Br |  | 7.22 |
| 47 | CH2CH(CH3)2 | 1 | H | Cl | CH3 | CH3 |  | 7.30 |
| 48 | CH2CH(CH3)2 | 1 | H | Cl | CH3 |  |  | 7.24 |
| 49a | CH2C(CH3)3 | 1 | H | Cl | CH3 |  |  | 7.22 |
| 50 | CH2C(CH3)3 | 1 | H | Cl | CH3 | Br |  | 7.49 |
| 51 | CH2CH(CH3)2 | 1 | H | Cl | CH3 | CH2OCH3 |  | 7.30 |
| 52 | CH2CH(CH3)2 | 1 | H | Cl | CH3 | Br |  | 7.05 |
| 53 | CH2C(CH3)3 | 1 | H | Cl | CH3 | CH2OCH3 |  | 7.40 |
| 54 | CH2CH(CH3)2 | 1 | H | Cl | CH3 | CH3 |  | 7.52 |
| 55 | CH2C(CH3)3 | 1 | H | Cl | CH3 | CH2CH3 |  | 7.82 |
| 56 | CH2CH(CH3)2 | 1 | H | CH3 | CH3 | CH3 |  | 7.22 |
| 57 | CH2CH(CH3)2 | 1 | H | H | CH3 | CH2CH3 |  | 7.40 |
| 58 | CH2CH(CH3)2 | 1 | H | Cl | CH3 | CH2CH3 |  | 7.24 |
| 59 | CH2CH(CH3)2 | 1 | CH3 | H | CH3 | H |  | 7.00 |
| 60 | CH2CH(CH3)2 | 1 | H | F | CH3 | CH3 |  | 7.26 |
| 61 | CH2CH(CH3)2 | 1 | H | H | CH3 | H |  | 4.89 |
| 62 | CH2CH(CH3)2 | 1 | H | H | CH3 | H |  | 5.82 |
| 63 | CH2CH(CH3)2 | 1 | H | H | CH3 | H | CF3SO2O | 5.00 |
| 64 | CH2CH(CH3)2 | 1 | H | H | CH3 | H | CH3(CH2)4SO2O | 5.40 |
| 65 | CH2CH(CH3)2 | 1 | H | H | CH3 | H |  | 5.22 |
| 66 | CH2CH(CH3)2 | 1 | H | H | CH3 | H |  | 5.52 |
| 67 | CH2CH(CH3)2 | 1 | H | H | CH3 | H |  | 6.10 |
| 68 | CH2CH(CH3)2 | 1 | H | H | CH3 | H |  | 6.15 |
| 69 | CH2CH(CH3)2 | 1 | H | H | CH3 | H |  | 6.40 |
| 70a | CH2CH(CH3)2 | 1 | H | H | CH3 | H |  | 6.10 |
| 71 | CH2CH(CH3)2 | 1 | H | H | CH3 | H |  | 6.22 |
| 72 | CH2CH(CH3)2 | 1 | H | H | CH3 | H |  | 6.70 |
| 73a | CH2CH(CH3)2 | 1 | H | H | CH3 | H |  | 6.70 |
| 74a | CH2CH(CH3)2 | 1 | H | H | CH3 | H |  | 6.70 |
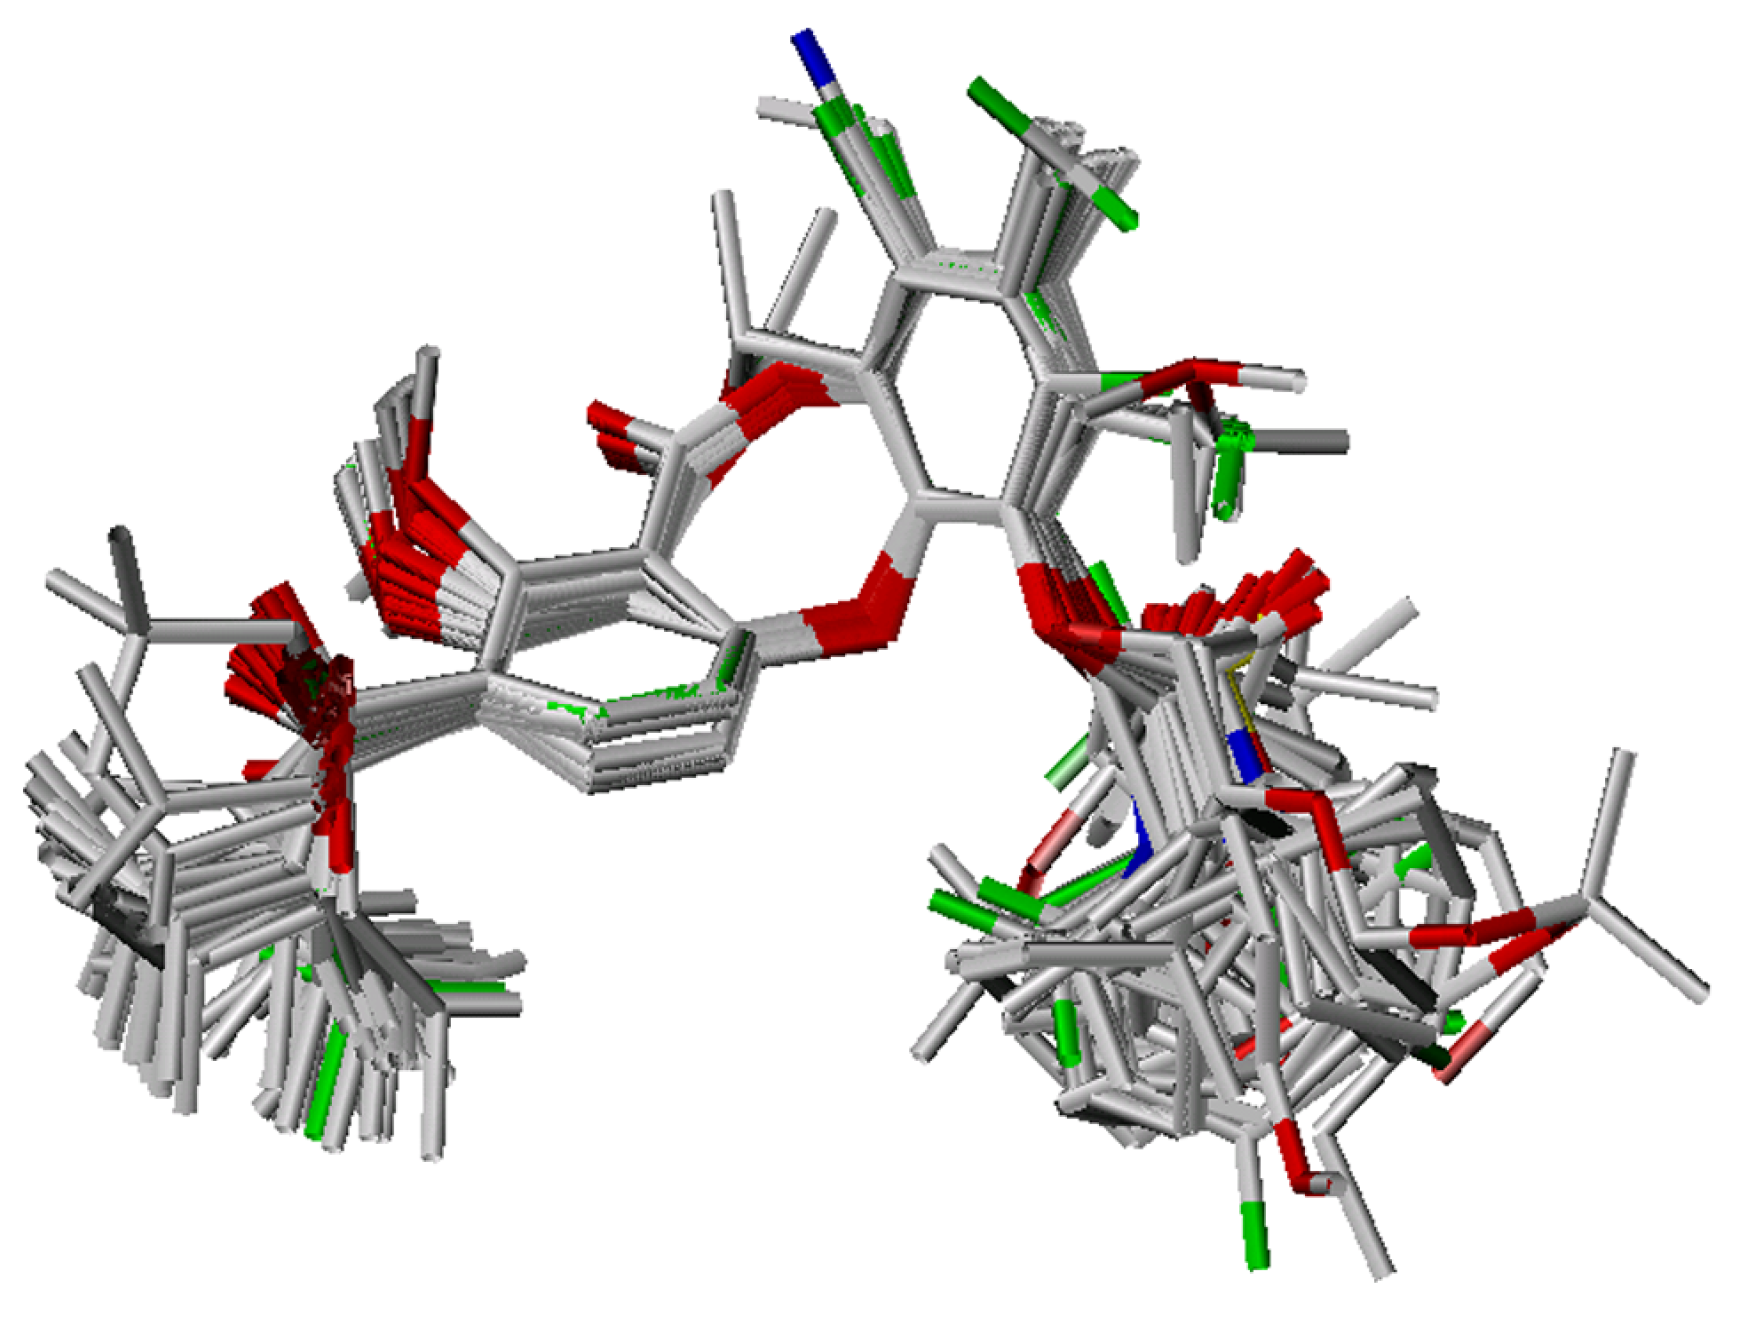
Conformational analysis and alignment

CoMFA study
CoMSIA study
EVA study

PLS analysis and validation
Acknowledgements
Supplementary data
References
- Wolfe, M.L.; Rader, D.J. Cholesteryl Ester Transfer Protein and Coronary Artery Disease: An Observation with Therapeutic Implications. Circulation 2004, 110, 1338–1340. [Google Scholar] [CrossRef]
- Barter, P.J.; Brewer, H.B., Jr.; Chapman, M.J.; Hennekens, C.H.; Rader, D.J.; Tall, A.R. Cholesteryl Ester Transfer Protein: A Novel Target for Raising HDL and Inhibiting Atherosclerosis. Arterioscler. Thromb. Vasc. Biol. 2003, 23, 160–167. [Google Scholar] [CrossRef]
- Ruggeri, R.B. Cholesteryl Ester Transfer Protein: Pharmacological Inhibition for the Modulation of Plasma Cholesterol Levels and Promising Target for the Prevention of Atherosclerosis. Cur. Top. Med. Chem. 2005, 5, 257–264. [Google Scholar] [CrossRef]
- Cuchel, M.; Rader, D.J. Is the Cholesteryl Ester Transfer Protein Proatherogenic or Antiatherogenic in Humans? J. Am. Coll. Cardiol. 2007, 50, 1956–1958. [Google Scholar] [CrossRef]
- Parini, P.; Rudel, L.L. Is There a Need for Cholesteryl Ester Transfer Protein Inhibition? Arterioscler. Thromb. Vasc. Biol. 2003, 23, 374–375. [Google Scholar] [CrossRef]
- Eary, C.T.; Jones, Z. S.; Groneberg, R.D.; Burgess, L.E.; Mareska, D.A.; Drew, M.D.; Blake, J.F.; Laird, E.R.; Balachari, D.; O'Sullivan, M.; Allen, A.; Marsh, V. Tetrazole and ester substituted tetrahydoquinoxalines as potent cholesteryl ester transfer protein inhibitors. Bioorg. Med. Chem. Lett. 2007, 17, 2608–2613. [Google Scholar] [CrossRef]
- Brückner, D.; Hafner, F.-T.; Li, V.; Schmeck, C.; Telser, J.; Vakalopoulos, A.; Wirtz, G. Dibenzodioxocinones-A new class of CETP inhibitors. Bioorg. Med. Chem. Lett. 2005, 15, 3611–3614. [Google Scholar] [CrossRef]
- Brousseau, M.E.; Schaefer, E.J.; Wolfe, M.L.; Bloedon, L.T.; Digenio, A.G.; Clark, R.W.; Mancuso, J.P.; Rader, D.J. Effects of an Inhibitor of Cholesteryl Ester Transfer Protein on HDL Cholesterol. N. Engl. J. Med. 2004, 350, 1505–1515. [Google Scholar] [CrossRef]
- Reinhard, E.J.; Wang, J.L.; Durley, R.C.; Fobian, Y.M.; Grapperhaus, M.L.; Hickory, B.S.; Massa, M.A.; Norton, M.B.; Promo, M.A.; Tollefson, M.B.; Vernier, W.F.; Connolly, D.T.; Witherbee, B.J.; Melton, M.A.; Regina, K.J.; Smith, M.E.; Sikorski, J.A. Discovery of a Simple Picomolar Inhibitor of Cholesteryl Ester Transfer Protein. J. Med. Chem. 2003, 46, 2152–2168. [Google Scholar] [CrossRef]
- Okamoto, H.; Fumlhiko, Y.; Korekiyo, W.; Takashi, M. A cholesteryl ester transfer protein inhibitor attenuates atherosclerosis in rabbits. Nature 2000, 46, 203–206. [Google Scholar]
- Tomoda, H.; Matsushima, C.; Tabata, N.; Namatame, I.; Tanaka, H.; Bamberger, M.J.; Arai, H.; Fukazawa, M.; Inoue, K.; Omura, S. Structure-specific inhibition of cholesteryl ester transfer protein by azaphilones. J. Antibiot. 1999, 52, 160–170. [Google Scholar] [CrossRef]
- Krishna, R.; Anderson, M.S.; Bergman, A.J.; Jin, B.; Fallon, M.; Cote, J.; Rosko, K.; Chavez-Eng, C.; Lutz, R.; Bloomfield, D.M.; Gutierrez, M.; Doherty, J.; Bieberdorf, F.; Chodakewitz, J.; Gottesdiener, K.M.; Wagner, J.A. Effect of the cholesteryl ester transfer protein inhibitor, anacetrapib, on lipoproteins in patients with dyslipidaemia and on 24-h ambulatory blood pressure in healthy individuals: two double-blind, randomised placebo-controlled phase I studies. Lancet 2007, 370, 1907–1914. [Google Scholar] [CrossRef]
- Qiu, X.; Mistry, A.; Ammirati, M.J.; Chrunyk, B.A.; Clark, R.W.; Cong, Y.; Culp, J.S.; Danley, D.E.; Freeman, T.B.; Geoghegan, K.F.; Griffor, M.C.; Hawrylik, S.J.; Hayward, C.M.; Hensley, P.; Hoth, L.R.; Karam, G.A.; Lira, M.E.; Lloyd, D.B.; McGrath, K.M.; Stutzman-Engwall, K.J.; Subashi, A.K.; Subashi, T.A.; Thompson, J.F.; Wang, I.-K.; Zhao, H.; Seddon, A.P. Crystal structure of cholesteryl ester transfer protein reveals a long tunnel and four bound lipid molecules. Na. Struct. Mol. Biol. 2007, 14, 106–113. [Google Scholar] [CrossRef]
- Bayer HealthCare AG. Patent Appl. WO 2004039453; [Chem. Abstr. 2004, 140, 406830],
- Jain, A.N.; Koile, K.; Chapman, D. Compass: predicting biological activities from molecular surface properties, performance comparisons on a steroid benchmark. J. Med. Chem. 1994, 37, 2315–2327. [Google Scholar] [CrossRef]
- Bush, A.; Martin-Pastor, M. Structure and conformation of complex carbohydrate of glycoproteins, glycolipids, and bacterial polysaccharides C. Annu. Rev. Biophys. Biomol. Struct. 1999, 28, 269–293. [Google Scholar] [CrossRef]
- Cramer, R.D.; Patterson, D.E.; Bunce, J.D. Comparative molecular field analysis (CoMFA). 1. Effect of shape on binding of steroids to carrier proteins. J. Am. Chem. Soc. 1988, 110, 5959–5967. [Google Scholar] [CrossRef]
- Wang, R.X.; Gao, Y.; Liu, L.; Lai, L.H. All-orientation search and all-placement search in comparative molecular field analysis. J. Mol. Model. 1998, 4, 276–283. [Google Scholar] [CrossRef]
- Klebe, G.; Abraham, U.; Mietzner, T. Molecular Similarity Indices in a Comparative Analysis (CoMSIA) of Drug Molecules to Correlate and Predict their Biological Activity. J. Med. Chem. 1994, 37, 4130–4146. [Google Scholar] [CrossRef]
- Klebe, G.; Abraham, U. Comparative Molecular Similarity Index Analysis (CoMSIA) to Study Hydrogen Bonding Properties and to Score Combinatorial Libraries. J. Comput.-Aided Mol. Des. 1999, 13, 1–10. [Google Scholar] [CrossRef]
- Ferguson, A.M.; Heritage, T.; Jonathon, P.; Pack, S.E.; Philips, L. EVA: A New Theoretically Based Molecular Descriptor for Use in QSAR/QSPR Analysis. J. Comput.-Aided. Mol. Des. 1997, 11, 143–152. [Google Scholar] [CrossRef]
- Makhija, M.T.; Kulkarni, V.M. Eigen Value Analysis of HIV-1 Integrase Inhibitors. J. Chem. Inf. Comput. Sci. 2001, 41, 1569–1577. [Google Scholar] [CrossRef]
- Turner, D.B.; Willett, P.; Ferguson, A.M.; Heritage, T.W. Evaluation of a Novel Molecular Vibration-Based Descriptor (EVA) for QSAR Studies. 2. Model Validation Using a Benchmark Steroid Dataset. J. Comput.-Aided. Mol. Des. 1999, 13, 271–296. [Google Scholar] [CrossRef]
- Agrafiotis, D.K.; Cedeno, W.; Lobanov, V.S. On the use of neural network ensembles in QSAR and QSPR. J. Chem. Inf. Comput. Sci. 2002, 42, 903–911. [Google Scholar] [CrossRef]
- Cramer, R.D.; Bunce, J.D.; Patterson, D.E.; Frank, I.E. Crossvalidation, bootstrapping, and partial least squares compared with multiple regression in conventional QSAR studies. Quant. Struct.-Act. Relat. 1988, 7, 18–25. [Google Scholar] [CrossRef]
- Wehrens, R.; van der Linden, W.E. Bootstrapping principal component regression models. J. Chemom. 1997, 11, 157–171. [Google Scholar] [CrossRef]
- Clark, R.D.; Sprous, D.G.; Leonard, J.M. Validating models based on large data sets. In Rational Approaches to Drug Design; Höltje H., D., Sippl, W., Eds.; Prous Science SA: Barcelona, Spain, 2001; pp. 475–485. [Google Scholar]
© 2008 by the authors. Licensee Molecular Diversity Preservation International, Basel, Switzerland. This article is an open-access article distributed under the terms and conditions of the Creative Commons Attribution license ( http://creativecommons.org/licenses/by/3.0/).
Share and Cite
Xiong, X.-q.; Zhao, D.-m.; Bu, P.-f.; Liu, Y.; Ren, J.-h.; Wang, J.; Cheng, M.-s. CoMFA, CoMSIA and Eigenvalue Analysis on Dibenzodioxepinone and Dibenzodioxocinone Derivatives as Cholesteryl Ester Transfer Protein Inhibitors. Molecules 2008, 13, 1822-1839. https://doi.org/10.3390/molecules13081822
Xiong X-q, Zhao D-m, Bu P-f, Liu Y, Ren J-h, Wang J, Cheng M-s. CoMFA, CoMSIA and Eigenvalue Analysis on Dibenzodioxepinone and Dibenzodioxocinone Derivatives as Cholesteryl Ester Transfer Protein Inhibitors. Molecules. 2008; 13(8):1822-1839. https://doi.org/10.3390/molecules13081822
Chicago/Turabian StyleXiong, Xu-qiong, Dong-mei Zhao, Peng-fei Bu, Yang Liu, Jin-hong Ren, Jian Wang, and Mao-sheng Cheng. 2008. "CoMFA, CoMSIA and Eigenvalue Analysis on Dibenzodioxepinone and Dibenzodioxocinone Derivatives as Cholesteryl Ester Transfer Protein Inhibitors" Molecules 13, no. 8: 1822-1839. https://doi.org/10.3390/molecules13081822
APA StyleXiong, X.-q., Zhao, D.-m., Bu, P.-f., Liu, Y., Ren, J.-h., Wang, J., & Cheng, M.-s. (2008). CoMFA, CoMSIA and Eigenvalue Analysis on Dibenzodioxepinone and Dibenzodioxocinone Derivatives as Cholesteryl Ester Transfer Protein Inhibitors. Molecules, 13(8), 1822-1839. https://doi.org/10.3390/molecules13081822