Identification and Quantification of Flavonoids and Phenolic Acids in Burr Parsley (Caucalis platycarpos L.), Using High-Performance Liquid Chromatography with Diode Array Detection and Electrospray Ionization Mass Spectrometry

Abstract
:1. Introduction
2. Results and Discussion
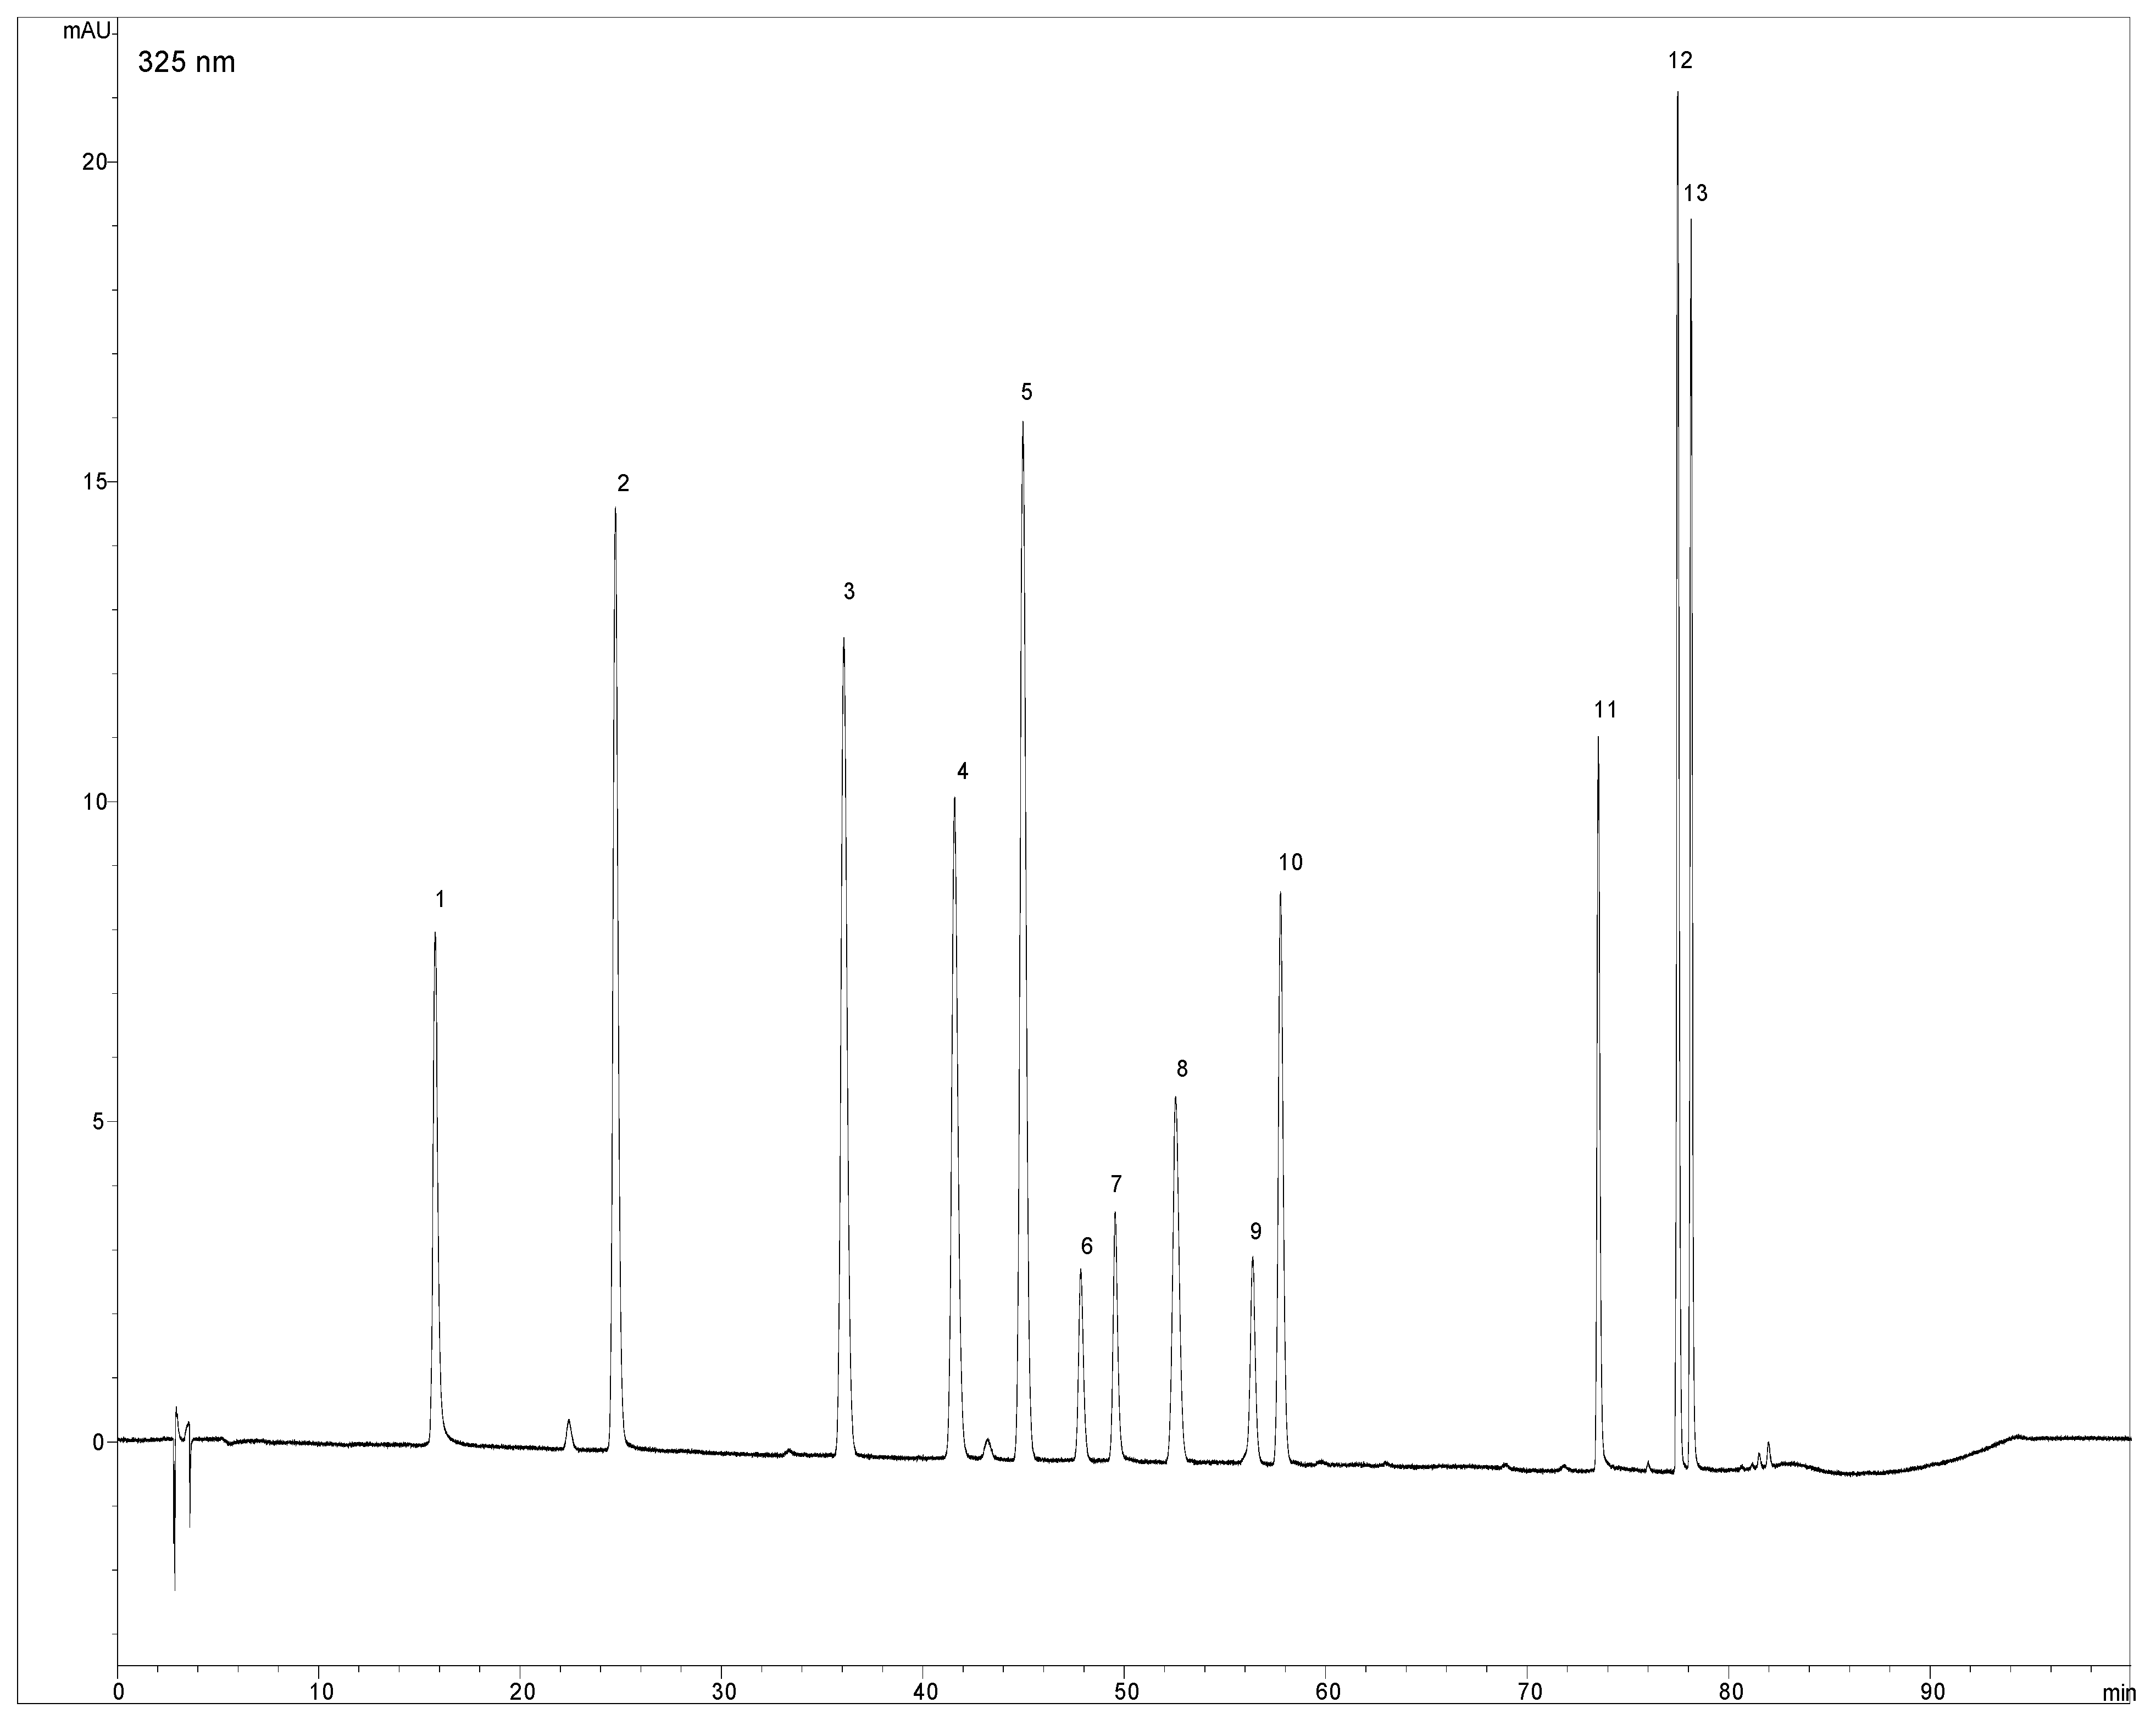
2.1. Optimization of chromatographic conditions
2.2. Validation data
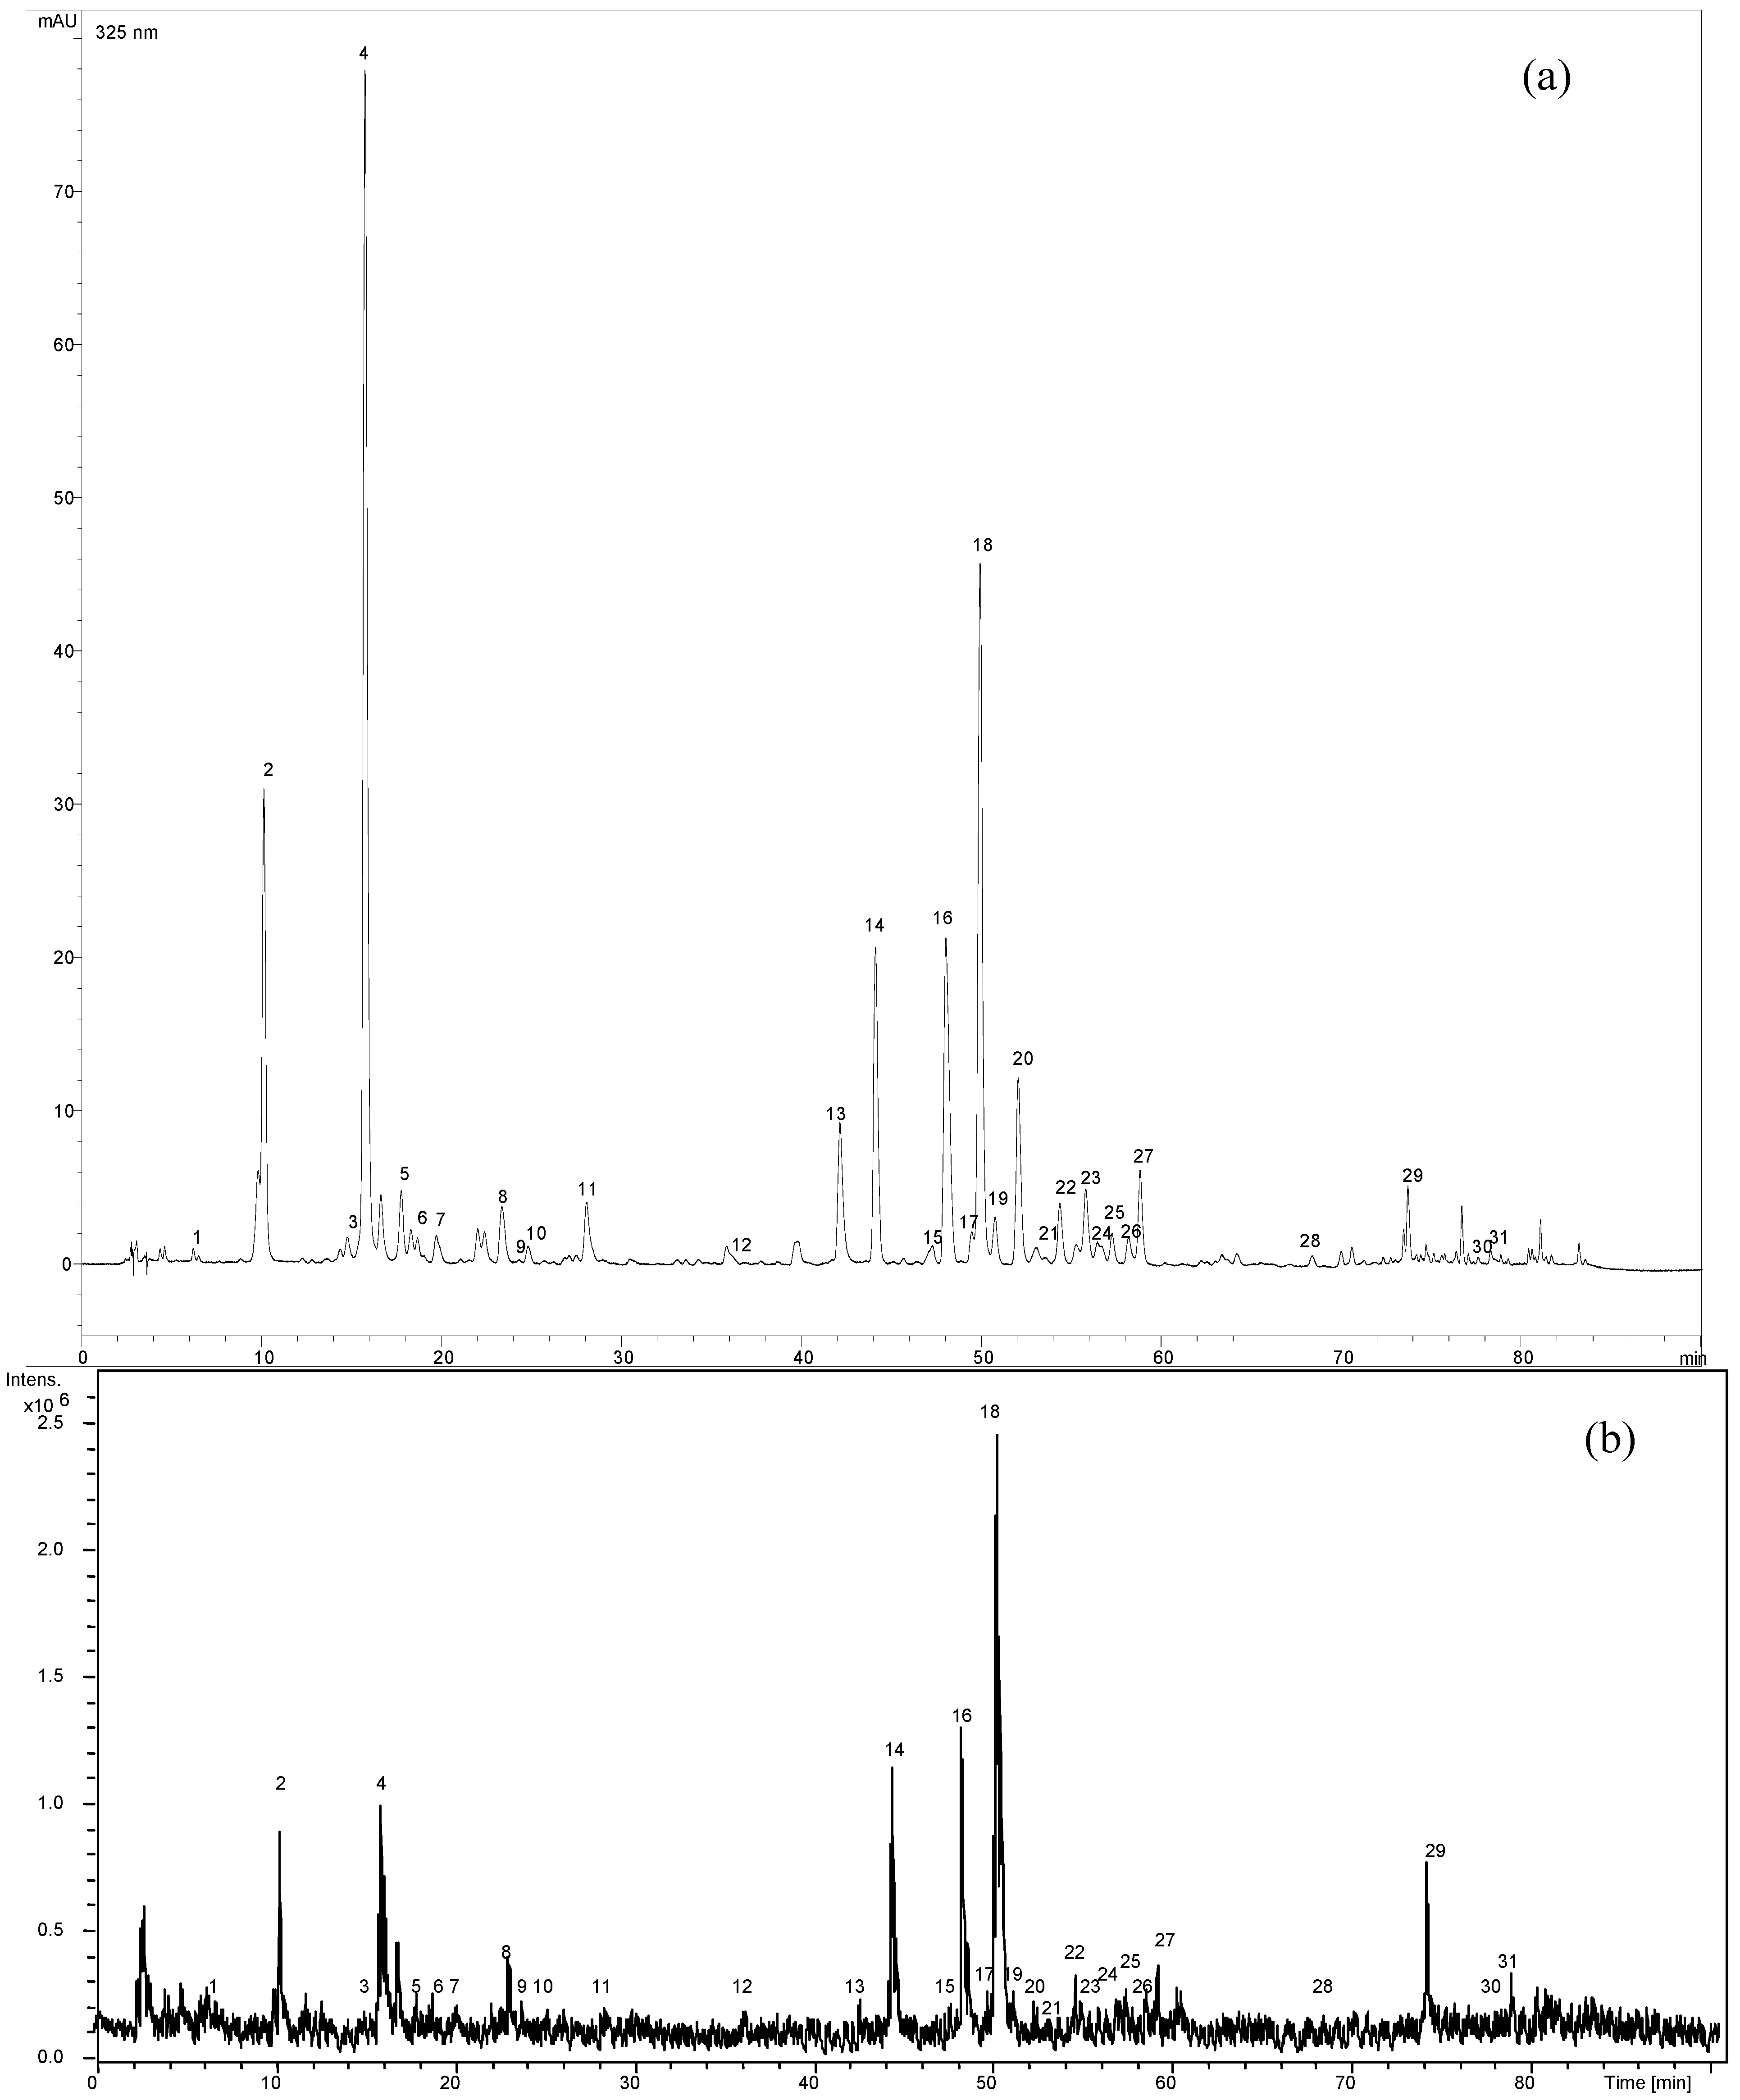
2.3. MS analysis and identification

| Compounds | λ (nm) | TR (min) | Regression equation1 | Linear (working) range (mg/mL) | R2 | LOD (mg/mL) | LOQ (mg/mL) | Precision (RSD % TR, AUC2) | ||||
| Conc. (mg/mL) | Intra-day | Inter-day | ||||||||||
| TR | AUC | TR | AUC | |||||||||
| 3-O-caffeoylquinc acid | 325 | 15.705 ± 0.197 | y = 18.882x - 0.010 | 0.003-0.160 (0.005-0.100) | 0.9999 | 0.001 | 0.002 | 0.005 | 0.20 | 0.57 | 0.48 | 1.09 |
| 0.015 | 0.14 | 0.83 | 0.40 | 1.10 | ||||||||
| 0.030 | 0.29 | 0.69 | 1.01 | 0.52 | ||||||||
| Caffeic acid | 325 | 24.770 ± 0.138 | y = 29.500x + 0.027 | 0.004-0.140 (0.005-0.050) | 0.9989 | 0.001 | 0.003 | 0.005 | 0.15 | 1.21 | 0.30 | 1.40 |
| 0.015 | 0.07 | 1.15 | 0.29 | 1.04 | ||||||||
| 0.030 | 0.23 | 1.09 | 0.34 | 1.01 | ||||||||
| p-Coumaric acid | 310 | 36.057 ± 0.135 | y = 46.190x + 0.022 | 0.005-0.120 (0.005-0.080) | 0.9997 | 0.001 | 0.005 | 0.005 | 0.10 | 1.19 | 0.22 | 1.35 |
| 0.015 | 0.12 | 1.15 | 0.25 | 1.15 | ||||||||
| 0.030 | 0.17 | 1.24 | 0.20 | 1.08 | ||||||||
| Ferulic acid | 325 | 41.721 ± 0.436 | y = 26.745x + 0.016 | 0.004-0.120 (0.005-0.050) | 0.9985 | 0.001 | 0.003 | 0.005 | 0.10 | 0.97 | 0.20 | 1.05 |
| 0.015 | 0.08 | 1.12 | 0.25 | 1.11 | ||||||||
| 0.030 | 0.10 | 0.77 | 0.17 | 0.75 | ||||||||
| Isoferulic acid | 325 | 45.075 ± 0.436 | y = 40.266x + 0.012 | 0.004-0.100 (0.005-0.080) | 0.9996 | 0.001 | 0.003 | 0.005 | 0.09 | 1.18 | 0.18 | 1.10 |
| 0.015 | 0.11 | 1.00 | 0.26 | 0.89 | ||||||||
| 0.030 | 0.07 | 0.71 | 0.14 | 0.73 | ||||||||
| Quercetin-3-β-O-galactoside | 350 | 47.960 ± 0.105 | y = 7.903x + 0.006 | 0.004-0.120 (0.005-0.050) | 0.9984 | 0.002 | 0.005 | 0.005 | 0.08 | 1.37 | 0.17 | 1.24 |
| 0.015 | 0.13 | 1.18 | 0.27 | 1.05 | ||||||||
| 0.030 | 0.05 | 1.02 | 0.08 | 1.14 | ||||||||
| Luteolin-7-β-O-glucoside | 350 | 49.733 ± 0.273 | y = 12.011x - 0.005 | 0.004-0.200 (0.005-0.120) | 0.9999 | 0.001 | 0.005 | 0.005 | 0.09 | 1.49 | 0.15 | 1.43 |
| 0.015 | 0.11 | 1.15 | 0.25 | 1.10 | ||||||||
| 0.030 | 0.03 | 1.09 | 0.08 | 1.02 | ||||||||
| o-Coumaric acid | 275 | 52.748 ± 0.402 | y = 29.455x + 0.008 | 0.004-0.140 (0.005-0.050) | 0.9998 | 0.001 | 0.002 | 0.005 | 0.14 | 1.35 | 0.15 | 1.27 |
| 0.015 | 0.08 | 1.07 | 0.20 | 1.04 | ||||||||
| 0.030 | 0.11 | 0.95 | 0.10 | 0.91 | ||||||||
| Quercetin-3-O-α-rhamnoside | 350 | 56.503 ± 0.102 | y = 8.652x -0.001 | 0.005-0.120 (0.005-0.080) | 0.9997 | 0.001 | 0.004 | 0.005 | 0.08 | 1.95 | 0.14 | 1.72 |
| 0.015 | 0.09 | 1.24 | 0.22 | 1.21 | ||||||||
| 0.030 | 0.06 | 1.77 | 0.07 | 1.57 | ||||||||
| Apigenin-7-O-glucoside | 325 | 57.864 ± 0.101 | y = 16.860x + 0.016 | 0.004-0.100 (0.005-0.050) | 0.9995 | 0.001 | 0.004 | 0.005 | 0.08 | 1.26 | 0.13 | 1.17 |
| 0.015 | 0.06 | 1.14 | 0.20 | 1.02 | ||||||||
| 0.030 | 0.08 | 0.95 | 0,10 | 0.91 | ||||||||
| Luteolin | 350 | 73.574 ± 0.051 | y = 20.951x - 0.011 | 0.004-0.120 (0.004-0.050) | 0.9999 | 0.001 | 0.003 | 0.005 | 0.03 | 1.32 | 0.03 | 1.36 |
| 0.015 | 0.04 | 1.13 | 0.08 | 1.09 | ||||||||
| 0.030 | 0,01 | 0.90 | 0.03 | 0.85 | ||||||||
| Apigenin | 325 | 77.496 ± 0.032 | y = 22.516x - 0.001 | 0.002-0.120 (0.002-0.050) | 0.9990 | 0.001 | 0.002 | 0.005 | 0.02 | 1.15 | 0.02 | 1.02 |
| 0.015 | 0.04 | 1.08 | 0.06 | 1.02 | ||||||||
| 0.030 | 0.01 | 0.86 | 0.02 | 0.77 | ||||||||
| Chrysoeriol | 350 | 78.155 ± 0.045 | y = 25.205x + 0.025 | 0.005-0.120 (0.005-0.080) | 0.9987 | 0.002 | 0.005 | 0.005 | 0.27 | 1.15 | 0.43 | 1.07 |
| 0.015 | 0.04 | 1.16 | 0.06 | 1.08 | ||||||||
| 0.030 | 0.01 | 0.62 | 0.02 | 0.62 | ||||||||
| Compounds | Recovery | ||
|---|---|---|---|
| Amount added | Recovery | RSD | |
| (mg/mL) | (%) | (%) | |
| 3-O-caffeoylquinic acid | 0.005 | 99.14 | 1.41 |
| 0.015 | 99.81 | 1.17 | |
| 0.046 | 98.88 | 0.55 | |
| Caffeic acid | 0.005 | 99.07 | 0.70 |
| 0.015 | 99.02 | 0.77 | |
| 0.046 | 99.52 | 1.01 | |
| p-Coumaric acid | 0.005 | 99.03 | 1.05 |
| 0.015 | 99.64 | 0.50 | |
| 0.046 | 99.56 | 1.01 | |
| Ferulic acid | 0.005 | 98.78 | 1.02 |
| 0.015 | 99.76 | 1.14 | |
| 0.046 | 99.75 | 0.14 | |
| Isoferulic acid | 0.005 | 99.79 | 1.89 |
| 0.015 | 100.46 | 0.67 | |
| 0.046 | 99.24 | 0.15 | |
| Quercetin-3-O-β-galactoside | 0.005 | 98.42 | 1.53 |
| 0.015 | 100.75 | 0.58 | |
| 0.046 | 101.53 | 0.59 | |
| Luteolin-7-O-β-glucoside | 0.005 | 101.11 | 1.67 |
| 0.015 | 99.79 | 0.99 | |
| 0.046 | 100.33 | 0.83 | |
| o-Coumaric acid | 0.005 | 99.79 | 1.81 |
| 0.015 | 100.35 | 0.63 | |
| 0.046 | 99.26 | 0.19 | |
| Quercetin-3-O-α-rhamnoside | 0.005 | 98.74 | 1.97 |
| 0.015 | 98.52 | 0.93 | |
| 0.046 | 100.65 | 0.64 | |
| Apigenin-7-O-β-glucoside | 0.005 | 98.62 | 1.27 |
| 0.015 | 99.70 | 0.39 | |
| 0.046 | 99.53 | 0.71 | |
| Luteolin | 0.005 | 99.06 | 1.62 |
| 0.015 | 100.50 | 0.58 | |
| 0.046 | 100.38 | 0.67 | |
| Apigenin | 0.005 | 100.58 | 1.82 |
| 0.015 | 99.93 | 0.72 | |
| 0.046 | 100.05 | 0.40 | |
| Chrysoeriol | 0.005 | 98.78 | 1.17 |
| 0.015 | 100.88 | 0.18 | |
| 0.046 | 99.87 | 0.25 | |
| Compound | Average amount ± SD |
|---|---|
| 3-O-caffeoylquinic acid | 1,023.25 ± 5.44 |
| Caffeic acid | 3.82 ± 0.16 |
| p-Coumaric acid | 0.72 ± 0.02 |
| Ferulic acid | below LOQ |
| Isoferulic acid | below LOQ |
| Quercetin-3-O-β-galactoside | 41.88 ± 0.86 |
| Luteolin-7-O-β-glucoside | 1,366.91 ± 7.50 |
| o-Coumaric acid | 2.42 ± 0.05 |
| Quercetin-3-O-α-rhamnoside | 37.07 ± 0.27 |
| Apigenin-7-O-β-glucoside | 15.30 ± 0.33 |
| Luteolin | 58.07 ± 0.09 |
| Apigenin | 5.011 ± 0.09 |
| Chrysoeriol | 3.19 ± 0.04 |

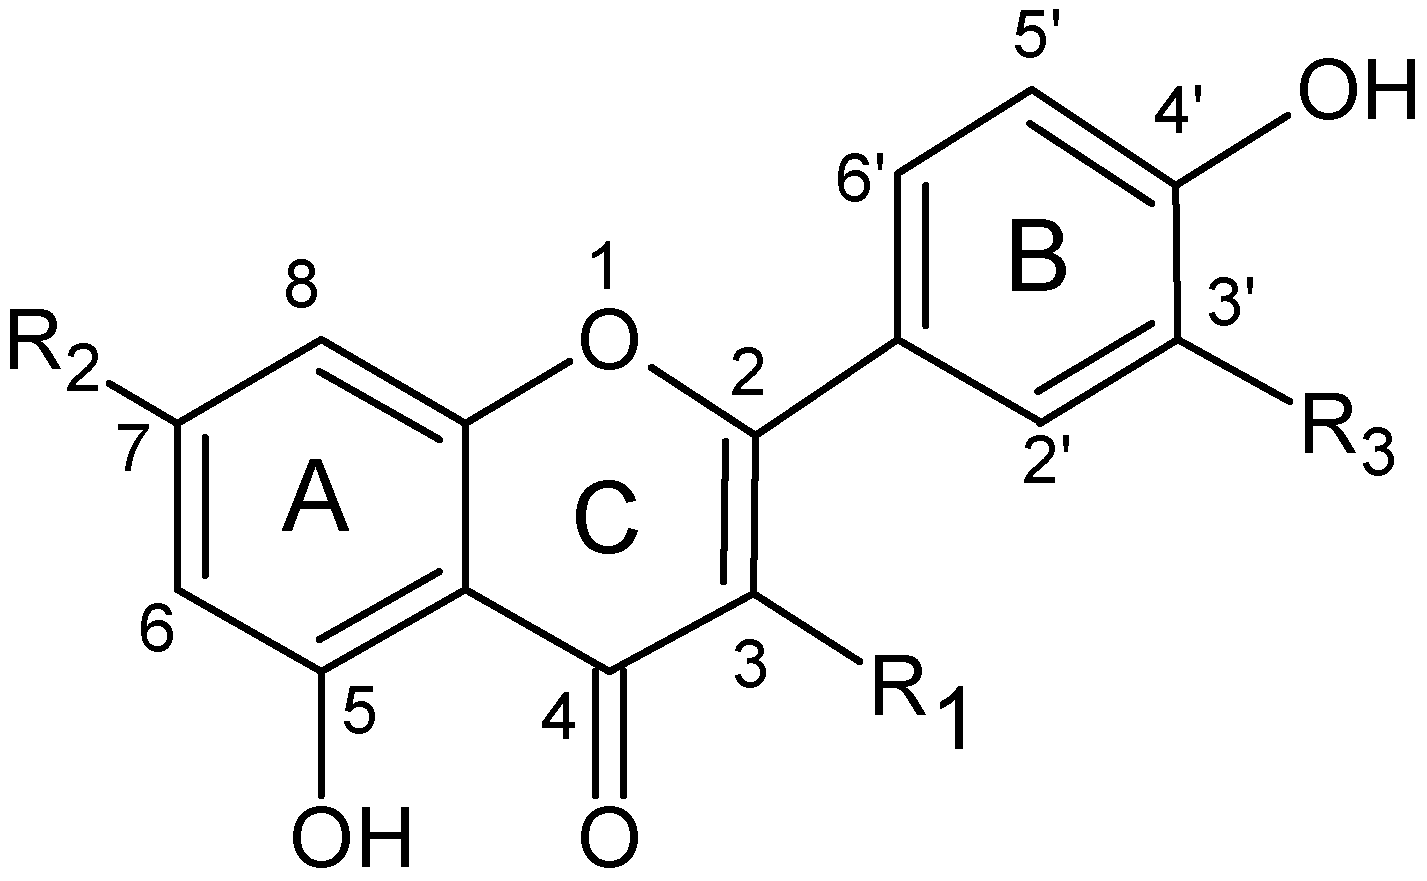
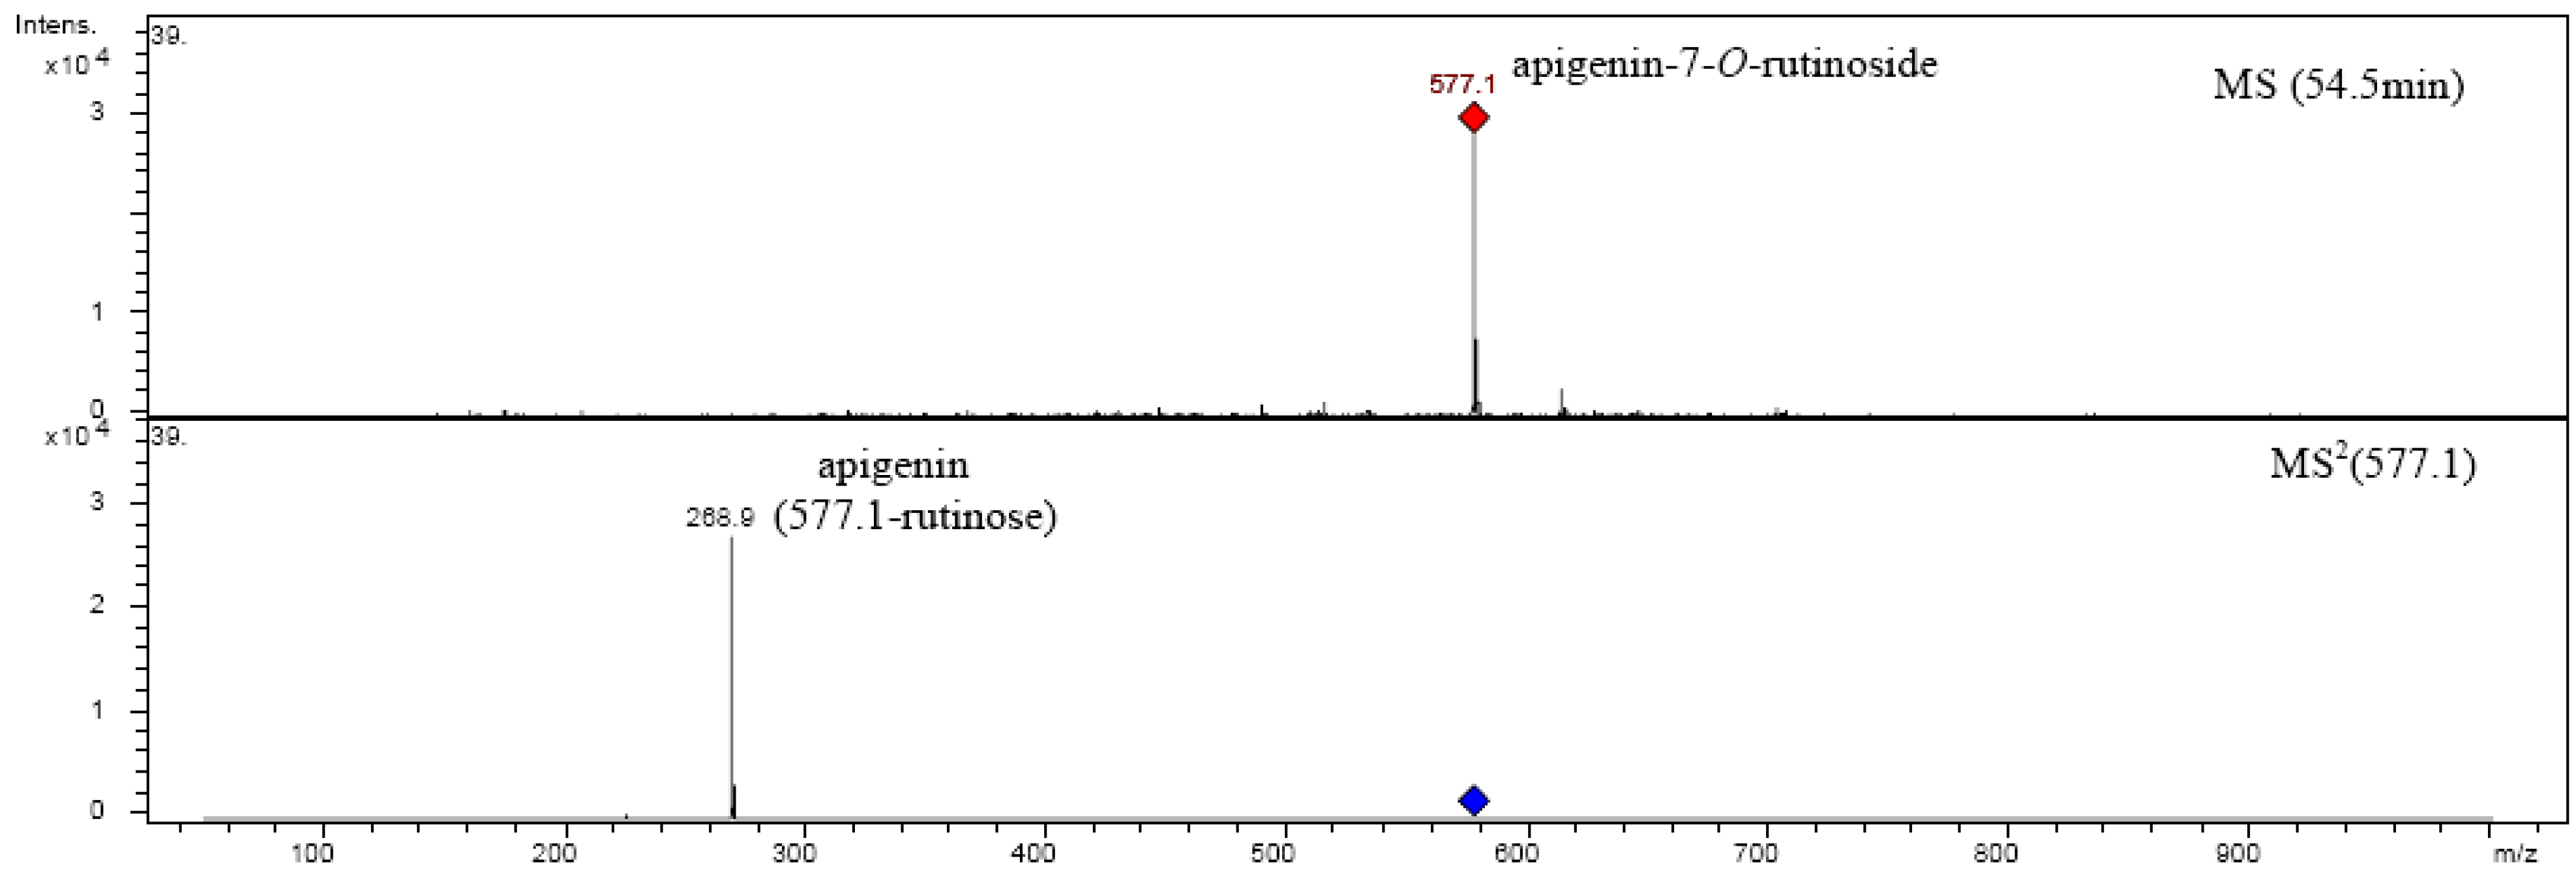
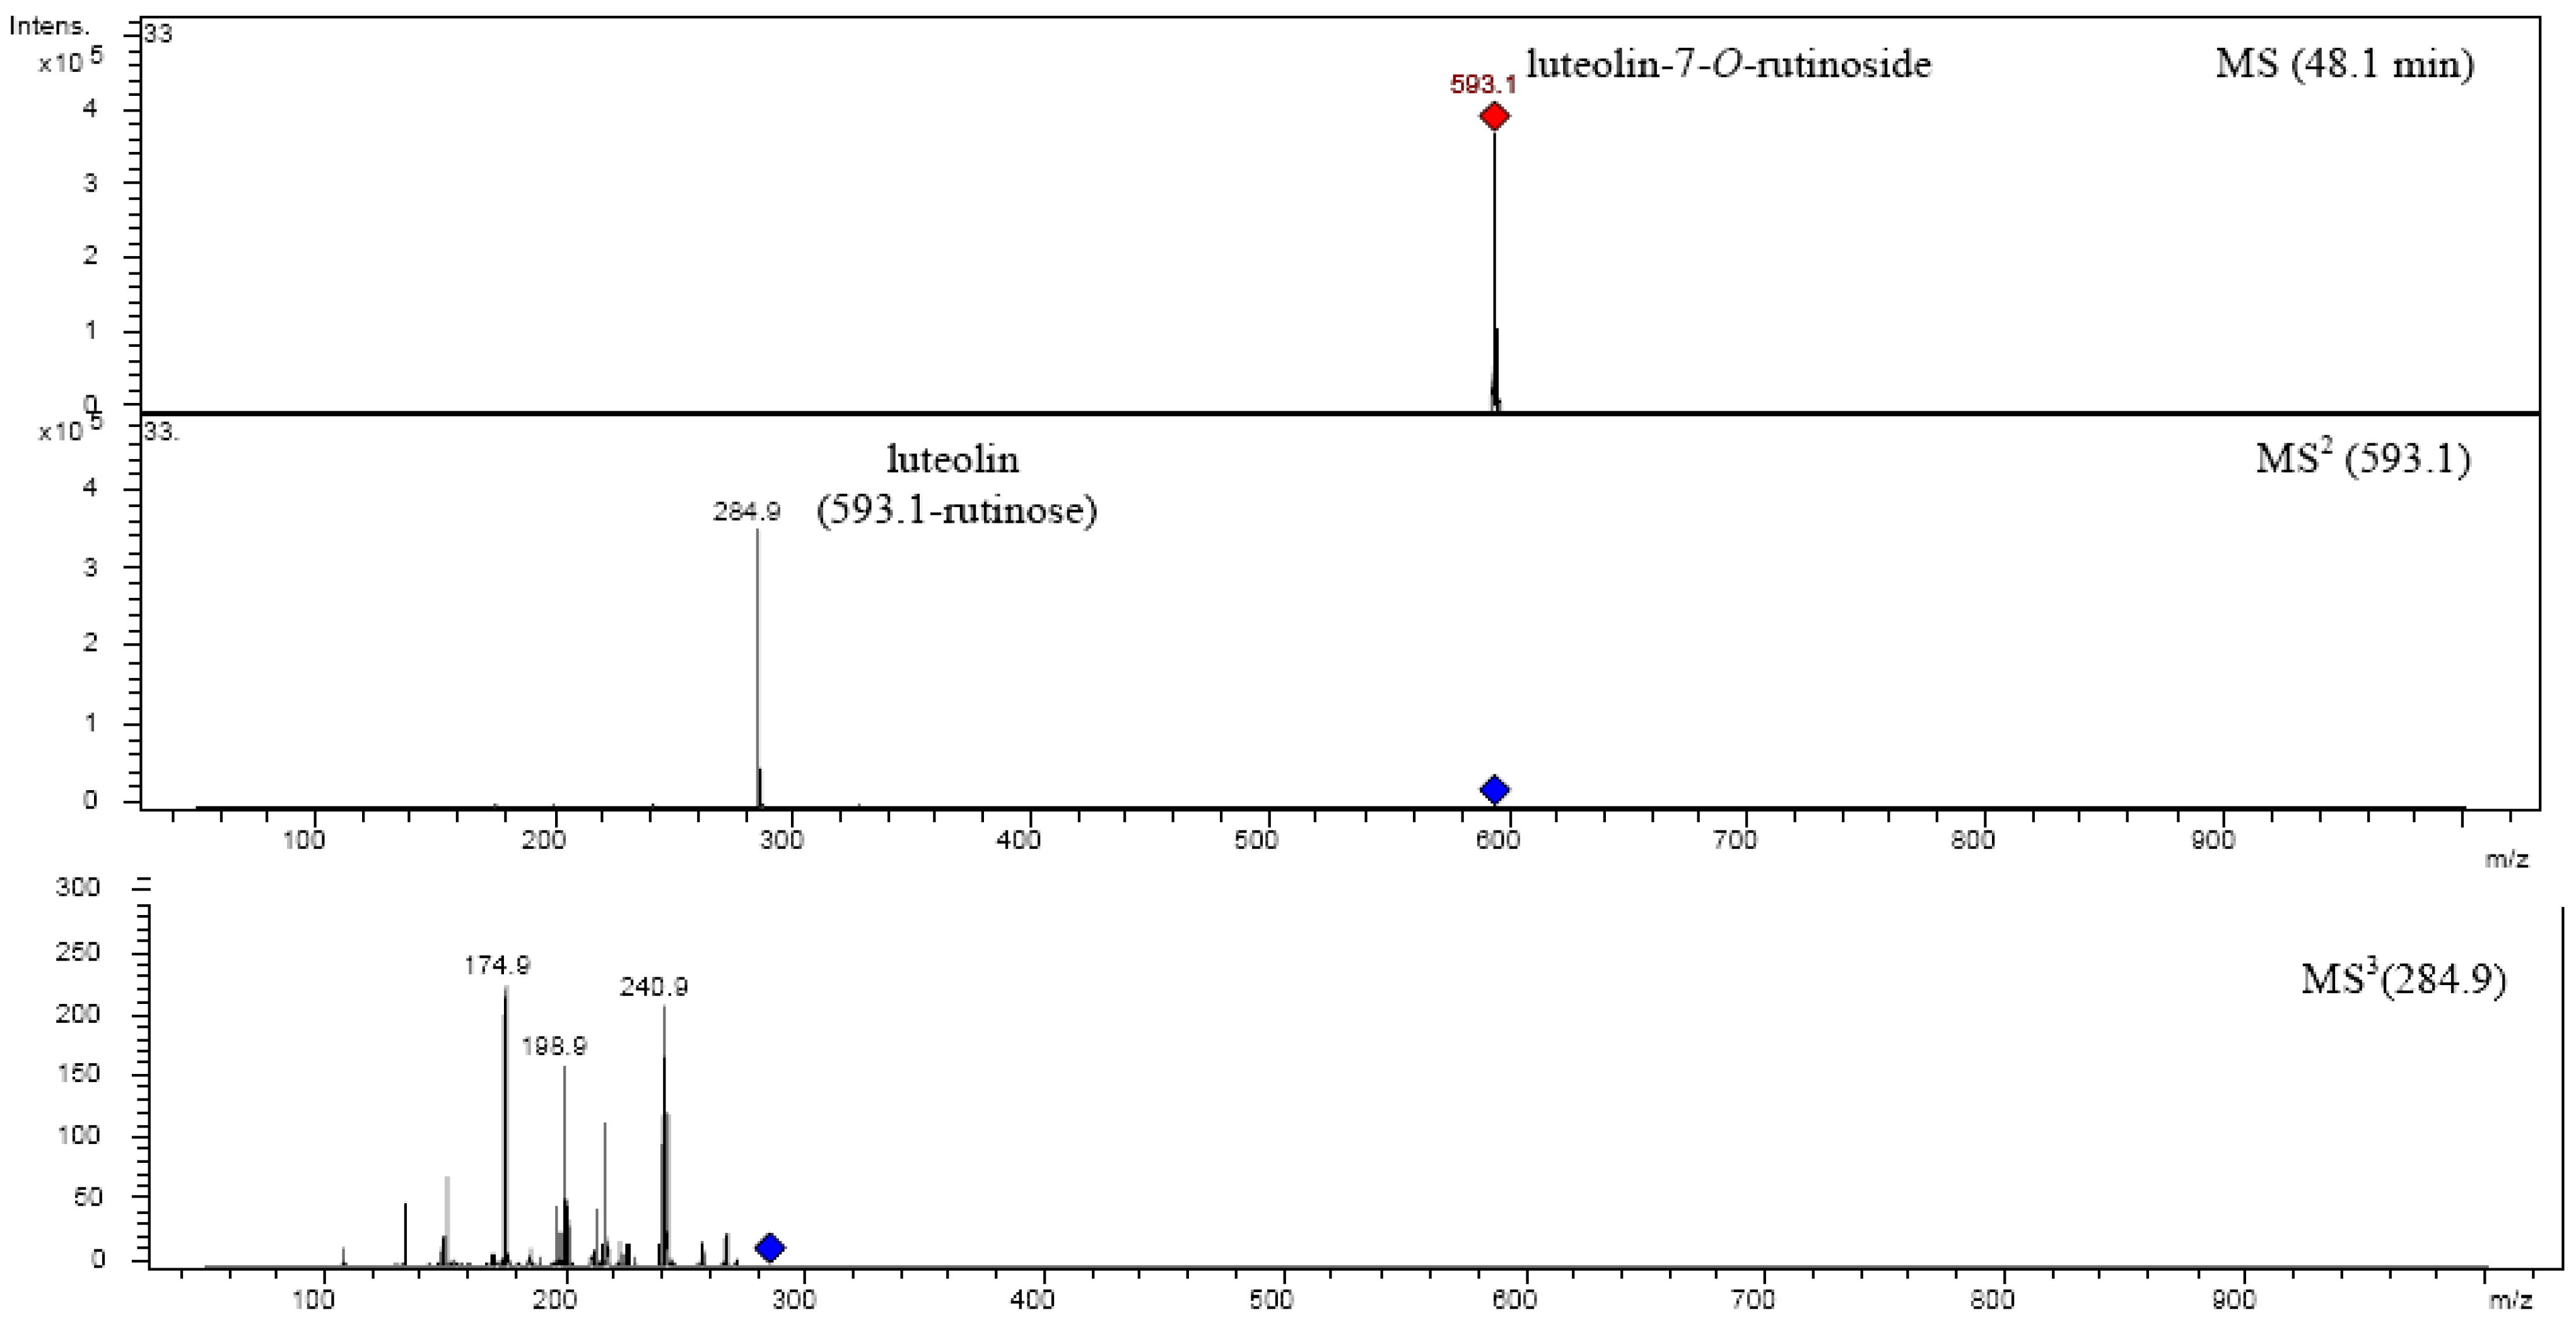
2.4. Structure characterization of the flavonoids by MSn

| Flavonoid | R1 | R2 | R3 |
|---|---|---|---|
| Apigenin | H | OH | H |
| Luteolin | H | OH | OH |
| Chrysoeriol | H | OH | OCH3 |
| Apigenin-7-O-glucoside | H | 7-O-β-D-glucopyranoside | H |
| Apigenin-7-O-rutinoside | H | 7-O-[α-L-rhamnopyranosyl-β-D-glucopyranoside] | H |
| Luteolin-7-O-glucoside | H | 7-O-β-D-glucopyranoside | OH |
| Luteolin-7-O-rutinoside | H | 7-O-[α-L-rhamnopyranosyl-β-D-glucopyranoside] | OH |
| Chrysoeriol-7-O-rutinoside | H | 7-O-[α-L-rhamnopyranosyl-β-D-glucopyranoside] | OCH3 |
| Quercetin-3-O-galactoside | 3-O-β-D-galactoside | OH | OH |
| Quercetin-3-O-rhamnoside | 3-O-α-D-rhamnoside | OH | OH |
| Flavonoid | Mw | peak no. | TR (min) | UVmax (nm) | [M-H]- m/z | HPLC-ESI-MSn m/z |
|---|---|---|---|---|---|---|
| Apigenin | 270.24 | 30 | 77.633 | 336 | 268.9 | MS2[268.9]: 224.9, 250.9, 240.9, 204.9, 196.8, 180.9, 200.9, 148.8, 170.9, 116.9, 107.0 |
| Luteolin | 286.24 | 29 | 73.667 | 348 | 284.9 | MS2[284.9]: 240.9, 266.9, 256.9, 242.9, 216.9, 198.9,174.8, 150.8,132.9 |
| MS3[240.9]: 196.9, 200.9, 212.9, 223.9, 148.9, 184.8, 170.8 | ||||||
| Chrysoeriol | 300.27 | 31 | 78.206 | 344 | 298.9 | MS2[298.9]: 283.9 |
| MS3[283.9]: 255.9, 229.9, 226.7, 150.8 | ||||||
| Apigenin-7-O-glucoside | 432.38 | 26 | 58.205 | 334 | 431.0 | MS2[431.0]: 268.9 |
| MS3[268.9]: 224.9, 250.9, 240.9, 204.9, 196.8, 180.9, 200.9, 148.8, 170.9, 116.9, 107.0 | ||||||
| Apigenin-7-O-rutinoside | 578.52 | 22 | 54.407 | 334 | 577.1 | MS2[577.1]: 268.9 |
| MS3[268.9]: 224.9, 250.9, 240.9, 204.9, 196.8, 180.9, 200.9, 148.8, 170.9, 116.9, 107.0 | ||||||
| Luteolin-7-O-glucoside | 448.38 | 18 | 49.960 | 348 | 447.0 | MS2[447.0]: 284.9 |
| MS3[284.9]: 240.9, 266.9, 256.9, 242.9, 216.9, 198.9, 174.8, 150.8, 132.9 | ||||||
| Luteolin-7-O-rutinoside | 594.52 | 16 | 48.022 | 348 | 593.1 | MS2[593.1]: 284.9 |
| MS3[284.9]: 240.9, 266.9, 256.9, 242.9, 216.9, 198.9, 174.8, 150.8, 132.9 | ||||||
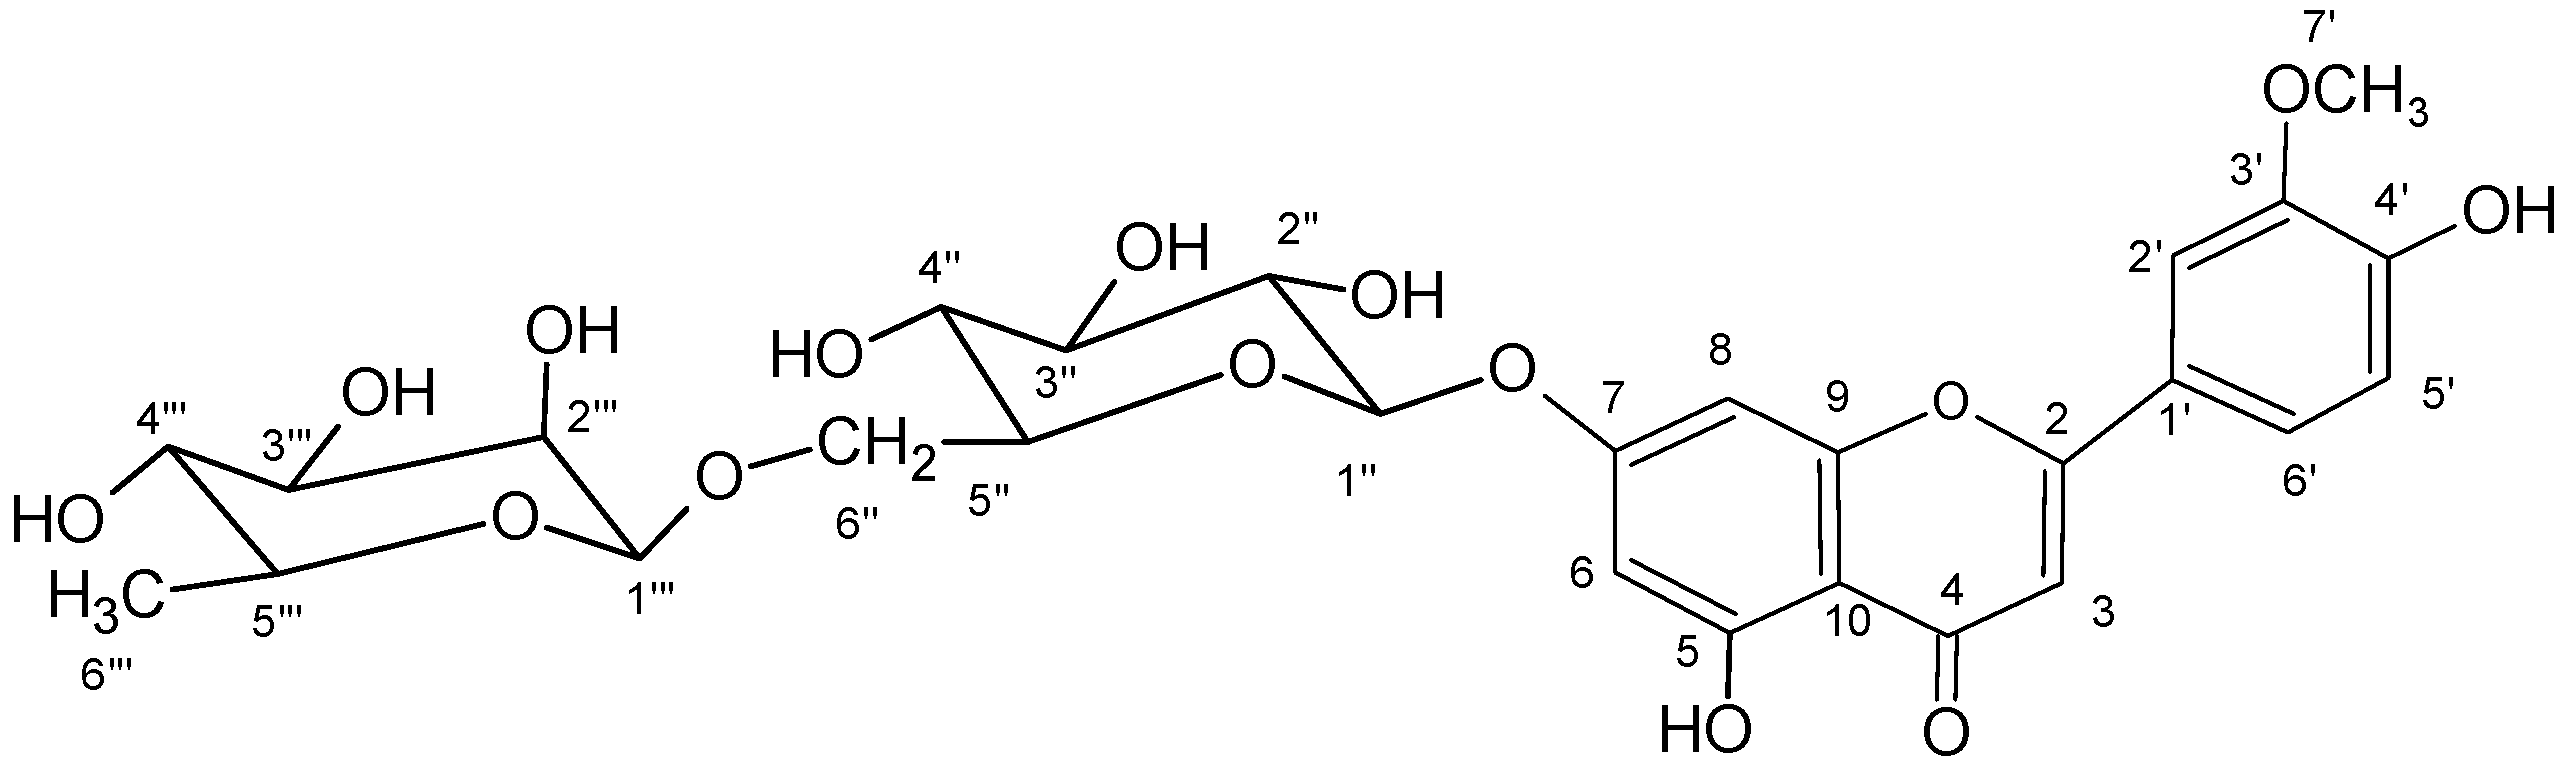
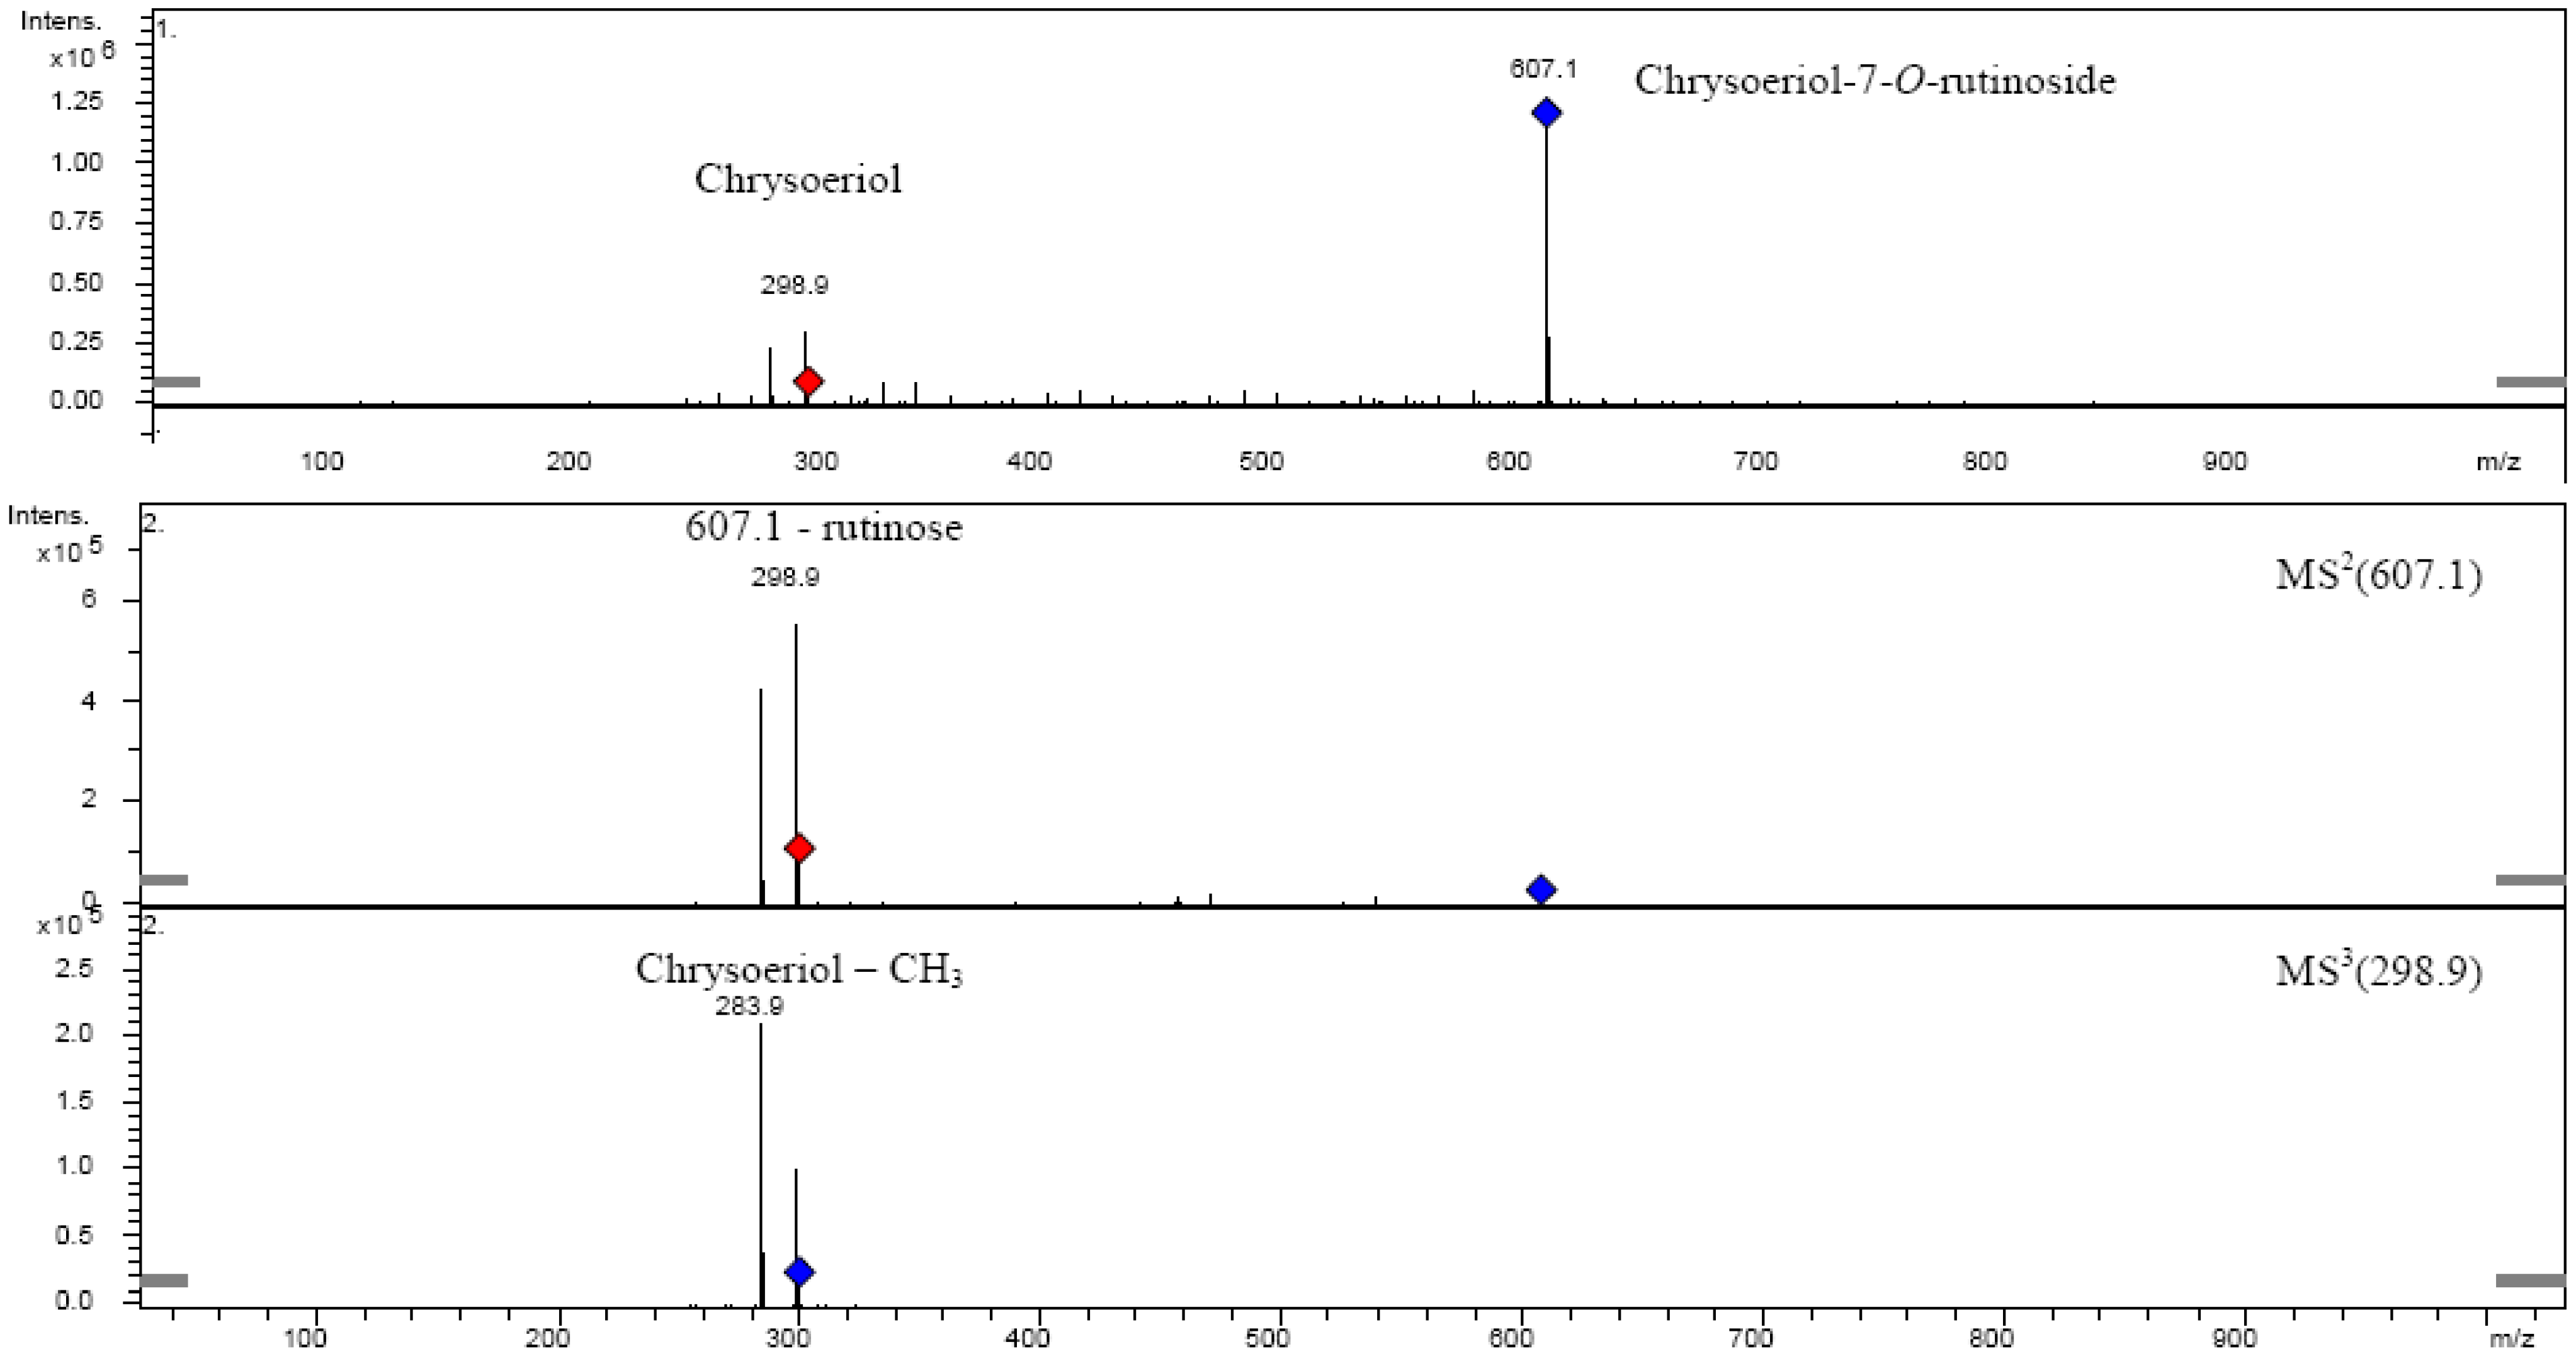
| Chrysoeriol-7-O-rutinoside | 608.55 | 27 | 59.324 | 344 | 607.1 | MS2[607.1]: 298.9, 283.9 |
| MS3[298.9]: 283.9 | ||||||
| Quercetin-3-O-galactoside | 464.38 | 17 | 49.509 | 256 | 463.0 | MS2[463.3]: 300.9 |
| MS2[300.9]: 178.8, 150.9, 120.8, 107.0, 168.7, 174.9 ,272.9, 256.8, 228.9 | ||||||
| Quercetin-3-O-rhamnoside | 448.38 | 24 | 56.407 | 256 | 447.0 | MS2[463.3]: 300.9 |
| 352 | MS2[300.9]: 178.8, 150.8, 106.9, 120.8, 272.9, 228.9, 256.8 | |||||
| Quercetin-hexoside | 464.39 | 15 | 47.301 | 356 | 463.0 | MS2[463.3]: 300.9, 178.8 |
| 256 | MS2[300.9]: 178.8, 150.8, 106.8, 120.8, 272.9, 228.9, 256.9, 239.0, 162.9, 168.8 | |||||
| Quercetin-uronic acid | 478.39 | 14 | 44.171 | 256 | 477.0 | MS2[477.0]: 300.9, 178.8, 150.8 |
| 355 | MS2[300.9]: 178.8, 150.8, 106.9, 272.9, 228.9, 256.9, 192.8, 168.8 | |||||
| Chrysoeriol-uronic acid | 476.42 | 28 | 68.380 | 266 | 475.0 | MS2[475.0]: 298.9, 283.9, 254.8, 322.7, 390.7, 414.9 |
| 354 | MS2[298.9]: 283.9 |


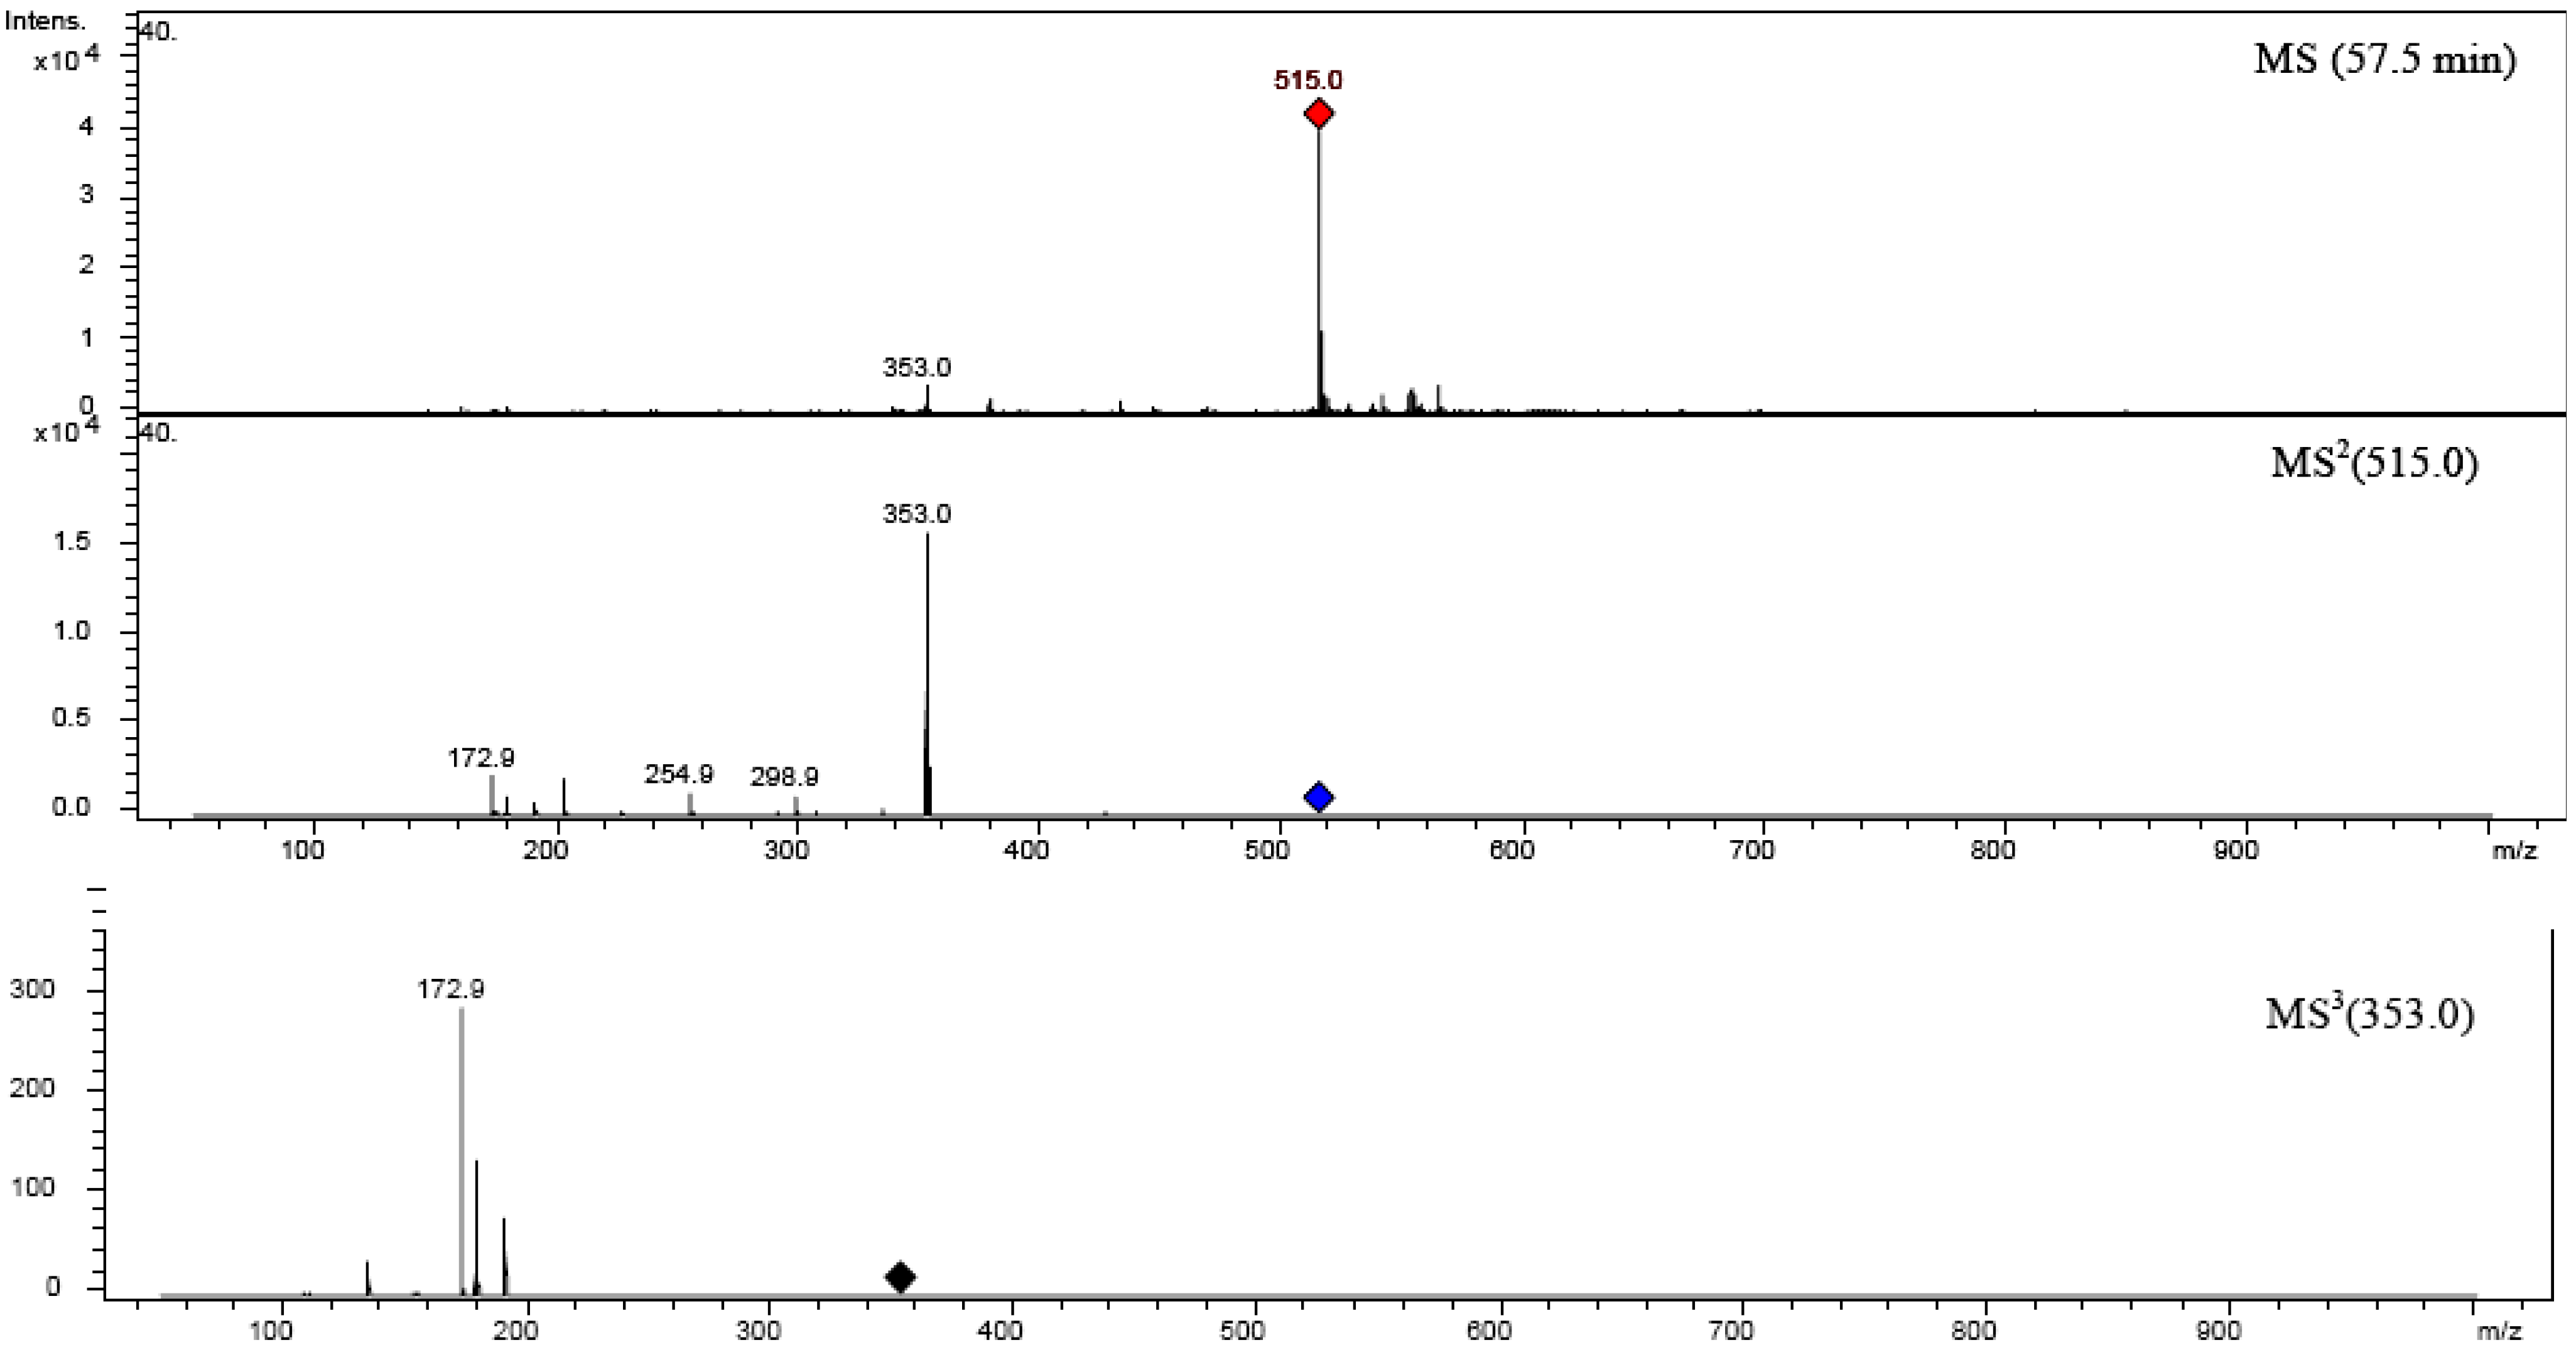
2.5. Structure characterization of phenolic acids by MSn
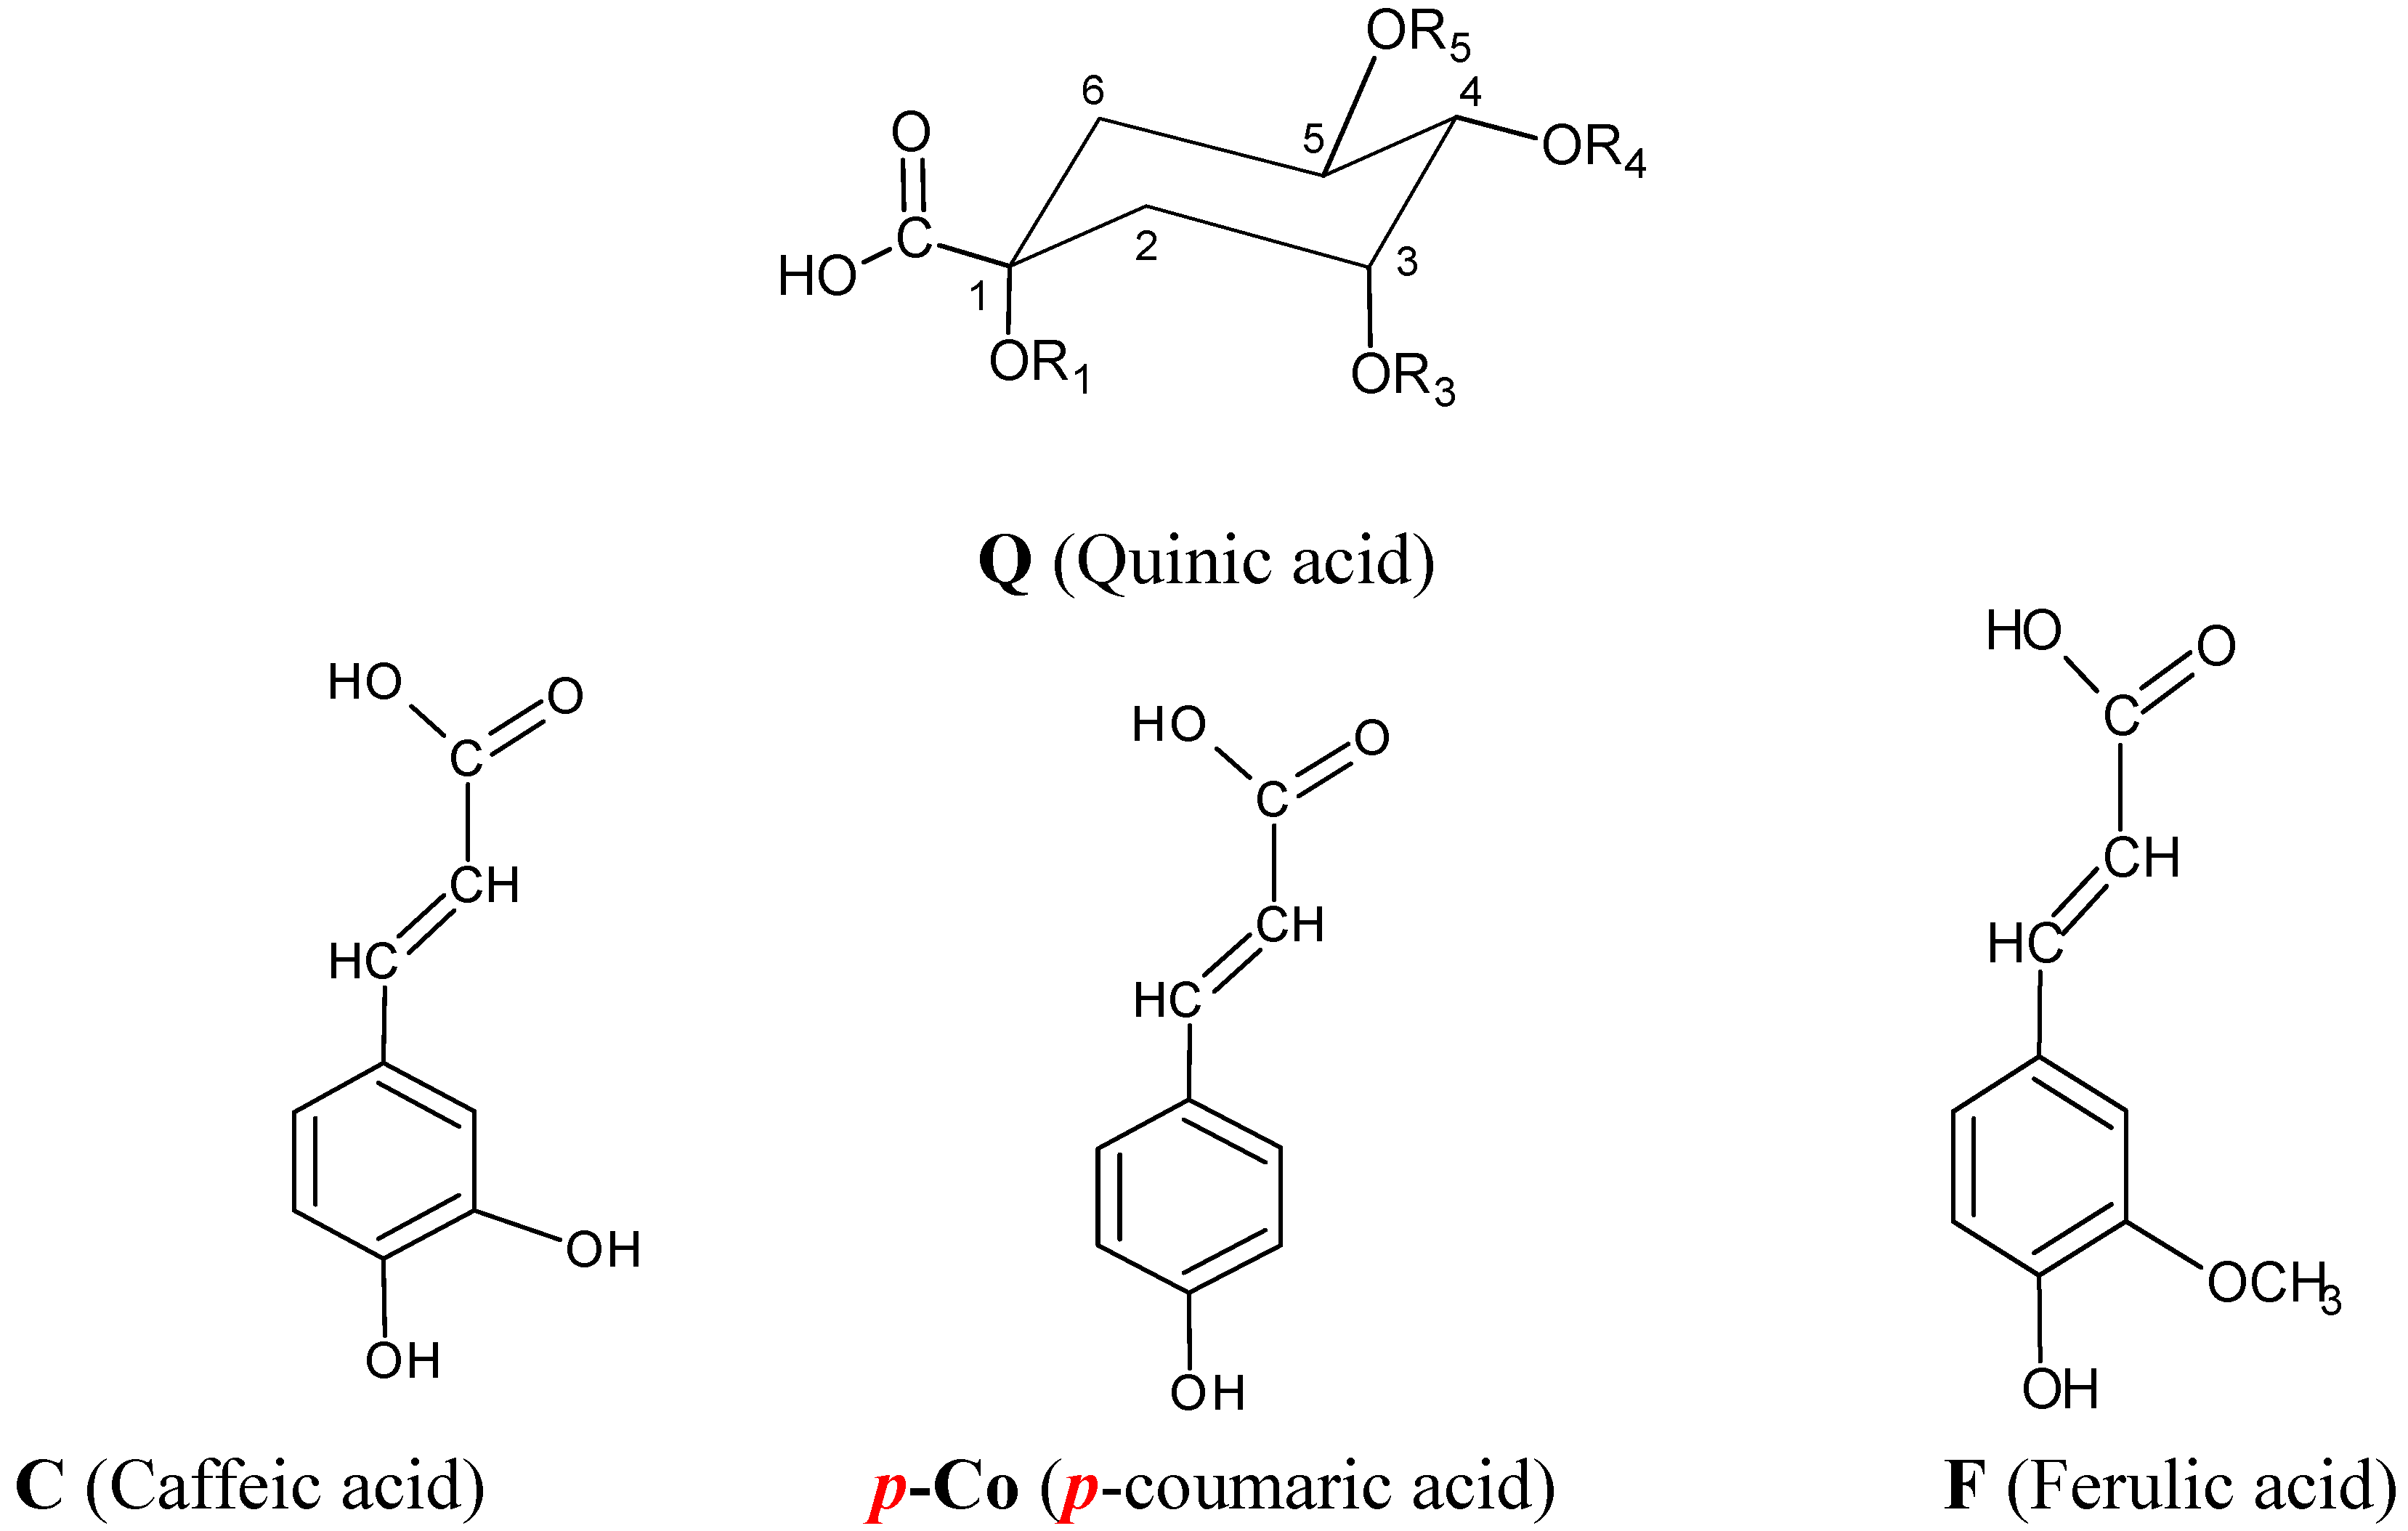
| Name | Abbreviation | R1 | R3 | R4 | R5 |
|---|---|---|---|---|---|
| 1-O-caffeoylquinic acid | 1-CQA | C | H | H | H |
| 3-O-caffeoylquinic acid | 3-CQA | H | C | H | H |
| 5-O-caffeoylquinic acid | 5-CQA | H | H | H | C |
| 4-O-caffeoylquinic acid | 4-CQA | H | H | C | H |
| 3-p-O-coumaroylquinic acid | 3-pCoQA | H | p-Co | H | H |
| 5-p-O-coumaroylquinic acid | 5-pCoQA | H | H | H | p-Co |
| 4-p-O-coumaroylquinic acid | 4-pCoQA | H | H | p-Co | H |
| 3-O-feruloylquinic acid | 3-FQA | H | F | H | H |
| 5-O-feruloylquinic acid | 5-FQA | H | H | F | H |
| 4-O-feruloylquinic acid | 4-FQA | H | H | H | F |
| 1,3-di-O-caffeoylquinic acid | 1,3-diCQA | C | C | H | H |
| 1,4-di-O-caffeoylquinic acid | 1,4-diCQA | C | H | C | H |
| 1,5-di-O-caffeoylquinic acid | 1,5-diCQA | C | H | H | C |
| 3,4-di-O-caffeoylquinic acid | 3,4-diCQA | H | C | C | H |
| 3,5-di-O-caffeoylquinic acid | 3,5-diCQA | H | C | H | C |
| 4,5-di-O-caffeoylquinic acid | 3,4-diCQA | H | H | C | C |
| Compound | Mw | peak no. | TR (min) | UVmax (nm) | MS1 parent ion m/z | MS2 base peak m/z | MS2 secondary peaks m/z(intensity) | MS3 base peak m/z | MS3 secondary peaks m/z (intensity) |
| Caffeic acid | 180.16 | 9 | 24.421 | 322 | 178.8 | 134.9 | 134.9 (3) | - | - |
| p-Coumaric acid | 164.16 | 12 | 36.104 | 310 | 162.7 | 118.9 | 127.8 (20) | - | - |
| o-Coumaric acid | 164.16 | 21 | 53.134 | 275 | 162.7 | 118.9 | - | - | - |
| 1-CQA | 354.31 | 2 | 10.166 | 325 | 352.9 | 190.8 | 179.8 (40), 134.9 (11) | 126.8 | 84.9 (75), 172.8 (70). 92.9 (60), 110.8 (20), 108.9 (25) |
| (1-O-caffeoylquinic acid) | |||||||||
| 3-CQA | 354.31 | 4 | 15.845 | 325 | 352.9 | 190.9 | 178.8 (20) | 126.8 | 84.9 (70), 172.9 (50), 110.8 (30), 92.9 (65), 108.8 (35) |
| (3-O-caffeoylquinic acid) | |||||||||
| 4-CQA | 354.31 | 5 | 17.860 | 325 | 353.0 | 172.8 | 178.8 (75), 190.9 (20), 134.9 (15) | 92.9 | 110.8 (45), 126,7 (2), 136.8 (17), 154.8 (25) |
| (4-O-caffeoylquinic acid) | |||||||||
| 1,3-diCQA | 516.47 | 19 | 50.806 | 325 | 515.0 | 352.9 | 190.9 (20), 179 (10), 334.9 (5) | 190.8 | 179.8 (55), 134.9 (10) |
| (1,3-di-O-caffeoyquinic acid | |||||||||
| 3,4-diCQA | 516.47 | 23 | 55.859 | 325 | 515.0 | 352.9 | 172.9 (20), 178.8.1 (13), 190.8 (10), 202.9 (10), 254.9 (7), 298.9 (6), 334.9 (9) | 172.8 | 178.9 (50), 190.7 (13), 134.8 (10) |
| (3,4-di-O-caffeoyquinic acid) | |||||||||
| 4,5-diCQA | 516.47 | 25 | 57.306 | 325 | 515.0 | 353.0 | 172.9 (19), 202.8 (8), 178.8 (10), 190.8 (4), 254.9 (7), 298.9 (8), 316.9 (4) | 172.9 | 178.9 (40), 190.8 (20), 134.8 (7) |
| (4,5-di-O-caffeoyquinic acid | |||||||||
| 3,5-diCQA | 516.47 | 20 | 52.115 | 325 | 515,0 | 352.9 | 190,8 (10), 178.8 (4) | 190.8 | 178.8 (50), 134.9 (10), 172.8 (4) |
| (3,5-di-O-caffeoyquinic acid | |||||||||
| QQCA (quinic-quinic-caffeic acid ester) | 528.48 | 13 | 42.218 | 328 | 527.0 | 364.9 | 202.8 (25), 184.8 (7), 178.9 (3) | 202.8 | 184.8 (25), 178.8 (13), 134.9 (7) ,140.9 (2) |
| 5-FQA | 368.34 | 11 | 28.154 | 322 | 367.0 | 190.9 | 172.9 (30), 160.9 (3), 136.9 (9) | 84.9 | 172.9 (90), 126.6 (95) |
| (5-O-feruloylquinic acid) | |||||||||
| 5-pCoQA | 338.31 | 8 | 23.450 | 316 | 336.9 | 190.9 | 162.9 (4), 172.9 (2) | 126.9 | 170.8 (90), 84.9 (60), 93.0 (40), 108.9 (4), 98.9 (10), 144.7(10) |
| (5-p-coumaroyl-quinic acid) | |||||||||
| 4-pCoQA | 338.31 | 10 | 24.933 | 315 | 336.9 | 172.9 | 162.8 (7), 190.9 (30), 118.9 (1), 154.9 (2), 110.9 (2) | - | - |
| (4-p-coumaroyl-quinic acid) | |||||||||
| 3-pCoQA | 338.31 | 3 | 14.854 | 310 | 337.0 | 162.9 | 190.9 (8), 172.9 (4), 118.9 (8) | 118.9 | - |
| (3-p-coumaroyl-quinic acid) | |||||||||
| GCA (gallic-caffeic acid ester) | 332.28 | 1 | 6.215 | 315 | 330.9 | 168.8 | 192.9 (30), 210.8 (20), 270.9 (35), 150.7 (10), 124.8 (139 | - | - |
| diCA (dicaffeic acid) | 342.32 | 7 | 19.831 | 328 | 341.0 | 178.8 | 160.9 (35); 134.9 (15), 202.8(10), 280.9 (5), 250.9 (3) | - | - |

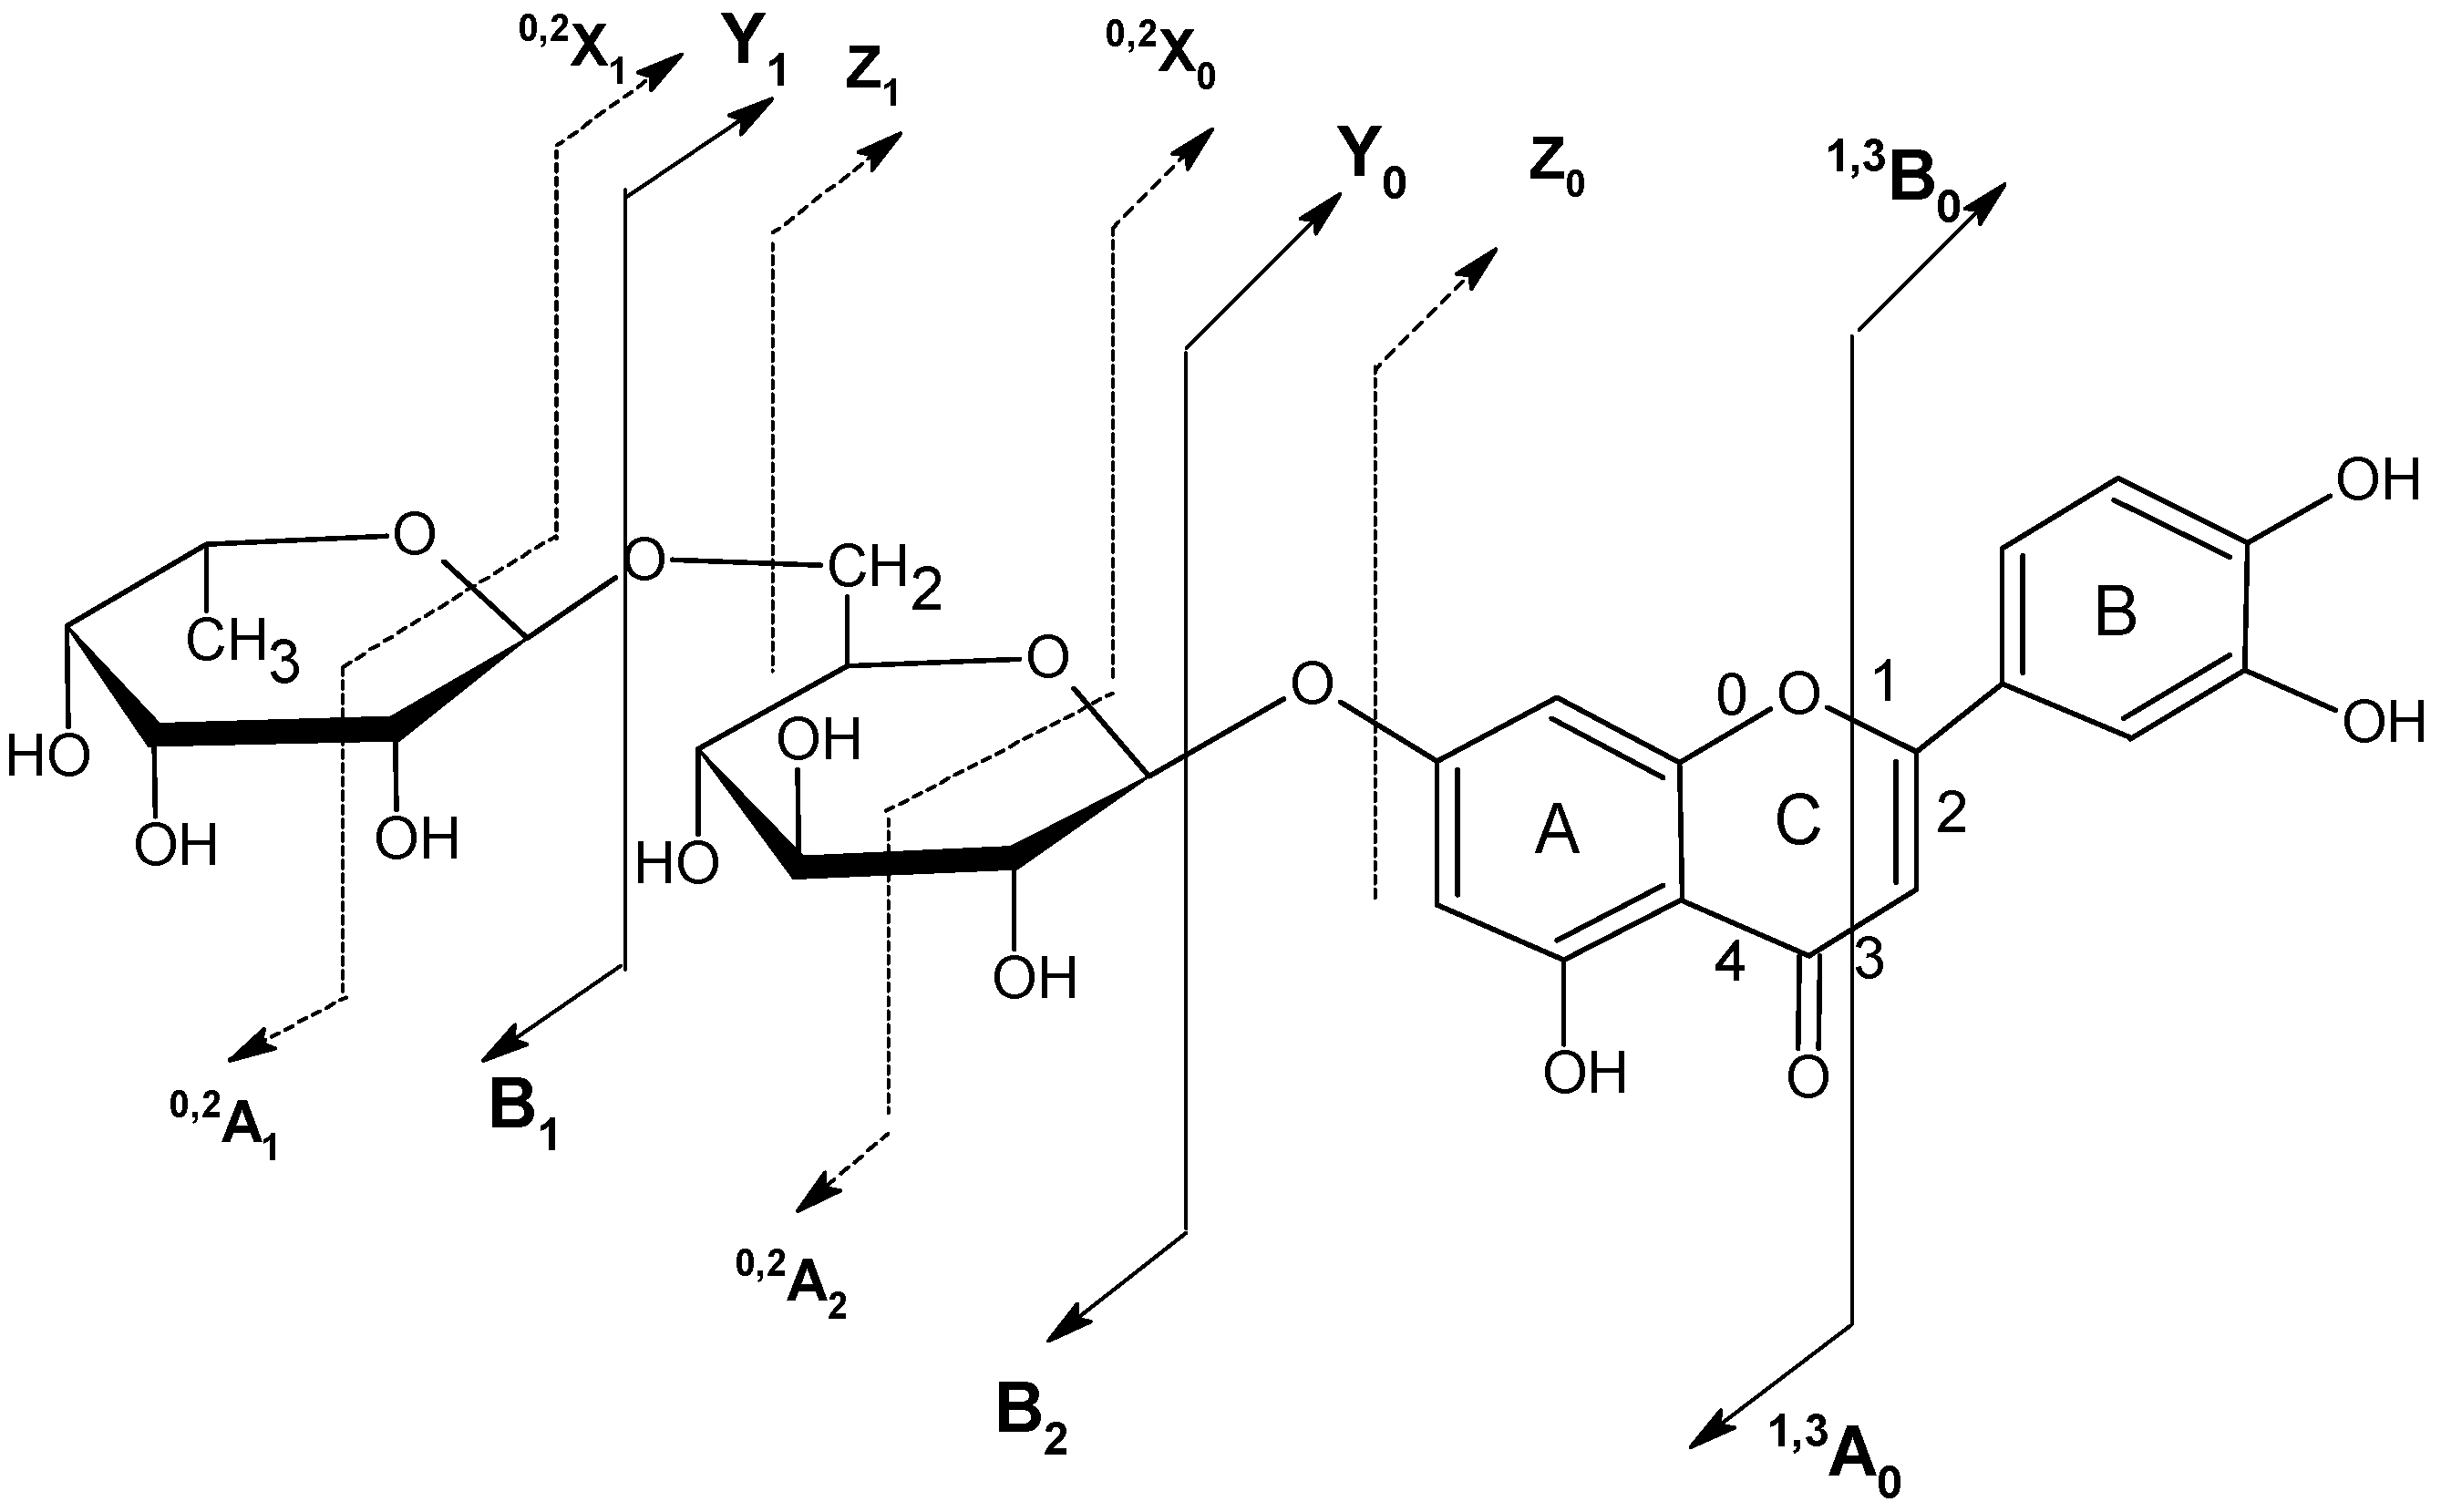
2.6. Chrysoeriol 7-O-α-L-rhamnosyl (1→6)-β-D-glucoside structure charcterization

3. Experimental
3.1. General
3.2. Plant material
3.3. Preparation of standard solutions
3.4. Extraction
3.5. Isolation of chysoeriol-7-O-rutinoside by preparative liquid chromatography
4. Conclusions
Acknowledgements
References
- Kujundžić, M.; Bašić, I.; Kujundžić, N. Therapy of liver methastases of colorectal cancer by plant extract from Caucalis platycarpos L. Acta Pharm. 1997, 47, 39–45. [Google Scholar]
- Kujundžić, N.; Stanić, G.; Vukušić, I. A study of chemical composition of the plant Caucalis platycarpos L. Acta Pharm. 1992, 43, 91–93. [Google Scholar]
- de Rijke, E.; Out, P.; Niessen, W.M.A.; Ariese, F.; Gooijer, C.; Brinkman, U.A. Th. Analytical separation and detection methods for flavonoids. J. Chromatogr. A 2006, 1112, 31–63. [Google Scholar]
- Naczk, M.; Shahidi, F. Extraction and analysis of phenolics in food. J. Chromatogr. A 2004, 1054, 95–111. [Google Scholar]
- Papetti, A.; Daglia, M.; Aceti, C.; Sordelli, B.; Spini, V.; Carrazzone, C.; Gazzani, G. Hydroxycinnamic acid derivatives occuring in Cichorium endivia vegetables. J. Pharm. Biomed. Anal. 2008, 48, 472–476. [Google Scholar] [CrossRef]
- Clifford, M.N.; Wu, W.; Kuhnert, N. The chlorogenic acids of Hemerocallis. Food Chem. 2006, 95, 574–578. [Google Scholar] [CrossRef]
- Perrone, D.; Farah, A.; Donangelo, C.M.; De Paulis, T.; Martin, P.R. Comprehensive analysis of major and minor chlorogenic acids and lactones in economically relevant Brazilian coffee cultivars. Food Chem. 2008, 106, 859–86. [Google Scholar] [CrossRef]
- Tapiero, H.; Tew, K.D.; Nguyen Ba, G.; Mathe, G. Polyphenols: do they play a role in the prevention of human pathologies? Biomed. Pharmacother. 2002, 56, 200–207. [Google Scholar] [CrossRef]
- Harborne, J.B.; Williams, C.A. Advances in flavonoid research since 1992. Phytochemistry 2000, 55, 481–504. [Google Scholar] [CrossRef]
- Hung, T.M.; Na, M.K.; Thoung, P.T.; Su, N.D.; Sok, D.E.; Song, K.S.; Seong, Y.H.; Bae, K.H. Antioxidant activity of caffeoylquinic acid derivatives from the roots of Dipsacus asper Wall. J. Ethnopharmacol. 2006, 108, 188–192. [Google Scholar] [CrossRef]
- Yonathan, M.; Asres, K.; Assefa, A.; Bucar, F. In vivo anti-inflammatory and antinociceptive activities of Chelianthes farinosa. J. Ethnopharmacol. 2006, 108, 462–470. [Google Scholar] [CrossRef]
- Bonita, J.S.; Mandarano, M.; Shuta, D.; Vinson, J. Coffee and cardiovascular disease: In vitro, cellular, animal, and human studies. Pharmacol. Res. 2007, 55, 187–198. [Google Scholar] [CrossRef]
- Yao, L.H.; Jiang, Y.M.; Shi, J.; Tomás-Barberán, F.A.; Datta, N.; Singanusong, R.; Chen, S.S. Flavonoids in food and their health benefits. Plant Foods Hum. Nutr. 2004, 59, 113–122. [Google Scholar] [CrossRef]
- Sadhu, S.K.; Okuyama, E.; Fujimoto, H.; Ishibashi, M.; Yesilada, E. Prostaglandin inhibitory and antioxidant components of Cistus laurifolius, a Turkish medicinal plant. J. Ethnopharmacol 2006, 108, 371–378. [Google Scholar] [CrossRef]
- Kong, L.D.; Abliz, Z.; Zhou, C.X.; Li, L.J.; Cheng, C.H.K.; Tan, R.X. Glycosides and xanthine oxidase inhibitors from Conyza bonariensis. Phytochemistry 2001, 58, 645–651. [Google Scholar] [CrossRef]
- Sadik, C.D.; Sies, H.; Schewe, T. Inhibition of 15-lipoxyigenase by flavonoids: structure-activity relations and mode of action. Biochem. Pharmacol. 2003, 65, 773–781. [Google Scholar] [CrossRef]
- Al-Fayez, M.; Cai, H.; Tunstall, R.; Steward, W.P.; Gescher, A.J. Differential modulation of cyclooxygenase-mediated prostaglandin production by the putative cancer chemopreventive flavonoids tricin, apigenin and quercetin. Cancer Chemother. Pharmacol. 2006, 58, 816–825. [Google Scholar] [CrossRef]
- Li, Y.; But, P.P.H.; Ooi, V.E.C. Antiviral activity and mode of action of caffeoylquinic acids from Schefflera heptaphylla (L.) Frodin. Antiviral Res. 2005, 68, 1–9. [Google Scholar] [CrossRef]
- Sousa, A.; Ferreira, I.C.F.R.; Calhelha, R.; Andrade, P.B.; Valentão, P.; Saebra, R.; Estevinho, L.; Bento, A.; Pereira, J.A. Phenolics and antimicrobial activity of traditional stoned table olives ‘alcaparra’. Bioorg. Med. Chem. 2006, 14, 8533–8538. [Google Scholar] [CrossRef]
- Kim, K.H.; Kim, Y.H.; Lee, K.R. Isolation of quinic acid derivatives and flavonoids from the aerial parts of Lactuca indica L. and their hepatoprotective activity in vitro. Bioorg. Med. Chem. Lett. 2007, 17, 6739–6743. [Google Scholar] [CrossRef]
- Oh, H.; Kim, D.H.; Cho, J.H.; Kim, Y.C. Hepatoprotective and free radical scavenging activities of phenolic petrosins and flavonoids isolated from Equisetum arvense. J. Ethnopharmacol. 2004, 95, 421–424. [Google Scholar] [CrossRef]
- Innocenti, G.; Vegeto, E.; Dall’Acqua, S.; Ciana, P.; Giorgetti, M.; Agardi, E.; Sozzi, A.; Fico, G.; Tomè, F. In vitro estrogenic activity of Achillea millefolium L. Phytomedicine 2007, 14, 147–152. [Google Scholar] [CrossRef]
- Hamauzu, Y.; Irie, M.; Kondo, M.; Fujita, T. Antiulcerative properties of crude poloyphenols and juice of apple, and Chinese quince extracts. Food Chem. 2008, 108, 488–495. [Google Scholar] [CrossRef]
- Ha, C.L.; Weng, C.Y.; Wang, L.; Lian, T.W.; Wu, M.J. Immunomodulatory effect of Glossogyne tenuifolia in murine peritoneal macrophages and splenocytes. J. Ethnopharmacol. 2006, 107, 116–125. [Google Scholar] [CrossRef]
- Chiang, L.C.; Ng, L.T.; Lin, I.C.; Kuo, P.L.; Lin, C.C. Studies on anti-complementary activity of extracts and isolated flavones from Ligustrum vulgare and Phyllyrea latifolia leaves (Oleaceae). Cancer Lett. 2006, 237, 207–214. [Google Scholar] [CrossRef]
- Vargo, M.A.; Voss, O.H.; Poustka, F.; Cardounel, A.J.; Grotewold, E.; Doseff, A.I. Apigenin-induced-apoptosis is mediated by the activation of PKCδ and caspases in leukaemia cells. Biochem. Pharmacol. 2006, 72, 681–692. [Google Scholar] [CrossRef]
- Stobiecki, M. Application of mass spectrometry for identification and structural studies of flavonoid glycosides. Phytochemistry 2000, 54, 237–256. [Google Scholar] [CrossRef]
- March, R.E.; Lewars, E.G.; Stadey, C.J.; Miao, X.S.; Zhao, X.; Metcalfe, C.D. A comparison of flavonoid glycosides by electrospray tandem mass spectrometry. Int. J. Mass Spectrom. 2006, 248, 61–85. [Google Scholar] [CrossRef]
- Tolonen, A.; Uusitalo, J. Fast screening method for the analysis of total flavonoid content in plants and foodstuffs by high-performance liquid chromatography/electrospray ionization time of flight mass spectrometry with polarity switching. Rapid Commun. Mass Spectrom. 2004, 18, 3113–3122. [Google Scholar] [CrossRef]
- De Rijke, E.; Zappey, H.; Ariese, F.; Gooijer, C.; Brinkman, U.A. Th. Liquid chromatography with atmospheric pressure chemical ionization and electrospray ionization mass spectrometry of flavonoids with triple-quadrupole and ion trap instruments. J. Chromatogr. A 2003, 984, 45–48. [Google Scholar] [CrossRef]
- Shi, P.; He, Q.; Song, Y.; Qu, H.; Cheng, Y. Characterization and identification of isomeric flavonoid O-diglycosides from genus Citrus in negative electrospray ionization by ion trap mass spectrometry and time-of-flight mass spectrometry. Anal. Chim. Acta 2007, 598, 110–118. [Google Scholar] [CrossRef]
- Jin, Y.; Xiao, Y.S.; Zhang, F.F.; Xue, X.Y.; Xu, Q.; Liang, X.M. Systematic screening and characterization of flavonoid glycosides in Carthamus tinctorius L. by liquid chromatography/UV diode-array detection/electrospray ionization tandem mass spectrometry. J. Pharm. Biomed. Anal. 2008, 46, 418–430. [Google Scholar] [CrossRef]
- Su, J.; Fu, P.; Shen, Y.; Zhang, C.; Liang, M.; Liu, R.; Li, H.; Zhang, W. Simultaneous analysis of flavonoids from Hypericum japonicum Thunb.ex Murray (Hypericaceae) by HPLC-DAD-ESI/MS. J. Pharm. Biomed. Anal. 2008, 46, 342–348. [Google Scholar] [CrossRef]
- Huges, R.J.; Croley, T.R.; Metcalfe, C.D.; March, R.E. A tandem mass spectrometric study of selected characteristic flavonoids. Int. J. Mass Spectrom. 2001, 210/211, 371–385. [Google Scholar] [CrossRef]
- Cuyckens, F.; Claeys, M. Mass spectrometry in the structural analysis of flavonoids. J. Mass Spectrom. 2004, 39, 1–15. [Google Scholar] [CrossRef]
- Ma, Y.L.; Li, Q.M.; Van den Heuvel, H.M.; Claeys, M. Characterization of flavone and flavonol aglycones by collision-induced dissociation tandem mass spectrometry. Rapid Commun. Mass Spectrom. 1997, 11, 1357–1364. [Google Scholar] [CrossRef]
- Domon, B.; Catello, C.E. A systematic nomenclature for carbohydrate fragmentations in FAB-MS/MS spectra of glycoconjugates. Glycoconj. J. 1988, 5, 397–409. [Google Scholar] [CrossRef]
- Clifford, M.N.; Johnston, K.L.; Knight, S.; Kuhnert, N. Hierarchical scheme for LC-MSn identification of chlorogenic acids. J. Agric. Food Chem. 2003, 51, 2900–2911. [Google Scholar] [CrossRef]
- Clifford, M.N.; Knight, S.; Kuhnert, N. Discrimating between the six isomers of dicaffeoylquinic acids by LC-MSn. J. Agric. Food Chem. 2005, 53, 3821–3832. [Google Scholar] [CrossRef]
- Clifford, M.N.; Kirkpatrick, J.; Kuhnert, N.; Roorendaal, H.; Salgado, P.R. LC-MSn analysis of the cis isomers of chlorogenic acids. Food Chem. 2008, 106, 379–385. [Google Scholar] [CrossRef]
- Markham, K.R. Techniques of flavonoid identification; Academic Press: New York, NY, USA, 1982; pp. 36–51. [Google Scholar]
- Tatsis, E.C.; Boeren, S.; Exarchou, V.; Troganis, A.N.; Vervoort, J.; Gerothanassis, I.P. Identification of the major constituents of Hypericum perforatum by LC/SPE/NMR and/or LC/MS. Phytochemistry 2007, 68, 383–393. [Google Scholar] [CrossRef]
- Exarchou, V.; Godejohann, M.; van Beek, T.; Gerothanassis, I.P.; Vervoort, J. LC-UV-solid-phase extraction-NMR-MS combined with a cryogenic flow probe and its application to the identification of compounds present in Greek oregano. Anal. Chem. 2003, 75, 6288–6294. [Google Scholar] [CrossRef]
- Bucar, F.; Ninov, S.; Ionkova, I.; Karting, T.; Schubert-Zsilavecz, M.; Asenov, I.; Konuklugil, B. Flavonoids from Phlomis nissolii. Phytochemistry 1998, 48, 573–575. [Google Scholar] [CrossRef]
- Exarchou, V.; Krucker, M.; van Beek, T.A.; Vervoort, J.; Gerothanassis, I.P.; Albert, K. LC-NMR coupling technology: recent advancements and applications in natural products analysis. Magn. Reson. Chem. 2005, 43, 681–687. [Google Scholar] [CrossRef]
- Sample Availability: Samples of the compounds are available from the corresponding author.
© 2009 by the authors; licensee Molecular Diversity Preservation International, Basel, Switzerland. This article is an open-access article distributed under the terms and conditions of the Creative Commons Attribution license ( http://creativecommons.org/licenses/by/3.0/).
Share and Cite
Plazonić, A.; Bucar, F.; Maleš, Ž.; Mornar, A.; Nigović, B.; Kujundžić, N. Identification and Quantification of Flavonoids and Phenolic Acids in Burr Parsley (Caucalis platycarpos L.), Using High-Performance Liquid Chromatography with Diode Array Detection and Electrospray Ionization Mass Spectrometry. Molecules 2009, 14, 2466-2490. https://doi.org/10.3390/molecules14072466
Plazonić A, Bucar F, Maleš Ž, Mornar A, Nigović B, Kujundžić N. Identification and Quantification of Flavonoids and Phenolic Acids in Burr Parsley (Caucalis platycarpos L.), Using High-Performance Liquid Chromatography with Diode Array Detection and Electrospray Ionization Mass Spectrometry. Molecules. 2009; 14(7):2466-2490. https://doi.org/10.3390/molecules14072466
Chicago/Turabian StylePlazonić, Ana, Franz Bucar, Željan Maleš, Ana Mornar, Biljana Nigović, and Nikola Kujundžić. 2009. "Identification and Quantification of Flavonoids and Phenolic Acids in Burr Parsley (Caucalis platycarpos L.), Using High-Performance Liquid Chromatography with Diode Array Detection and Electrospray Ionization Mass Spectrometry" Molecules 14, no. 7: 2466-2490. https://doi.org/10.3390/molecules14072466