Article

Determination of Ascorbic Acid Content of Some Fruit Juices and Wine by Voltammetry Performed at Pt and Carbon Paste Electrodes

by
Aurelia Magdalena Pisoschi
1,*,
Aneta Pop
1,
Gheorghe Petre Negulescu
1 and
Aurel Pisoschi
2
1
Chemistry and Biochemistry Department, University of Agronomic Sciences and Veterinary Medicine of Bucharest, 59, Marasti Street, 011464, Bucharest, Romania
2
Faculty of Natural Sciences, Vasile Goldis Western University, 94, Revolutiei Avenue, Arad, Romania
*
Author to whom correspondence should be addressed.
Molecules 2011, 16(2), 1349-1365; https://doi.org/10.3390/molecules16021349
Submission received: 29 December 2010 / Revised: 7 January 2011 / Accepted: 21 January 2011 / Published: 1 February 2011

Abstract

:
A method was developed for assessing ascorbic acid concentration in fruit juices and wine by differential pulse voltammetry. The oxidation peak for ascorbic acid occurs at about 530 mV (versus SCE) on a Pt strip working electrode and at about 470 mV on a carbon paste working electrode. The influence of the operational parameters like the pulse amplitude and the pulse period on the analytical signal was investigated. The obtained calibration graph shows a linear dependence between the peak height and ascorbic acid concentration within the range 0.31-20 mM with a Pt working electrode, and within the range 0.07-20 mM with a carbon paste working electrode. The equation of the calibration graph was y = 21.839x + 35.726, r2 = 0.9940, when a Pt strip electrode was used (where y represents the value of the current intensity measured for the peak height, expressed as µA and x the analyte concentration, as mM). R.S.D. = 2.09%, n = 10, Cascorbic acid = 2.5 mM. The equation of the calibration graph was y = 3.4429x + 5.7334, r2 = 0.9971, when a carbon paste electrode was used (where y represents the value of intensity measured for the peak height, expressed as µA and x the analyte concentration, as mM). R.S.D. = 2.35%, n = 10, Cascorbic acid = 2.5 mM. The developed method was applied to ascorbic acid assessment in fruit juices and wine. The ascorbic acid content determined ranged between 6.83 mg/100 mL juice for soft drinks (Fanta Madness) and 54.74 mg/100 mL for citrus (lemon) juices obtained by squeezing fruit. Different ascorbic acid concentrations (from standard solutions) were added to the analysed samples, the degree of recovery being comprised between 94.74 and 104.97%. The results of ascorbic acid assessment by differential pulse voltammetry were compared with those obtained by cyclic voltammetry. The results obtained by the two methods were in good agreement.

1. Introduction

Vitamin C is a water-soluble, antioxidant vitamin. It is important in forming collagen, a protein that gives structure to bones, cartilages, muscles, and blood vessels. Vitamin C also aids in the absorption of iron, and helps maintain capillaries, bones, and teeth. It is the most common electroactive biological compound and one of the most ubiquitous vitamins ever discovered. Rich sources include blackcurrant, citrus fruit, leafy vegetables, tomatoes, green and red peppers. Ascorbic acid is known for its reductive properties. Hence, it is used on a large scale as antioxidant in food and drinks [1]. Due to its content variation caused by the thermal lability, vitamin C represents an important quality indicator that contributes to the antioxidant properties of food [2,3].
Traditional methods for ascorbic acid assessment involve titration with an oxidant solution: dichlorophenol indophenol (DCPIP) [4], potassium iodate [5] or bromate [6]. Chromatographic methods, particularly HPLC with electrochemical detection [7], has turned out to be a selective and sensitive method for ascorbic acid assessment in foodstuffs and biological fluids. Fluorimetric methods [8,9] and UV-VIS absorbance-based determinations [10] were also used for ascorbic acid estimation.
The use of a carbon nanotube/ferritin film in the construction of an amperometric biosensor allows the determination of ascorbic acid with a sensitivity of 767 µA/mg (for a 1 mmole L-1 vitamin C solution). The ferritin protein bound to single-wall carbon nanotubes enhances the oxidation reaction of ascorbic acid over 11-fold [11].
A biosensor based on laccase immobilized on an electrode modified with a self-assembled monolayer, allowed ascorbic acid determination with a detection limit of 1.4 nM [12]. Oxygen permeable hydrophobic ascorbate oxidase micelle membranes were coated on both aminated glassy carbon electrode and gold electrode for the amperometric detection of ascorbic acid, based on the consumption of oxygen. These biosensors have good sensitivities with short response time (within 1 min.) [13]. An amperometric biosensor was developed for ascorbic acid determination in fruit juices, by immobilizing ascorbate oxidase on a nylon membrane, which was fixed on a Clark-type transducer [14].
A recently developed voltammetric methods allow rapid, simple, selective and sensitive determination of low molecular weight antioxidants and vitamins (e.g., ascorbic acid) and drugs, without the necessity of time consuming separation [1,15].
Square-wave voltammetry was used to determine ascorbic acid, based on its oxidation at a zeolite modified carbon paste electrode [16]. Cyclic and differential pulse voltammetry were used for electrocatalytical ascorbic acid determination, at a carbon paste electrode, modified with 2,7-bis (ferrocenylethynyl)fluoren-9-one [17]. Cyclic voltammetry at a bare Pt electrode was applied to ascorbic acid content estimation in citrus juices and soft drinks [18].
The electrochemical oxidation and selective determination of ascorbic acid in pharmaceutical dosage forms and in some Rosa species was investigated by cyclic, differential pulse and square-wave voltammetry [1]. The linear response was obtained in the range 3.52-176.1 μg mL-1, with a detection limit of 0.88 μg mL-1 for DPV and 0.52 μg mL-1 for SWV.
Cyclic voltammetry studies performed on Pt electrodes proved that the growth of Pt surface oxides and the anodic response of a variety of interferrents (glucose, cystine, oxalate) was greatly surpressed by the use of fluorosurfactant-modified Pt electrodes [19]. Ascorbic acid was determined in the presence of SO2 and acetaldehyde by pulsed voltammetry at interdigitated Pt microelectrodes [20].
Ascorbic acid, uric acid and dopamine were simultaneously determined by differential pulse voltammetry, performed on a glassy carbon electrode modified with a film of poly (3-(5-chloro-2-hydroxyphenylazo)-4,5-dihydroxynaphtalene-2,7-disulphonic acid [21]. Differential pulse voltammetry was used for the assessment of ascorbic acid, at poly (3,4-ethylendioxythiophene)- modified electrodes [22].
Simultaneous determination of vitamins C, B6 and PP in pharmaceuticals formulations was performed using differential pulse voltammetry at a glassy carbon electrode [23]. Differential pulse voltammetry at a glassy carbon electrode was also employed for the analytical characterization and measuring of predominant flavonoid and phenolic acids [24].
Dopamine was determined in the presence of ascorbic and uric acids by differential pulse voltammetry at a bare glassy carbon electrode [25]. Simultaneous determination of vitamin C and uric acid was also possible with a ferrocenium-thioglycollate modified electrode. Under the optimal conditions and within the linear range of 1 × 10⁻⁶ M to 5 × 10⁻⁴ M, the achieved detection limits for ascorbic acid and uric acid were 2 × 10⁻⁷ M and 1 × 10⁻⁷ M, respectively [26].
A differential pulse voltammetric method at a glassy carbon working electrode was also developed for the determination of Silymarin/vitamin E acetate mixture in pharmaceuticals [27]. The linear analytical response was obtained in the range 0.1-4.0 mg L-1, with a detection limit of 0.03 mg L-1 for Silymarin, and 0.05-4.0 mg L-1 with a detection limit of 0.01 mg L-1 for vitamin C acetate [27]. A multi-walled carbon nanotubes-tetradecyltrimethylammonium bromide film coated graphite electrode was used to study the electrooxidation of ascorbic acid in differential pulse, cyclic and square-wave voltammetry [28]. A linear voltammetric response for vitamin C was obtained for the concentration range 5 × 10⁻⁷-1.7 × 10⁻⁴ M, with a detection limit for ascorbic acid of 1.1 × 10⁻⁷ M, using DPV [28].
The electrocatalytic oxidation of ascorbic acid (cyclic and differential pulse voltammetry) was investigated with a carbon nanotube paste electrode modified with 2,2’-[1,2-ethanediylbis (nitriloethylidine)]-bis-hydroquinone [29]. Using DPV, the calibration curves for ascorbic acid and uric acid were obtained over the ranges 0.1-800 μM and 20-700 μM, respectively [29]. Differential pulse voltammetry with a poly(sulfonazo III) modified glassy carbon electrode enables the highly selective determination of ascorbic acid, dopamine and uric acid [30].
Cyclic voltammetry and differential pulse voltammetry at a binuclear copper complex modified glassy carbon electrode were also applied to determine ascorbic acid and dopamine [31]. Linear analytical curves were obtained in the ranges 2.0-120.0 µM for dopamine and 5.0-160.0 µM for ascorbic acid, using DPV. The detection limits were 1.4 × 10⁻⁶ M for dopamine and 2.8 × 10⁻⁶ M for ascorbic acid [31]. The modified electrode was used for ascorbic acid and dopamine determination in medicine and foodstuffs [31].
Ascorbic acid and dopamine were determined simultaneously by differential pulse voltammetry performed at a boron-dopped diamond film electrode [32] or on the surface of electrodes modified with self assembled gold nanoparticles film [33]. The linear analytical curves were obtained in the ranges 0.3-1.4 mM for ascorbic acid and 0.2-1.2 mM for dopamine. The detection limit (3σ) was 9.0 × 10⁻⁵ M for both dopamine and ascorbic acid [33]. Differential pulse voltammetry at a glassy carbon electrode was applied to quantitative determination of ascorbic acid in tablet dosage form and in some fruit juices [34].
The simultaneous assessment of ascorbic acid and acetaminophen was investigated by differential pulse voltammetry and cyclic voltammetry, performed on a boron-doped diamond electrode, using sodium sulphate as supporting electrolyte [35]. Fouling of the electrode was not reported. Relative standard deviations of 2-3%, high sensitivity values and low detection limits (10-6M order of magnitude) were obtained [35].
This study aims at investigating the ascorbic acid determination by differential pulse voltammetry at Pt strip and carbon paste working electrodes. The developed method was applied to ascorbic acid content assessment in juices and wine. The results were compared to those obtained by cyclic voltammetry, performed at both Pt and carbon paste electrodes.

2. Results and Discussions

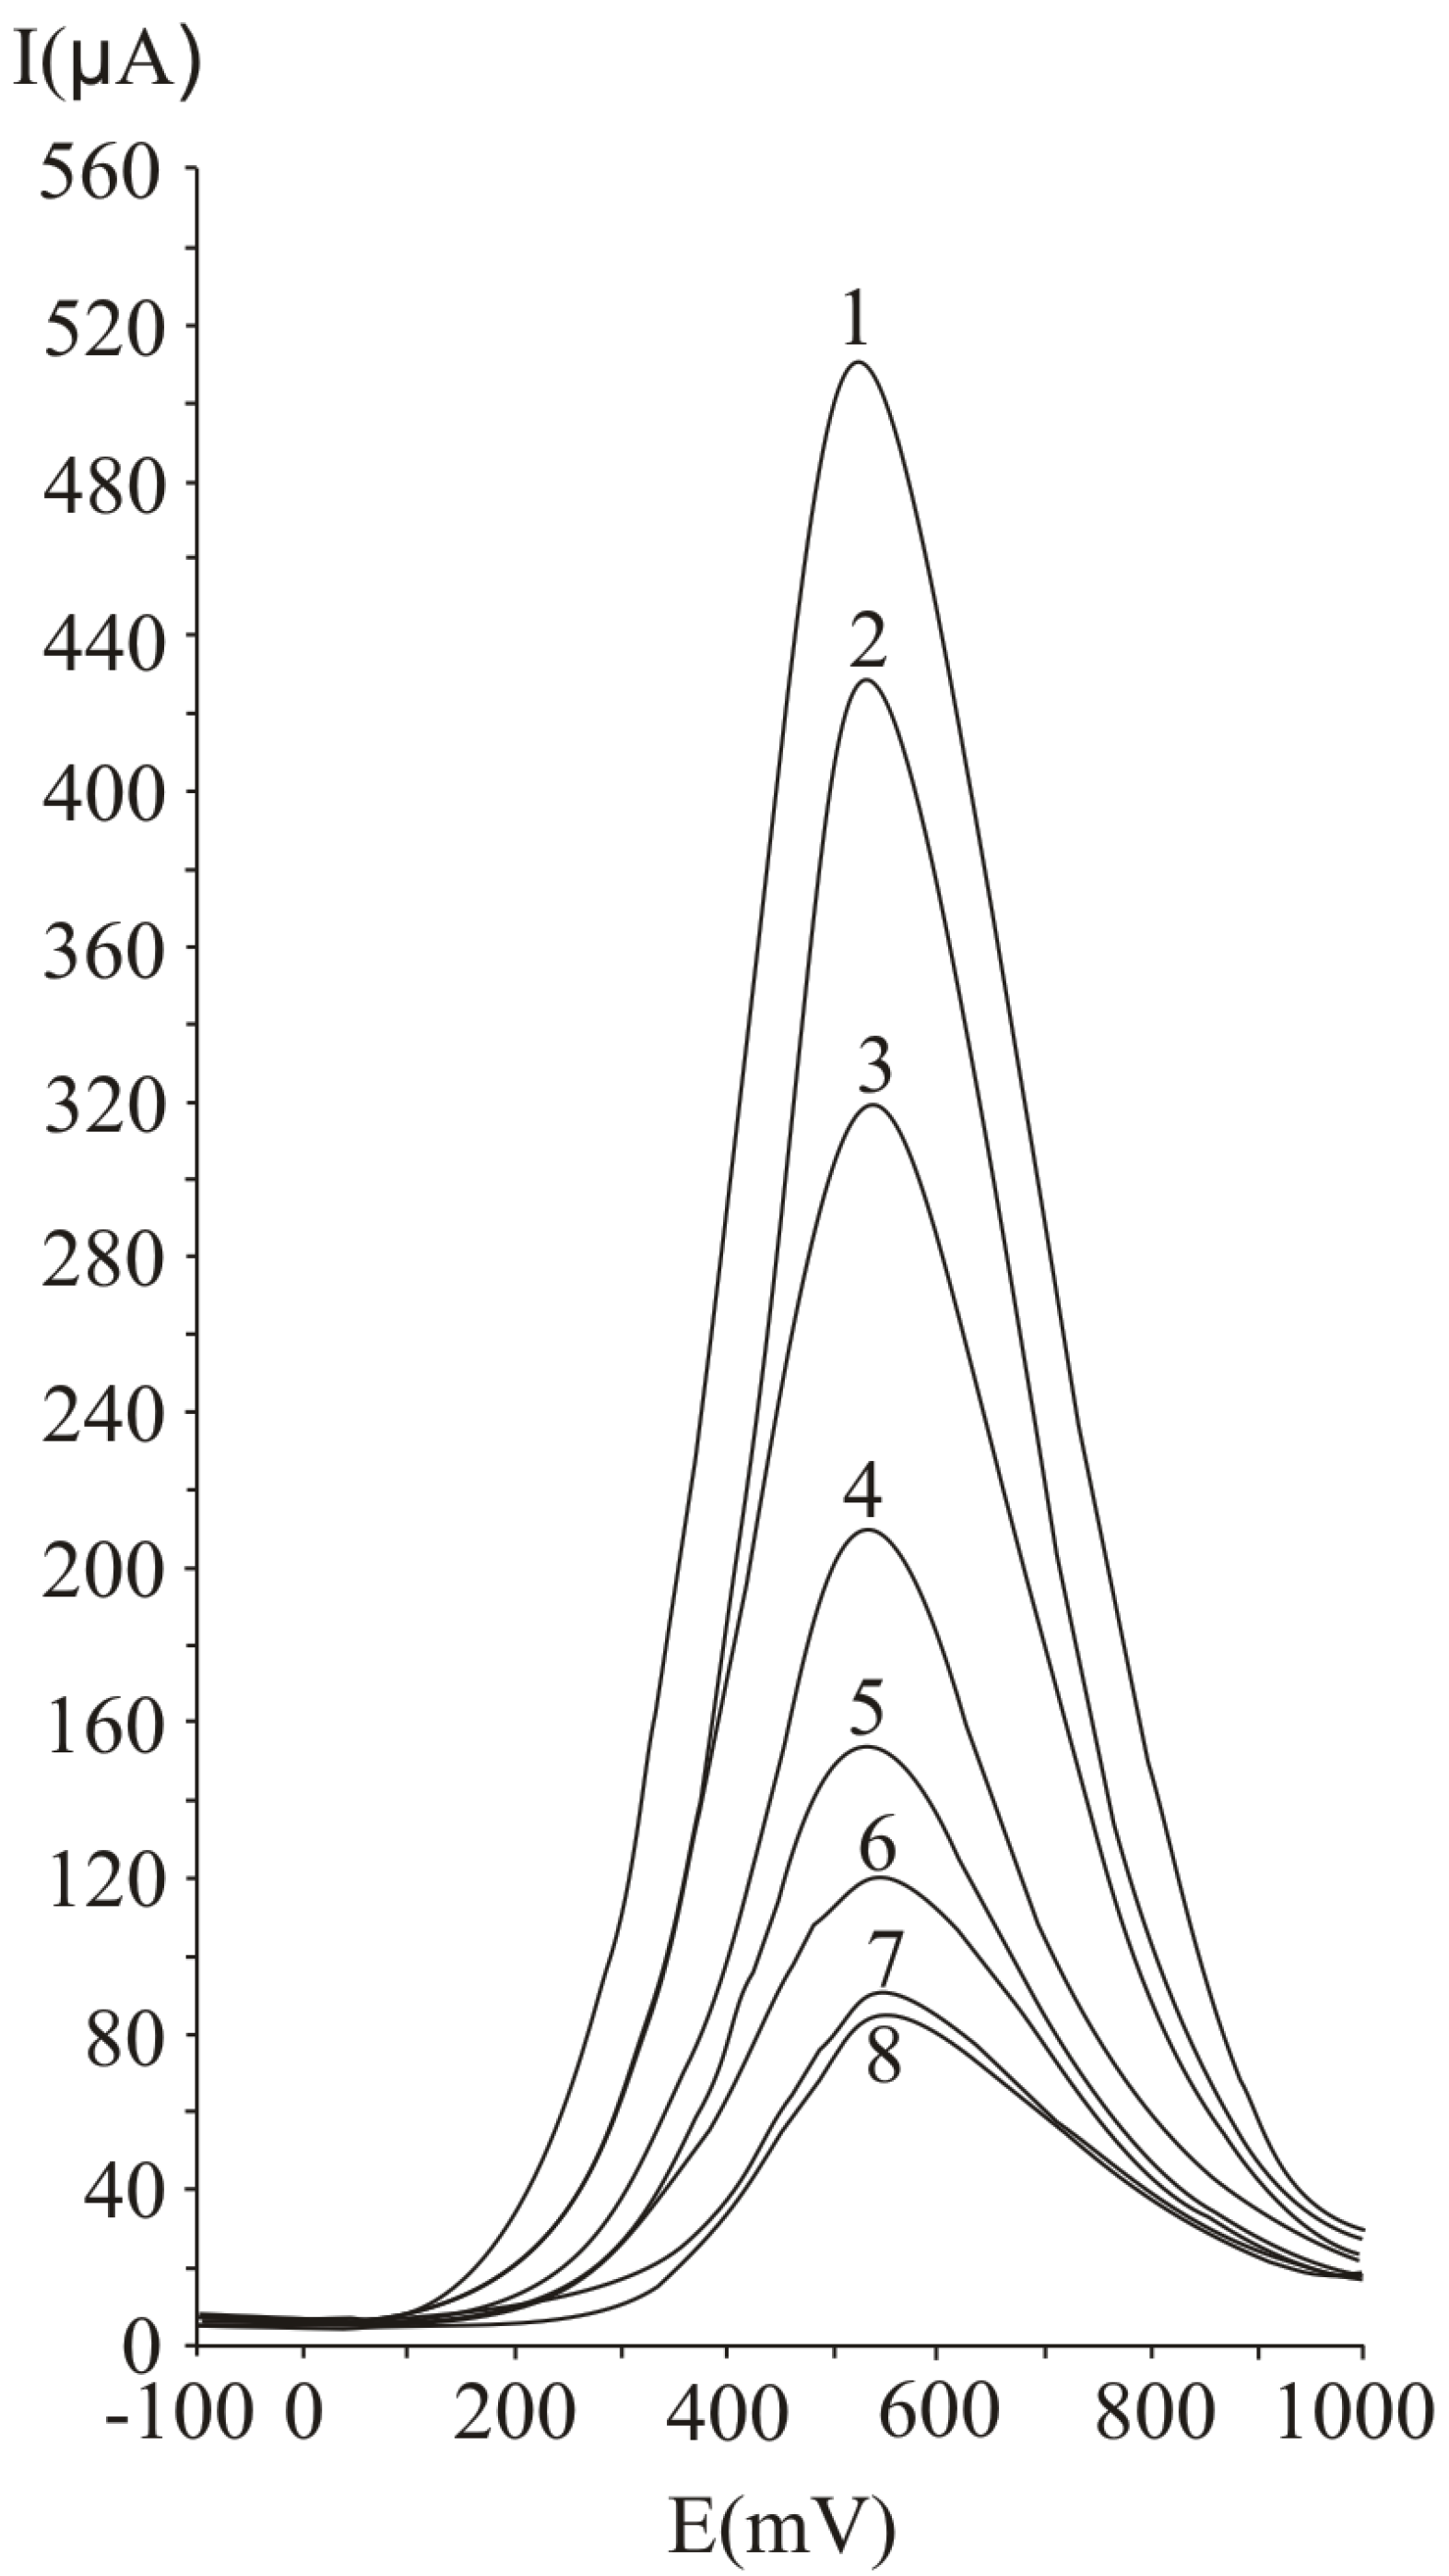
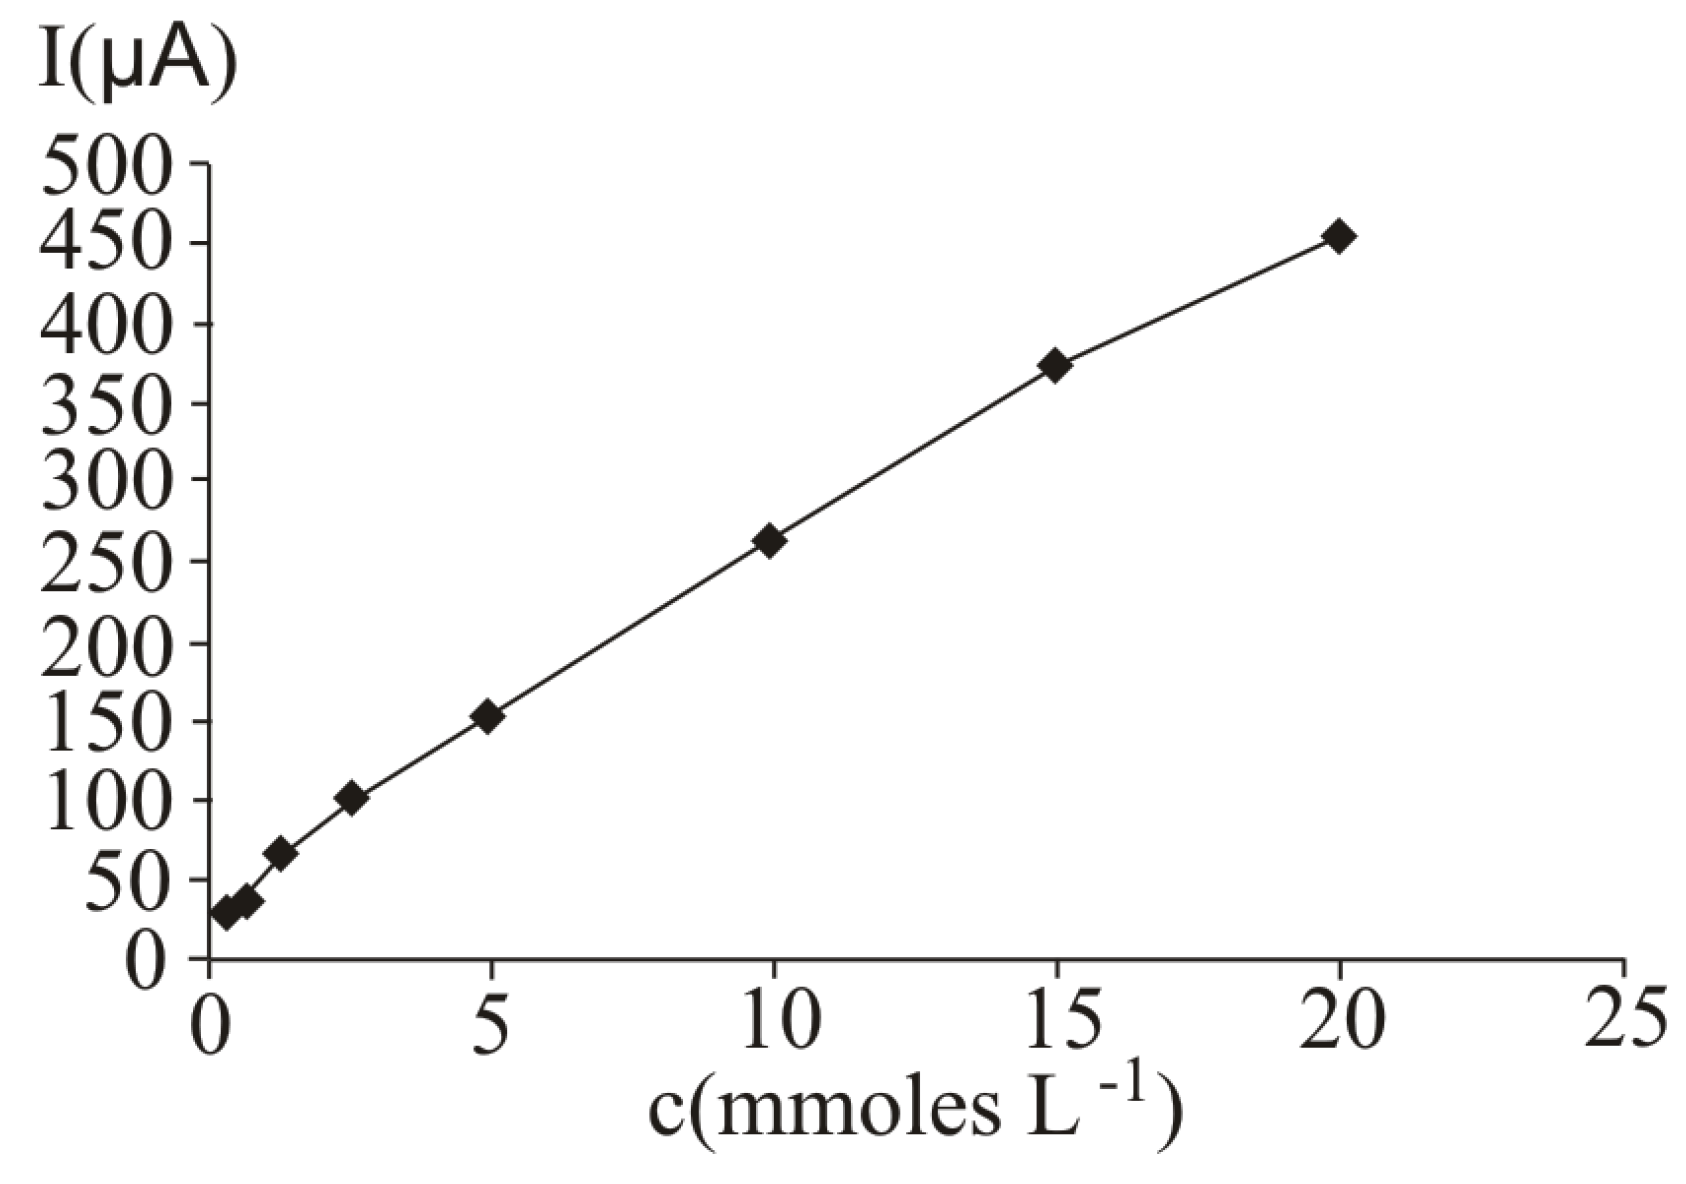
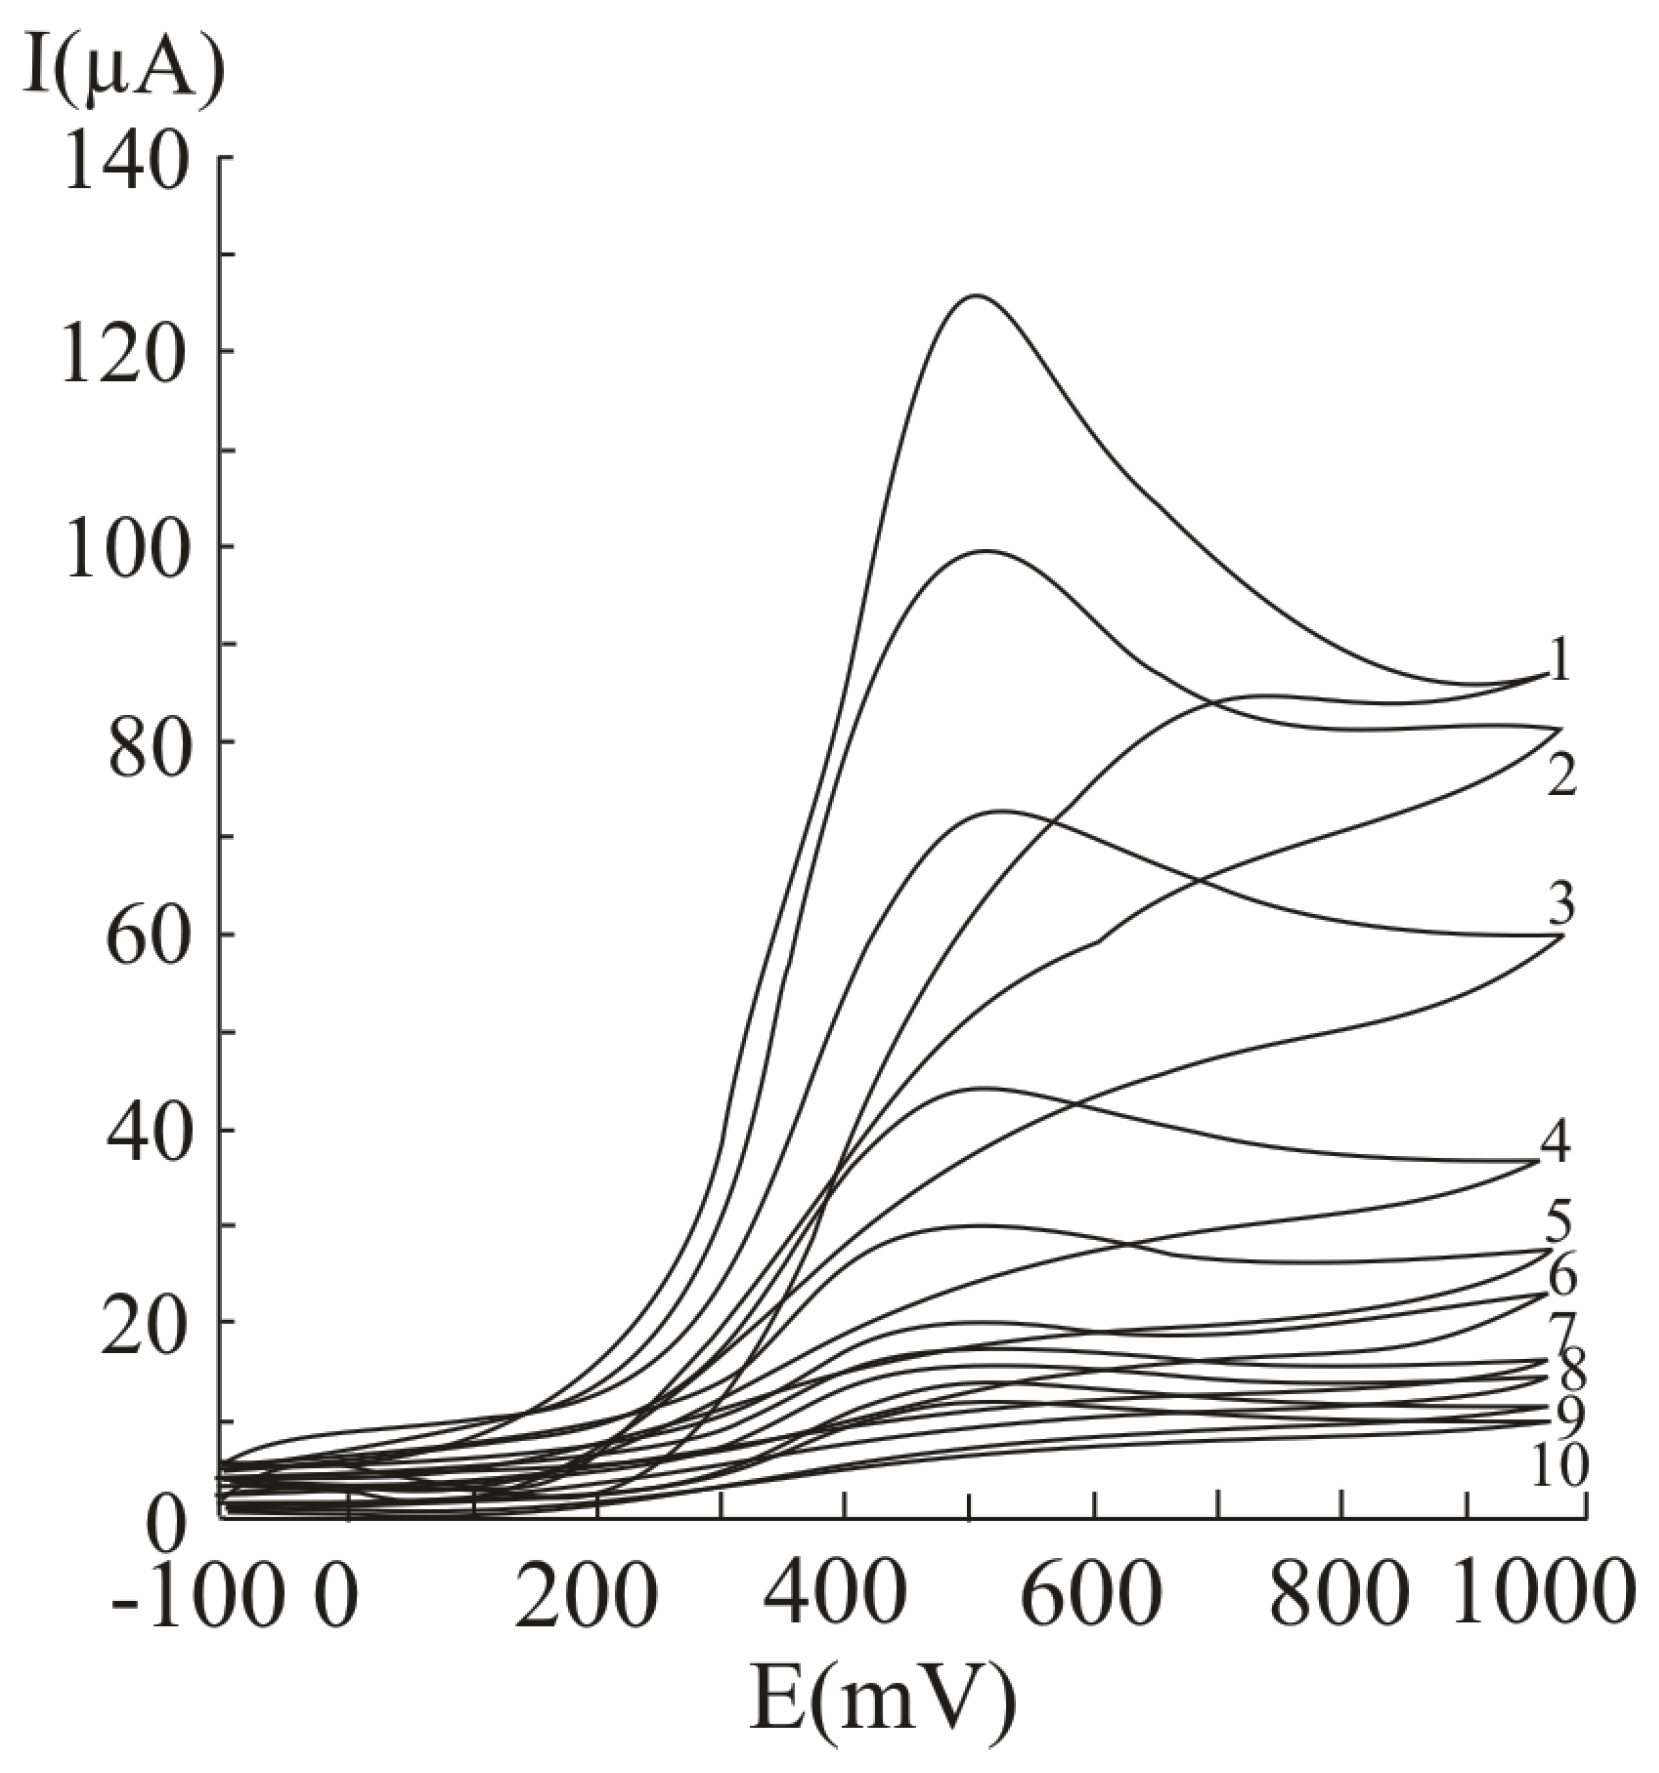
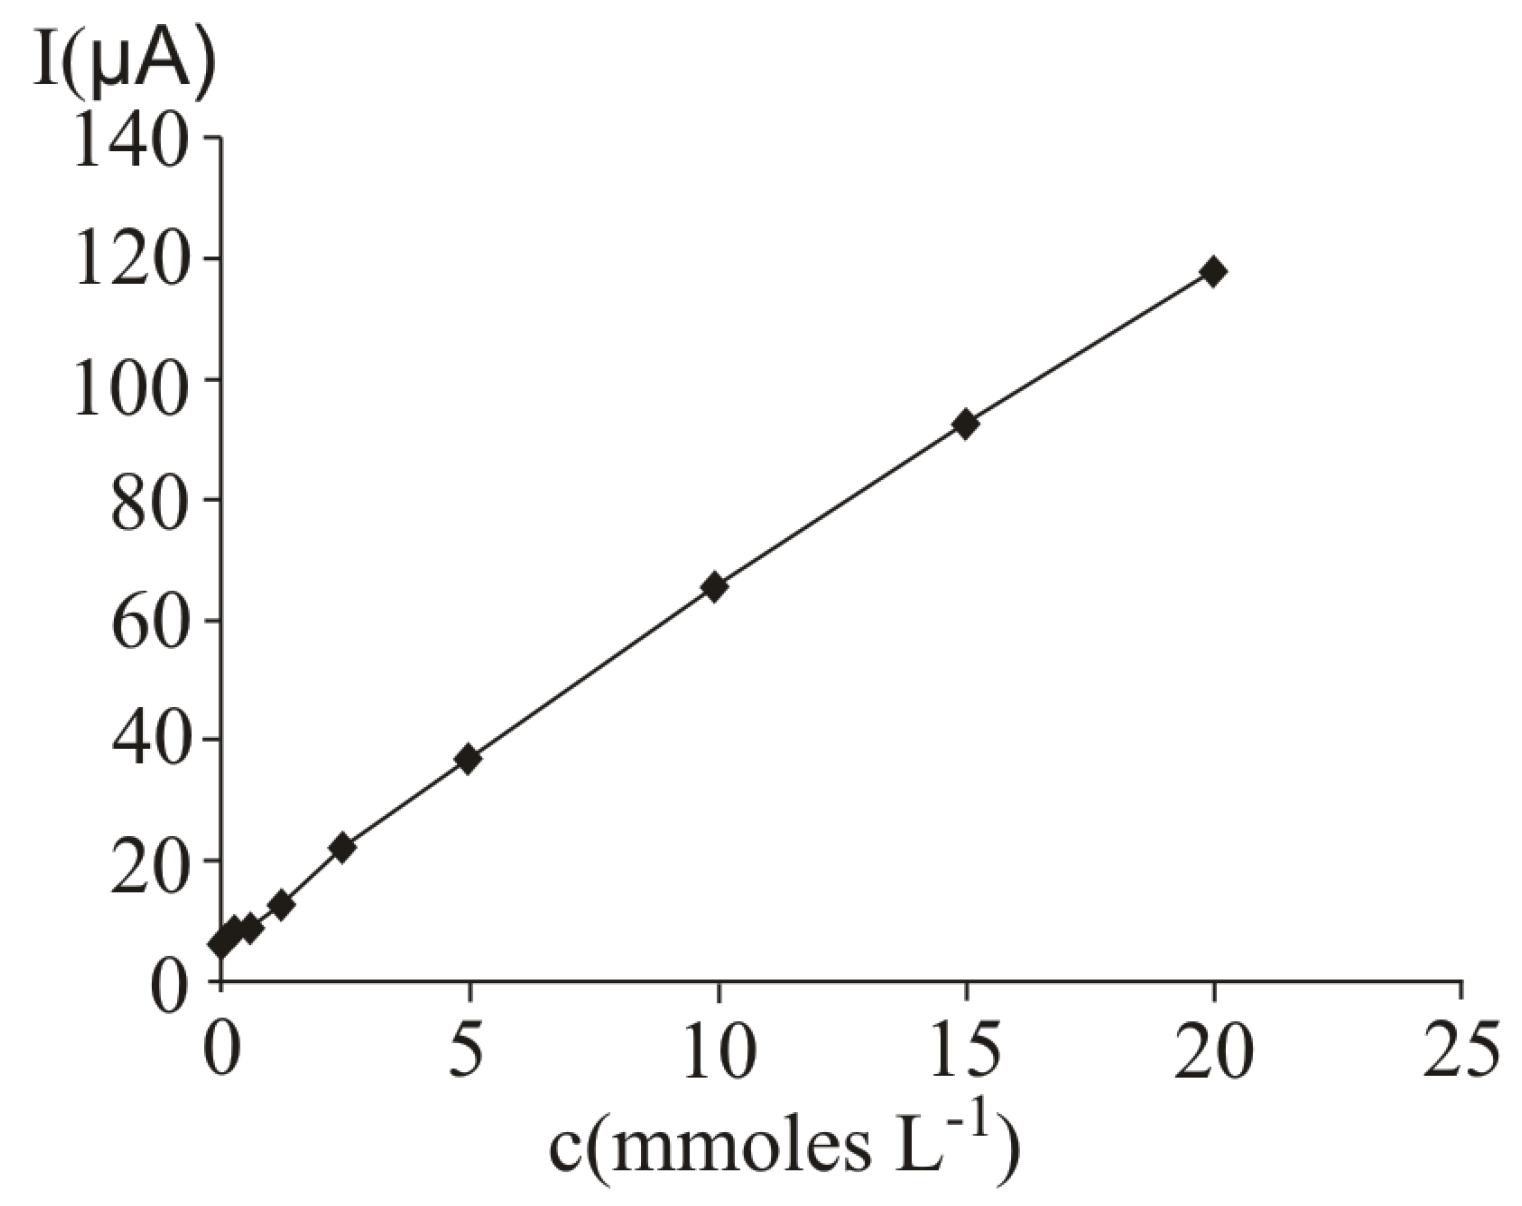
2.1. Voltammetric studies performed at a Pt working electrode

In Figure 1, several differential pulse voltammograms, obtained obtained at a Pt working electrode, for different ascorbic acid concentrations, are presented. The peak corresponding to ascorbic acid oxidation appeared at 530 mV (versus SCE). The calibration graph (Figure 2) shows a linear range obtained between 0.31 and 20 mM ascorbic acid, (y = 21.839x + 35.726, r2 = 0.9940, where y represents the value of the current intensity, from which the background value was substracted and x the analyte concentration). The value calculated for the relative standard deviation R.S.D. was 2.09%, (c = 2.5 mM ascorbic acid; n = 10). The values obtained for the limit of detection and the limit of quantification were 0.087 mM and 0.29 mM respectively.
The detection limit was calculated as LOD = 3 s/m, where s represents the square mean error calculated for 10 determinations of the blank and m represents the slope of the calibration graph. The limit of quantification was calculated as LOD = 10 s/m, where s and m were given above.
The influences of the pulse amplitude and pulse period on the analytical peak height were also investigated. The measurements were performed at 10 mM ascorbic acid concentration, at a 50 mV s-1 potential scan rate.
Figure 1. Differential pulse voltammograms obtained with a Pt working electrode for different ascorbic acid concentrations, expressed as mM: 20 (1), 15 (2), 10 (3), 5 (4), 2.5 (5), 1.25 (6), 0.625 (7) and 0.31 (8); experimental conditions: pulse amplitude 75 mV, pulse period 125 ms, potential scan rate 50 mV/s.
Molecules 16 01349 g001
Figure 2. Calibration graph obtained at ascorbic acid determination by differential pulse voltammetry at a Pt working electrode; for experimental conditions see Figure 1.
Molecules 16 01349 g002
For the investigation of the influence of the pulse amplitude on the analytical signal (Figure 3), we varied this parameter between 25 and 150 mV, at 100 ms pulse period and 50 mV/s potential scan rate. By analysing the results presented in Figure 3, it can be noticed that the value of the measured current intensity increases with the applied pulse amplitude. An optimum value of 75 mV was chosen for further studies and for real sample analysis. Greater values of the pulse amplitude were not employed, in order to avoid the decrease of resolution.
Figure 3. Influence of the pulse amplitude on the analytical response at ascorbic acid determination by differential pulse voltammetry, at a Pt working electrode; 25 mV (1), 50 mV (2), 75 mV (3), 100 mV (4), 125 mV (5) and 150 mV (6); experimental conditions: pulse amplitude 125 ms, potential scan rate 50 mV/s.
Molecules 16 01349 g003
For the investigation of the influence of the pulse period on the analytical signal (Figure 4) we varied this parameter between 25 and 150 mV, at 75 mV pulse amplitude and 50 mV s-1 potential scan rate. The peak height increases with the decrease of the pulse amplitude. The value chosen for further studies was 125 ms. Smaller values of the pulse amplitude were not applied, in order to diminish the influence of noise on the analytical signal, noticeable, namely, at values of the pulse period below 100 ms.
Figure 4. Influence of the pulse period on the analytical signal at ascorbic acid determination by differential pulse voltammetry, at a Pt working electrode; 50 ms (1), 75 ms (2), 100 ms (3), 125 ms (4), 150 ms (5); experimental conditions: pulse amplitude 75 mV, potential scan rate 50 mV/s.
Molecules 16 01349 g004
In Figure 5, several cyclic voltammograms, obtained for different ascorbic acid concentrations, are presented. The peak corresponding to ascorbic acid oxidation appeared at 490 mV (versus SCE). The calibration graph obtained by cyclic voltammetry (Figure 6) shows a linear range obtained between 0.31 and 20 mM ascorbic acid (y = 65.42x + 40.887, r2 = 0.9945, where y represents the value of the current intensity, from which the background value was substracted and x the analyte concentration). The value calculated for R.S.D. was 1.64%, (c = 2.5 mM ascorbic acid; n = 10). The limit of detection and the limit of quantification were 0.075 mM and 0.25 mM respectively.
Figure 5. Cyclic voltammograms obtained with a Pt working electrode for different ascorbic acid concentrations, expressed as mM: 20 (1), 15 (2), 10 (3), 5 (4), 2.5 (5), 1.25 (6), 0.625 (7) and 0.31 (8); potential scan rate 50 mV/s.
Molecules 16 01349 g005
Figure 6. Calibration graph obtained at ascorbic acid determination by cyclic voltammetry at a Pt working electrode; for experimental conditions see Figure 5.
Molecules 16 01349 g006

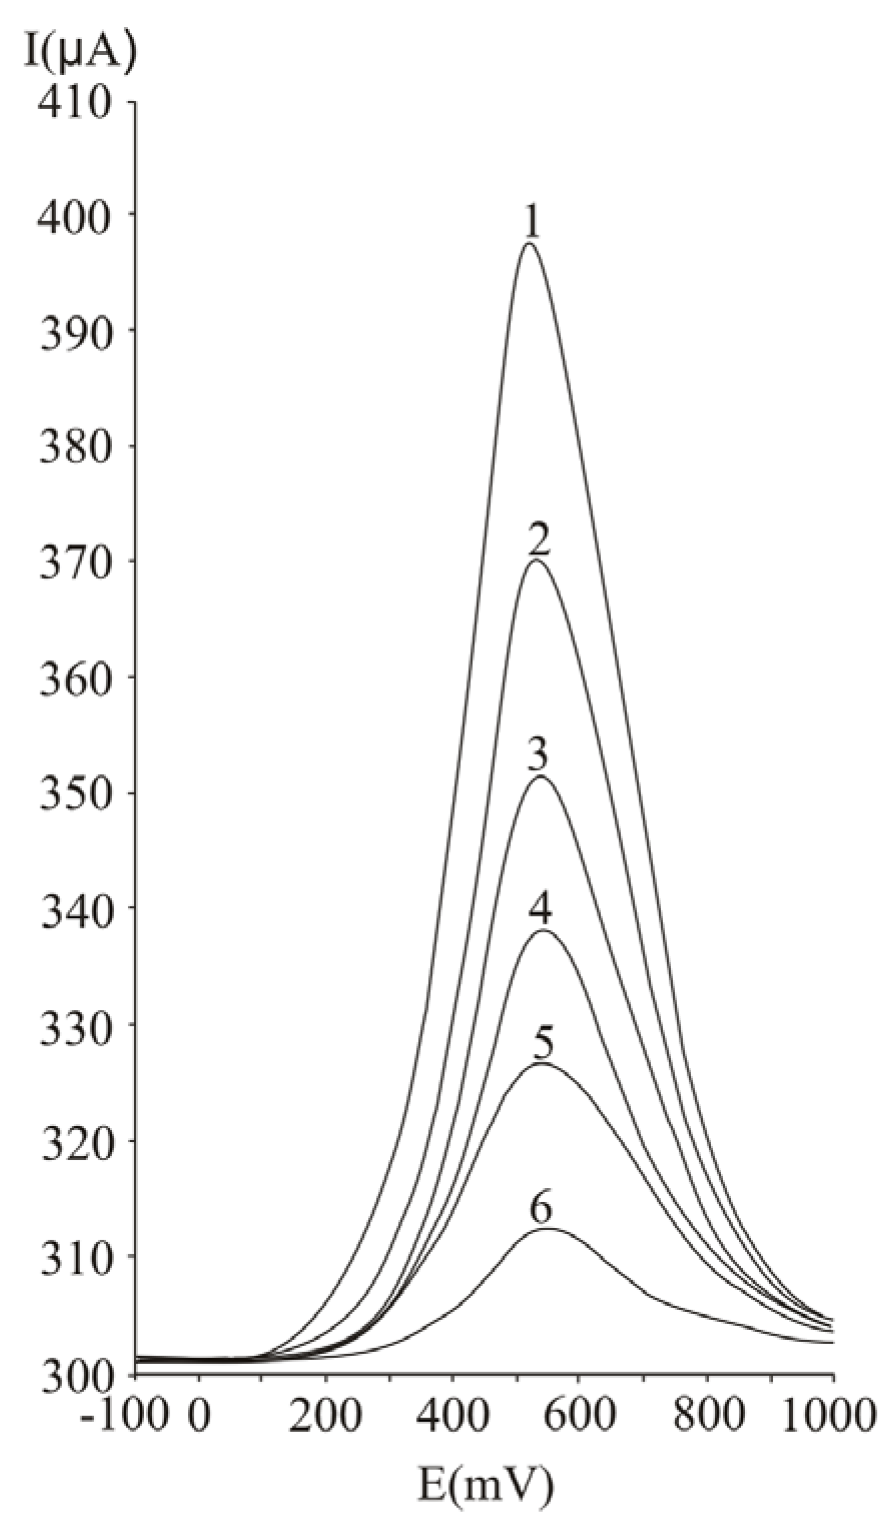
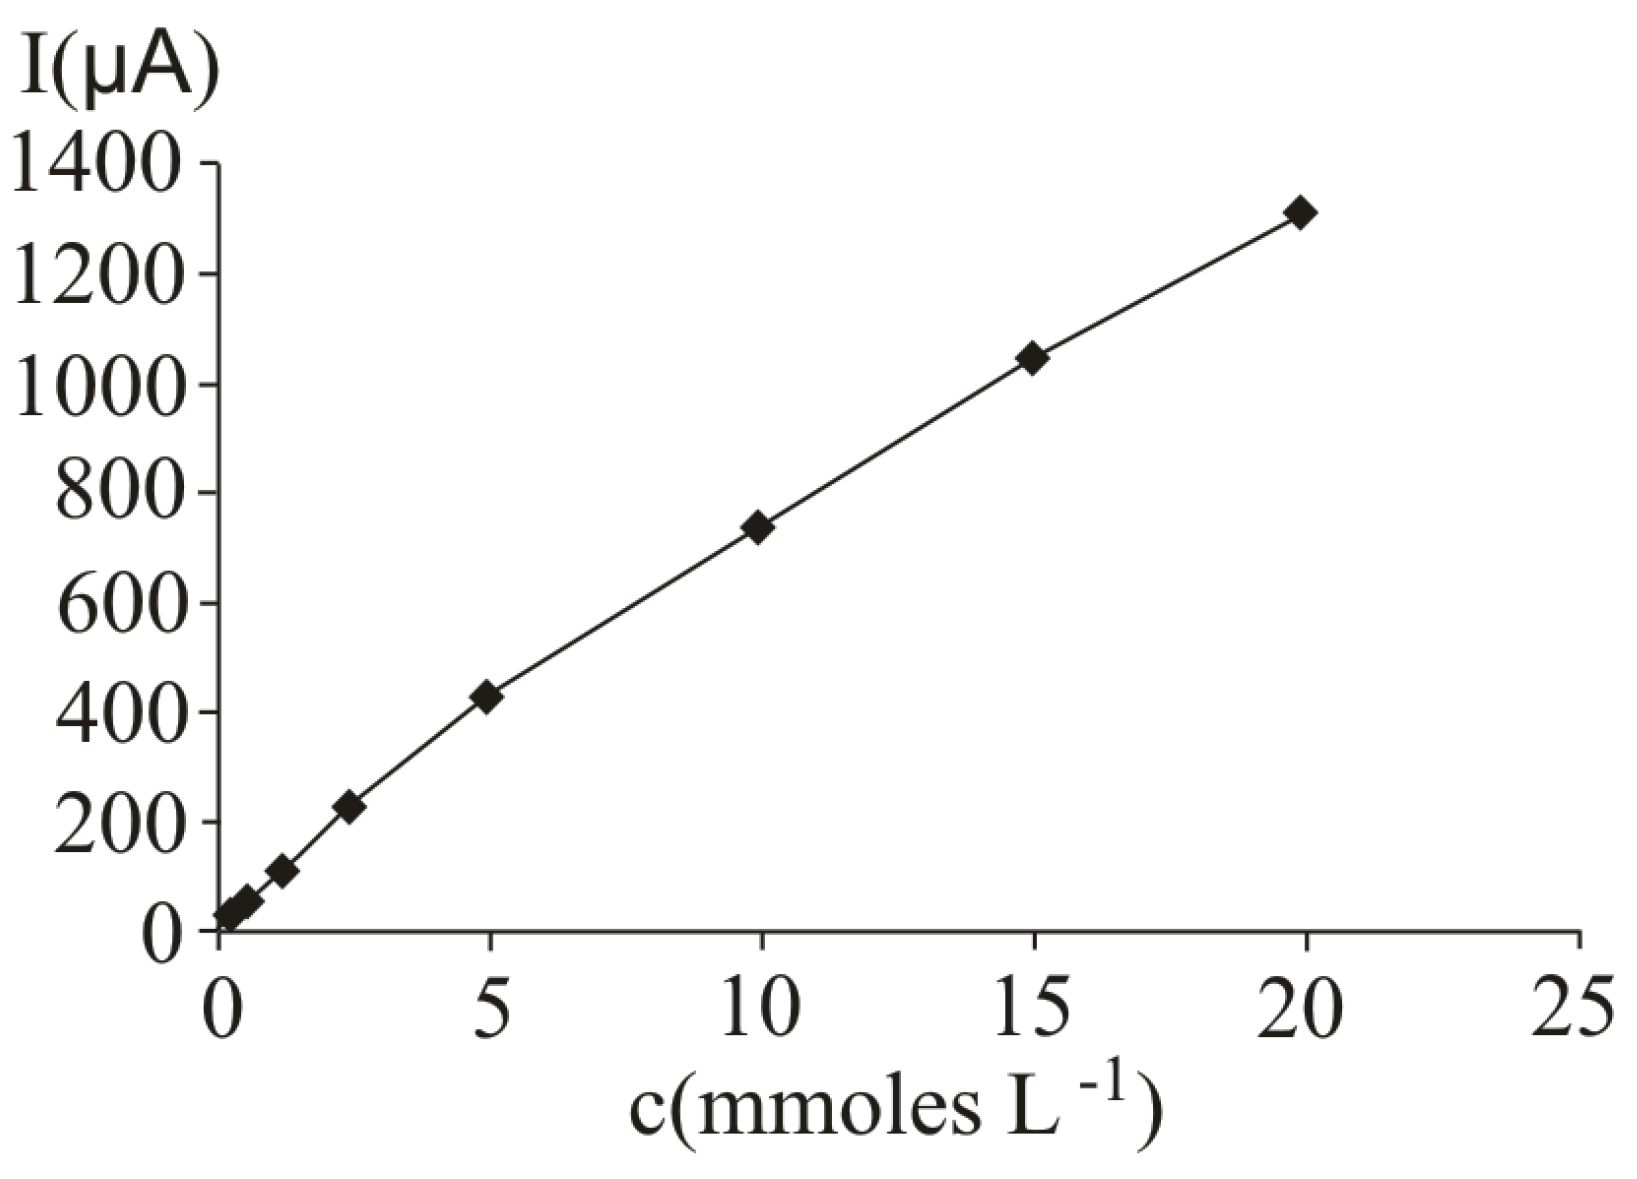
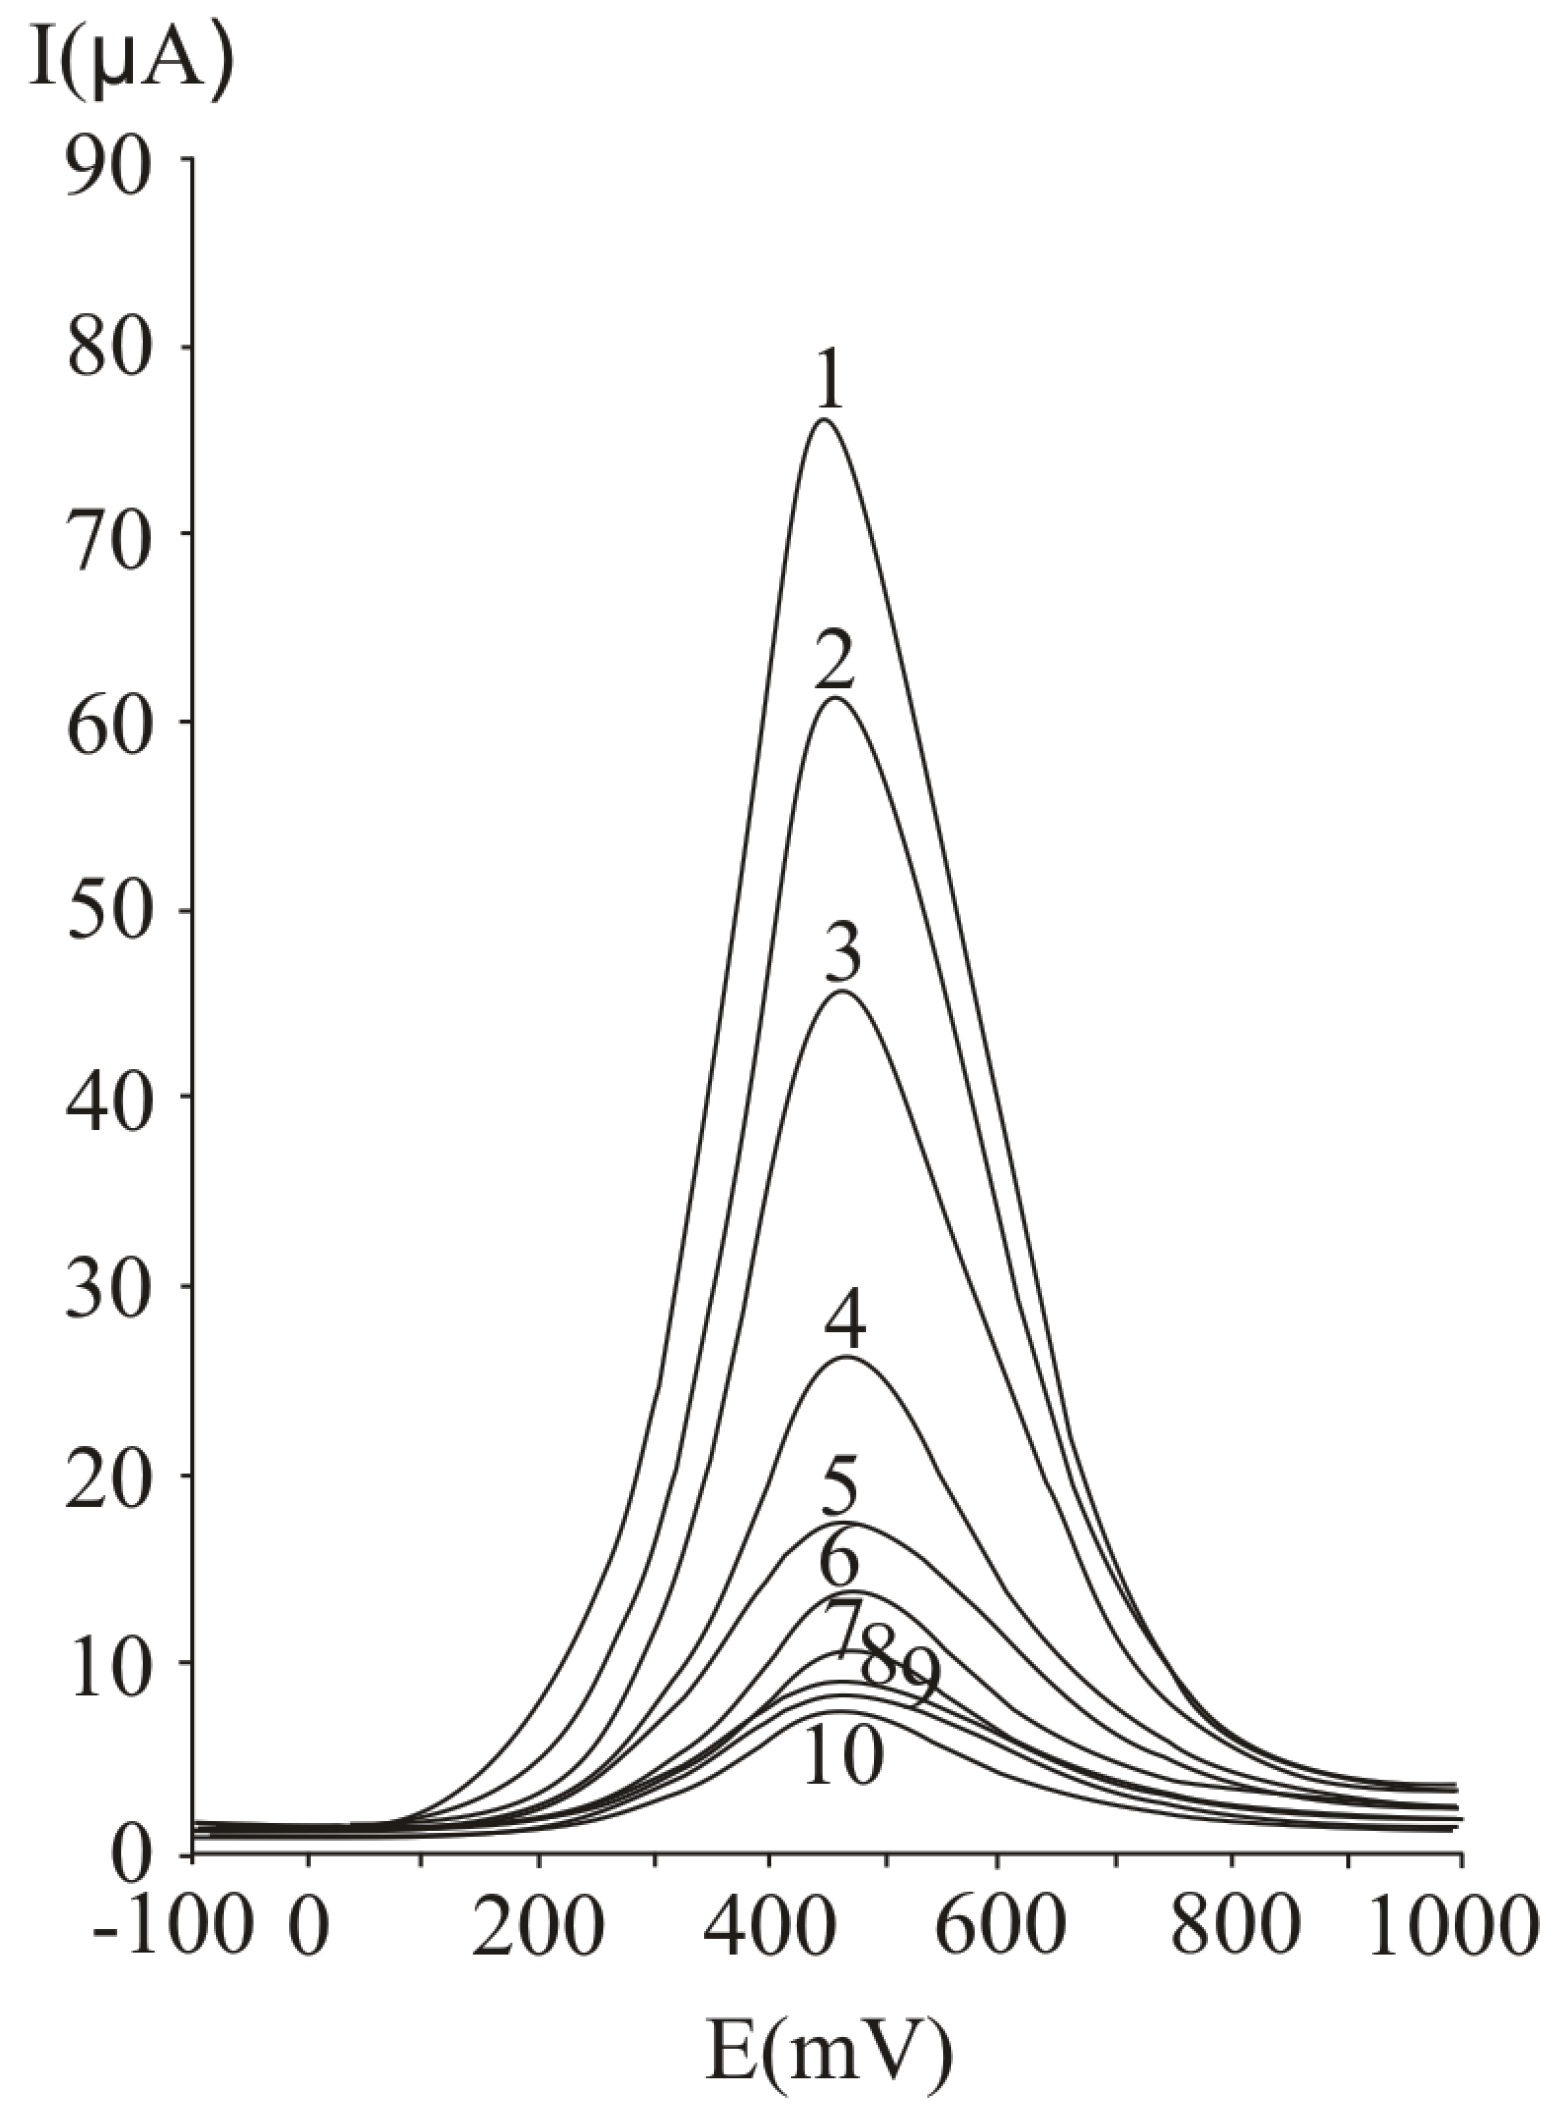
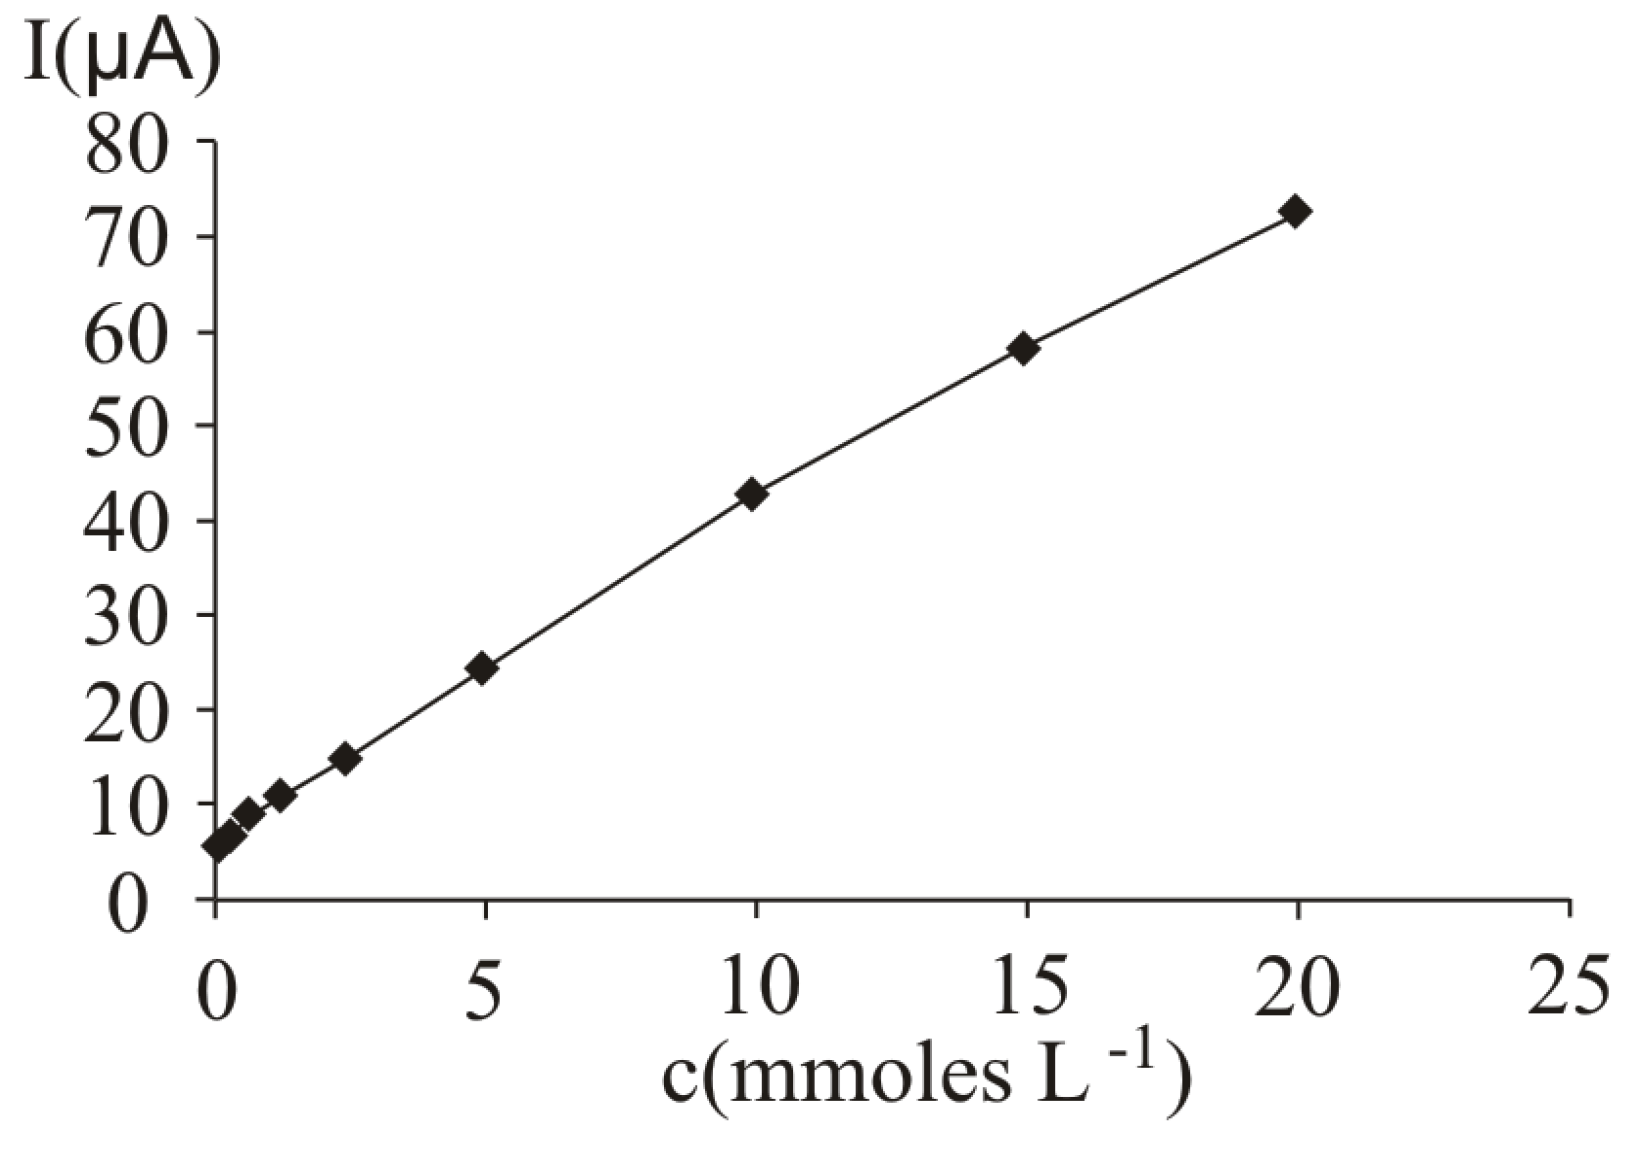
2.2. Voltammetric studies performed at a carbon paste working electrode

In Figure 7, several differential pulse voltammograms, obtained with a carbon paste electrode for different ascorbic acid concentrations, are presented. The peak corresponding to ascorbic acid oxidation appeared at 470 mV (versus SCE). The calibration graph (Figure 8) shows a linear range obtained between 0.07 and 20 mM ascorbic acid (y = 3.4429x + 5.7334, r2 = 0.9971, where y represents the value of the current intensity, from which the background value was substracted and x represents the analyte concentration). The value calculated for R.S.D. was 2.35%, (c = 2.5 mM ascorbic acid; n = 10). The limit of detection and the limit of quantification were 0.02 mM and 0.068 mM respectively.
The results obtained are close to the ones previously reported in literature: the detection limit at ascorbic acid determination by DPV at a modified glassy carbon electrode was 2.1 × 10⁻⁵ M [36].
The optimum value of 75 mV was used for the pulse amplitude and 125 ms was the value chosen for the pulse period, for the reasons explained at ascorbic acid determination at a Pt working electrode.
Figure 7. Differential pulse voltammograms obtained with a carbon paste working electrode for different ascorbic acid concentrations, expressed as mM: 20 (1), 15 (2), 10 (3), 5 (4), 2.5 (5), 1.25 (6), 0.625 (7), 0.31 (8) 0.15 (9) and 0.07 (10); experimental conditions: pulse amplitude 75 mV, pulse period 125 ms, potential scan rate 50 mV/s.
Molecules 16 01349 g007
Figure 8. Calibration graph obtained obtained at ascorbic acid determination by differential pulse voltammetry at a carbon paste working electrode; for experimental conditions see Figure 7.
Molecules 16 01349 g008
In Figure 9, several cyclic voltammograms, obtained for different ascorbic acid concentrations, are presented. The peak corresponding to ascorbic acid oxidation appeared at 510 mV (versus SCE). The calibration graph obtained by cyclic voltammetry (Figure 10) presents a linear range between 0.07 and 20 mM ascorbic acid (y = 5.674x + 6.5619, r2 = 0.9988, where y represents the value of the current intensity, from which the background value was substracted and x is the analyte concentration). The value calculated for R.S.D. was 2.29% (c = 2.5 mM ascorbic acid; n = 10). The limit of detection and the limit of quantification were 0.062 mM and 0.018 mM respectively.
Figure 9. Cyclic voltammograms obtained with a carbon paste working electrode for different ascorbic acid concentrations, expressed as mM: 20 (1), 15 (2), 10 (3), 5 (4), 2.5 (5), 1.25 (6), 0.625 (7), 0.31 (8), 0.15 (9) and 0.07 (10); potential scan rate 50 mV/s.
Molecules 16 01349 g009
Figure 10. Calibration graph obtained obtained at ascorbic acid determination by cyclic voltammetry at a carbon paste working electrode; for experimental conditions see Figure 9.
Molecules 16 01349 g010

2.3. Interference study

In order to verify the existence of matrix effects on ascorbic determination by differential pulse voltammetry, the influence of some interferents commonly present in fruit juices, wines and soft drinks, namely citric acid, glucose, tartaric acid and benzoate, was investigated. The influence of the above mentioned compounds on the analytical peak height is presented in Table 1 and Table 2.
Table 1. Study of interferences at ascorbic acid determination by DPV at a Pt electrode, performed on some chemical species commonly found in fruit juices, soft drinks and wines.
InterferentInterferent/analyte molar ratioInfluence on the analytical peak height
Glucose150less than 3%
2004.8% decrease
Citric acid25less than 3%
503.9% decrease
1005.2% decrease
1506.4% decrease
2007.9% decrease
Tartaric acid50less than 3%
1005.3% increase
1506.1% increase
2009.5% increase
Benzoate anion100less than 3%
1504.7 % decrease
2006.9 % decrease
Table 2. Study of interferences at ascorbic acid determination by DPV at a carbon paste electrode, performed on some chemical species commonly found in fruit juices, soft drinks and wines.
InterferentInterferent/analyte molar ratioInfluence on the analytical peak height
Glucose200less than 3%
Citric acid50less than 3%
1003.6 % decrease
1504.2 % decrease
2005.8 % decrease
Tartaric acid50less than 3%
1003.8 % increase
1505.5 % increase
2006.7% increase
Benzoate anion100less than 3%
1505.7 % decrease
2008.1% decrease
As it can be seen from Table 1 and Table 2, citric acid, tartaric acid and benzoate anion have no significant influence on the analytical signal, up to an interferent/analyte molar ratio of 50/1. Glucose has no influence on the analytical response, in concentrations up to 150 times greater than that of vitamin C.
Therefore, at concentrations commonly found in juices, soft drinks and wines, these organic compounds do not give significant interferences, at ascorbic acid assessment by the investigated voltammetric method.

2.4. Real sample analysis

Natural juices (commercial and freshly obtained from fruit) containing pulp were centrifugated before analysis. Soft drinks did not necessitate centrifugation. Solid potassium chloride was added as supporting electrolyte to the undiluted clear sample, in order to obtain a concentration of 0.10 M KCl. The working procedure employed for standard ascorbic acid solutions was also applied to juice and wine analysis by differential pulse voltammetry and cyclic voltammetry.
For the determination of the degree of recovery of vitamin C added to the analysed juice and wine samples, 1 mL (17.6 mg), from a concentrated (0.10 M) ascorbic acid solution containing 0.10 M KCl, was added to 50 mL sample. The obtained analytical signal was corrected by taking into account the sample dilution originating from the addition of standard ascorbic acid solution. For each addition, the degree of recovery was calculated:
Recovery% = (QDET-QP) × 100/ QADD
where QDET represents mg ascorbic acid determined in 100 mL juice, QP represents mg ascorbic acid previously present in 100 mL juice and QADD, mg ascorbic acid added in 100 mL juice. The obtained results are presented in Table 3 and Table 4.
Table 3. Results obtained at ascorbic acid determination in natural juices, soft drinks and wines by differential pulse voltammetry and cyclic voltammetry performed at a Pt strip working electrode.
Analysed product (producer)Ascorbic acid concentration-cyclic voltammetry (mg/100 mL juice)Ascorbic acid concentration -cyclic voltammetry- after addition (35.2 mg AA added to 100 mL juice)Degree of recovery (%)Ascorbic acid concentration- differential pulse voltammetry (mg/100 mL juice)Ascorbic acid concentration -differential pulse voltammetry- after addition (35.2 mg AA added to 100 mL juice)Degree of recovery (%)
Orange juice (fruit pressing)39.2572.2597.8641.2476.06103.24
Grapefruit juice (fruit pressing)35.2370.43103.9939.8274.54102.87
Lemon juice (fruit pressing)50.8285.96104.7252.1585.1998.72
Fanta Madness (Coca Cola HBC Romania)7.2642.80103.426.8342.27103.10
Prigat active grapefruit (Quadrant Amroq Beverages)12.4647.18101.3311.7944.5195.48
Prigat active sour cherry (Quadrant Amroq Beverages)11.9148.15105.6812.3846.99101.01
Prigat kiwi (Quadrant Amroq Beverages)14.1447.1696.4913.9348.76101.73
Frutia tomato (European Drinks)18.9254.52104.2319.4151.7294.73
Wine (Recas vineyard)15.8648.4295.2515.6651.49104.72
Table 4. Results obtained at ascorbic acid determination in natural juices, soft drinks and wines* by differential pulse voltammetry and cyclic voltammetry performed at a carbon paste electrode.
Analysed productAscorbic acid concentration -cyclic voltammetry (mg/100 mL juice)Ascorbic acid concentration -cyclic voltammetry- after addition (35.2 mg AA added to 100 mL juice)Degree of recovery (%)Ascorbic acid concentration -differential pulse voltammetry (mg/100 mL juice)Ascorbic acid concentration- differential pulse voltammetry- after addition (35.2 mg AA added to 100 mL juice)Degree of recovery (%)
Orange juice39.4072.5298.2340.6875.64103.62
Grapefruit juice37.7172.22102.1439.0574.50104.96
Lemon juice52.9487.07101.9154.7487.1597.04
Fanta madness7.1940.7797.717.0842.58103.27
Prigat grapefruit12.8148.48104.1112.2745.3096.41
Prigat sour cherry12.9945.4794.8712.1644.7595.13
Prigat kiwi15.4850.73103.0415.1749.90101.51
Frutia tomato18.6352.4599.0719.2454.27102.61
Wine (Recas vineyard)15.0748.7198.3516.2249.6397.74
* Producers are the same as in Table 3.
The ascorbic acid content (Table 3 and Table 4) ranged between 6.83 mg/100 mL sample for soft drinks (Fanta Madness) and 54.74 mg/100 mL sample for citrus (lemon) juices obtained by fruit squeezing. The results obtained by the two methods (differential pulse and cyclic voltammetry) are in good agreement. They are also in good agreement with the data reported in literature regarding the ascorbic acid content of fruit juices: the vitamin C content of tomatoes determined by differential pulse voltammetry at a modified carbon paste electrode was 18.68 mg/100 g sample [31]. The ascorbic acid amount in oranges (Citrus aurantium) varied from 30 to 56 mg/100 g of fresh weight [37]. The ascorbic acid content in lemon (Citrus limon), estimated by cyclic voltammetry and titrimetry with N-bromosuccinimide was 49.0 and 49.53 mg/100 mL respectively [38]. Melo et al. [39], using the 2,6-dichlorophenolindophenol titrimetric method, reported an ascorbic acid content of 37.34 mg/100 g for orange.

2.5. Application of the standard addition method at ascorbic acid determination by differential pulse voltammetry performed at a carbon paste electrode

In order to verify the accuracy of the developed method for ascorbic acid determination in fruit juices, the standard addition method was applied to fresh grapefruit juice analysis. The following procedure was employed: to four 100 mL volumetric flasks, 50 mL sample were added. Then, known amounts from the standard 100 mM ascorbic acid solution were added in each flask, as follows: 1) 0 mL; 2) 1 mL; 3) 2 mL and 4) 3 mL. Solid KCl was added in each volumetric flask, as to reach a 0.10 M final electrolyte concentration. Distilled water was added to the final 100 mL volume, followed by homogenisation. The ascorbic acid content of each flask was determined and the obtained results are presented in Figure 11. The measured concentration in the diluted fresh grapefruit juice was 1.06 mM (18.65 mg/100 mL) ascorbic acid. Taking into account the dilution degree (1/1), this corresponds to a concentration of 37.30 mM ascorbic acid in the undiluted grapefruit juice. The obtained result is in accordance with the one presented in Table 4. This indicates the absence of matrix effects at ascorbic acid determination, by the investigated voltammetric method.
Figure 11. Application of the standard addition method at ascorbic acid determination in fresh grapefruit juice by DPV at carbon paste electrode.
Molecules 16 01349 g011

3. Experimental

3.1. Reagents and instrumentation

A KSP potentiostat-galvanostat, laboratory made by Professor Slawomir Kalinowski, University Warmia and Mazury (Olsztyn), as well as the respective softwares, Differential Pulse Voltammetry and Cyclic Voltammetry. A Pt strip electrode (Radelkis 30 mm2 surface) and then a carbon paste electrode were used as working electrodes. The reference electrode was a saturated calomel electrode (SCE). The counter electrode was a Pt strip (Radelkis 30 mm2 surface).
Figure 12 provides a schematic representation of the experimental setup: the potentiostat enables control of the potential of the working electrode, with respect to the reference electrode, as well as measurement of the current that flows between the working electrode and counter electrode.
Figure 12. Schematic representation of the experimental setup.
Molecules 16 01349 g012
A stock solution of ascorbic acid (0.10 M) was prepared daily by dissolving vitamin C (Merck, ACS ISO, biochemical grade) in a 0.10 M KCl solution (Chimopar, Bucharest, Romania), used as supporting electrolyte. Standard solutions of ascorbic acid with concentrations ranging between 0.3 and 20 mM were obtained by diluting the stock solution with the respective volumes of 0.10 M KCl (electrolyte) solution. For the interference studies, glucose and citric acid were purchased from Chimopar (Bucharest, Romania), tartaric acid from Merck (Darmstadt, Germany) and sodium benzoate from Sigma Aldrich (Steinheim, Germany).

3.2. Working procedure

For voltammetric measurements, a three-electrodes cell was used, equipped with working, counter and a reference electrodes. The volume of the analysed sample was 50 mL and all measurements were performed at 295.5 K, using a 0.10 M KCl solution as supporting electrolyte. Before each determination, the Pt working electrode was cleaned mechanically, by applying a -1.5 V potential pulse for 3 seconds. For the differential pulse voltammetry measurements the potential was scaned within the range -100 to 1,000 mV. For the investigation of the influence of the operational parameters on the analytical signal, the pulse amplitude varied between 25 and 150 mV and the pulse period ranged between 50 and 150 ms. For the cyclic voltammetry measurements, the potential was scaned within the range -100 to 1,000 mV, with a 50 mV/s scan rate. The value of the backround current, obtained for the KCl 0.10 M solution was substracted from the current corresponding to the analysed solution/sample, for both voltammetric methods.

4. Conclusions

The developed voltammetric methods (differential pulse voltammetry and cyclic voltammetry) for ascorbic acid determination are characterized by sensitivity, rapidity and reproducibility. The degree of accuracy of the investigated voltammetric methods is confirmed by the values obtained for the degree of recovery, which ranged between 94.74 and 104.97%.
The limit of detection (LOD) and the limit of quantification (LOQ) obtained by differential pulse voltammetry were 0.087 mM and 0.29 mM respectively, when a Pt electrode was used. The limit of detection (LOD) and the limit of quantification (LOQ) obtained by cyclic voltammetry were 0.075 mM and 0.25 mM, respectively.
Lower LOD and LOQ values were obtained when a carbon paste electrode was employed as working electrode: the limit of detection and the limit of quantification (LOQ) obtained by differential pulse voltammetry were 0.02 mM and 0.068 mM, respectively. The limit of detection and the limit of quantification (LOQ) obtained by cyclic voltammetry were 0.018 mM and 0.062 mM respectively.
The sensitivity obtained by cyclic voltammetry (given by the slope of the calibration graph) is better than the one obtained by differential pulse voltammetry, with both working electrodes. Differential pulse voltammetry has turned out to be a technique characterized by sensitivity, rapidity, good specificity and reproducibility, and can be applied with good results in food quality control.

Acknowledgements

This work was co-financed from the European Social Fund through the Sectoral Operational Programme Human Resources Development 2007-2013, project number POSDRU/89/1.5/S/63258 ”Postdoctoral school for zootechnical biodiversity and food biotehnology based on the eco-economy and the bio-economy required by ecosanogenesis”.
We would like to express our gratitude towards Slawomir Kalinowski, from the University Warmia and Mazury (Olsztyn), for the precious help in designing the potentiostat-galvanostat, as well as the respective softwares.

References

  1. Erdurak-Kiliç, C.S.; Uslu, B.; Dogan, B.; Ozgen, U.; Ozkan, S.A.; Coskun, M. Anodic voltammetric behavior of ascorbic acid and its selective determination in pharmaceutical dosage forms and some Rosa species of Turkey. J. Anal. Chem. 2006, 61, 1113–1120. [Google Scholar] [CrossRef]
  2. Popa, C.V.; Danet, A.F.; Jipa, S.; Zaharescu, T. Determination of total antioxidant activity of wines using a flow injection method with chemiluminescence detection. Rev. Chim. (Bucharest) 2010, 61, 11–16. [Google Scholar]
  3. Pisoschi, A.M.; Cheregi, M.C.; Danet, A.F. Total antioxidant capacity of some commercial fruit juices: electrochemical and spectrophotometrical approaches. Molecules 2009, 14, 480–493. [Google Scholar] [CrossRef]
  4. Papuc, C.; Pop, A.; Serban, M. Metode Analitice in Biochimia Veterinara; Editura Printech, Bucharest, Romania, 2001; pp. 167–169. [Google Scholar]
  5. Balan, D.; Pele, M.; Artimon, M.; Luta, G. Bioactive compounds in sea buckthorn fruits and in some products obtained by their processing. Rev. Cytol. Biol. Veg. Bot. 2005, 28, 364–368. [Google Scholar]
  6. Matei, N.; Magearu, V.; Birghila, S.; Dobrinas, S. The determination of vitamin C from sweet cherries and cherries. Rev. Chim. (Bucharest) 2004, 55, 294–296. [Google Scholar]
  7. Iwase, H. Use of nucleic acids in the mobile phase for the determination of ascorbic acid in foods by high-performance liquid chromatography with electrochemical detection. J. Chromatogr.A 2000, 881, 327–330. [Google Scholar]
  8. Borowski, J.; Szajdek, A.; Borowska, E.J.; Ciska, E.; Zielinski, H. Content of selected bioactive components and antioxidant properties of broccoli (Brassica oleracea L.). Eur. Food Res. Technol. 2008, 226, 459–465. [Google Scholar]
  9. Arya, S.P.; Mahajan, M.; Jain, P. Non-spectrophotometric methods for the determination of vitamin C. Anal. Chim. Acta 2000, 417, 1–14. [Google Scholar] [CrossRef]
  10. Vermeir, S.; Hertog, M.L.A.T.M.; Schenk, A.; Beullens, K.; Nicolai, B.M.; Lammertyn, J. Evaluation and optimization of high-throughput enzymatic assays for fast l-ascorbic acid quantification in fruit and vegetables. Anal. Chim. Acta 2008, 618, 94–101. [Google Scholar] [CrossRef]
  11. Dechakiatkrai, C.; Chen, J.; Lynam, C.; Shin, K.M.; Kim, S.J.; Phanichphant, S.; Wallace, G.G. Direct Ascorbic Acid Detection with Ferritin Immobilized on Single-Walled Carbon Nanotubes. Electrochem. Solid-State Lett. 2008, 11, 4–6. [Google Scholar]
  12. Wang, Z.; Xu, Q.; Wang, J.H.; Yang, Q.; Yu, J.H.; Zhao, Y.D. Ascorbic acid biosensor based on laccase immobilized on an electrode modified with a self-assembled monolayer and coated with functionalized quantum dots. Microchim. Acta 2009, 165, 387–392. [Google Scholar] [CrossRef]
  13. Wang, X.; Watanabe, H.; Uchiyama, S. Amperometric l-ascorbic acid biosensors equipped with enzyme micelle membrane. Talanta 2008, 74, 1681–1685. [Google Scholar] [CrossRef]
  14. Pisoschi, A.M.; Negulescu, Gh.P.; Pisoschi, A. Ascorbic acid determination by an amperometric ascorbate oxidase-based biosensor. Rev. Chim. (Bucharest) 2010, 61, 339–344. [Google Scholar]
  15. Wawrzyniak, J.; Ryniecki, A.; Zembrzuski, W. Application of voltammetry to determine vitamin C in apple juices. Acta Sci. Pol., Technol. Aliment. 2005, 42, 5–16. [Google Scholar]
  16. Nezamzadeh, A.; Amini, M.K.; Faghihian, H. Square-wave voltametric determination of ascorbic acid based on its electrocatalytic oxidation at zeolite-modified carbon-paste electrodes. Int. J. Electrochem. Sci. 2007, 2, 583–594. [Google Scholar]
  17. Raoof, J.B.; Ojani, R.; Beitollahi, H. Electrocatalytic determination af ascorbic acid at chemically modified carbon paste electrode with 2,7 bis(ferrocenyl ethynyl) fluoren-9-one. Int. J. Electrochem. Sci. 2007, 2, 534–548. [Google Scholar]
  18. Pisoschi, A.M.; Danet, A.F.; Kalinowski, S. Ascorbic acid determination in commercial fruit juice samples by cyclic voltammetry. J. Autom. Method. Manag. 2008, 2008. Article ID 937651, 8 pages. Available online: http://www.hindawi.com/journals/jammc.
  19. Chen, Z.; Zu, Y. Simultaneous detection of ascorbic acid and uric acid using a fluorosurfactant-modified platinum electrode. J. Electroanal. Chem. 2007, 603, 281–286. [Google Scholar]
  20. Francioso, L.; Bjorklund, R.; Krantz-Rulcker, T.; Siciliano, P. Classification of multiple defect concentrations in white wine by platinum microelectrode voltammetry. Sensor. Actuator. B-Chem. 2007, 125, 462–467. [Google Scholar] [CrossRef]
  21. Ensafi, A.A.; Taei, M.; Khayamian, T. A differential pulse voltammetric method for simultaneous determination of ascorbic acid, dopamine and uric acid using poly(3-(5-chloro-2-hydroxyphenylazo)-4,5-dihydroxynaphtalene-2,7-disulphonic acid) film modified glassy carbon electrode. J. Electroanal. Chem. 2009, 633, 212–220. [Google Scholar] [CrossRef]
  22. Bello, A.; Giannetto, M.; Mori, G.; Seeber, R.; Terzi, F.; Zanardi, C. Optimization of the DPV potential wave-form for determination of ascorbic acid on PEDOT-modified electrodes. Sensor. Actuator. B-Chem. 2007, 121, 430–435. [Google Scholar] [CrossRef]
  23. Barthus, R.C.; Mazo, L.H.; Poppi, R.J. Simultaneous determination of vitamins C, B6 and PP in pharmaceutics using differential pulse voltammetry with a glassy carbon electrode and multivariate calibration tools. J. Pharm. Biomed. Anal. 2005, 38, 94–99. [Google Scholar] [CrossRef]
  24. Blasco, A.J.; Gonzalez, M.C.; Escarpa, A. Electrochemical approach for discriminating and measuring predominant flavonoids and phenolic acids using differential pulse voltammetry: towards an electrochemical index of natural antioxidants. Anal. Chim. Acta 2004, 511, 71–81. [Google Scholar] [CrossRef]
  25. Bahram, M.; Fahradi, K.; Arjmand, F. Voltammetric determination of dopamine in the presence of ascorbic and uric acids using partial least squares regression: determination of dopamine in human urine and plasma. Cent. Eur. J. Chem. 2009, 7, 524–531. [Google Scholar] [CrossRef]
  26. Fang, B.; Jiao, S.; Li, M.; Tao, H. Simultaneous determination of uric acid and ascorbic acid at a ferrocenium-thioglycollate modified electrode. Anal. Bioanal. Chem. 2006, 386, 2117–2122. [Google Scholar] [CrossRef]
  27. Hassan, E.M.; Khamis, E.F.; El-Kimary, E.I.; Barary, M. Development of a differential pulse voltammetric method for the determination of Silymarin/Vitamin E acetate mixture in pharmaceuticals. Talanta 2008, 74, 773–778. [Google Scholar] [CrossRef]
  28. Motahary, M.; Ghoreishi, S.M.; Behpour, M.; Golestaneh, M. Electrochemical determination of ascorbic acid at the surface of a graphite electrode modified with a multi-walled carbon nanotubes/tetradecyltrimethylammonium bromide. J. Appl. Electrochem. 2010, 40, 841–847. [Google Scholar] [CrossRef]
  29. Beitollahi, H.; Ardakani, M.M.; Naeimi, H.; Ganjipour, B. Electrochemical characterization of 2,2’-[1,2-ethanediylbis(nitriloethylidine)]-bis-hydroquinone-carbon nanotube paste electrode and its application to simultaneous voltammetric determination of ascorbic and uric acid. J. Solid State Electrochem. 2009, 13, 353–363. [Google Scholar] [CrossRef]
  30. Ensafi, A.A.; Taei, M.; Khayamian, T.; Arabzadeh, A. Highly selective determination of ascorbic acid, dopamine and uric acid by differential pulse voltammetry using poly(sulfonazo III) modified glassy carbon electrod. Sensor. Actuator. B-Chem. 2010, 147, 213–221. [Google Scholar] [CrossRef]
  31. Wang, M.; Xu, X.; Gao, J. Voltammetric studies of a novel bicopper complex modified glassy carbon electrode for the simultaneous determination of dopamine and ascorbic acid. J. Appl. Electrochem. 2007, 37, 705–710. [Google Scholar] [CrossRef]
  32. Zhao, G.H.; Li, M.F.; Li, M.L. Differential pulse voltammetric determination of dopamine with the coexistence of ascorbic acid on boron-doped diamond surface. Cent. Eur. J. Chem. 2007, 5, 1114–1123. [Google Scholar] [CrossRef]
  33. Raoof, J.B.; Kiani, A.; Ojani, R.; Valiollahi, R.; Rashid-Nadimi, S. Simultaneous voltammetric determination of ascorbic acid and dopamine at the surface of electrodes modified with self-assembled gold nanoparticle films. J. Solid State Electrochem. 2010, 14, 1171–1176. [Google Scholar]
  34. Yilmaz, S.; Sadikoglu, M.; Saglikoglu, G.; Yagmur, S.; Askin, G. Determination of ascorbic acid in tablet dosage forms and some fruit juices by DPV. Int. J. Electrochem. Sci. 2008, 3, 1534–1542. [Google Scholar]
  35. Cofan, C.; Radovan, C.; Cinghita, D. Simultaneous anodic assessment of ascorbic acid and acetaminophen in unbuffered solutions. Rev. Chim. (Bucharest) 2009, 60, 368–372. [Google Scholar]
  36. Zhang, L.; Lin, X. Covalent modification of glassy carbon electrodes with glycine for voltammetric separation of dopamine and ascorbic acid. Fresenius J. Anal. Chem. 2001, 370, 956–962. [Google Scholar] [CrossRef]
  37. Gazdik, Z.; Zitka, O.; Petrlova, J.; Adam, V.; Zehnalek, J.; Horna, A.; Reznicek, V.; Beklova, M.; Kizek, R. Determination of Vitamin C (Ascorbic Acid) Using High Performance Liquid Chromatography Coupled with Electrochemical Detection. Sensors 2008, 8, 7097–7112. [Google Scholar]
  38. Okiei, W.; Ogunlesi, M.; Azeez, L.; Obakachi, V.; Osunsanmi, M.; Nkenchor, G. The Voltammetric and Titrimetric Determination of Ascorbic Acid Levels in Tropical Fruit Samples. Int. J. Electrochem. Sci. 2009, 4, 276–287. [Google Scholar]
  39. Melo, E.A.; Lima, V.L.; Maciel, M.I.S.; Caetano, A.C.; Leal, F.L. Polyphenol, Ascorbic Acid and Total Carotenoid Contents in Common Fruits and Vegetables. Braz. J. Food Technol. 2006, 9, 89–94. [Google Scholar]
  • Sample Availability: Samples of the analysed products for ascorbic acid are available from the authors.

