Alleviation of Water Stress Effects on MR220 Rice by Application of Periodical Water Stress and Potassium Fertilization

Abstract
:1. Introduction
2. Results and Discussion
2.1. Growth and Yield Component

| Treatment | Panicle dry weight (g) | 1000 grains weight (g) | Root dry weight (g) | Panicle no/m2 | Yield (tones/ha) |
|---|---|---|---|---|---|
| 80CF | 126.87 ± 7.61 a | 25.50 ± 0.23 b | 49.94 ± 0.99 e | 313.31 ± 8.23 b | 8.65 ± 0.32 a |
| 120PW15 | 99.45 ± 5.51 e | 24.55 ± 0.22 c | 79.97 ± 2.11 a | 326.30 ± 5.44 a | 7.25 ± 0.31 c |
| 120DS15V | 117.11 ± 3.42 c | 25.38 ± 0.23 b | 56.51 ± 2.32 c | 293.51 ± 3.45 c | 7.00 ± 0.32 d |
| 120DS25V | 120.38 ± 4.34 b | 26.06 ± 0.21 a | 59.13 ± 2.12 b | 324.68 ± 3.42 a | 8.18 ± 0.42 b |
| 120DS15R | 103.30 ± 4.55 d | 23.73 ± 0.24 d | 51.26 ± 1.23 d | 279.22 ± 1.24 d | 6.09 ± 0.41 e |
| Parameters | 1 | 2 | 3 | 4 | 5 | 6 | 7 | 8 | 9 | 10 | 11 | 12 | 13 | 14 | 15 | 16 | 17 | 18 | 19 |
|---|---|---|---|---|---|---|---|---|---|---|---|---|---|---|---|---|---|---|---|
| 1. PDW | 1.000 | ||||||||||||||||||
| 2. 1000gw | 0.451 | 1.000 | |||||||||||||||||
| 3. RDW | 0.234 | 0.211 | 1.000 | ||||||||||||||||
| 4. P/m2 | 0.234 | 0.311 | 0.123 | 1.000 | |||||||||||||||
| 5. Yield | 0.567 | 0.234 | 0.124 | 0.321 | 1.000 | ||||||||||||||
| 6. POX | 0.021 | 0.098 | 0.021 | 0.113 | 0.765 ** | 1.000 | |||||||||||||
| 7.CAT | 0.032 | 0.124 | 0.123 | 0.126 | 0.776 * | 0.875 * | 1.000 | ||||||||||||
| 8. Grain S | 0.721 * | 0.214 | 0.091 | 0.798 * | 0.871 * | 0.765 * | 0.912 * | 1.000 | |||||||||||
| 9. Straw S | 0.567 | 0.158 | 0.124 | 0.114 | 0.652 * | 0.113 | 0.123 | 0.113 | 1.000 | ||||||||||
| 9. MDA | 0.123 | 0.113 | 0.234 | 0.065 | 0.654 * | 0.665 * | 0.423 | 0.897 * | 0.123 | 1.000 | |||||||||
| 10. Proline | 0.124 | 0.009 | 0.098 | 0.127 | 0.234 | 0.876 * | 0.876 * | 0.876 * | 0.812 * | 0.112 * | 1.000 | ||||||||
| 11. A | 0.021 | 0.123 | 0.124 | 0.145 | 0.876 * | 0.867 * | 0.213 | 0.923 * | 0.721 | 0.123 | 0.098 | 1.000 | |||||||
| 12. gs | 0.123 | 0.124 | 0.214 | 0.098 | 0.776 * | 0.123 | 0.021 | 0.776 * | 0.123 | 0.114 | 0.098 | 0.012 | 1.000 | ||||||
| 13. E | 0.091 | 0.112 | 0.113 | 0.123 | 0.654 * | 0.116 | 0.032 | 0.654 * | 0.091 | 0.112 | 0.124 | 0.123 | 0.134 | 1.000 | |||||
| 14. WUE | 0.014 | 0.081 | 0.123 | 0.167 | 0.886 * | 0.113 | 0.021 | 0.553 | 0.734 * | 0.881 * | 0.214 | 0.213 | 0.091 | 0.234 | 1.000 | ||||
| 15. fo | 0.123 | 0.213 | 0.114 | 0.245 | −0.456 | 0.156 | 0.123 | 0.123 | 0.098 | 0.243 | 0.113 | 0.114 | 0.112 | 0.021 | 0.211 | 1.000 | |||
| 16. fv/fo | 0.211 | 0.113 | 0.098 | 0.121 | 0.098 | 0.158 | 0.124 | 0.114 | 0.112 | 0.113 | 0.123 | 0.245 | 0.113 | 0.098 | 0.091 | 0.234 | 1.000 | ||
| 17. fv/fm | 0.321 | 0.081 | 0.123 | 0.167 | 0.765 * | 0.123 | 0.123 | 0.098 | 0.081 | 0.009 | 0.123 | 0.123 | 0.123 | 0.021 | 0.112 | 0.098 | 0.214 | 1.000 | |
| 18. TCC | 0.125 | 0.123 | 0.224 | 0.132 | 0.876 * | 0.115 | 0.003 | 0.123 | 0.213 | 0.001 | 0.116 | 0.167 | 0.154 | 0.032 | 0.113 | 0.032 | 0.012 | 0.233 | 1.000 |
| Characteristics | Correlation with rice yield | Direct effect | Indirect effect via | |||
|---|---|---|---|---|---|---|
| PDW | 1000gw | RDW | P/m2 | |||
| PDW | 0.5671 | 0.5771 | - | 0.0012 | 0.0231 | 0.0321 |
| 1000gw | 0.2342 | 0.2111 | 0.0021 | - | 0.0041 | |
| RDW | 0.1242 | 0.1001 | 0.0033 | 0.0054 | - | 0.0017 |
| P/m2 | 0.3211 | 0.2876 | 0.0123 | 0.0065 | 0.0024 | - |
 = 0.350.
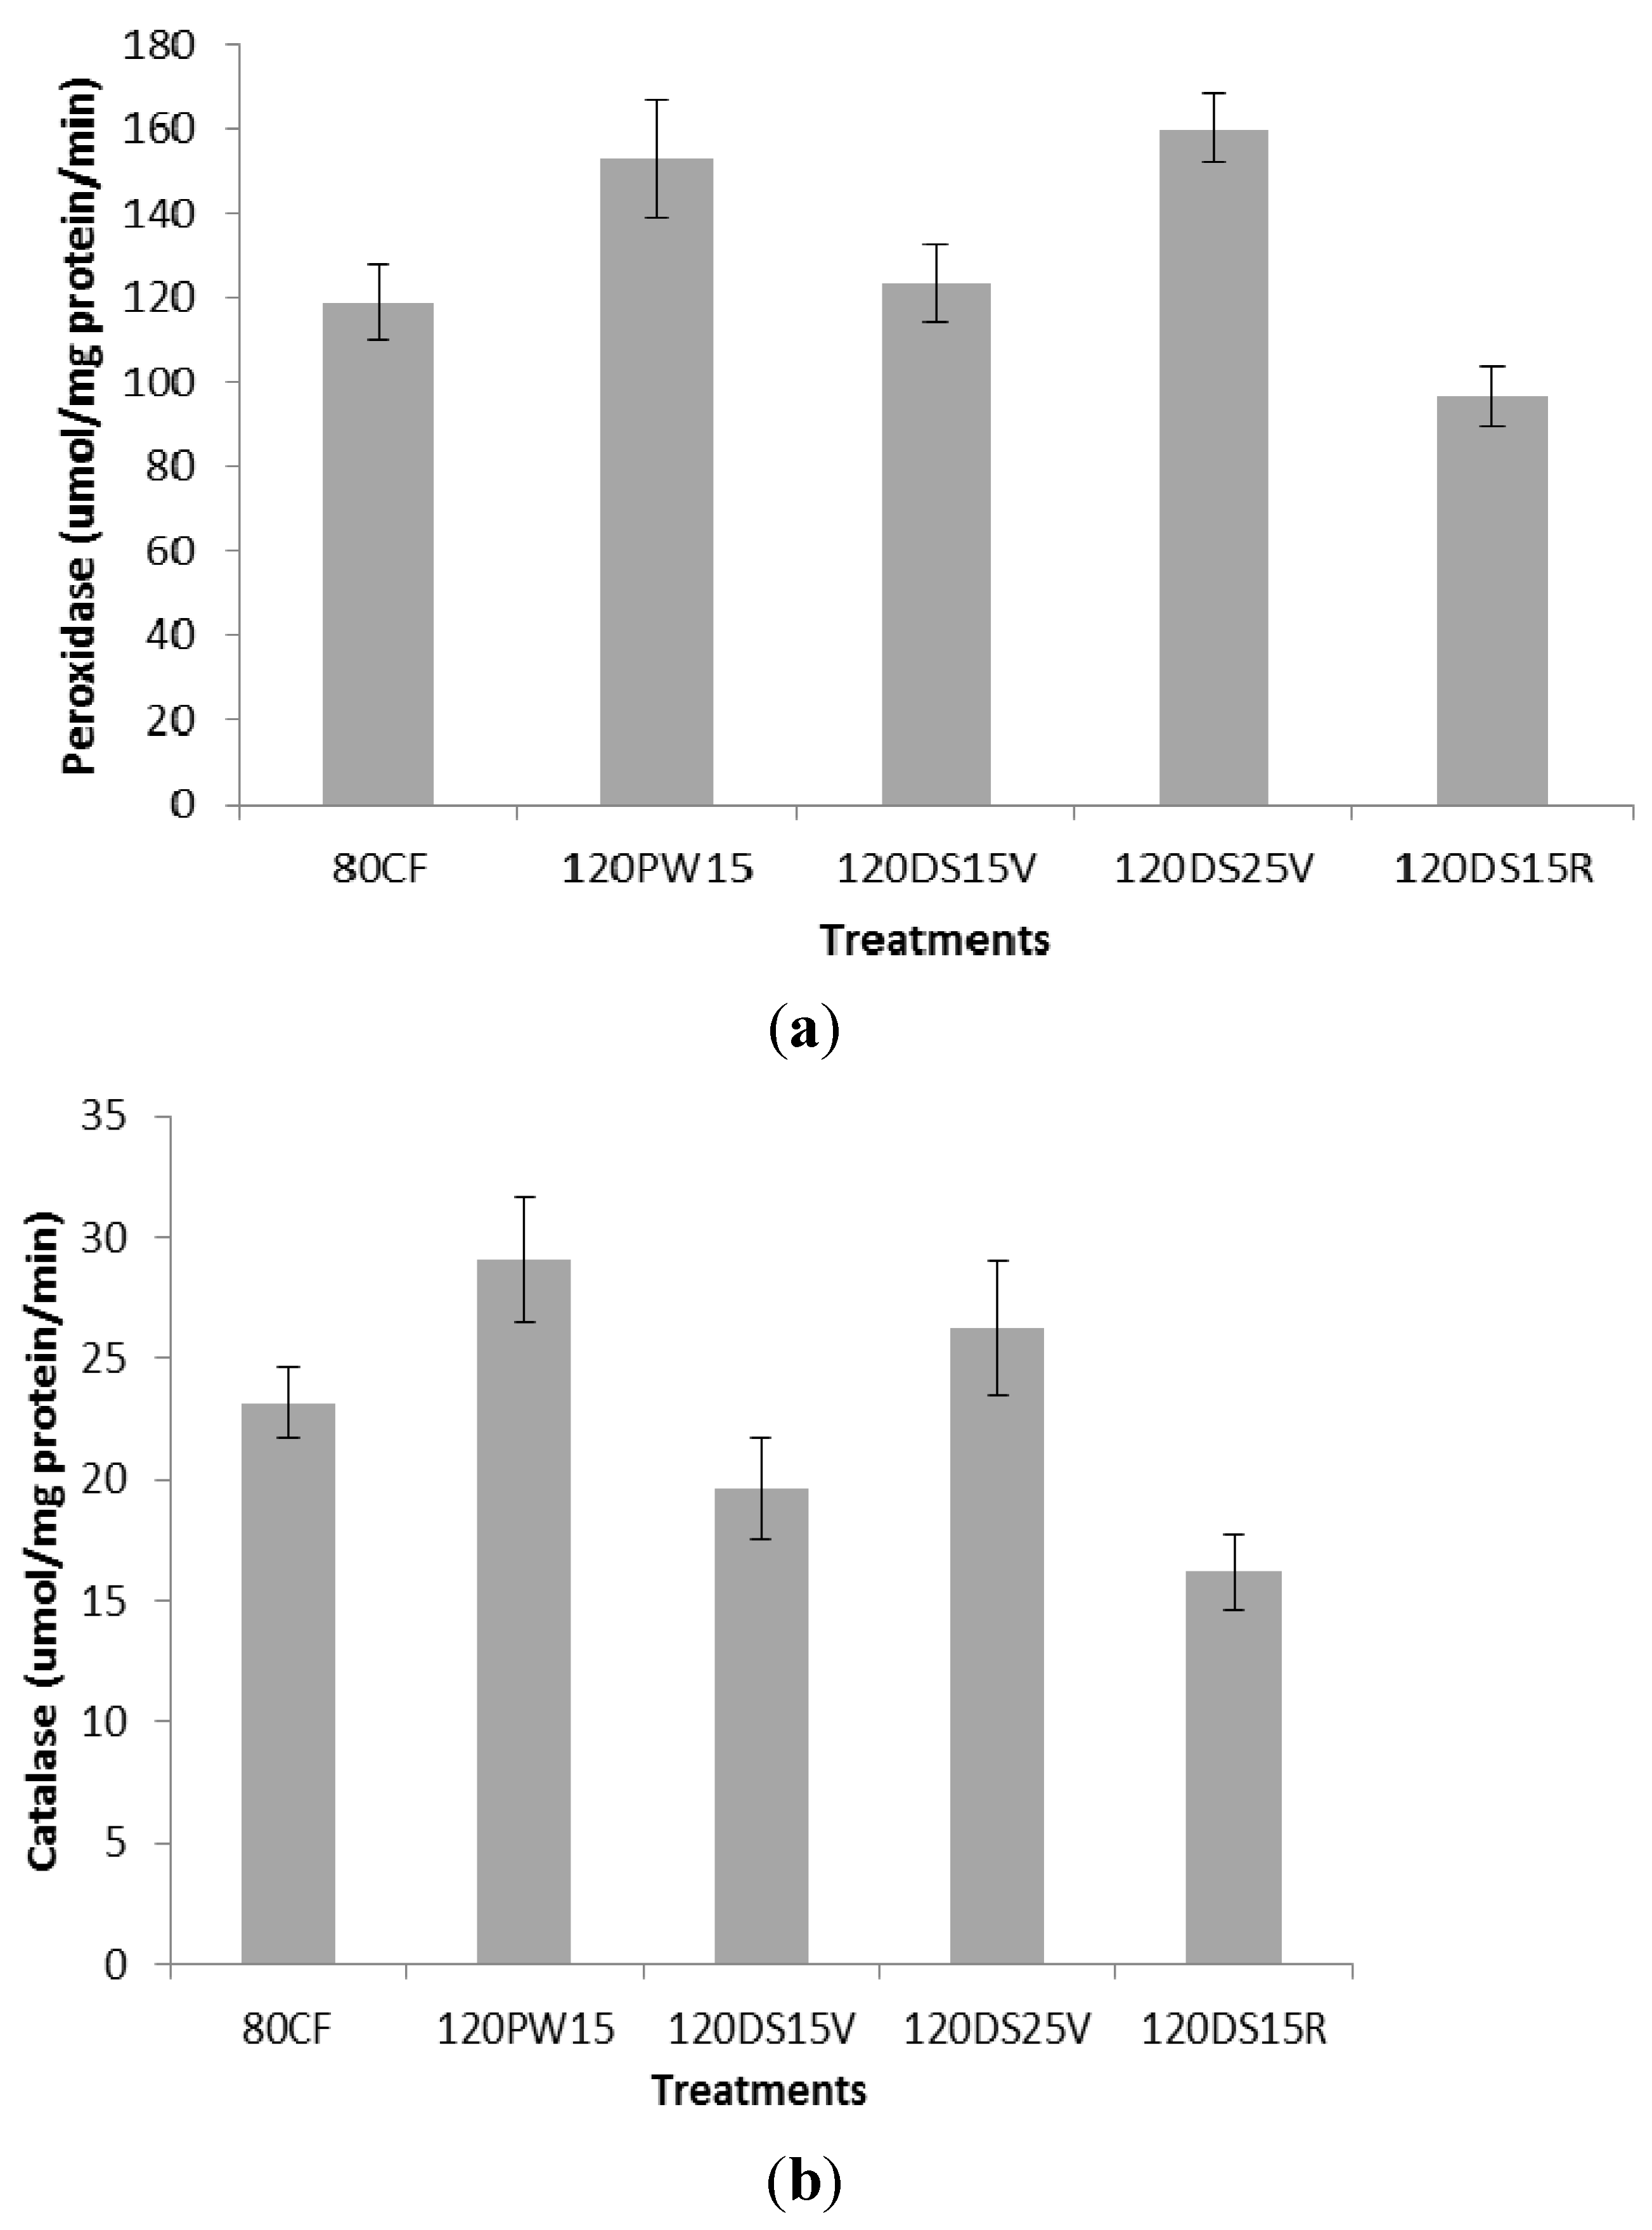
2.2. Peroxidase Activity and Catalase Activity

| Characteristics | Correlation with yield | Direct effect | Indirect effect via | |||||
|---|---|---|---|---|---|---|---|---|
| POX | CAT | Grains S | Straw S | MDA | Proline | |||
| POX | 0.7651 | 0.7114 | - | 0.0042 | 0.0301 | 0.0271 | 0.0132 | 0.0014 |
| CAT | 0.7762 | 0.7219 | 0.0023 | - | −0.0071 | 0.0031 | 0.0213 | |
| Grains S | 0.8712 | 0.7812 | −0.0043 | 0.0041 | - | 0.0017 | 0.0543 | 0.0456 |
| Straw S | 0.6521 | 0.6143 | 0.0002 | 0.0015 | 0.0044 | - | 0.0213 | |
| MDA | 0.6543 | 0.6102 | −0.0025 | 0.0021 | 0.0001 | 0.0032 | - | |
| Proline | 0.2345 | 0.1195 | 0.0032 | −0.0043 | 0.0024 | 0.0432 | 0.0321 | - |
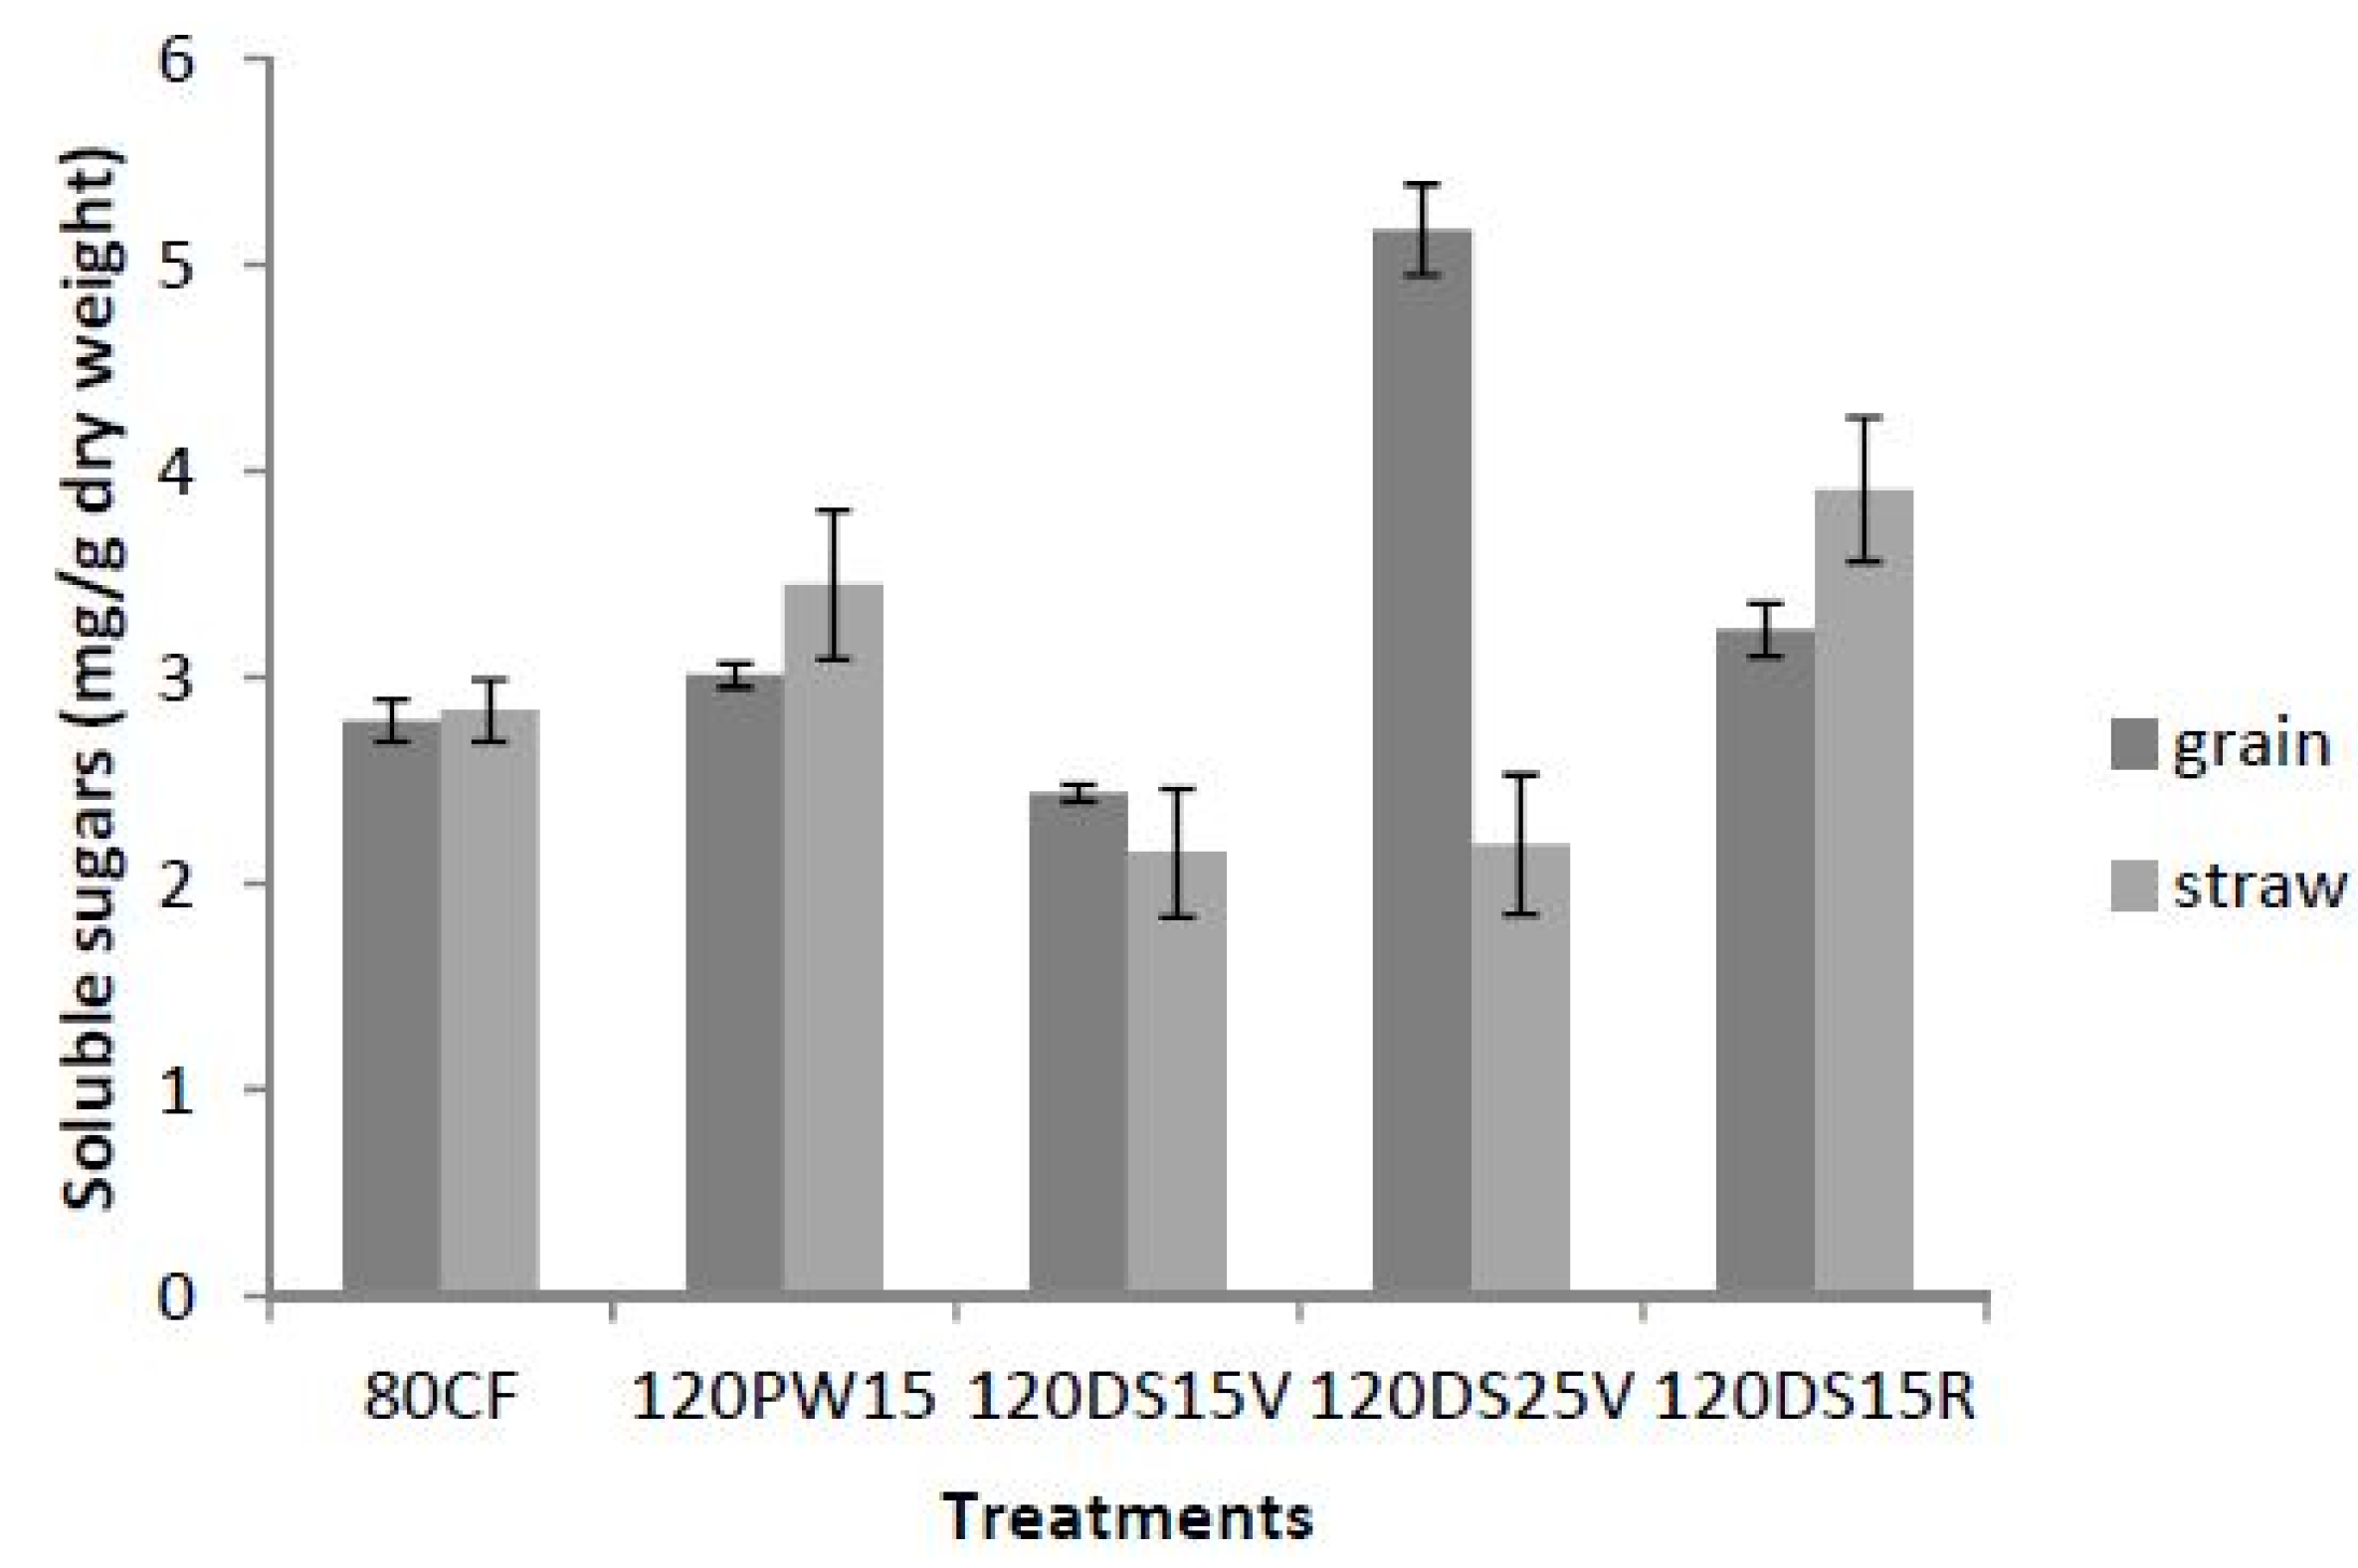
= 0.350.2.3. Total Soluble Sugars

2.4. Proline and Lipid Peroxidation
| Treatments | MDA (µmol/g fresh weight) | Proline content (mg/g fresh weight) |
|---|---|---|
| 80CF | 11.21 ± 1.21 c | 1.23 ± 0.45 d |
| 120PW15 | 12.32 ± 2.23 b | 2.75 ± 0.56 b |
| 120DS15V | 12.45 ± 3.12 b | 2.01 ± 0.25 c |
| 120DS25V | 12.78 ± 1.45 b | 2.73 ± 0.08 b |
| 120DS15R | 14.21 ± 1.11 a | 3.44 ± 0.34 a |
2.5. Leaf Gas Exchange Properties
| Treatments | Net photosynthesis (µmol/m2/s) | Stomatal conductance (mmol/m2/s) | Transpiration rate (mmol/m2/s) | Water use efficiency (µmol/m2/s CO2 assimilated per mmol/m2/ water transpired |
|---|---|---|---|---|
| 80CF | 15.18 ± 0.24 b | 0.33 ± 0.01 a | 7.83 ± 0.34 b | 1.95 ± 0.03 c |
| 120PW15 | 15.69 ± 0.45 b | 0.35 ± 0.01 a | 7.60 ± 0.21 b | 2.18 ± 0.02 a |
| 120DS15V | 15.72 ± 0.24 b | 0.36 ± 0.02 a | 7.82 ± 0.13 b | 2.01 ± 0.01 b |
| 120DS25V | 16.31 ± 0.31 a | 0.36 ± 0.01 a | 8.09± 0.21 a | 2.02 ± 0.02 b |
| 120DS15R | 14.28 ± 0.25 c | 0.31 ± 0.02 a | 7.19 ± 0.12 c | 1.98 ± 0.04 b |
= 0.350.| Characteristics | Correlation with yield | Direct effect | Indirect effect via | |||||||
|---|---|---|---|---|---|---|---|---|---|---|
| A | gs | E | WUE | fo | fv/fo | fv/fm | TCC | |||
| A | 0.8762 | 0.8113 | - | 0.0002 | 0.0331 | 0.0971 | 0.0102 | 0.0311 | 0.0015 | 0.0067 |
| gs | 0.7762 | 0.7211 | 0.0012 | - | 0.0241 | 0.0081 | 0.0011 | 0.0204 | 0.0021 | 0.0054 |
| E | 0.6543 | 0.6065 | 0.0143 | 0.0061 | - | 0.0327 | 0.0243 | 0.0562 | 0.0006 | 0.0034 |
| WUE | 0.8861 | 0.8021 | 0.0032 | 0.0055 | 0.0014 | - | 0.0013 | 0.0012 | 0.0043 | |
| fo | 0.4562 | 0.3991 | 0.005 | 0.0028 | 0.0041 | 0.0012 | - | 0.0002 | 0.0234 | 0.0012 |
| fv/fo | 0.0982 | 0.0012 | 0.0032 | 0.0026 | 0.0004 | 0.0131 | 0.0321 | - | 0.0042 | 0.0026 |
| fv/fm | 0.7653 | 0.7142 | 0.0024 | 0.0054 | 0.0012 | 0.0091 | 0.0034 | 0.1231 | - | |
| TCC | 0.8764 | 0.7921 | 0.0001 | 0.0076 | 0.0123 | 0.0003 | 0.0122 | 0.0062 | 0.0432 | - |
= 0.350.2.6. Cholorophyll Fluorescence Parameters
| Treatments | Minimal fluorescence (fo) | Maximum quantum yield of photochemical and non photochemical (fv/fo) | Maximum quantum yield of photosystem II (fv/fm) | Total chlorophyll content (SPAD value) |
|---|---|---|---|---|
| 80CF | 412.23 ± 22.13 d | 3.81 ± 0.67 a | 0.79 ± 0.12 a | 56.21 ± 4.21 a |
| 120PW15 | 523.21 ± 12.31 b | 3.14 ± 0.87 b | 0.72 ± 0.09 b | 49.13 ± 3.11 b |
| 120DS15V | 544.21 ± 21.23 b | 3.23 ± 1.21 b | 0.68 ± 0.12 c | 35.61 ± 2.76 d |
| 120DS25V | 578.12 ± 17.58 c | 2.98 ± 0.76 c | 0.67 ± 0.14 c | 34.21 ± 3.44 d |
| 120DS15R | 711.24 ± 25.12 a | 2.32 ± 0.81 d | 0.59 ± 0.14 d | 28.76 ± 2.78 c |
2.7. Relative Chlorophyll Content
3. Experimental
3.1. Plant Material, Treatments and Experimental Design
| Treatments | Description | Potassium fertilization schedule (muriate of potash; 60% K2O) |
|---|---|---|
| 80CF | Control flooding + 80 kgK2O/ha (Control) | 80 kg K2O/ha fertilization split into two phases:
|
| 120PW15 | Periodical water stress for 15 days + 120 kg K2O/ha | 120 kg K2O/ha fertilization split into three phases:
|
| 120DS15V | Drought stress 15 days at the vegetative stage + 120 kg K2O/ha | 120 kg K2O/ha fertilization split into two phases:
|
| 120DS25V | Drought stress for 25 days at the vegetative stage + 120 kg K2O/ha | 120 kg K2O/ha fertilization split into two phases:
|
| 120DS15R | Drought stress for 15 days at the reproductive stage + 120 kg K2O/ha | 120 kg K2O/ha fertilization split into two phases:
|
3.2. Growth and Yield
3.3. Antioxidant Enzyme Activity
3.3.1. Preparation of Enzyme Extracts
3.3.2. Ascorbate Peroxidase (POX) Activity Assay
3.3.3. Catalase (CAT) Activity Assay
3.4. Sucrose Determination
3.5. Malondialdehyde (MDA) Content
3.6. Proline Determination
3.7. Leaf Gas Exchange
3.8. Chlorophyll Fluorescence
3.9. Chlorophyll Measurement
3.10. Statistical Analysis
4. Conclusions
Acknowledgments
Conflicts of Interest
References and Notes
- Ali, M.; Jensen, C.R.; Mogensen, V.O.; Andersen, M.N.; Henson, I.E. Root signalling and osmotic adjustment during intermittentsoil drying sustain grain yield of field grown wheat. Field Crops Res. 1999, 62, 35–52. [Google Scholar] [CrossRef]
- Razak, A.A.; Ismail, M.R.; Karim, M.F.; Wahab, P.E.M.; Abdullah, S.N.; Kausar, H. Changes in leaf gas exchange, biochemical properties, growth and yield of chilli grown under soilless culture subjected to deficit fertigation. Aust. J. Crop Sci. 2013, 7, 1582–1589. [Google Scholar]
- Levitt, J. Stress terminology. In : Adaptation of Plants to Water and High Temperature Stress; Turner, N.C., Kramer, P.J., Eds.; Wiley: New York, NY, USA, 1980; pp. 473–439. [Google Scholar]
- Jones, H. What is water use efficiency? In Water Use Efficiency in Plant Biology; Bacon, M.A., Ed.; Blackwell: Oxford, UK, 2004; pp. 27–41. [Google Scholar]
- Jones, M.M.; Turner, N.C.; Osmond, C.B. Mechanisms of drought resistance. In : The Physiology and Biochemistry of Drought Resistance in Plants; Paleg, L.G., Aspinall, D., Eds.; AcademicPress: New York, NY, USA, 1981; pp. 15–35. [Google Scholar]
- Cabangon, R.J.; Tuong, T.P.; Abdullah, N.B. Comparing water input and water productivity of transplanted and direct-seeded rice production systems. Agric. Water Manage. 2002, 57, 11–31. [Google Scholar] [CrossRef]
- Sarkarung, S.; Pantuwan, G.; Pushpavesa, S.; Tanupan, P. Germplasm Development for Rainfed Lowland Ecosystems: Breeding Strategies for Rice in Drought-Prone Environments; Proc. Int. Workshop: UbonRatchathani, Thailand, 1997; pp. 43–49. [Google Scholar]
- Pantuwan, G.; Fukai, S.; Co-oper, M.; Rajatasereekul, S.; O’Toole, J.C. Field screening for drought resistance. In : Increased Lowland Rice Production in the Mekong Region; Proc. Int. Workshop: Vientiane, Laos, 2000; pp. 69–77. [Google Scholar]
- Farooq, M.; Basra, S.M.A.; Wahid, A.; Rehman, H. Exogenously applied nitric oxide enhances the drought tolerance in fine grain aromatic rice (Oryza sativa L.). J. Agron. Crop Sci. 2009, 195, 254–261. [Google Scholar] [CrossRef]
- Quampah, A.; Wang, R.-M.; Shamsil, I.H.; Jilanil, G.; Zhang, Q.; Hua, S.; Xu, H. Improving Water Productivity by Potassium Application in Various Rice Genotypes. Int. J. Agri. Biol. 2011, 13, 1560–1853. [Google Scholar]
- Chen, J.X.; Chen, J.X. Effect of K nutrition on rice root growth and nutrient uptake. Acta Pedol. Sin. 1997, 34, 182–188. [Google Scholar]
- Chen, J.X.; Xuan, J.X.; Du, C.L.; Xie, J.C. Effect of potassium nutrition of rice on rhizosphere redox status. Plant Soil 1997, 188, 131–137. [Google Scholar] [CrossRef]
- Hassan, Z.; Arshad, M. Evaluating factors affecting cotton tolerance to potassium deficiency stress using path analysis. Int. J. Agric. Biol. 2008, 10, 511–516. [Google Scholar]
- Assmann, S.M.; Shimazaki, K. The multisensory guard cell, stomatal responses to blue light and abscisic acid. Plant Physiol. 1999, 119, 809–815. [Google Scholar] [CrossRef]
- Andersen, M.N.; Jensen, C.R.; Losch, R. The interaction effects of potassium and drought in field-grown barley. I. Yield, water-use efficiencyand growth. Soil Plant Sci. 1992, 42, 34–44. [Google Scholar]
- Sangakkara, U.R.; Frehner, M.; Nosberger, J. Influence of soil moisture and fertilizer potassium on the vegetative growth of mungbean (Vigna radiate L. Wilczek) and cowpea (Vigna unguiculata L. Walp). J. Agron. Crop Sci. 2001, 186, 73–81. [Google Scholar] [CrossRef]
- Marschner, H. Mineral Nutrition of Higher Plants; Academic press: San Diego, CA, USA, 1995. [Google Scholar]
- Hsiao, T.C. Plant responses to water stress. Annu. Rev. Plant Physiol. 1973, 24, 519–570. [Google Scholar] [CrossRef]
- Li, F. Potassium and Water Interaction. International Workshop on Soil Potassium and K Fertilizer Management. The International Potash Institute. Available online: http://www.ipipotash.org/udocs/Potassium_and_Water_Interaction.pdf (accessed on 21 January 2014).
- Chaves, M.M.; Pereira, J.S.; Maroco, J.; Rodrigues, M.L.; Ricardo, C.P.P.; Osorio, M.L.; Carvalho, I.; Faria, T.; Pinheiro, C. How plants cope with water stress in the field. Photosynthesis and growth. Ann. Bot. 2002, 89, 907–916. [Google Scholar] [CrossRef]
- Gibson, S.I. Control of plant development and gene expression by sugar signaling. Curr. Opin. Plant Biol. 2005, 8, 93–102. [Google Scholar] [CrossRef]
- Mohammadkhani, N.; Heidari, R. Drought-induced accumulation of soluble sugars and proline in two maize varieties. World Appl. Sci. J. 2008, 13, 448–453. [Google Scholar]
- Cha-um, S.; Kirdmanee, C. Effect of osmotic stress on proline accumulation, photosynthetic abilities and growth of sugarcane plantlets (Saccharum officinarum L.). Pak. J. Bot. 2008, 40, 2541–2552. [Google Scholar]
- Teixeira, J.; Pereira, S. High salinity and drought act on an organ-dependant manner on potato glutamine synthetase expression and accumulation. Environ. Exp. Bot. 2007, 60, 121–126. [Google Scholar] [CrossRef]
- Valliyodan, B.; Nguyen, H.T. Understanding regulatory networks and engineering for enhanced drought tolerance in plants. Curr. Opin. Plant Biol. 2006, 9, 189–195. [Google Scholar] [CrossRef]
- Verbruggen, N.; Hermans, C. Proline accumulation in plants: A review. Amino Acids 2008, 35, 753–759. [Google Scholar] [CrossRef]
- Bandurska, H. Free proline accumulation in leaves of cultivated plant species under water deficit conditions. Acta Agrobot. 2004, 57, 57–67. [Google Scholar] [CrossRef]
- Mohiti, M.; Ardalan, M.M.; Mohammadi, T.A.; ShokriVahed, H. The efficiency of potassium fertilization methods on the growth of rice (Oryza sativa L.) under salinity stress. Afr. J. Biotechnol. 2011, 10, 15946–15952. [Google Scholar]
- Sengupta, S.; Majumder, A.L. Insight into the salt tolerance factors of wild halophytic rice, Porteresiacoarctata: A physiological and proteomic approach. Planta 2009, 229, 911–929. [Google Scholar]
- Hussein, M.M.; Mehanna, H.M.; El-Lethy, S.M. Water deficit and foliar fertilization and their effect on growth and photosynthetic pigments of jatropha plants. World Appl. Sci. J. 2013, 27, 454–461. [Google Scholar]
- Romheld, V.; Kirkby, E.A. Research on potassium in agriculture: Needs and prospects. Plant Soil 2010, 335, 155–180. [Google Scholar] [CrossRef]
- Wang, Z.L.; Huang, B.R. Physiological recovery of kentucky bluegrass from simultaneous drought and heat stress. Crop Sci. 2004, 44, 1729–1736. [Google Scholar] [CrossRef]
- Premachandra, G.S.; Saneoka, H.; Ogata, S. Cell membrane stability and leaf water relations as affected by potassium nutrition of water-stressed maize. J. Exp. Bot. 1991, 42, 739–745. [Google Scholar] [CrossRef]
- Wang, M.; Zheng, Q.; Shen, Q.; Guo, S. The Critical Role of Potassium in Plant Stress Response. Int. J. Mol. Sci. 2013, 14, 7370–7390. [Google Scholar] [CrossRef]
- Asch, F.; Dingkuhn, M.; Wittstock, C.; Doerffling, K. Sodium and potassium uptake of rice panicles as affected by salinity and season in relation to yield and yield components. Plant Soil 1998, 207, 133–145. [Google Scholar] [CrossRef]
- Pyngrope, S.; Bhoomika, K.; Dubey, R.S. Reactive oxygen species, ascorbate-glutathione pool, and enzymes of their metabolism in drought-sensitive and tolerant indica rice (Oryza sativa L.) seedlings subjected to progressing levels of water deficit. Protoplasma 2013, 250, 585–600. [Google Scholar] [CrossRef]
- Jones, R.G.; Pollard, A. Proteins Enzymes and Inorganic Ions. In Inorganic Plant Nutrition; Lauchli, A., Bileski, R.L., Eds.; Springer: New York, NY, USA, 1983; pp. 528–562. [Google Scholar]
- Tripathi, B.N.; Bhatt, I.; Dietz, K.J. Peroxiredoxins: A less studied component of hydrogen peroxide detoxification in photosynthetic organism. Protoplasma 2009, 235, 3–15. [Google Scholar] [CrossRef]
- Foyer, C.H.; Decourviers, P.; Kenerk, K.J. Protection against oxygen radicals: An important defense mechanism studied in transgenic plants. Plant Cell Environ. 1994, 17, 507–523. [Google Scholar] [CrossRef]
- Chaitanya, K.; Sundar, D.; Masilamani, S.; Ramachandra, R.A. Variation in heat stress induced antioxidant enzyme activities among three mulberry cultivars. Plant Growth Regul. 2002, 36, 175–180. [Google Scholar] [CrossRef]
- Cakmak, I.; Horst, W.J. Effects of aluminium and lipid peroxidation, superoxide dismutase, catalase and peroxidase activities in root tips of soybean (Glycine max). Physiol. Plant 1991, 83, 463–468. [Google Scholar] [CrossRef]
- Liu, S.-H.; Chen, G.X.; Yin, J.J.; Lu, C.G. Response of the flag leaves of a super-hybrid rice variety to drought stress during grain filling period. J. Agro. Crop Sci. 2011, 197, 322–328. [Google Scholar] [CrossRef]
- Liang, Y.; Hu, F.; Yang, M.; Yu, J. Antioxidative defenses and water deficit-induced oxidative damage in rice (Oryza sativa L.) growing on non-flooded paddy soils with ground mulching. Plant Soil 2013, 257, 407–416. [Google Scholar] [CrossRef]
- Jaleel, C.A.; Manivannan, P.; Lakshmanan, G.M.; Gomathinayagam, M.; Panneerselvam, R. Alterations in morphological parameters and photosynthetic pigment responses of Catharanthus roseus under soil water deficits. Colloids Surf. B Biointerfaces 2008, 61, 298–303. [Google Scholar]
- Yooyongwech, S.; Chaum, S.; Supaibulwatana, K. Water relation and aquaporin genes (PIP1;2 and PIP2;1) expression at the reproductive stage of rice (Oryza sativa L. spp. indica) mutant subjected to water deficit stress. Plant OMICS 2013, 6, 79–85. [Google Scholar]
- Najafabadi, M.S. Improving rice (Oryza sativa L.) drought tolerance by suppressing a NF-YA. Iran J. Biotech. 2012, 10, 40–48. [Google Scholar]
- Moumeni, A.; Satoh, K.; Kondoh, H.; Asano, T.; Hosaka, A.; Venuprasad, R.; Serraj, R.; Kikuchi, S. Comparative analysis of root transcriptome profiles of two pairs of drought-tolerant and susceptible rice near-isogenic lines under different drought stress. BMC Plant Biol. 2011, 11, 174. [Google Scholar] [CrossRef]
- Pattanagul, W. Exogenous abscisic acid enhances sugar accumulation in rice (Oryza sativa L.) under drought stress. Asian J. Plant Sci. 2011, 10, 212–219. [Google Scholar] [CrossRef]
- Nakamura, K.; Ohto, M.; Yoshida, N.; Nakamura, K. Sucrose induced accumulation of amylase occurs concomitant with the accumulation of starchandsporamin in leaf petiole cuttings of sweet potato. Plant Physiol. 1991, 96, 902–909. [Google Scholar] [CrossRef]
- Murata, T.; Akazawa, T. Stimulative effect of potassium ion on starch synthetase of different plant origins. Plant Cell Physiol. 1968, 10, 457–460. [Google Scholar]
- Lasnitzki, A. Potassium and carbohydrate metabolism. Nature 1964, 146, 99–100. [Google Scholar] [CrossRef]
- Fu, G.F.; Song, J.; Li, Y.R.; Yue, M.K.; Xiong, J.; Tao, L.-X. Alterations of panicle antioxidant metabolism and carbohydrate content and pistil water potential involved in spikelet sterility in rice under water-deficit stress. Rice Sci. 2010, 17, 303–310. [Google Scholar] [CrossRef]
- Nguyen, G.N.; Hailstones, D.L.; Wilkes, M.; Sutton, B.G. Role of carbohydrate metabolism in drought-induced male sterility in rice anthers. J. Agron. Crop Sci. 2010, 196, 346–357. [Google Scholar] [CrossRef]
- Yang, J.; Zhang, J.; Wang, Z.; Zhu, Q.; Liu, L. Activities of enzymes involved in sucrose to starch metabolism in rice grains subjected to water stress during filling. Field Crops Res. 2003, 81, 69–81. [Google Scholar] [CrossRef]
- Shukla, N.; Awasthi, R.P.; Rawat, L.; Kumar, J. Biochemical and physiological responses of rice (Oryza sativa L.) as influenced by Trichodermaharzianum under drought stress. Plant Physiol. Biochem. 2012, 54, 78–88. [Google Scholar] [CrossRef]
- Fu, X.-Q.; He, H.-H.; Wen, P.; Luo, X.-D.; Xie, J.-K. Drought resistance evaluation system for backcross lines of Dongxiang common wild rice (Oryza rufipogon Griff.). Chin. J. Appl. Ecol. 2012, 23, 1277–1285. [Google Scholar]
- Chutipaijit, S.; Cha-Um, S.; Sompornpailin, K. An evaluation of water deficit tolerance screening in pigmented indica rice genotypes. Pak. J. Bot. 2012, 4, 65–72. [Google Scholar]
- Chutipaijit, S.; Suriyan, C.-U.; Sompornpailin, K. Proline accumulation and physiological responses of indica rice genotypes differing in tolerance to salt and drought stresses. Philippine Agri. Sci. 2010, 93, 165–169. [Google Scholar]
- Chutipaijit, S.; Cha-Um, S.; Sompornpailin, K. Differential accumulations of proline and flavonoids in indica rice varieties against salinity. Pak. J. Bot. 2009, 41, 2497–2506. [Google Scholar]
- Baek, M.-H.; Byung, Y.C.; Kim, J.-H.; Seung, G.W.; Kim, J.-S.; Lee, I.-J. Gamma radiation and hormone treatment as tools to reduce salt stress in rice (Oryza sativa L.). J. Plant Biol. 2006, 49, 257–260. [Google Scholar] [CrossRef]
- Wankhade, S.D.; Sanz, A. Chronic mild salinity affects source leaves physiology and productivity parameters of rice plants (Oryza sativa L., cv. Taipei 309). Plant Soil 2013, 367, 663–672. [Google Scholar] [CrossRef]
- Kong-Ngern, K.; Bunnag, S.; Theerakulpisut, P. Proline, hydrogen peroxide, membrane stability and antioxidant enzyme activity as potential indicators for salt tolerance in rice (Oryza sativa L.). Int. J. Bot. 2012, 8, 54–65. [Google Scholar] [CrossRef]
- Ahmed, I.M.; Dai, H.; Zheng, W.; Cao, F.; Zhang, G.; Sun, D.; Wu, F. Genotypic differences in physiological characteristics in the tolerance to drought and salinity combined stress between Tibetan wild and cultivated barley. Plant Physiol. Biochem. 2013, 63, 49–60. [Google Scholar] [CrossRef]
- Farooq, M.; Wahid, A.; Basra, S.M.A.; Islam, U. Improving water relations and gas exchange with brassinosteroids in rice under drought stress. J. Agron. Crop Sci. 2009, 195, 262–269. [Google Scholar] [CrossRef]
- Centritto, M.; Lauteri, M.; Monteverdi, M.C.; Serraj, R. Leaf gas exchange, carbon isotope discrimination, and grain yield in contrasting rice genotypes subjected to water deficits during the reproductive stage. J. Exp. Bot. 2009, 60, 2325–2339. [Google Scholar] [CrossRef]
- Yang, A.; Dai, X.; Zhang, W.H.A. R2R3-type MYB gene, OsMYB2, is involved in salt, cold, and dehydration tolerance in rice. Exp. Bot. 2012, 63, 2541–2556. [Google Scholar] [CrossRef]
- Yan, C.; Chen, H.; Fan, T.; Huang, Y.; Yu, S.; Chen, S.; Hong, X. Rice flag leaf physiology, organ and canopy temperature in response to water stress. Plant Prod. Sci. 2012, 15, 92–99. [Google Scholar] [CrossRef]
- Sun, Y.Y.; Sun, Y.J.; Wang, M.T.; Li, X.Y.; Guo, X.; Hu, R.; Ma, J. Effects of seed priming on germination and seedling growth under water stress in rice. Acta Agron. Sin. 2010, 36, 1931–1940. [Google Scholar] [CrossRef]
- Pedersen, O.; Rich, S.M.; Colmer, T.D. Surviving floods: Leaf gas films improve O2 and CO2 exchange, root aeration, and growth of completely submerged rice. Plant J. 2009, 58, 147–156. [Google Scholar] [CrossRef]
- Hajiboland, R.; Beiramzadeh, N. Growth, gas exchange and function of antioxidant defense system in two contrasting rice genotypes under Zn and Fe deficiency and hypoxia. Acta Biol. Szegediensis 2008, 52, 283–294. [Google Scholar]
- Stiller, V.; Lafitte, H.R.; Sperry, J.S. Hydraulic properties of rice and the response of gas exchange to water stress. Plant Physiol. 2003, 132, 1698–1706. [Google Scholar] [CrossRef]
- Dingkuhn, M.; Cruz, R.T.; O'Toole, J.C.; Turner, N.C.; Doerffling, K. Responses of seven diverse rice cultivars to water deficits. III. Accumulation of abscisic acid and proline in relation to leaf water-potential and osmotic adjustment. Field Crops Res. 1991, 27, 103–117. [Google Scholar] [CrossRef]
- Fukai, S.; Cooper, M. Development of drought-resistance cultivars using physio-morphological traits in rice. Field Crop Res. 1995, 40, 67–86. [Google Scholar] [CrossRef]
- Khush, G.S. What it will take to Feed 5.0 Billion Rice consumers in 2030. Plant Mol. Biol. 2005, 59, 1–6. [Google Scholar] [CrossRef]
- Lilley, J.M.; Fukai, S. Effect of timing and severity of water deficit on four deverse rice cultivar. I. Rooting pattern and soilo water extraction. Field Crops Res. 1994, 37, 205–213. [Google Scholar] [CrossRef]
- Agnus, J.F.; van Herwaarden, A.F. Increasing water use and water use efficiency in dry land. Wheat Agron. J. 2001, 93, 290–298. [Google Scholar] [CrossRef]
- Asgharipour, M.R.; Heidari, M. Effect of potassium supply on drought resistance in sorghum: plant growth and macronutrient content. Pak. J. Agri. Sci. 2011, 4893, 197–204. [Google Scholar]
- Baque, M.A.; Karim, MA.; Hamid, A.; Tetsushi, H. Effects of fertilizer potassium on growth, yield nutrient uptake of wheat (Triticum aestivum) under water stress conditions. South Pac. Studies 2006, 27, 29–35. [Google Scholar]
- Grzebisz, W.; Gransee, A.; Szczepaniak, W.; Diatta, J. The effects of potassium fertilization on water-use efficiency in crop plants. J. Plant Nutr. Soil Sci. 2013, 176, 355–374. [Google Scholar] [CrossRef]
- Kobata, T.; Takami, S. Changes in respiration, dry-matter production and its partition in rice (Oryza sativa L.) in response to water deficits during the grain-filling period. Bot. Magazine Tokyo 1986, 99, 379–393. [Google Scholar] [CrossRef]
- Percival, G.C.; Fraser, G.A.; Oxenham, G. Foliar salt tolerance of Acer genotypes using chlorophyll fluorescence. J. Arboricul. 2003, 29, 61–65. [Google Scholar]
- Rong-hua, L.; Pei-pol, G.; Baumz, M.; Grando, S.; Ceccarelli, S. Evaluation of chlorophyll content and fluorescence parameters as indicators of drought tolerance in barley. Agri. Sci. Chi. 2006, 5, 751–757. [Google Scholar] [CrossRef]
- Sikuku, P.A.; Netondo, G.W.; Onyango, J.C.; Mysyimi, D.M. Chlorophyll fluorescence, protein and chlorophyll content of three rainfed rice varieties under varying irrigation regimes. ARPN J. Agric. Biol. Sci. 2010, 5, 19–25. [Google Scholar]
- Tezera, W.; Mitchell, V.; Driscoll, S.P.; Lawlor, D.W. Effects of water deficit and its interaction with CO2 supply on the biochemistry and physiology of photosynthesis in sunflower. J. Exp. Bot. 2002, 53, 1781–1791. [Google Scholar] [CrossRef]
- Yamada, M.; Hidaka, T.; Fukamachi, H. Heat tolerance in leaves of tropical fruit crops as measured by chlorophyll fluorescence. Sci. Hort. 1996, 67, 39–48. [Google Scholar] [CrossRef]
- Baker, N.R.; Rosenqvist, E. Review article: Applications of chlorophyll fluorescence can improve crop production strategies: An examination of future possibilities. J. Exp. Bot. 2004, 55, 1607–1621. [Google Scholar] [CrossRef]
- Ibrahim, M.H.; Jaafar, H.Z.E. Photosynthetic capacity, photochemical efficiency and chlorophyll content of three varieties of Labisia pumila Benth. exposed to open field and greenhouse growing conditions. Acta Physiol. Plantarum 2011, 33, 2179–2185. [Google Scholar] [CrossRef]
- Deka, M.; Baruah, K.K. Comparable studies of rainfed upland winter rice (Oryza sativa) cultivars for drought tolerance. Ind. J. Agric. Sci. 2000, 70, 135–139. [Google Scholar]
- Gauthami, P.; Subrahmanyam, D.; Padma, V.; RaghuveerRao, P.; Voleti, S.R. Influence of simulated post-anthesis water stress on stem dry matter remobilization, yield and its components in rice. Indian J. Plant Physiol. 2013, 18, 177–182. [Google Scholar] [CrossRef]
- Yu, X.-Z.; Zhang, F.-Z.; Li, F. Phytotoxicity of thiocyanate to rice seedlings. Bull. Environ. Contam. Toxicol. 2012, 88, 703–706. [Google Scholar] [CrossRef]
- Molden, D.; Murray-Rust, H.; Sakthivadivel, R.; Makin, I. A Water-Productivity Framework for Understanding and Action. In Water Productivity in Agriculture: Limits and Opportunities for Improvement; Kijne, J.W., Barker, R., Molden, D., Eds.; Comprehensive Assessment of Water Management in Agriculture Series, No 1. International Water Management Institute: Colombo, Sri Lanka, 2003. [Google Scholar]
- Nakano, Y.; Asada, K. Hydrogen peroxide is scavenged by ascorbate specific peroxidase in spinach chloroplast. Plant Cell Physiol. 1981, 22, 867–880. [Google Scholar]
- Ibrahim, M.H.; Jaafar, H.Z.E. Reduced photoinhibition under low irradiance enhanced kacipfatimah (Labisiapumila Benth) secondary metabolites, phenyl alanine lyase and antioxidant activity. Int. J. Mol. Sci. 2012, 13, 5290–5306. [Google Scholar] [CrossRef]
- Aebi, H. Catalase. In Methods of Enzymatic Analysis, 3rd ed.; Bergmeyer, H., Verlag, C., Weinheim, A., Eds.; Scientific Pulication: Herndon, VA, USA, 1983. [Google Scholar]
- Ibrahim, M.H.; Hawa, Z.E.J. Primary, Secondary Metabolites, H2O2, Malondialdehyde and Photosynthetic responses of Orthosiphon stimaneus Benth. to different irradiance levels. Molecules 2012, 17, 1159–1176. [Google Scholar] [CrossRef]
- Ibrahim, M.H.; Jaafar, H.Z. Impact of elevated carbon dioxide on primary, secondary metabolites and antioxidant responses of Eleais guineensis Jacq. (Oil Palm) seedlings. Molecules 2012, 17, 5195–5211. [Google Scholar] [CrossRef]
- Anwarmalik, M.F.; Ashraf, M.; Qureshi, A.S.; Ghafoor, A. Assessment of Genetic Variability, Correlation and Path Analyses for Yield and its Components in Soybean. Pak. J. Bot. 2007, 39, 405–413. [Google Scholar]
- Sample Availability: Not available.
© 2014 by the authors. Licensee MDPI, Basel, Switzerland. This article is an open access article distributed under the terms and conditions of the Creative Commons Attribution license ( http://creativecommons.org/licenses/by/3.0/).
Share and Cite
Zain, N.A.M.; Ismail, M.R.; Mahmood, M.; Puteh, A.; Ibrahim, M.H. Alleviation of Water Stress Effects on MR220 Rice by Application of Periodical Water Stress and Potassium Fertilization. Molecules 2014, 19, 1795-1819. https://doi.org/10.3390/molecules19021795
Zain NAM, Ismail MR, Mahmood M, Puteh A, Ibrahim MH. Alleviation of Water Stress Effects on MR220 Rice by Application of Periodical Water Stress and Potassium Fertilization. Molecules. 2014; 19(2):1795-1819. https://doi.org/10.3390/molecules19021795
Chicago/Turabian StyleZain, Nurul Amalina Mohd, Mohd Razi Ismail, Maziah Mahmood, Adam Puteh, and Mohd Hafiz Ibrahim. 2014. "Alleviation of Water Stress Effects on MR220 Rice by Application of Periodical Water Stress and Potassium Fertilization" Molecules 19, no. 2: 1795-1819. https://doi.org/10.3390/molecules19021795