Simultaneous Quantitation and Validation of Triterpenoids and Phytosteroids in Phaseolus angularis Seeds

 ,
,
Abstract
:
1. Introduction

2. Results and Discussion
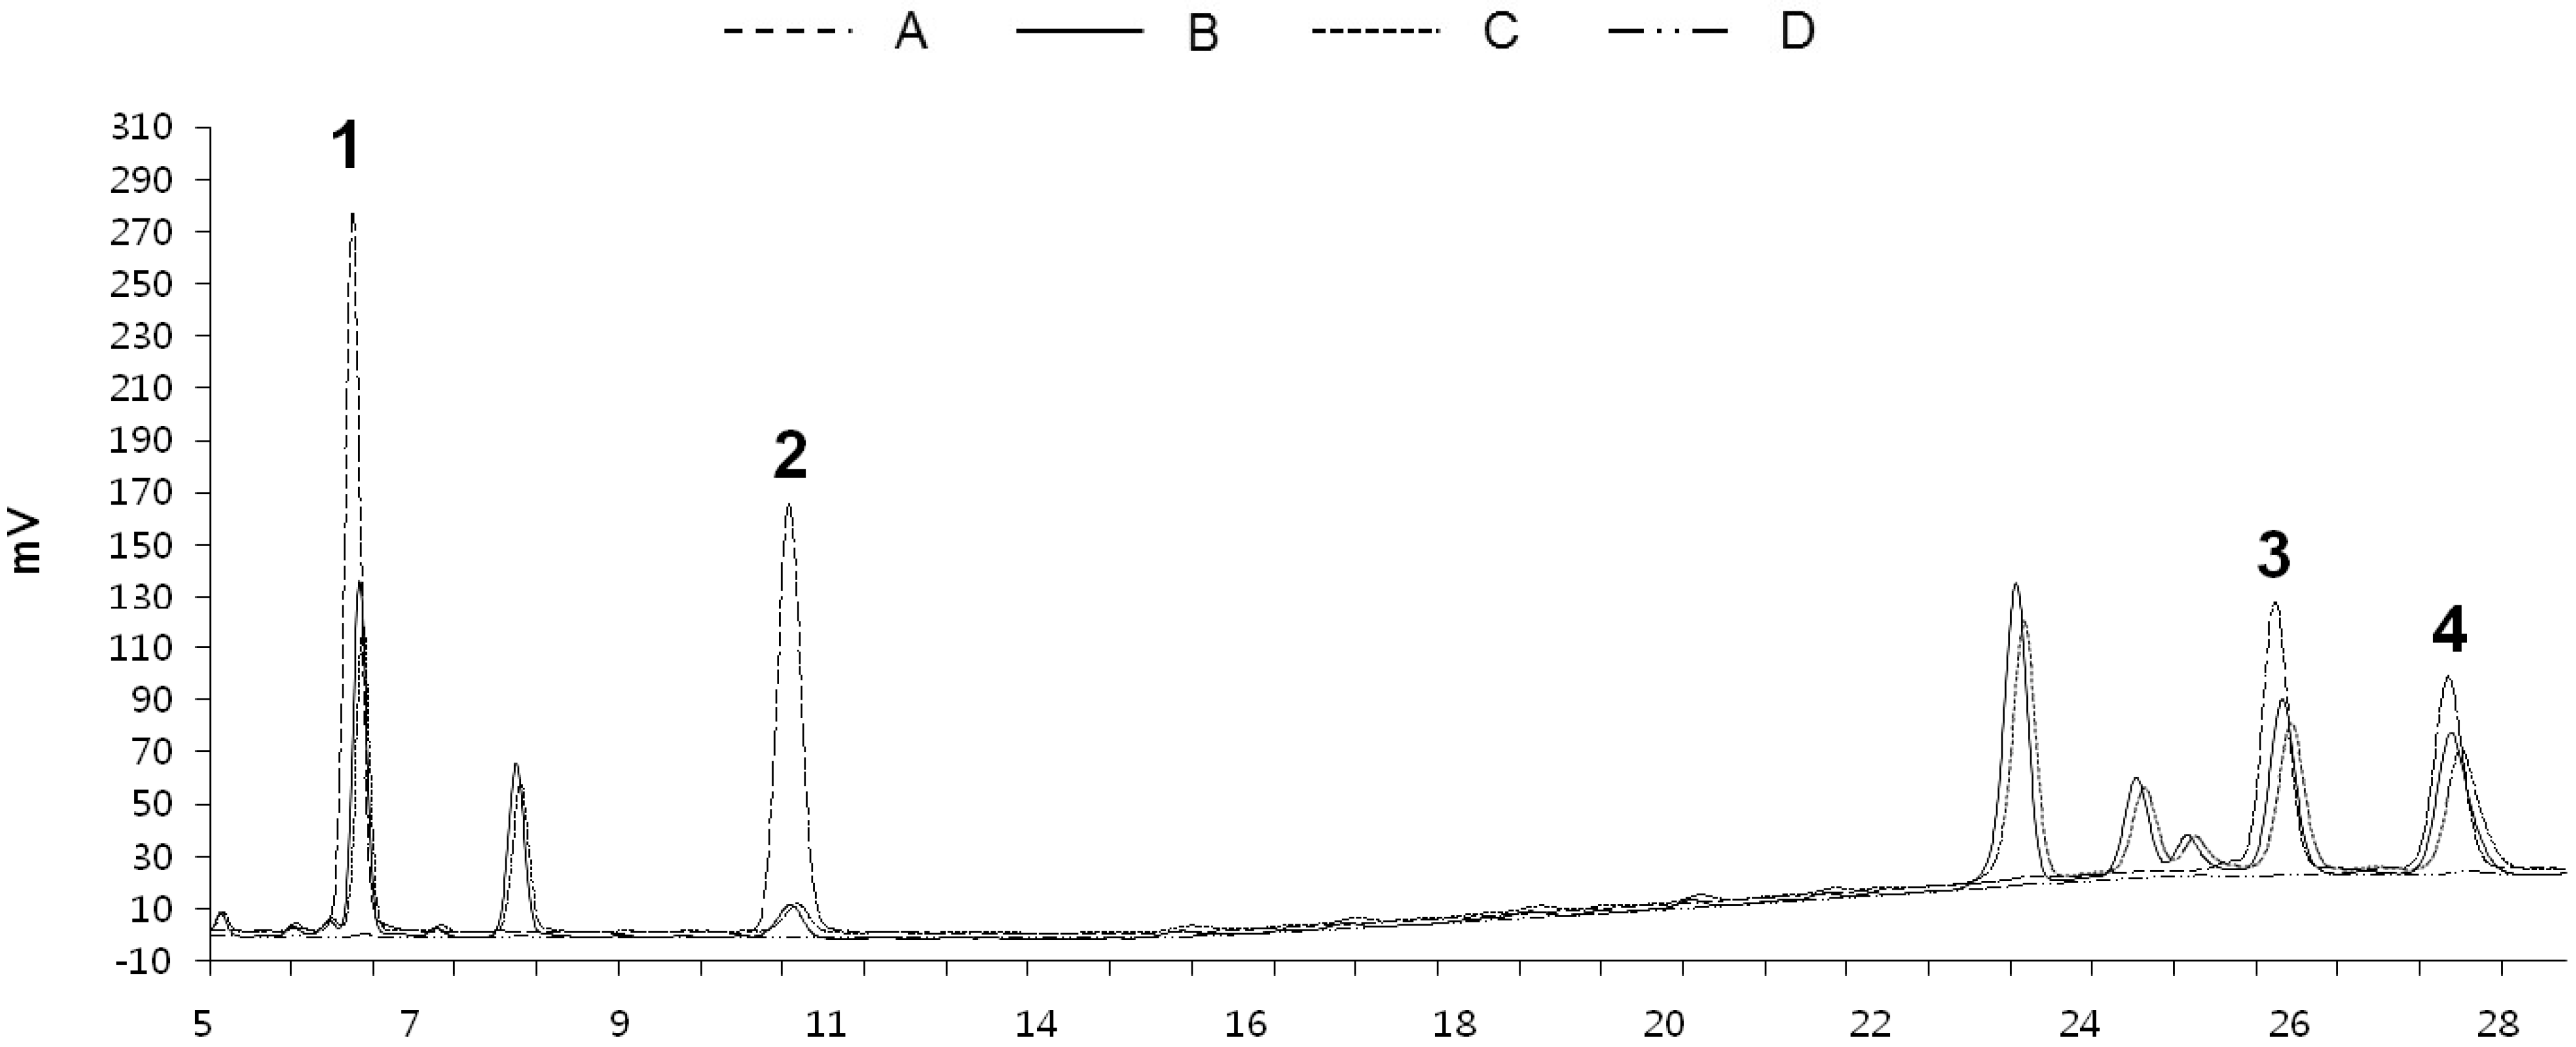
2.1. Optimization of Chromatographic Conditions


| Compound | Contents (n = 3) | ||
|---|---|---|---|
| EtOH | Ethyl Acetate | Water | |
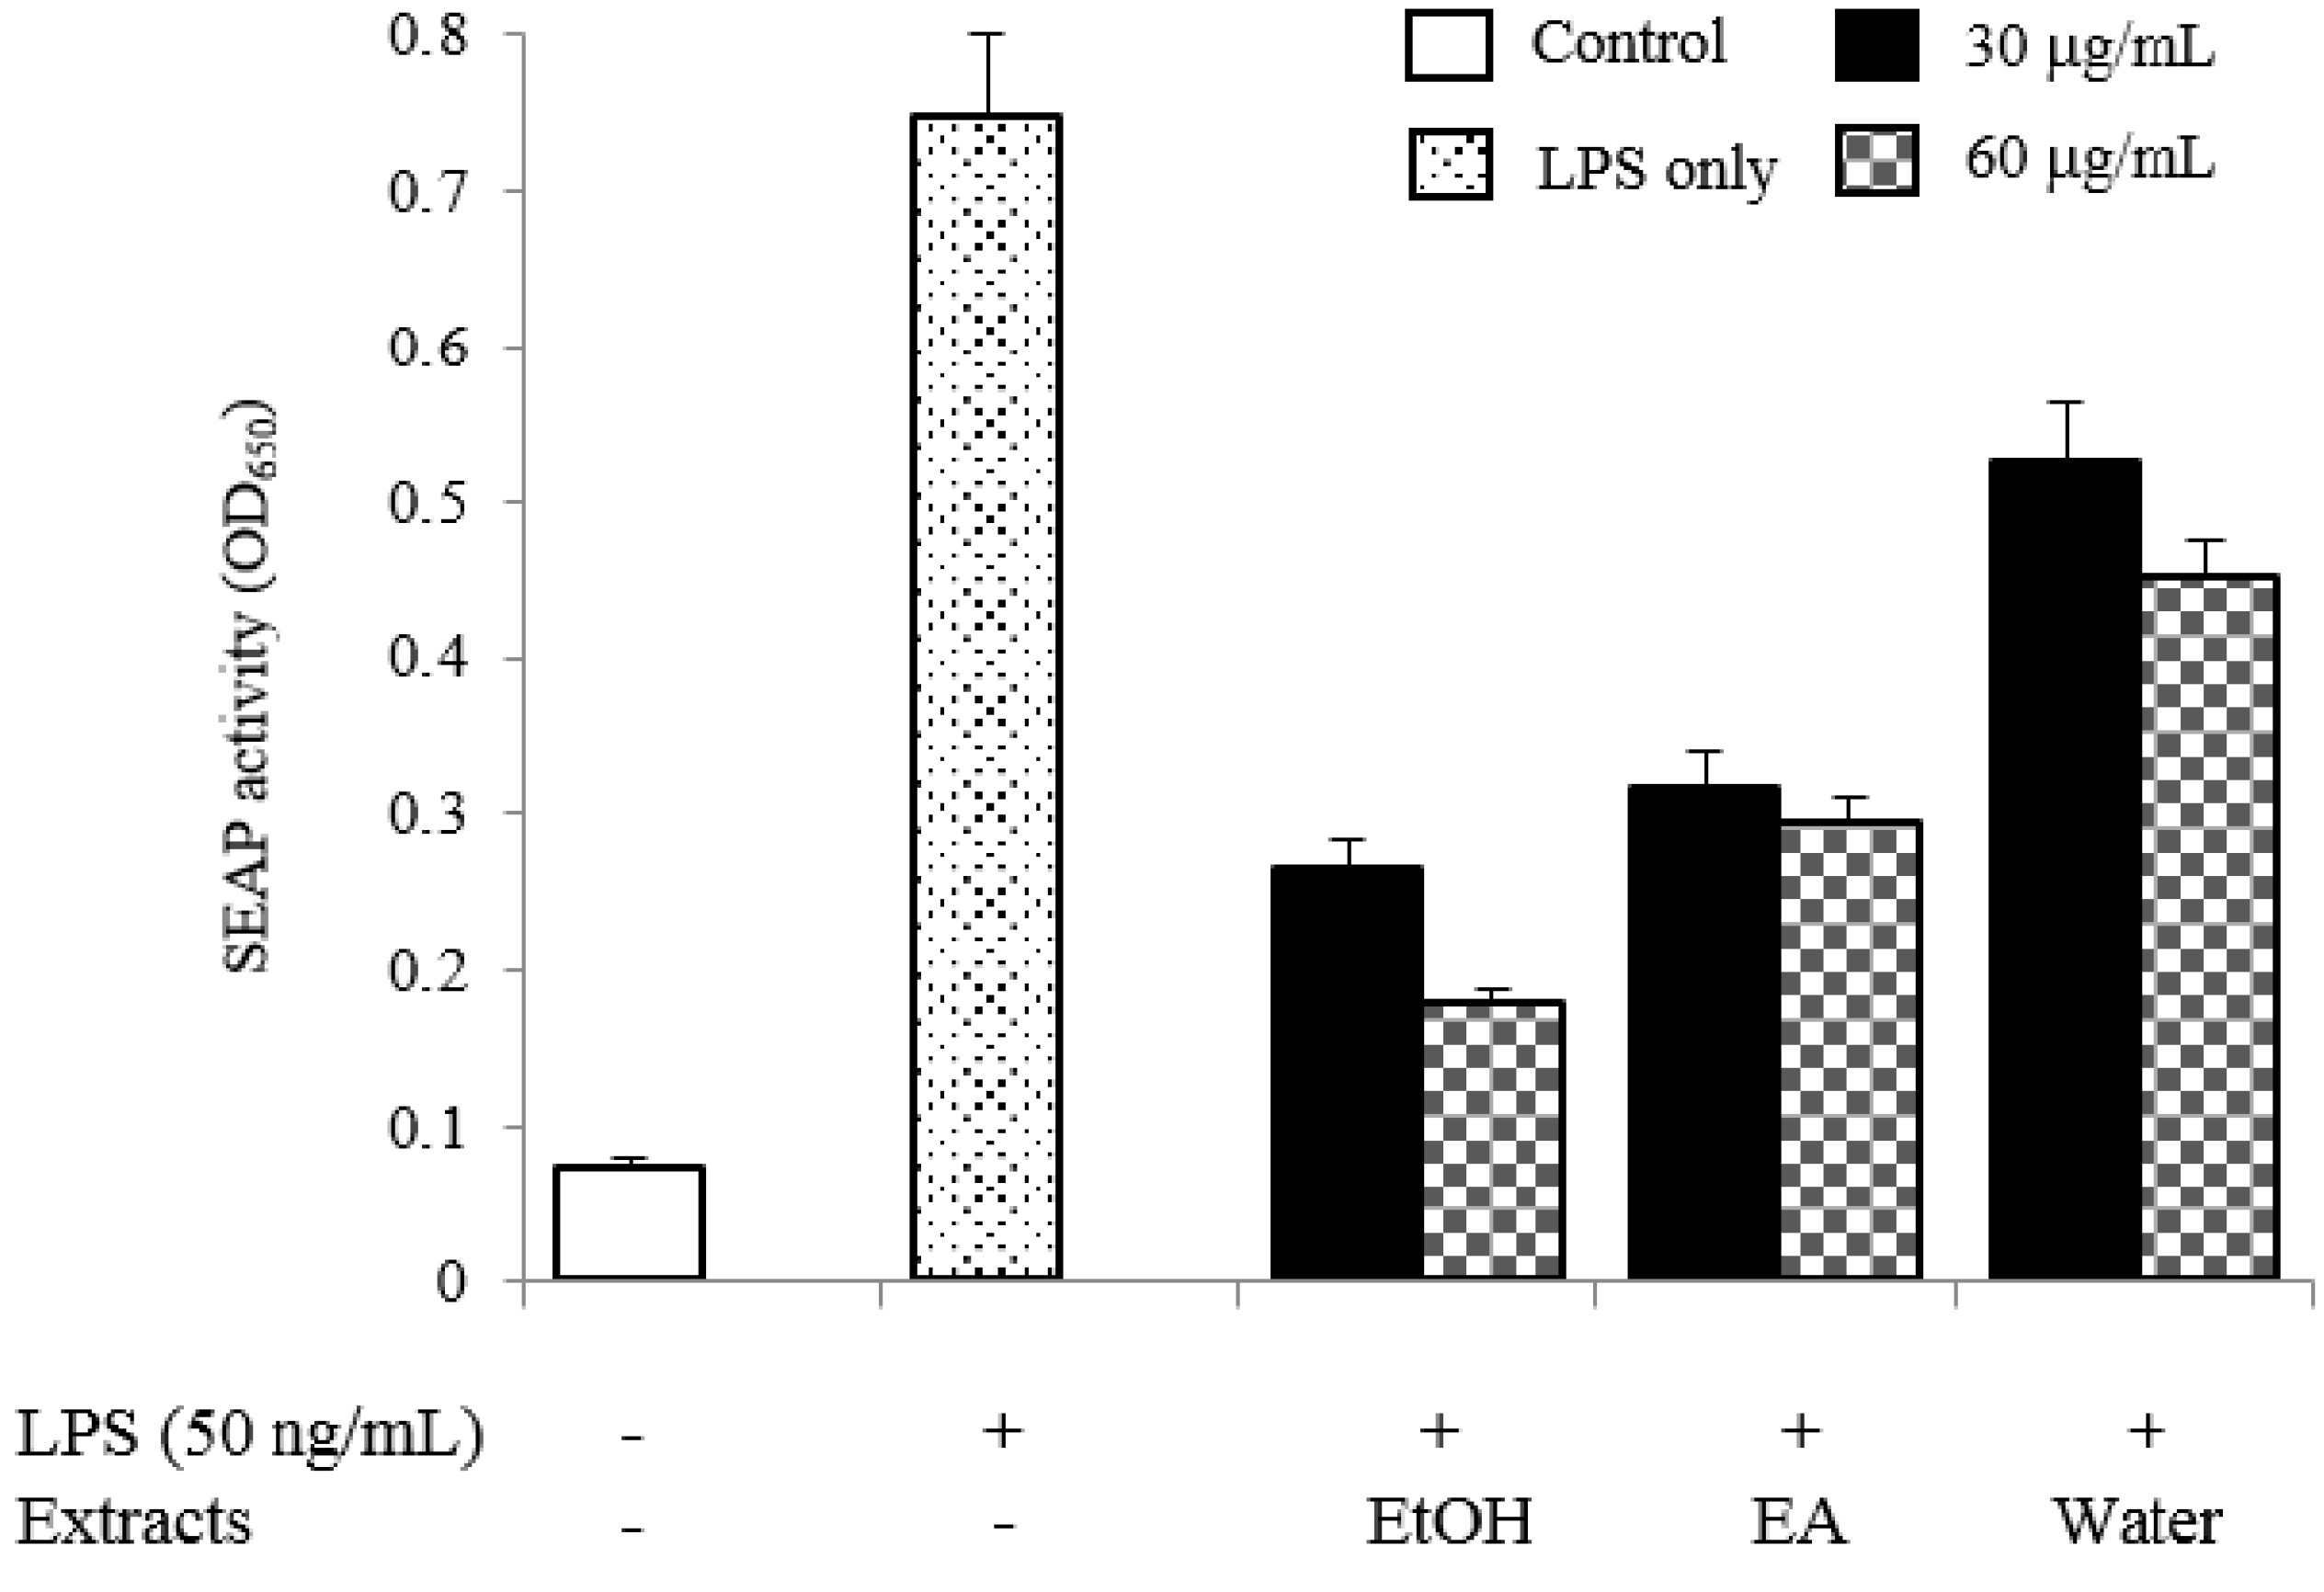
| 1 | 3.76 ± 0.04 a | 2.83 ± 0.05 | 0.04 ± 0.20 |
| 2 | 0.72 ± 0.10 | 0.48 ± 0.49 | 0.02 ± 1.18 |
| 3 | 5.76 ± 0.05 | 4.07 ± 0.25 | 0.03 ± 1.35 |
| 4 | 7.38 ± 0.07 | 5.25 ± 0.17 | 0.19 ± 0.98 |
2.2. Validation of Developed Analytical Method
2.2.1. Linearity
| Compounds | tR (min) | Equation(Linear Model) a | Linear Range (mg/mL) | r 2 b | LOD c (mg/mL) | LOQ d (mg/mL) |
|---|---|---|---|---|---|---|
| 1 | 6.53 | y = 1,048,348x − 3930 | 0.005–3 | 0.9993 | 0.0016 | 0.0052 |
| 2 | 10.92 | y = 958,420x − 3329 | 0.005–3 | 0.9993 | 0.0003 | 0.0011 |
| 3 | 26.09 | y = 626,343x − 578 | 0.005–3 | 0.9990 | 0.0023 | 0.0076 |
| 4 | 27.82 | y = 509,396x − 2377 | 0.005–3 | 0.9993 | 0.0035 | 0.0115 |
2.2.2. Precision and Accuracy
| Compounds | Spiked Amount (mg/mL) | Content (mg/mL) | Recovery Test (%, n = 3) | Precision Test (n = 3) | ||
|---|---|---|---|---|---|---|
| Expected | Measured | Intra-Day RSD a (%) | Inter-Day RSD (%) | |||
| 1 | 0.10 | 3.8593 | 3.8521 | 99.8 | 0.04 | 0.85 |
| 0.30 | 4.0593 | 3.9991 | 98.5 | 0.08 | 0.65 | |
| 1.00 | 4.7593 | 4.7506 | 99.8 | 0.01 | 0.90 | |
| 2 | 0.02 | 0.7390 | 0.7446 | 100.8 | 0.62 | 0.63 |
| 0.06 | 0.7790 | 0.7805 | 100.2 | 0.83 | 0.52 | |
| 0.20 | 0.9109 | 0.9203 | 100.1 | 0.49 | 0.89 | |
| 3 | 0.15 | 5.9080 | 5.9644 | 100.8 | 0.69 | 0.78 |
| 0.45 | 6.2090 | 6.1723 | 99.4 | 0.25 | 0.89 | |
| 1.50 | 7.2590 | 7.3032 | 100.6 | 0.36 | 0.75 | |
| 4 | 0.20 | 7.5800 | 7.6294 | 100.7 | 0.92 | 0.56 |
| 0.60 | 7.9800 | 7.9151 | 99.2 | 0.66 | 0.86 | |
| 2.00 | 9.3800 | 9.3890 | 100.0 | 0.10 | 0.87 | |
2.2.3. LOD, and LOQ
2.3. Quantitation of Compounds 1–4
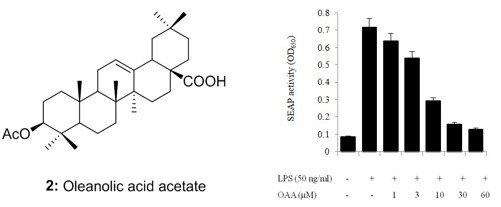
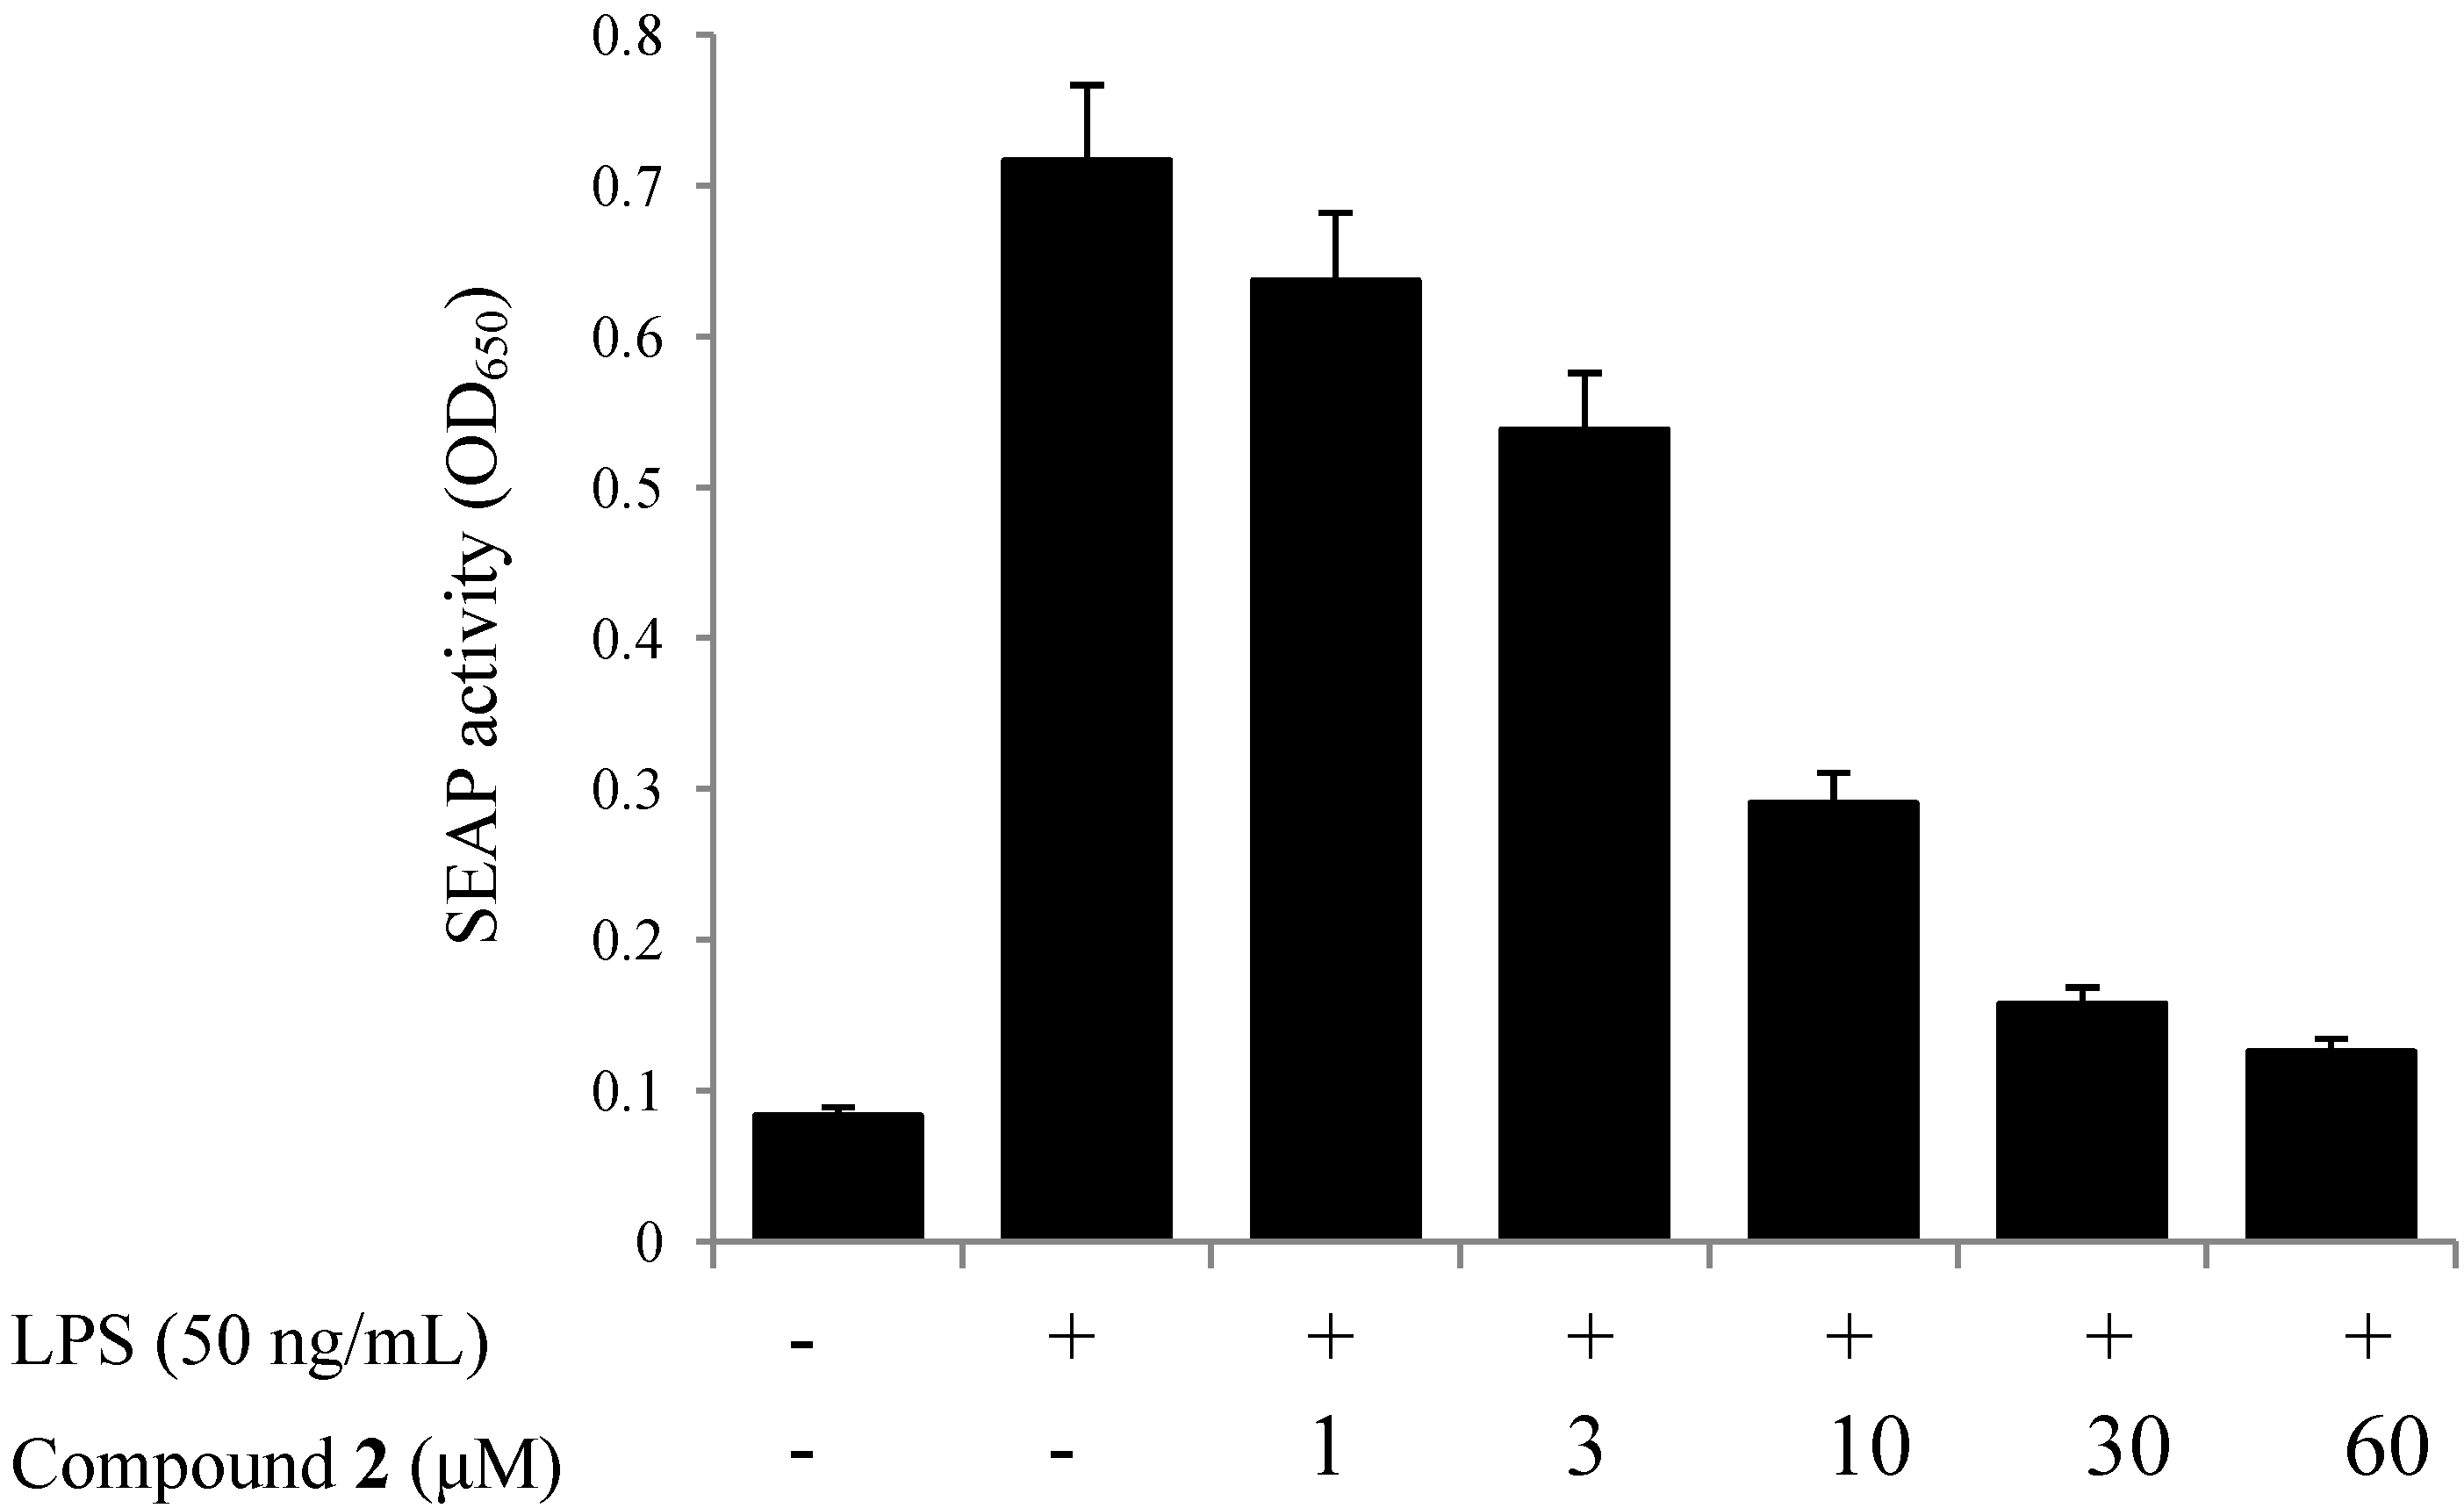
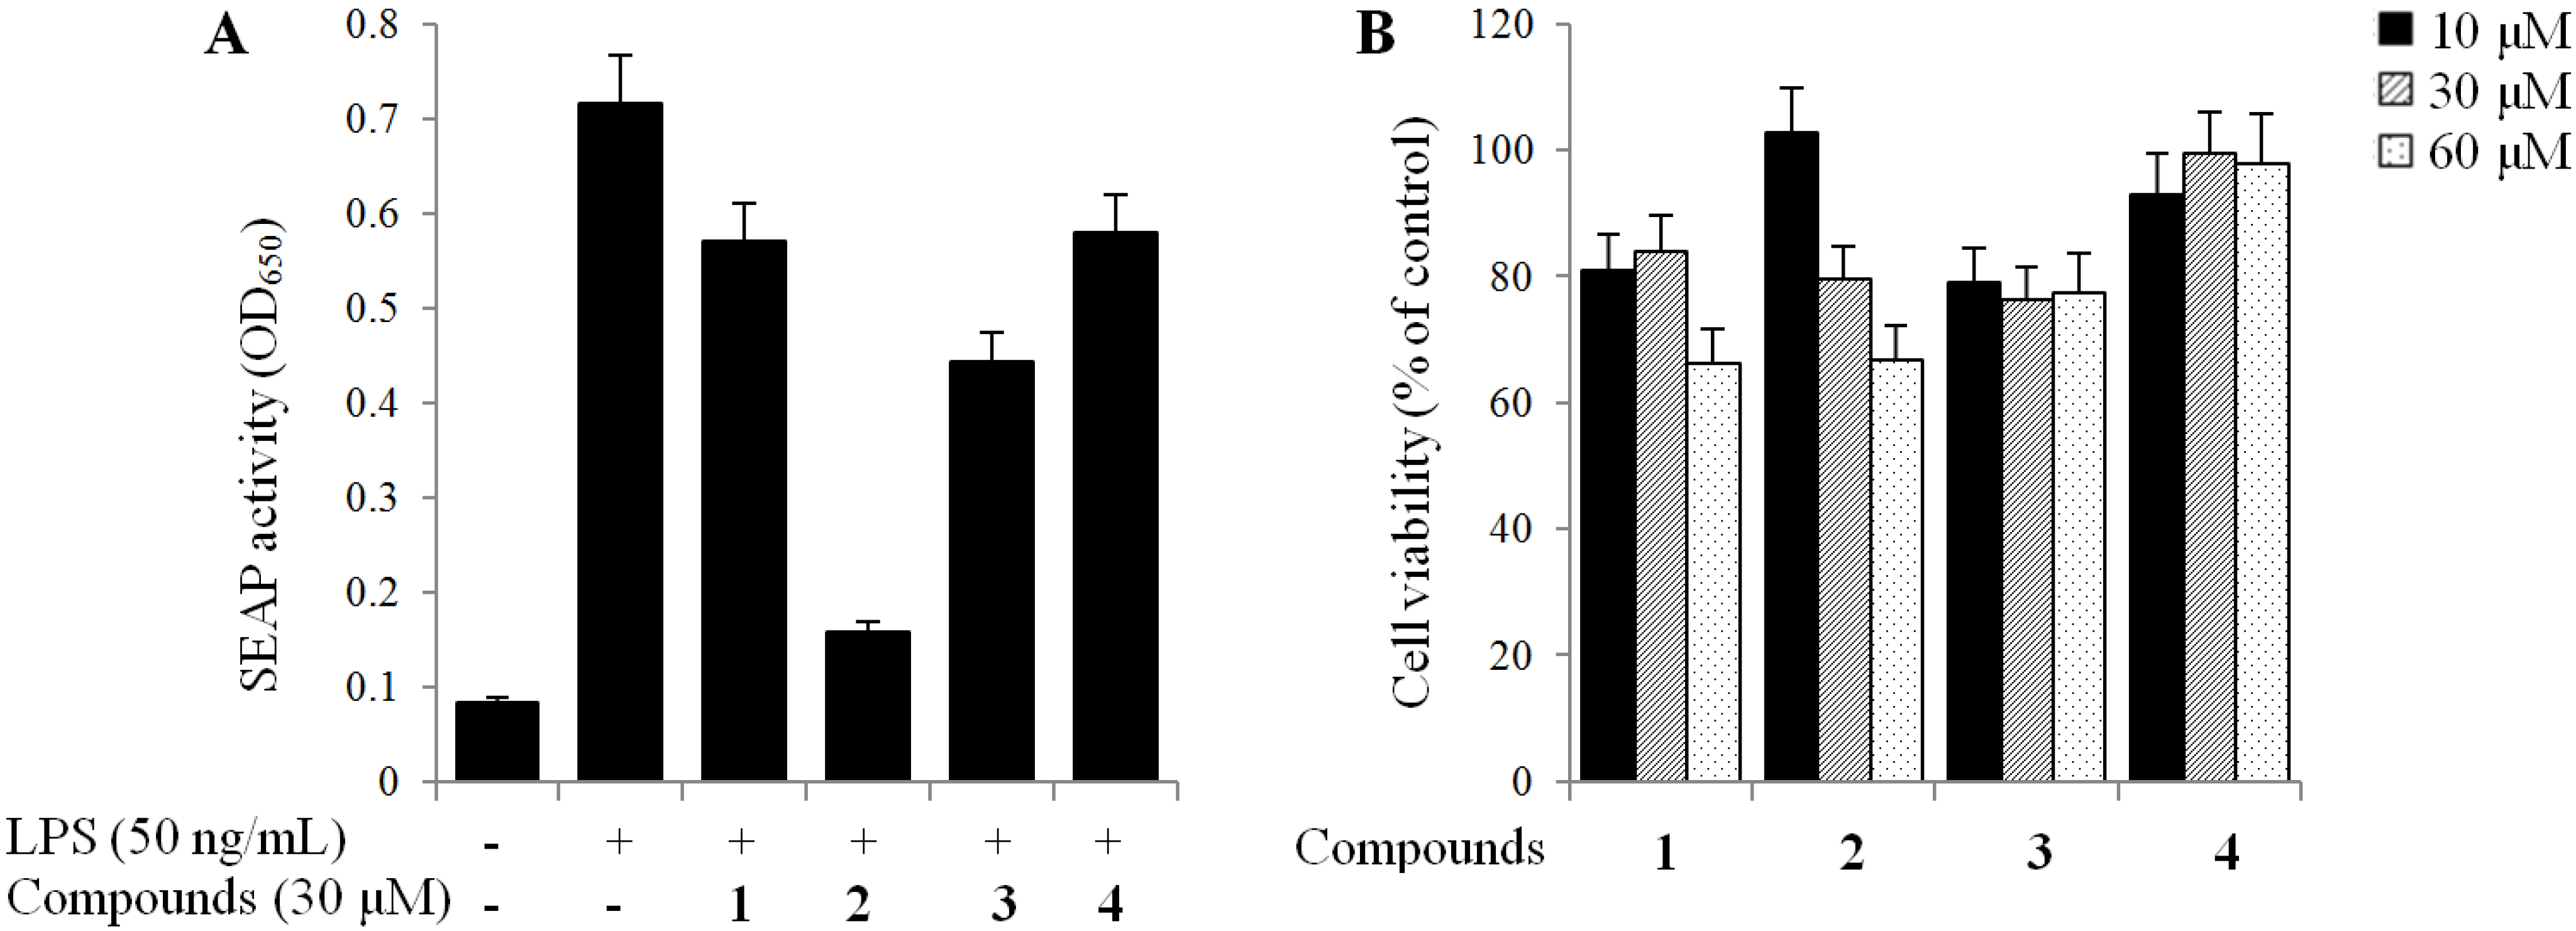
2.4. TLR4 Inhibitory Activity


3. Experimental
3.1. General Procedures
3.2. Materials and Chemicals
Plant Materials
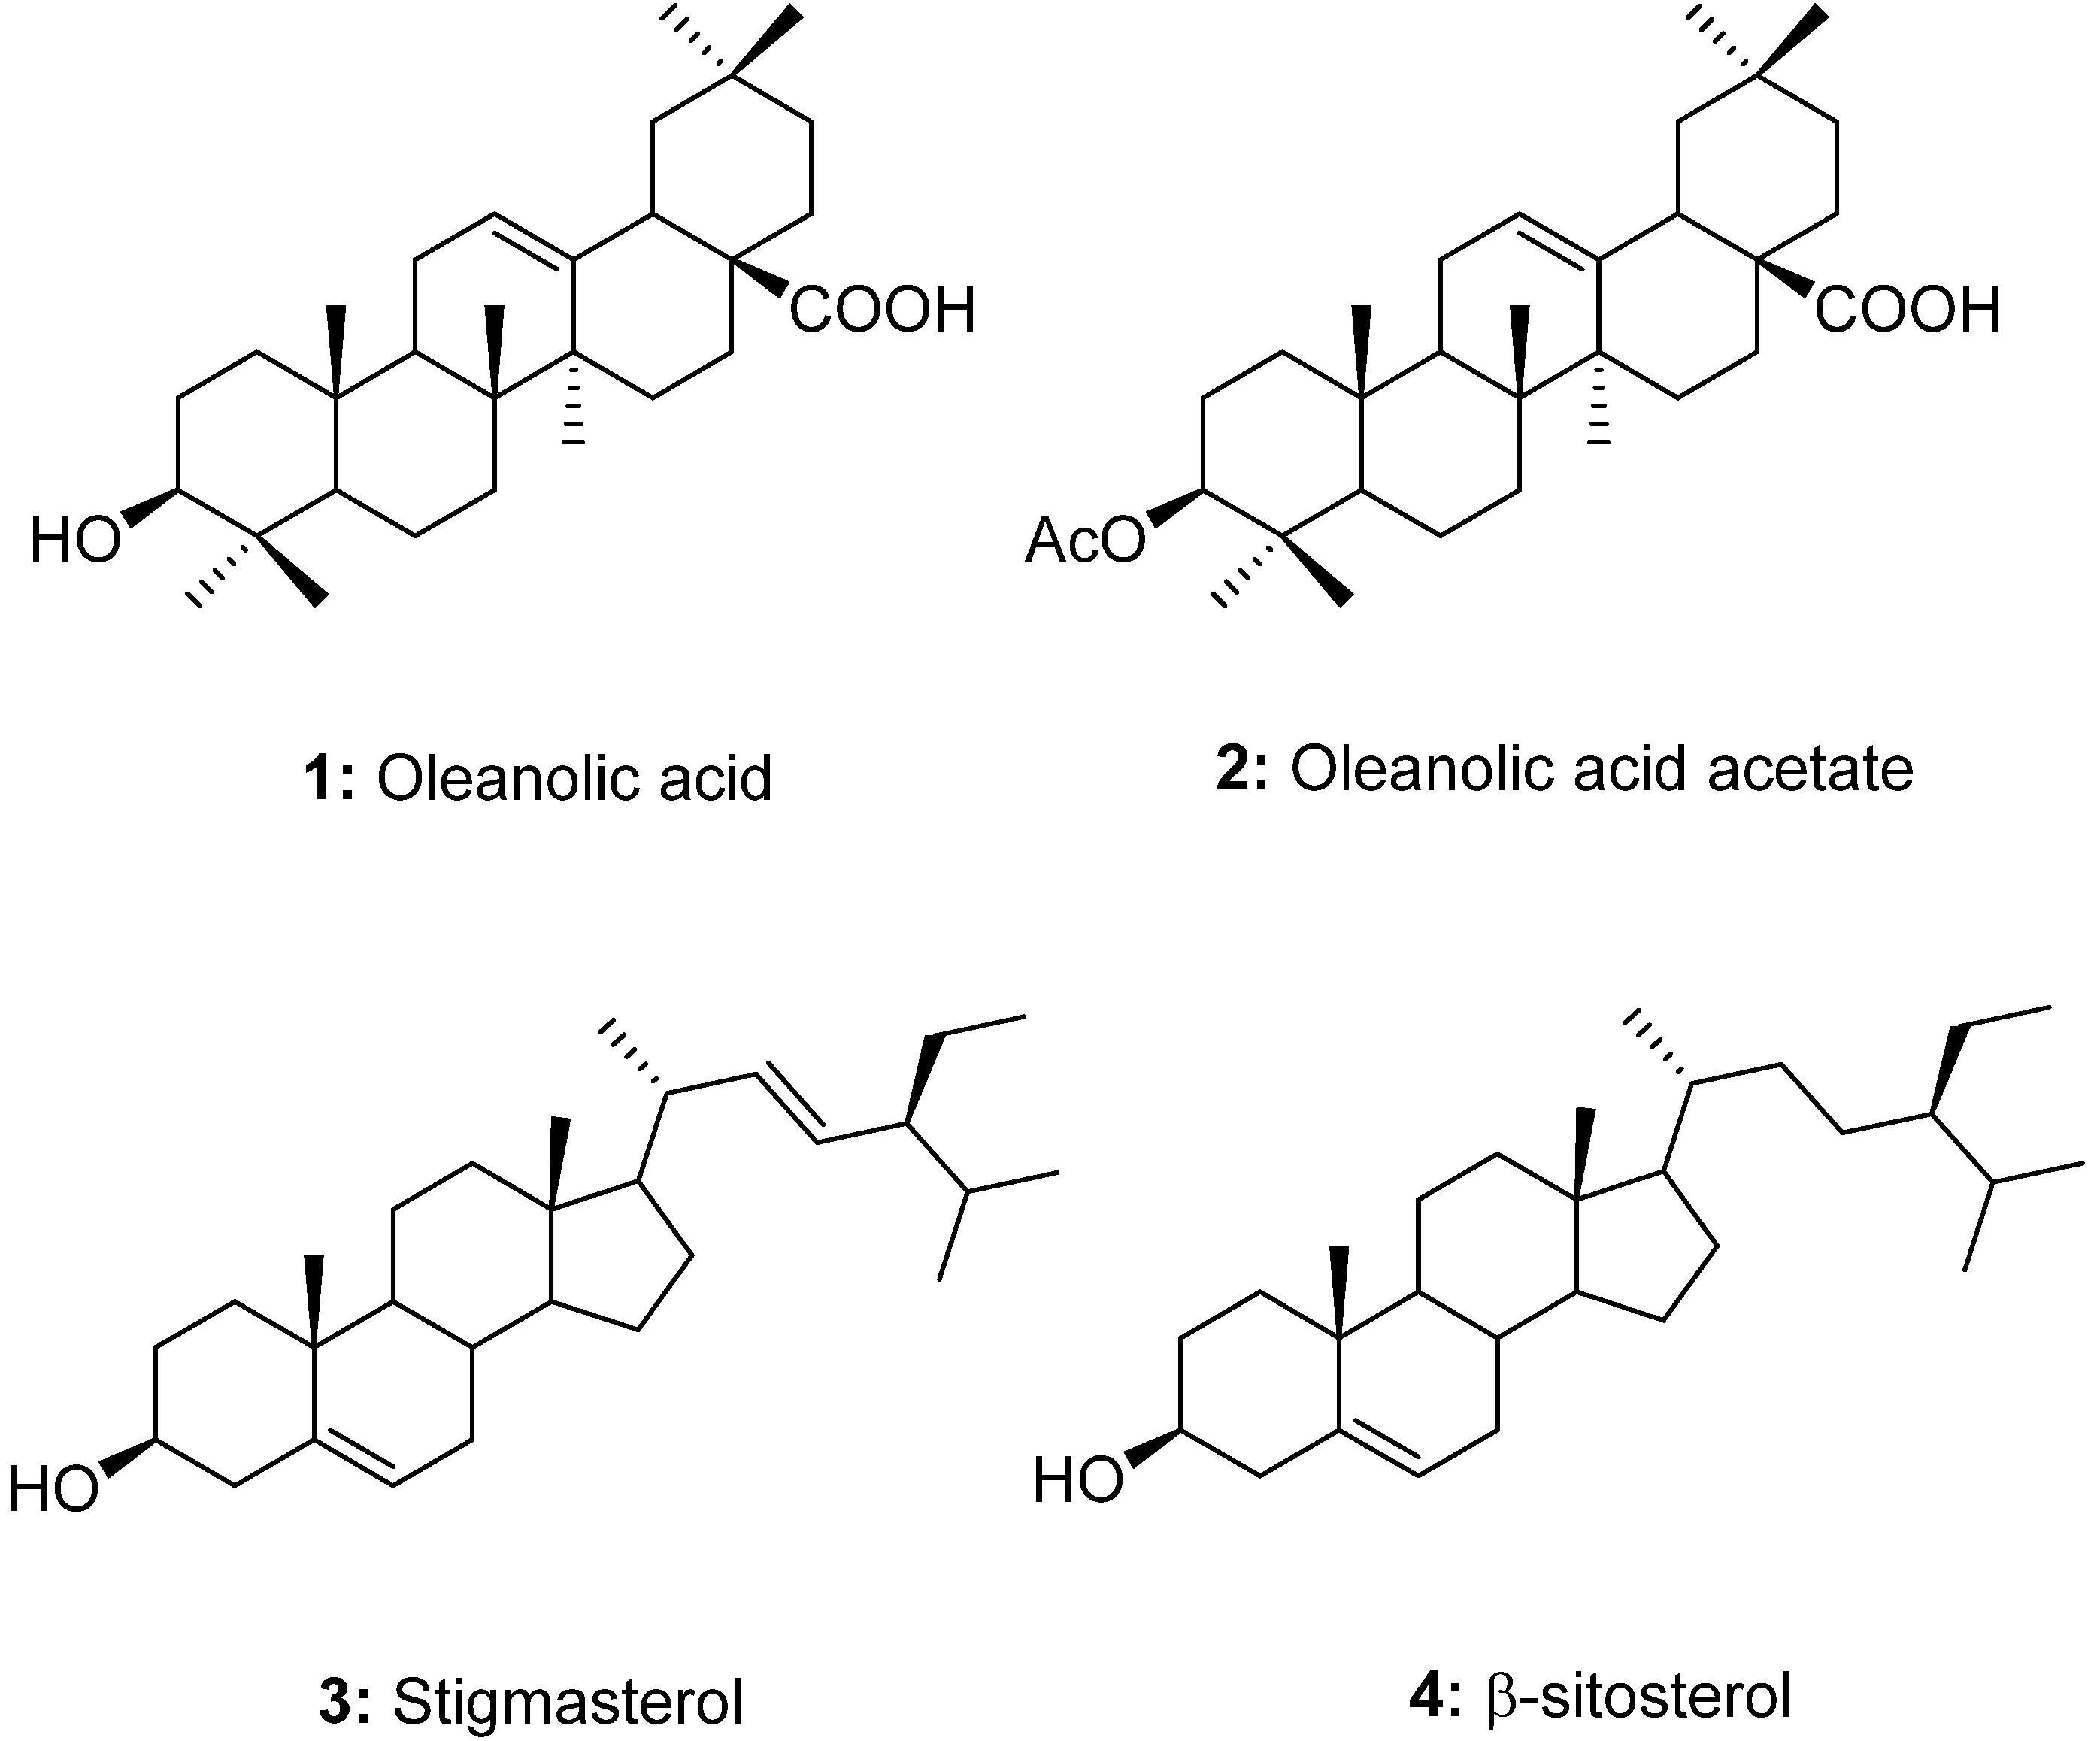
3.3. Isolation and Identification of Compounds 1–4
3.3.1. Oleanolic Acid (1)
3.3.2. Oleanolic Acid Acetate (2)
3.3.3. Stigmasterol (3)
3.3.4. β-Sitosterol (4)
3.4. Sample Preparation for HPLC
3.5. Validation of the HPLC Methods
3.6. Assay for Inhibition of TLR4 Activity
4. Conclusions
Acknowledgments
Author Contributions
Conflicts of Interest
References
- Itoh, T.; Umekawa, H.; Furuichi, Y. Potential ability of hot water adzuki (Vigna angularis) extracts to inhibit the adhesion, invasion, and metastasis of murine B16 melanoma cells. Biosci. Biotechnol. Biochem. 2005, 69, 448–454. [Google Scholar] [CrossRef]
- Itoh, T.; Itoh, Y.; Hibasami, H.; Katsuzaki, H.; Imai, K.; Furuichi, Y.; Komiya, T. Vignoside, a novel new sesquiterpene glucoside obtained from a hot-water extract of adzuki beans (Vigna angularis). Nippon Shokuhin Kagaku Kougaku Kaishi 2005, 52, 319–323. [Google Scholar] [CrossRef]
- Yao, Y.; Cheng, X.; Wang, L.; Wang, S.; Ren, G. A determination of potential α-glucosidase inhibitors from azuki beans (Vigna angularis). Int. J. Mol. Sci. 2011, 12, 6445–6451. [Google Scholar] [CrossRef]
- Itoh, T.; Hori, Y.; Atsumi, T.; Toriizuka, K.; Nakamura, T.; Maeyama, T.; Ando, M.; Tsukamasa, Y.; Ida, Y.; Furuich, Y. Hot water extract of adzuki beans (Vigna angularis) suppresses antigen-stimulated degranulation in rat basophilic leukemia RBL-2H3 cells and passive cutaneous anaphylaxis reaction in mice. Phytother. Res. 2012, 26, 1003–1011. [Google Scholar] [CrossRef]
- Sato, S.; Mukai, Y.; Yamate, J.; Kato, J.; Kurasaki, M.; Hatai, A.; Sagai, M. Effect of polyphenol-containing azuki beans (Vigna angularis) extract on blood pressure elevation and macrophage infiltration in the heart and kidney of spontaneously hypertensive rats. Clin. Exp. Pharmacol. Physiol. 2008, 35, 43–49. [Google Scholar] [CrossRef]
- Oh, H.; Lee, S.W.; Yun, B.R.; Hwang, B.S.; Kim, S.N.; Park, C.S.; Jeoung, S.; Kim, H.; Lee, W.S.; Rho, M. Vigna angularis inhibits IL-6-induced cellular signaling and ameliorates collagen-induced arthritis. Rheumatology 2014, 53, 56–64. [Google Scholar] [CrossRef]
- Yu, T.; Ahn, H.M.; Shen, T.; Yoon, K.; Jang, H.; Lee, Y.; Yang, H.; Kim, J.; Kim, C.; Han, M.; et al. Anti-inflammatory activity of ethanol extract derived from Phaseouls angularis beans. J. Ethanopharmacol. 2011, 137, 1197–1206. [Google Scholar] [CrossRef]
- Kim, M.H.; Jeoung, S.H.; Lee, S.W.; Kim, H.K.; Park, C.S.; Jeon, B.H.; Oh, H.M.; Rho, M.C. Effect of Vigna angularis on toll-like receptor activation and pro-inflammatory cytokine production. Kor. J. Orient. Physiol. Pathol. 2012, 26, 511–518. [Google Scholar]
- Anwar, M.A.; Basith, S.; Choi, S. Negative regulatory approaches to the attenuation of Toll-like receptor signaling. Exp. Mol. Med. 2013, 45, e11. [Google Scholar] [CrossRef]
- Rho, M.C.; Lee, W.S.; Oh, H.M.; Kim, Y.M.; Ryu, Y.B.; Park, S.J.; Lee, S.W.; Cho, K.O. Pharmaceutical Composition Containing Oleanolic Acid Acetate as an Active Ingredient for Preventing or Treating TLR- or IL-6-Mediated Diseases. U.S. Patent 20,140,179,780, 26 June 2014. [Google Scholar]
- Zacchigna, M.; Cateni, F.; Faudale, M.; Sosa, S.; Della Loggia, R. Rapid HPLC analysis for quantitative determination of the two isomeric triterpenic acids, oleanolic acid and ursolic acid, in Plantago Major. Sci. Pharm. 2009, 77, 79–86. [Google Scholar] [CrossRef]
- Unnati, M.; Shah, S.M.; Patel, P.H.; Hingorani, L.; adhav, R.B. Development and validation of a simple isocratic HPLC method for simultaneous estimation of phytosterols in Cissus quadrangularis. Indian J. Pharm. Sci. 2010, 72, 753–758. [Google Scholar] [CrossRef]
- Gohari, A.R.; Saeidnia, S.; Hadjiakhoondi, A.; Abdoullahi, M.; Nezafati, M. Isolation and quantificative analysis of oleanolic acid from Satureja mutica Fisch. & C.A. Mey. J. Med. Plants Res. 2009, 8, 65–69. [Google Scholar]
- Werner, S.; Nebojsa, S.; Robert, W.; Robert, S.; Olaf, K. Complete assignments of 1H and 13C-NMR resonances of oleanolic acid, 18α-oleanolic acid, ursolic acid and their 11-oxo derivatives. Magn. Reson. Chem. 2003, 41, 636–638. [Google Scholar] [CrossRef]
- Naved, T.; Ansari, S.H.; Mukhtar, H.M.; Ali, M. New triterpenic esters of oleanene-series from the flowers of Calendula officinalis Linn. Indian J. Chem. 2003, 44, 1088–1091. [Google Scholar]
- Kamboj, A.; Saluja, A.K. Isolation of stigmasterol and β-sitosterol from petroleum ether extract of aerial parts of Ageratum Conyzoides (Asteraceae). Int. J. Pharm. Pharm. Sci. 2011, 3, 94–96. [Google Scholar]
- Sample Availability: Not available.
© 2014 by the authors. Licensee MDPI, Basel, Switzerland. This article is an open access article distributed under the terms and conditions of the Creative Commons Attribution license ( http://creativecommons.org/licenses/by/4.0/).
Share and Cite
Hwang, J.T.; Oh, H.-M.; Kim, M.-H.; Jeong, H.J.; Lee, C.; Jang, H.-J.; Lee, S.W.; Park, C.S.; Rho, M.-C. Simultaneous Quantitation and Validation of Triterpenoids and Phytosteroids in Phaseolus angularis Seeds. Molecules 2014, 19, 10309-10319. https://doi.org/10.3390/molecules190710309
Hwang JT, Oh H-M, Kim M-H, Jeong HJ, Lee C, Jang H-J, Lee SW, Park CS, Rho M-C. Simultaneous Quantitation and Validation of Triterpenoids and Phytosteroids in Phaseolus angularis Seeds. Molecules. 2014; 19(7):10309-10319. https://doi.org/10.3390/molecules190710309
Chicago/Turabian StyleHwang, Joo Tae, Hyun-Mee Oh, Mi-Hwa Kim, Hyung Jae Jeong, Chul Lee, Hyun-Jae Jang, Seung Woong Lee, Chan Sun Park, and Mun-Chual Rho. 2014. "Simultaneous Quantitation and Validation of Triterpenoids and Phytosteroids in Phaseolus angularis Seeds" Molecules 19, no. 7: 10309-10319. https://doi.org/10.3390/molecules190710309