
Reduction of False Positives in Structure-Based Virtual Screening When Receptor Plasticity Is Considered


Abstract
:1. Introduction

2. Results and Discussion

| Selection for the T-Loop Binding Pocket | Selection for the RNA Binding Site | ||
|---|---|---|---|
| Level of Comparison | Molecules Selected | Level of Comparison | Molecules Selected |
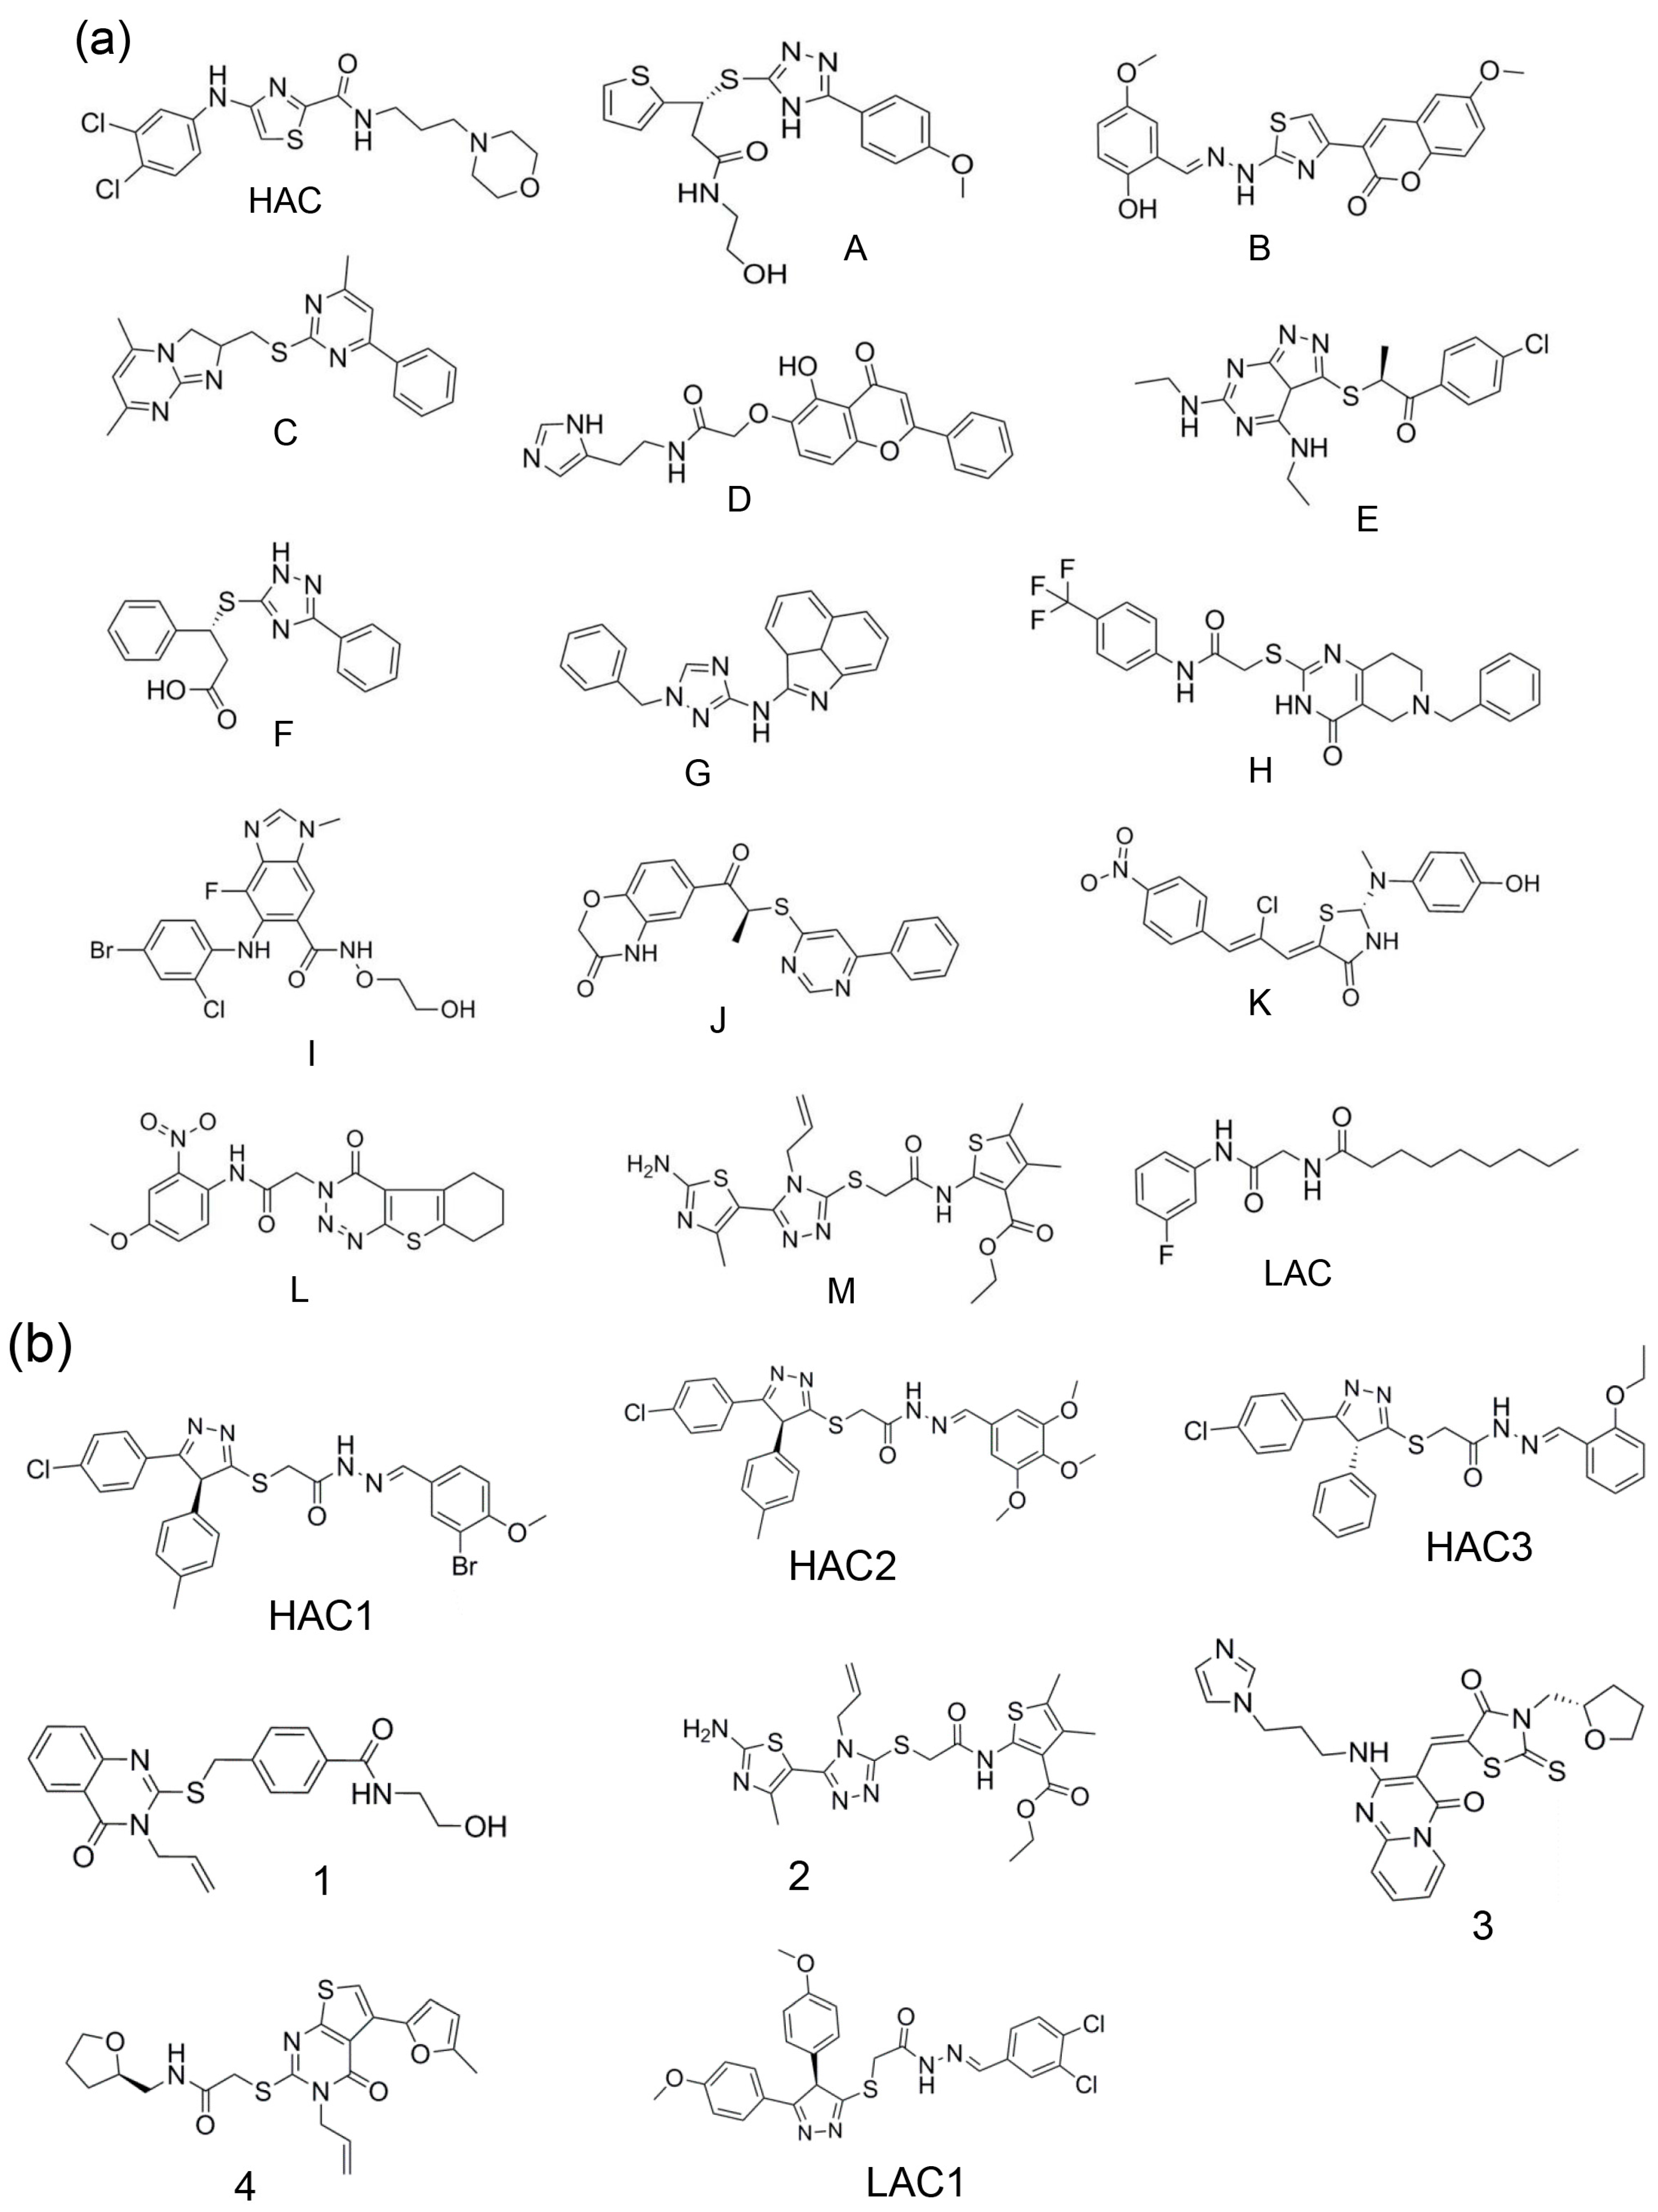
| Top-ranked 50 | A | Top-ranked 10 | - |
| Top-ranked 100 | HAC and B | Top-ranked 20 | HAC1 |
| Top-ranked 150 | C-E | Top-ranked 30 | HAC2 |
| Top-ranked 200 | F-M | Top-ranked 40 | 1 |
| - | - | Top-ranked 50 | HAC3, 2-4 |
| Total molecules selected | 14 | Total molecules selected | 7 |
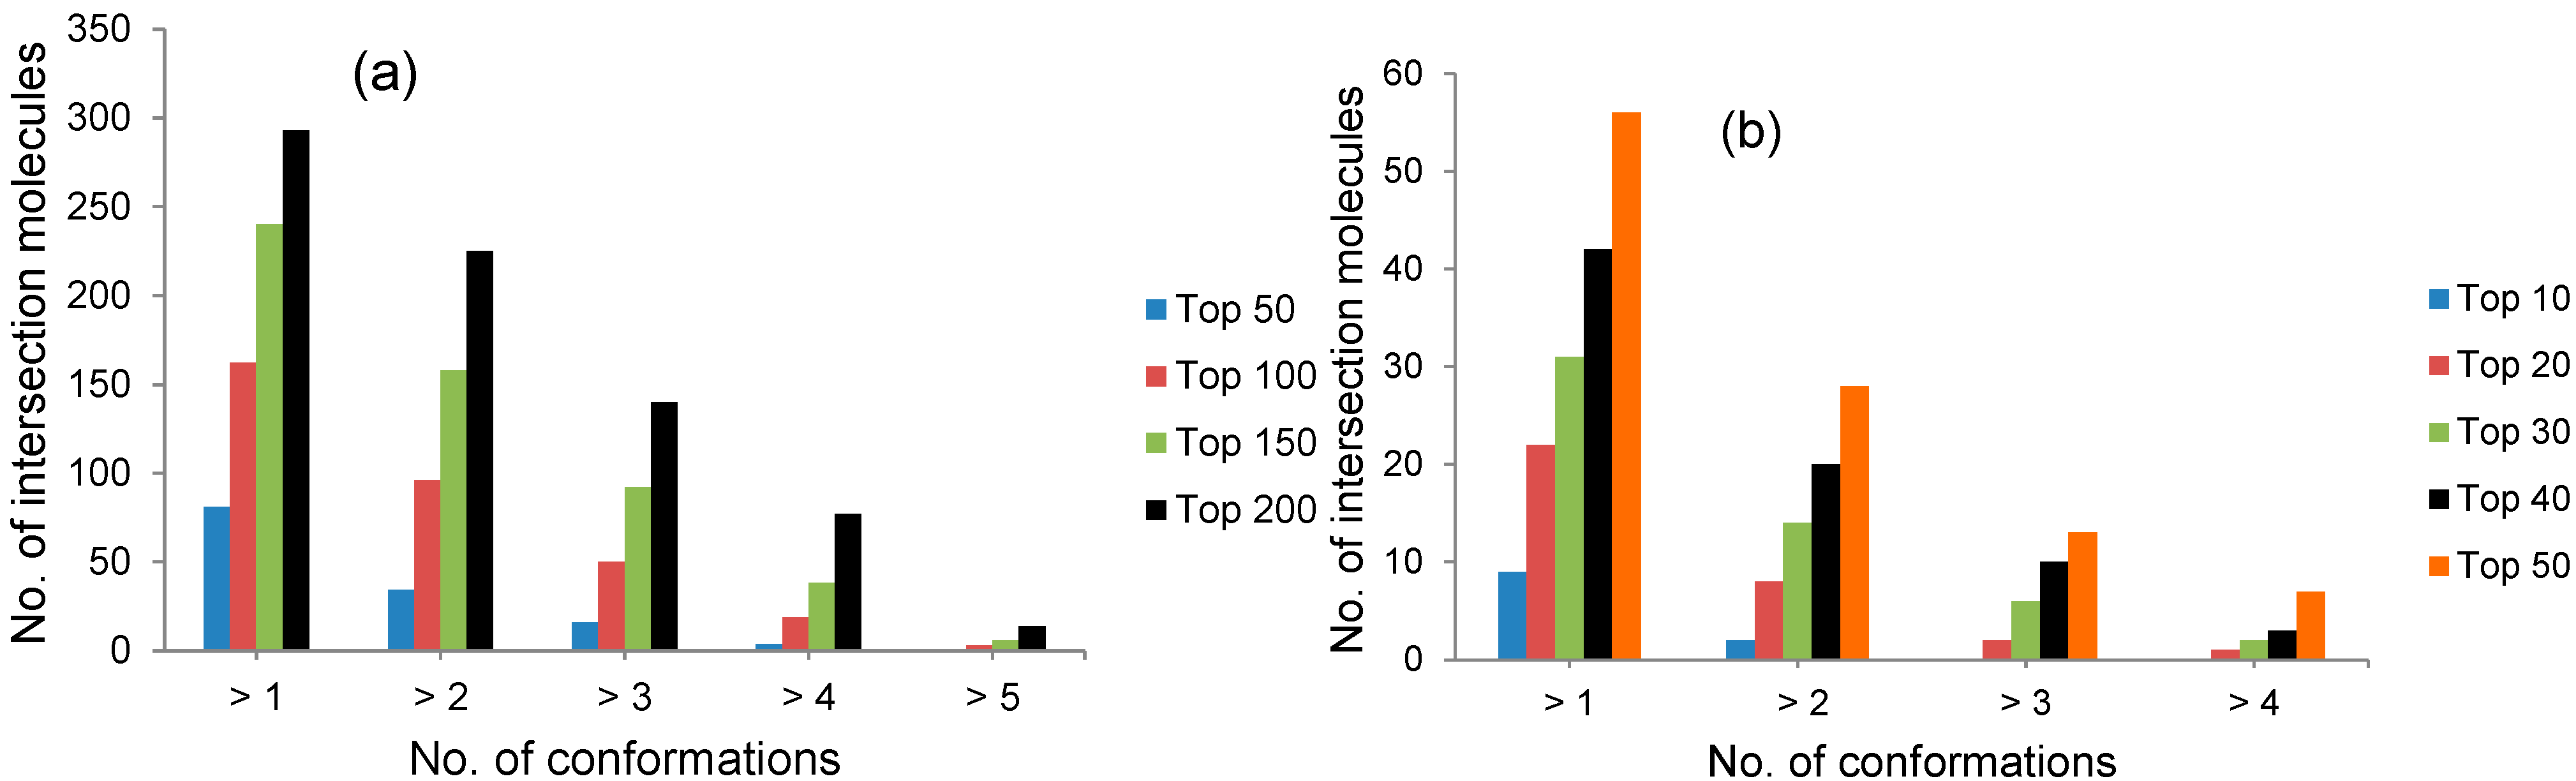
2.1. Selection by Docking to Multiple Receptor Conformations Narrows down Ligand Candidates


| Receptor Models for T-Loop Pocket | ||||||
| Molecule | Crystal Structure | Structure 1 | Structure 2 | Structure 3 | Structure 4 | Structure 5 |
| A | 74.17 | 92.21 | 75.70 | 78.95 | 78.85 | 66.77 |
| B | 65.98 | 70.28 | 82.14 | 78.00 | 74.54 | 66.03 |
| HAC | 63.24 | 76.84 | 64.20 | 77.06 | 78.08 | 64.59 |
| Receptor Models for RNA Binding Site | ||||||
| Molecule | Crystal Structure | Structure 1 | Structure 2 | Structure 3 | Structure 4 | |
| HAC1 | 70.08 | 67.94 | 64.90 | 69.46 | 64.19 | |
| HAC2 | 64.63 | 64.70 | 64.08 | 65.64 | 65.77 | |
| 1 | 61.03 | 71.01 | 62.15 | 70.76 | 64.17 | |
| HAC3 | 61.29 | 64.20 | 60.16 | 68.18 | 69.77 | |
| 2 | 59.38 | 60.57 | 60.64 | 61.42 | 65.58 | |
| 3 | 61.05 | 65.48 | 52.67 | 63.88 | 57.56 | |
| 4 | 60.00 | 59.41 | 56.82 | 60.59 | 64.08 | |
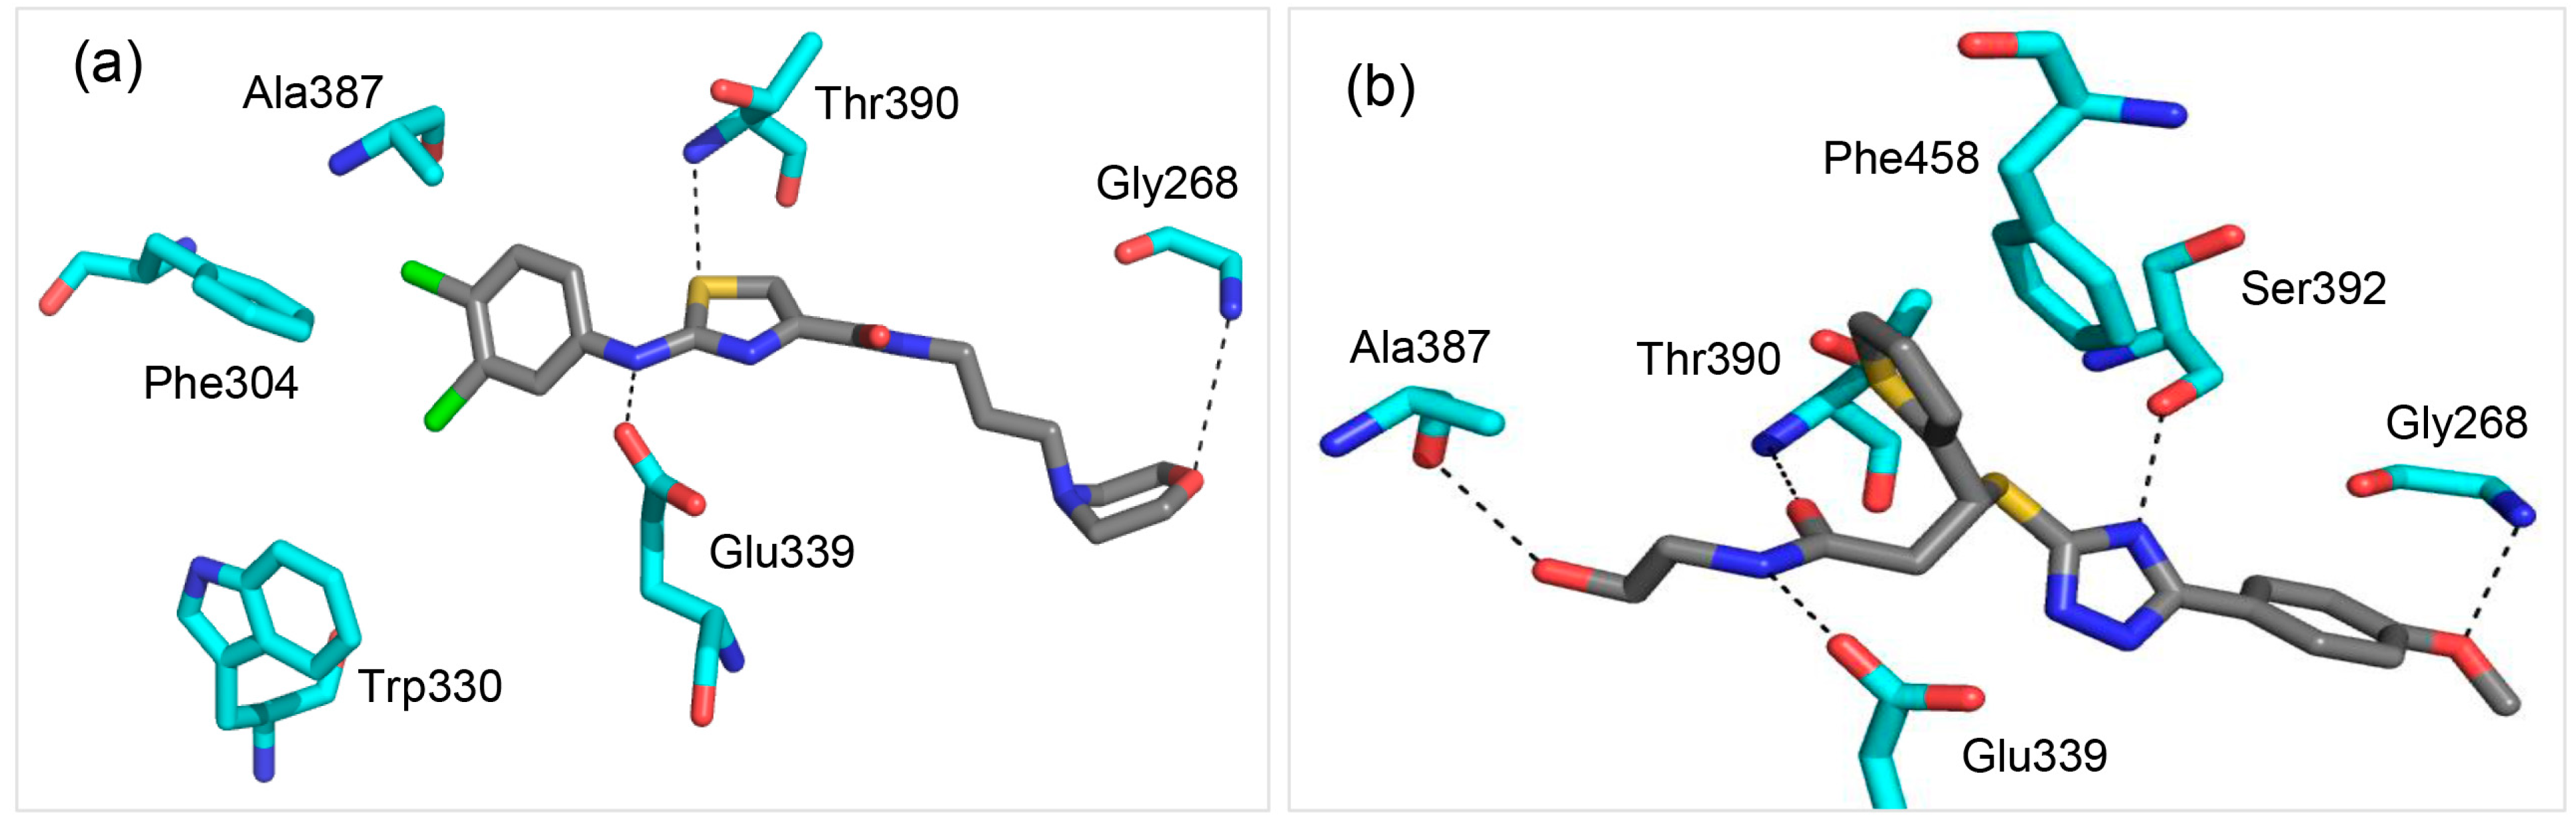
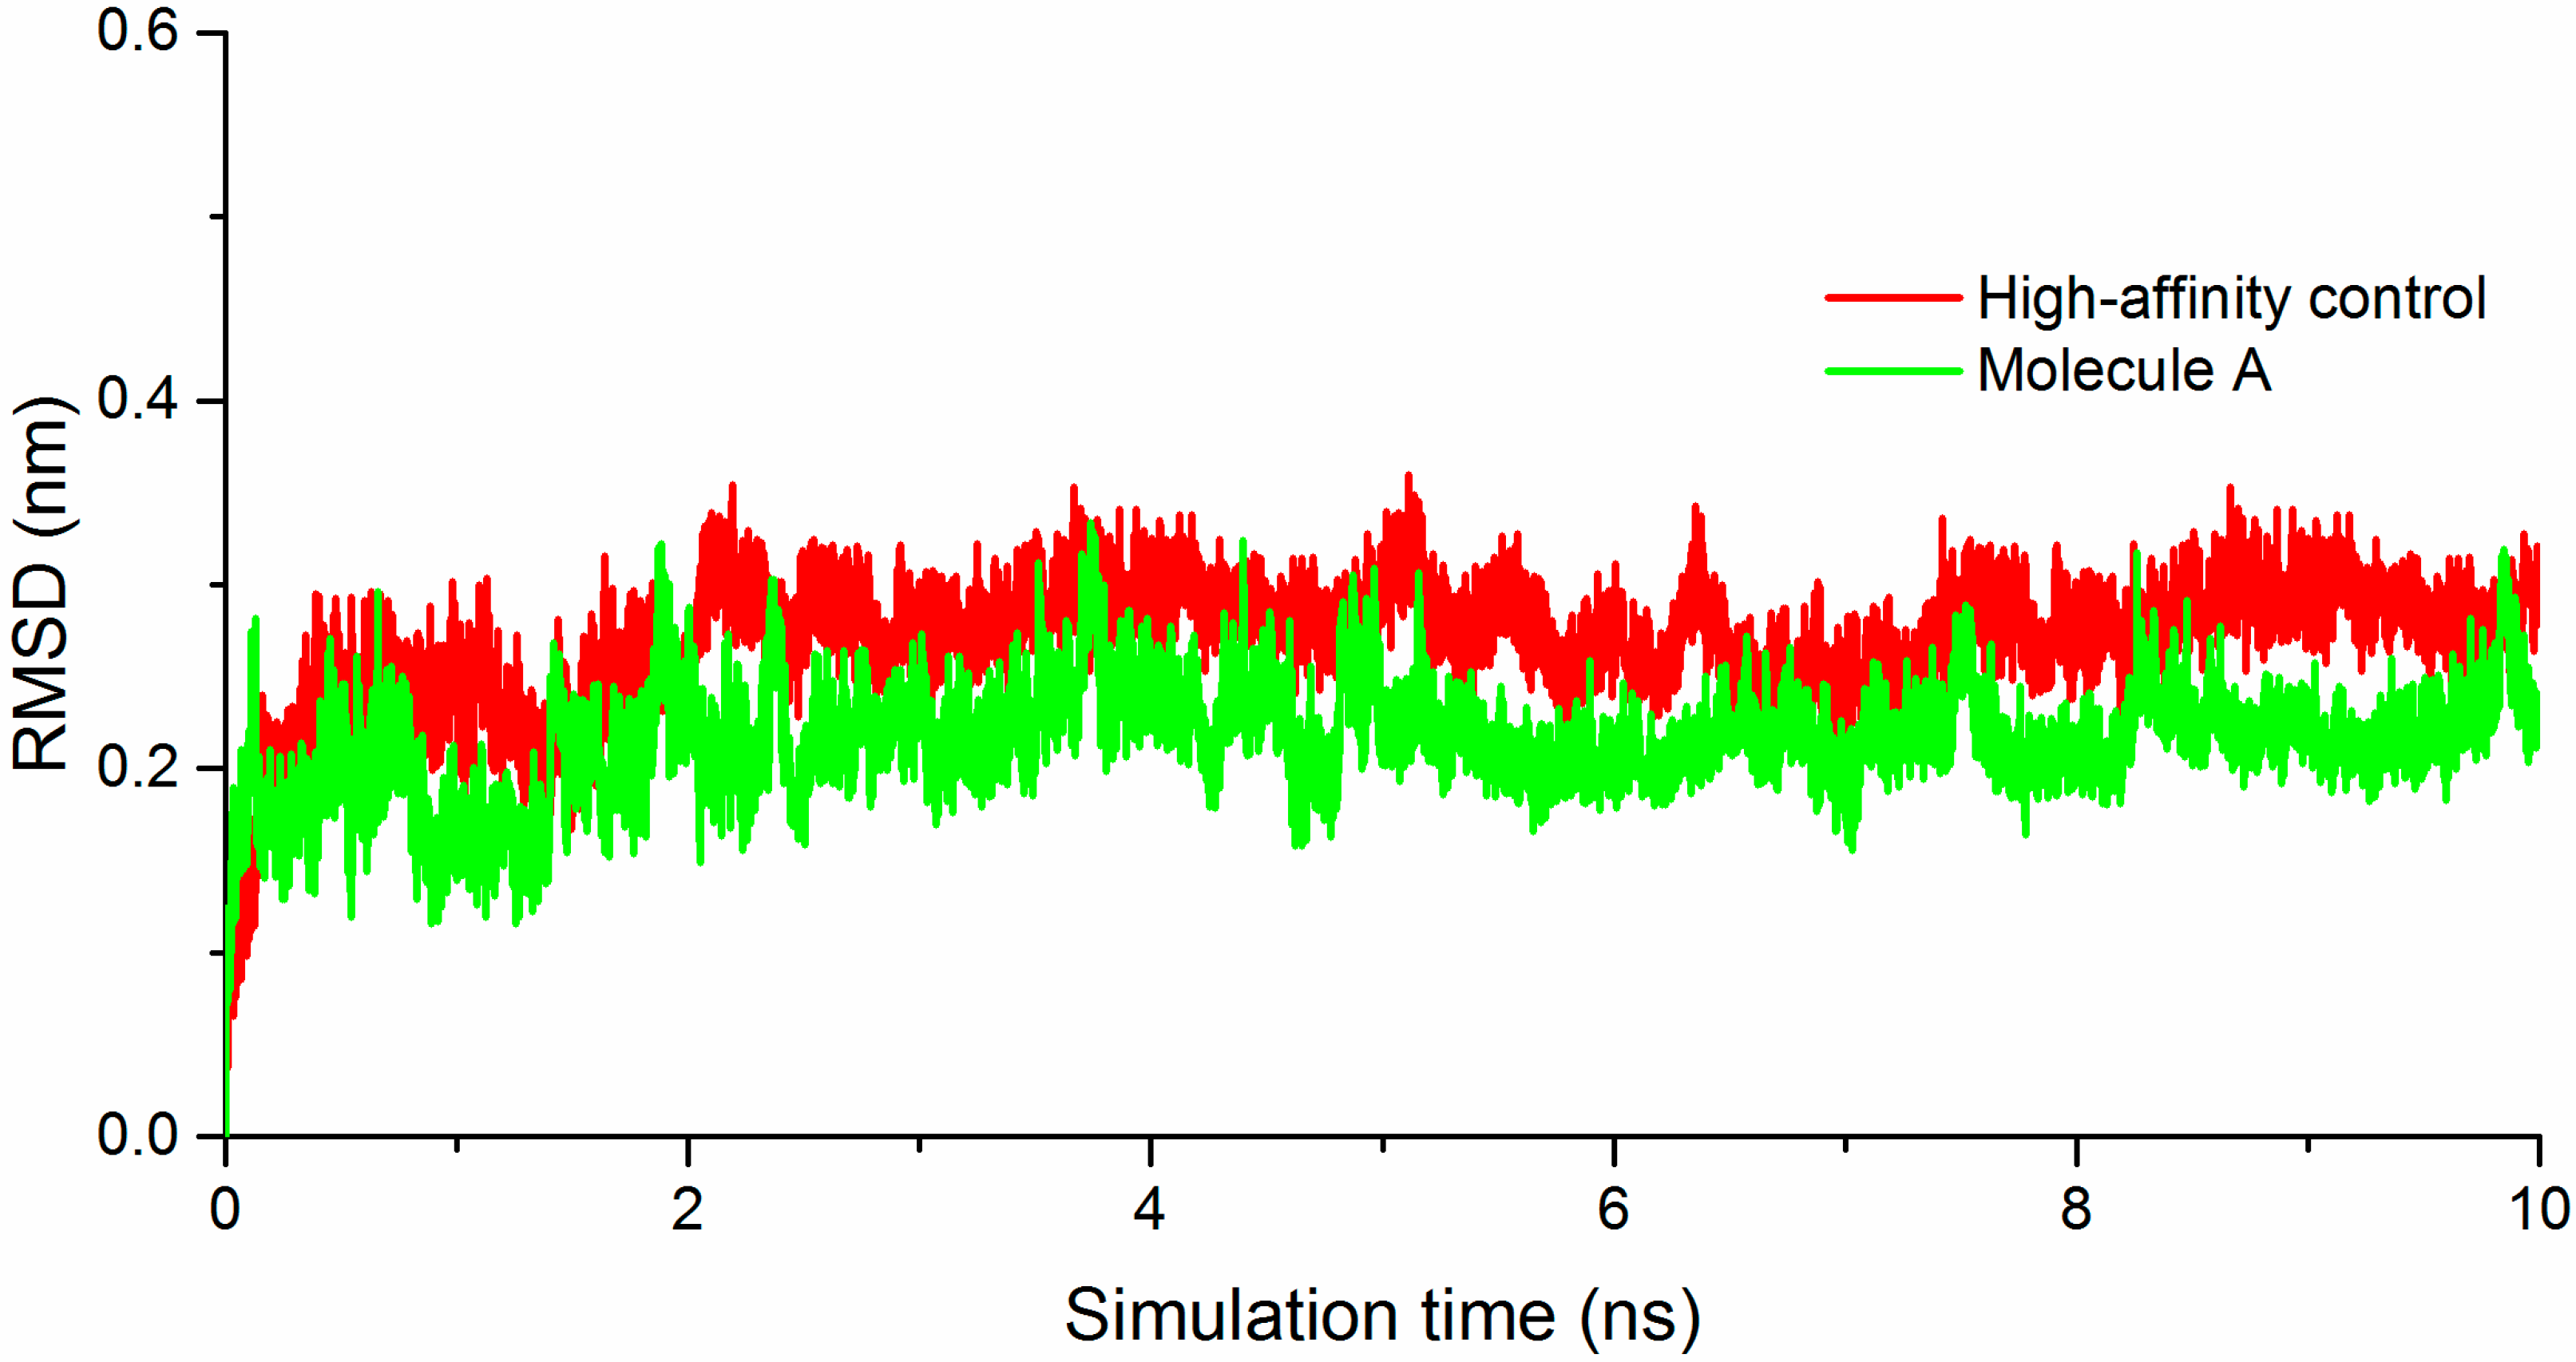
2.2. Molecule A Compared to the High-Affinity Control (HAC)


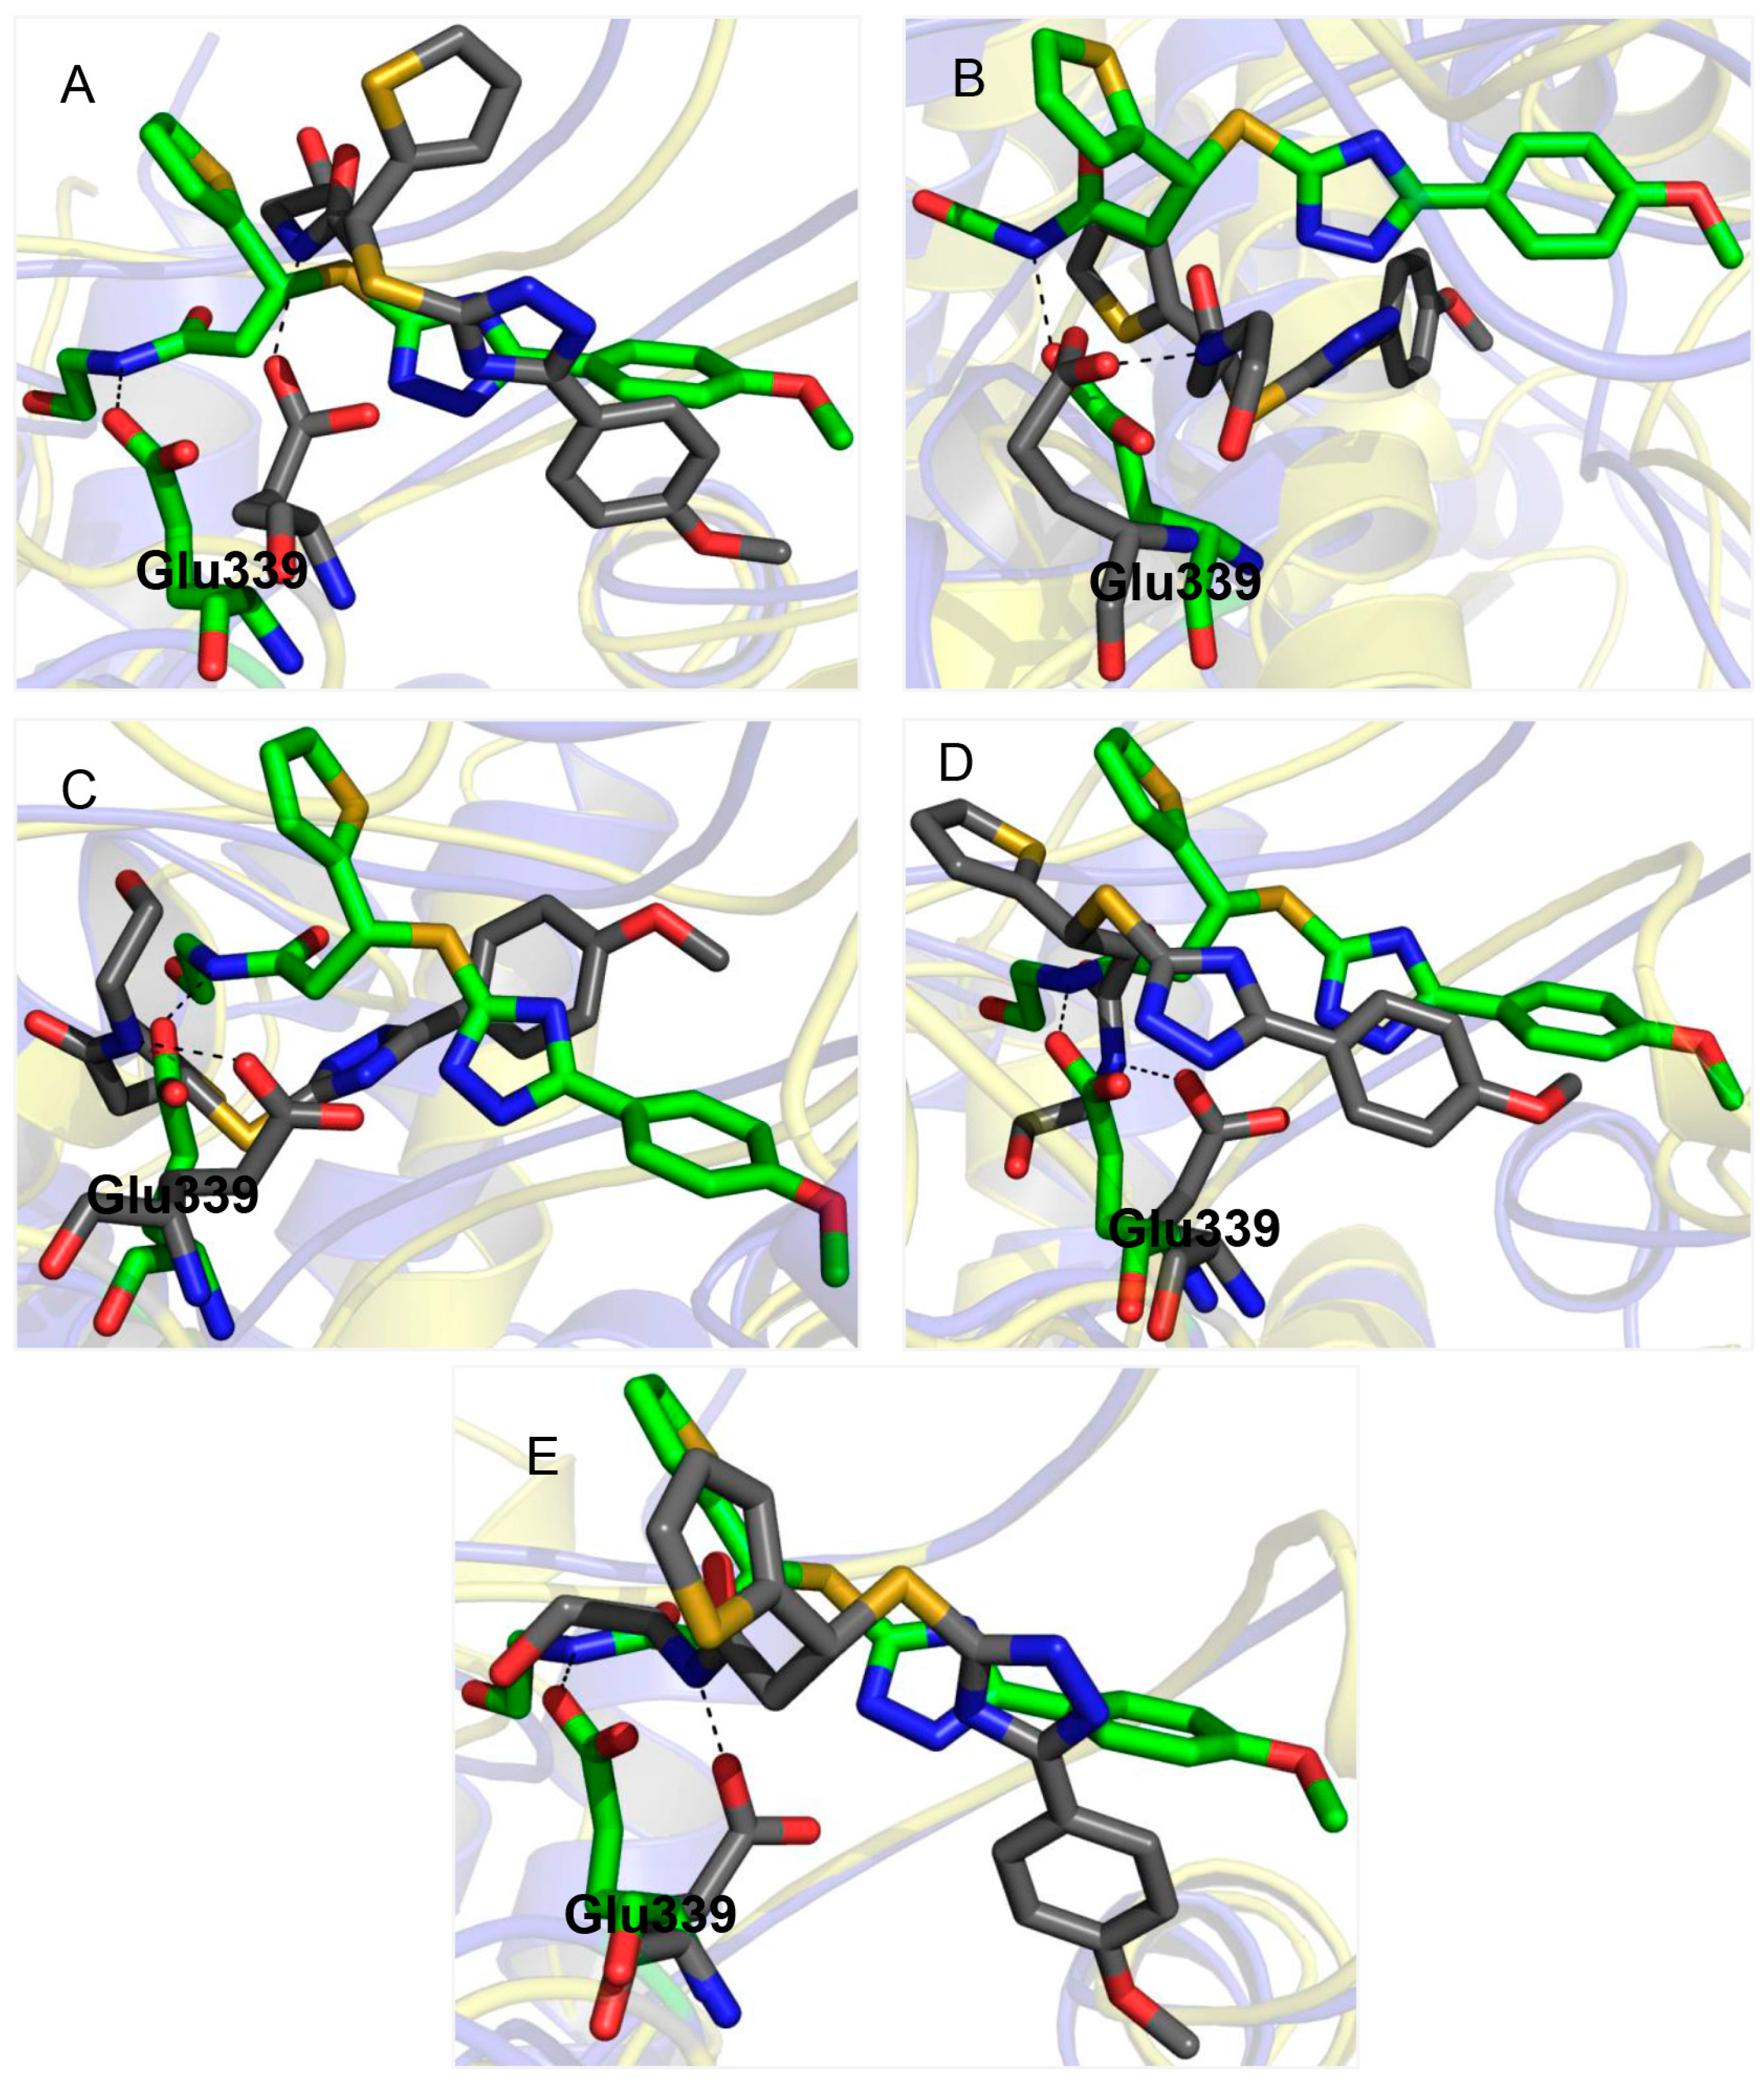
2.3. Glu339: A Hotspot for Molecule A

3. Experimental Section
3.1. Structure Preparation
3.2. Molecular Dynamics Simulations
3.3. Clustering for Distinctive Structures
3.4. Docking and in Silico Screening
3.5. Ligand Selection Criteria
3.6. Protein-Ligand Complex Simulations
4. Conclusions
Supplementary Materials
Acknowledgments
Author Contributions
Conflicts of Interest
References
- Carlson, H.A.; McCammon, J.A. Accommodating protein flexibility in computational drug design. Mol. Pharmacol. 2000, 57, 213–218. [Google Scholar] [PubMed]
- Huang, S.Y.; Zou, X.Q. Ensemble docking of multiple protein structures: Considering protein structural variations in molecular docking. Proteins Struct. Funct. Bioinf. 2007, 66, 399–421. [Google Scholar] [CrossRef]
- Barril, X.; Morley, S.D. Unveiling the full potential of flexible receptor docking using multiple crystallographic structures. J. Med. Chem. 2005, 48, 4432–4443. [Google Scholar] [CrossRef] [PubMed]
- Rastelli, G. Emerging topics in structure-based virtual screening. Pharm. Res. 2013, 30, 1458–1463. [Google Scholar] [CrossRef] [PubMed]
- Carlson, H.A.; Masukawa, K.M.; Rubins, K.; Bushman, F.D.; Jorgensen, W.L.; Lins, R.D.; Briggs, J.M.; McCammon, J.A. Developing a dynamic pharmacophore model for hiv-1 integrase. J. Med. Chem. 2000, 43, 2100–2114. [Google Scholar] [CrossRef] [PubMed]
- Pang, Y.P.; Kozikowski, A.P. Prediction of the binding-sites of huperzine-a in acetylcholinesterase by docking studies. J. Comput. Aided Mol. Des. 1994, 8, 669–681. [Google Scholar] [CrossRef] [PubMed]
- Broughton, H.B. A method for including protein flexibility in protein-ligand docking: Improving tools for database mining and virtual screening. J. Mol. Graph. Model. 2000, 18, 247–304. [Google Scholar] [CrossRef] [PubMed]
- Philippopoulos, M.; Lim, C. Exploring the dynamic information content of a protein NMR structure: Comparison of a molecular dynamics simulation with the nmr and X-ray structures of Escherichia coli ribonuclease HI. Proteins Struct. Funct. Bioinf. 1999, 36, 87–110. [Google Scholar] [CrossRef]
- Totrov, M.; Abagyan, R. Flexible ligand docking to multiple receptor conformations: A practical alternative. Curr. Opin. Struct. Biol. 2008, 18, 178–184. [Google Scholar] [CrossRef] [PubMed]
- Sink, R.; Gobec, S.; Pecar, S.; Zega, A. False positives in the early stages of drug discovery. Curr. Med. Chem. 2010, 17, 4231–4255. [Google Scholar] [CrossRef] [PubMed]
- Mobley, D.L.; Dill, K.A. Binding of small-molecule ligands to proteins: “What you see” is not always “what you get”. Structure 2009, 17, 489–498. [Google Scholar] [CrossRef] [PubMed]
- Ye, Q.; Krug, R.M.; Tao, Y.J. The mechanism by which influenza a virus nucleoprotein forms oligomers and binds rna. Nature 2006, 444, 1078–1082. [Google Scholar] [CrossRef] [PubMed]
- Shen, Y.-F.; Chen, Y.-H.; Chu, S.-Y.; Lin, M.-I.; Hsu, H.-T.; Wu, P.-Y.; Wu, C.-J.; Liu, H.-W.; Lin, F.-Y.; Lin, G.; et al. E339...R416 salt bridge of nucleoprotein as a feasible target for influenza virus inhibitors. Proc. Natl. Acad. Sci. USA 2011, 108, 16515–16520. [Google Scholar] [CrossRef] [PubMed]
- Fedichev, P.; Timakhov, R.; Pyrkov, T.; Getmantsev, E.; Vinnik, A. Structure-based drug design of a new chemical class of small molecules active against influenza a nucleoprotein in vitro and in vivo. PLoS Curr. 2011, 3, RRN1253. [Google Scholar] [CrossRef] [PubMed]
- Kao, R.Y.; Yang, D.; Lau, L.S.; Tsui, W.H.W.; Hu, L.H.; Dai, J.; Chan, M.P.; Chan, C.M.; Wang, P.; Zheng, B.J.; et al. Identification of influenza a nucleoprotein as an antiviral target. Nat. Biotechnol. 2010, 28, 600–605. [Google Scholar] [CrossRef] [PubMed]
- Gold User Manual. Available online: http://www.ccdc.cam.ac.uk/Lists/DocumentationList (accessed on 15 December 2014).
- Jones, G.; Willet, P.; Glen, R.C.; Leach, A.R.; Taylor, R. Development and validation of a genetic algorithm for flexible docking. J. Mol. Biol. 1997, 267, 727–748. [Google Scholar] [CrossRef] [PubMed]
- Arnold, K.; Bordoli, L.; Kopp, J.; Schwede, T. The swiss-model workspace: A web-based environment for protein structure homology modelling. Bioinformatics 2006, 22, 195–201. [Google Scholar] [CrossRef] [PubMed]
- Hess, B.; Kutzner, C.; van der Spoel, D.; Lindahl, E. Gromacs 4: Algorithms for highly efficient, load-balanced, and scalable molecular simulation. J. Chem. Theory Comput. 2008, 4, 435–447. [Google Scholar] [CrossRef]
- Cornell, W.D.; Cieplak, P.; Bayly, C.I.; Gould, I.R.; Merz, K.M., Jr.; Ferguson, D.M.; Spellmeyer, D.C.; Fox, T.; Caldwell, J.W.; Kollman, P.A. A second generation force field for the simulation of proteins, nucleic acids, and organic molecules. J. Am. Chem. Soc. 1995, 117, 5179–5197. [Google Scholar] [CrossRef]
- Jorgensen, W.L.; Chandrasekhar, J.; Madura, J.D.; Impey, R.W.; Klein, M.L. Comparison of simple potential functions for simulating liquid water. J. Chem. Phys. 1983, 79, 926. [Google Scholar] [CrossRef]
- Accelrys Discovery Studio, version 3.5; Accelrys Software Inc.: San Diego, CA, USA, 2012.
- Wang, J.; Wang, W.; Kollman, P.A.; Case, D.A. Automatic atom type and bond type perception in molecular mechanical calculations. J. Mol. Graph. Model. 2006, 25, 247–260. [Google Scholar] [CrossRef] [PubMed]
- Case, D.A.; Cheatham, T.E.; Darden, T.; Gohlke, H.; Luo, R.; Merz, K.M.; Onufriev, A.; Simmerling, C.; Wang, B.; Woods, R.J. The amber biomolecular simulation programs. J. Comput. Chem. 2005, 26, 1668–1688. [Google Scholar] [CrossRef] [PubMed]
- Frisch, M.J.; Trucks, G.W.; Schlegel, H.B.; Scuseria, G.E.; Robb, M.A.; Cheeseman, J.R.; Scalmani, G.; Barone, V.; Mennucci, B.; Petersson, G.A.; et al. Gaussian 09; Gaussian, Inc.: Wallingford, CT, USA, 2009. [Google Scholar]
- Dupradeau, F.-Y.; Pigache, A.; Zaffran, T.; Savineau, C.; Lelong, R.; Grivel, N.; Lelong, D.; Rosanski, W.; Cieplak, P. The R.E.D. Tools: Advances in resp and esp charge derivation and force field library building. Phys. Chem. Chem. Phys. 2010, 12, 7821–7839. [Google Scholar] [CrossRef] [PubMed]
- Furuse, Y.; Suzuki, A.; Oshitani, H. Large-scale sequence analysis of m gene of influenza a viruses from different species: Mechanisms for emergence and spread of amantadine resistance. Antimicrob. Agents Chemother. 2009, 53, 4457–4463. [Google Scholar] [CrossRef] [PubMed]
- Sample Availability: Not available.
© 2015 by the authors. Licensee MDPI, Basel, Switzerland. This article is an open access article distributed under the terms and conditions of the Creative Commons Attribution license ( http://creativecommons.org/licenses/by/4.0/).
Share and Cite
Awuni, Y.; Mu, Y. Reduction of False Positives in Structure-Based Virtual Screening When Receptor Plasticity Is Considered. Molecules 2015, 20, 5152-5164. https://doi.org/10.3390/molecules20035152
Awuni Y, Mu Y. Reduction of False Positives in Structure-Based Virtual Screening When Receptor Plasticity Is Considered. Molecules. 2015; 20(3):5152-5164. https://doi.org/10.3390/molecules20035152
Chicago/Turabian StyleAwuni, Yaw, and Yuguang Mu. 2015. "Reduction of False Positives in Structure-Based Virtual Screening When Receptor Plasticity Is Considered" Molecules 20, no. 3: 5152-5164. https://doi.org/10.3390/molecules20035152