2.1. Classification of Sparkling Wine Style by MIR Spectroscopy
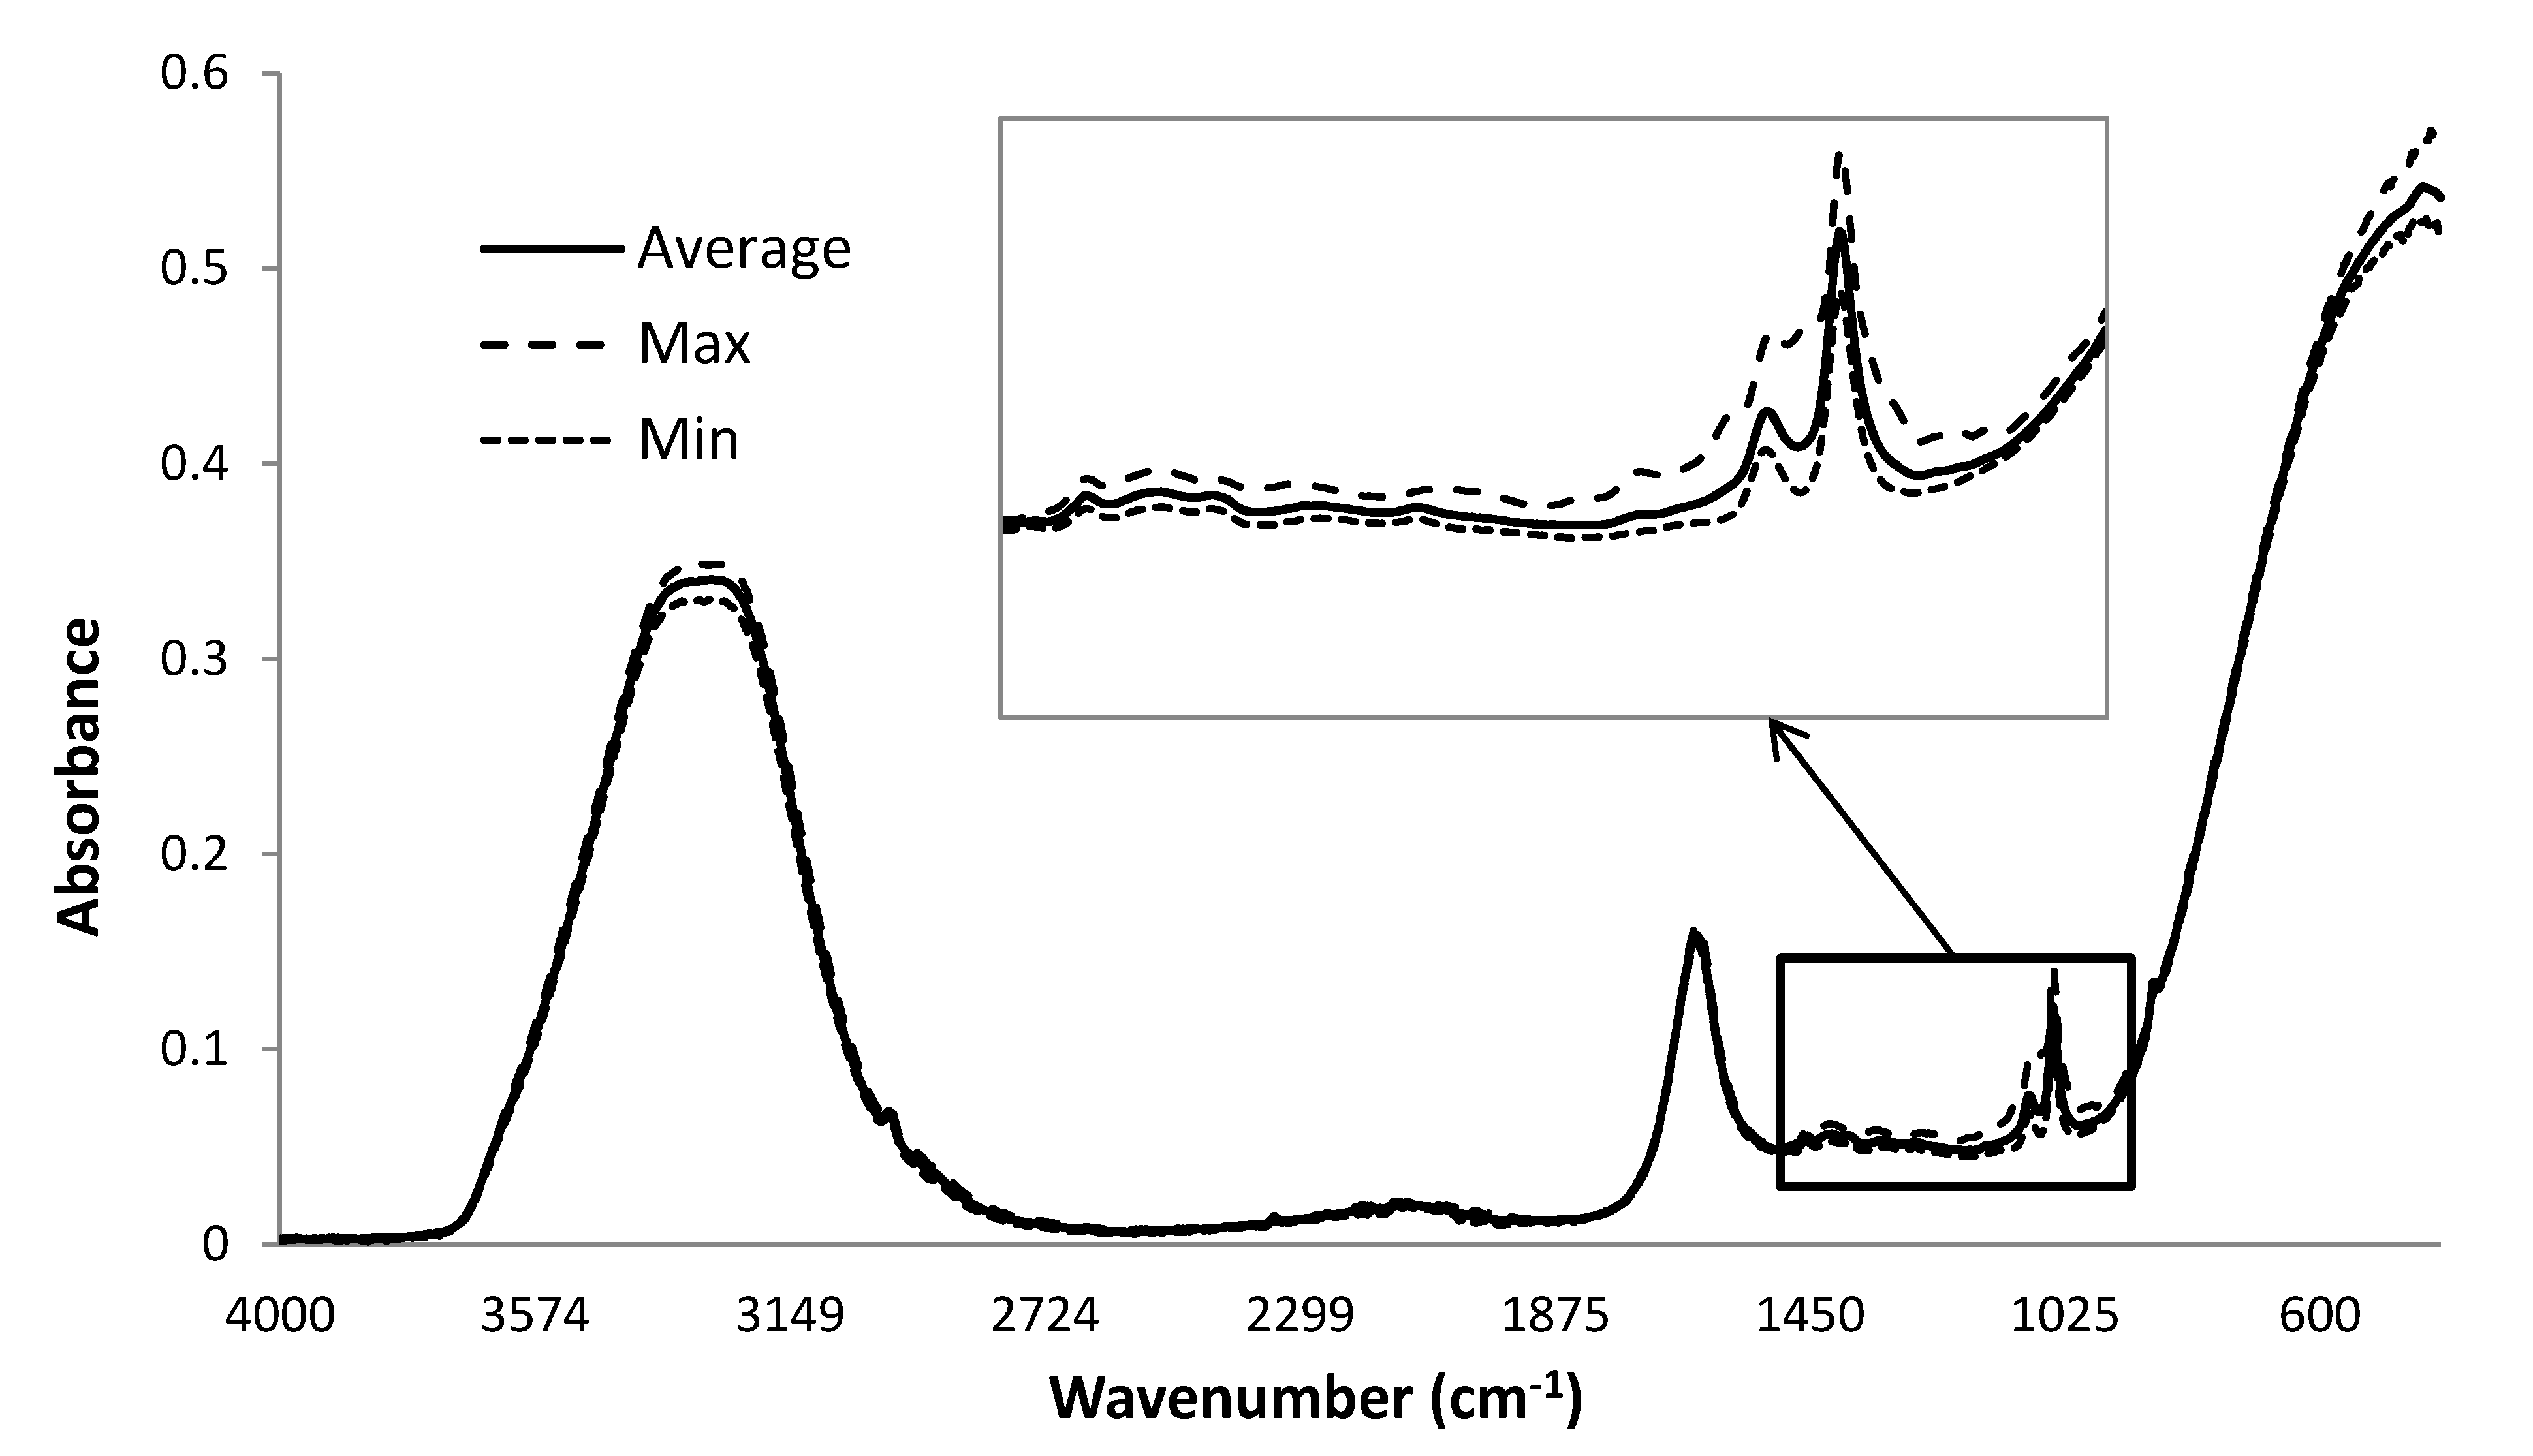
The ATR-MIR spectra of commercial sparkling wines showed moderate to strong absorbance peaks at 1045, 1085, 1640 and 3300 cm
−1 (
Figure 1); with peaks at 3300 and 1640 cm
−1 corresponding to the O–H stretching and bending respectively, associated with water [
16,
17]. The MIR region between 1100 and 1000 cm
−1 has previously been attributed to C–O vibrations of sugars, such as glucose and fructose, and alcohols, phenols, esters and lactones [
3]. In particular, absorbance in the region of 1080 to 1045 cm
−1 has been associated with C–OH bonds present in primary alcohols (e.g., ethanol), glycerol and sugars (glucose and fructose) [
4,
11,
13,
15];
i.e., compounds which are likely to be constituents of sparkling wine.
Figure 1.
Mean, maximum and minimum ATR-MIR spectra (4000–400 cm−1) obtained from (degassed) sparkling wine samples (n = 139).
Figure 1.
Mean, maximum and minimum ATR-MIR spectra (4000–400 cm−1) obtained from (degassed) sparkling wine samples (n = 139).
A comparison of the minimum and maximum ATR-MIR spectra (
Figure 1) obtained from the (degassed) sparkling wine samples indicated most of the variation observed amongst the samples occurred within the ‘fingerprint’ region;
i.e., between 1500 and 900 cm
−1. For grape and wine samples, this region is known to contain absorbance bands attributable to water, sugars and phenolic compounds [
8], and results from stretching and/or bending of CH–OH, C–C, C–O and C–H bonds. Multivariate analysis was therefore performed on the MIR ‘fingerprint’, given this region accounted for the most variation.
The PCA score plot of the first two principal components (PC) derived from the ATR-MIR ‘fingerprint’ spectra of all sparkling wine samples is shown in
Figure 2. The first principal component (PC) explains 89% of the variation observed and resulted in clear separation of Moscato wines (lower left quadrant) from the other sparkling wine styles. Separation of sparkling red (lower right quadrant) and sparkling white, rosé and Prosecco wines (upper quadrants) was also observed. Several outliers were observed,
i.e., individual wines that did not cluster with other wines of the same style, namely: three sparkling rosé wines and a sparkling red wine, that instead clustered amongst the Moscato wines; and two sparkling rosé wines that instead clustered together with the remaining sparkling red wines. A plausible explanation for these outliers is suggested below.
Figure 2.
Score plot of the first two PC’s derived from the MIR ‘fingerprint’ (1500–900 cm−1) of white, rosé, red, Prosecco and Moscato wines (n = 50, 25, 25, 14 and 25, respectively).
Figure 2.
Score plot of the first two PC’s derived from the MIR ‘fingerprint’ (1500–900 cm−1) of white, rosé, red, Prosecco and Moscato wines (n = 50, 25, 25, 14 and 25, respectively).
The clustering pattern of sparkling wines likely reflects compositional differences that can be attributed to both varietal expression and wine style. In terms of grape variety: sparkling red wines largely comprised Shiraz (or blends thereof); sparkling white wines comprised the classic varieties,
i.e., Chardonnay, Pinot Noir and/or Pinot Meunier; sparkling rosé wines were predominantly Pinot Noir (or blends thereof); and Moscato comprised Muscat varieties. Analysis of several basic wine chemistry parameters,
i.e., pH, titratable acidity (TA), residual sugar (RS), alcohol content and total phenolics (
Table 1), demonstrated several large compositional differences between the various sparkling wine styles; primarily related to residual sugar, alcohol and phenolic content. As expected, Moscato wines had the highest residual sugar levels (91 g/L on average, compared with 10 to 30 g/L for the other sparkling wines) and the lowest alcohol levels (
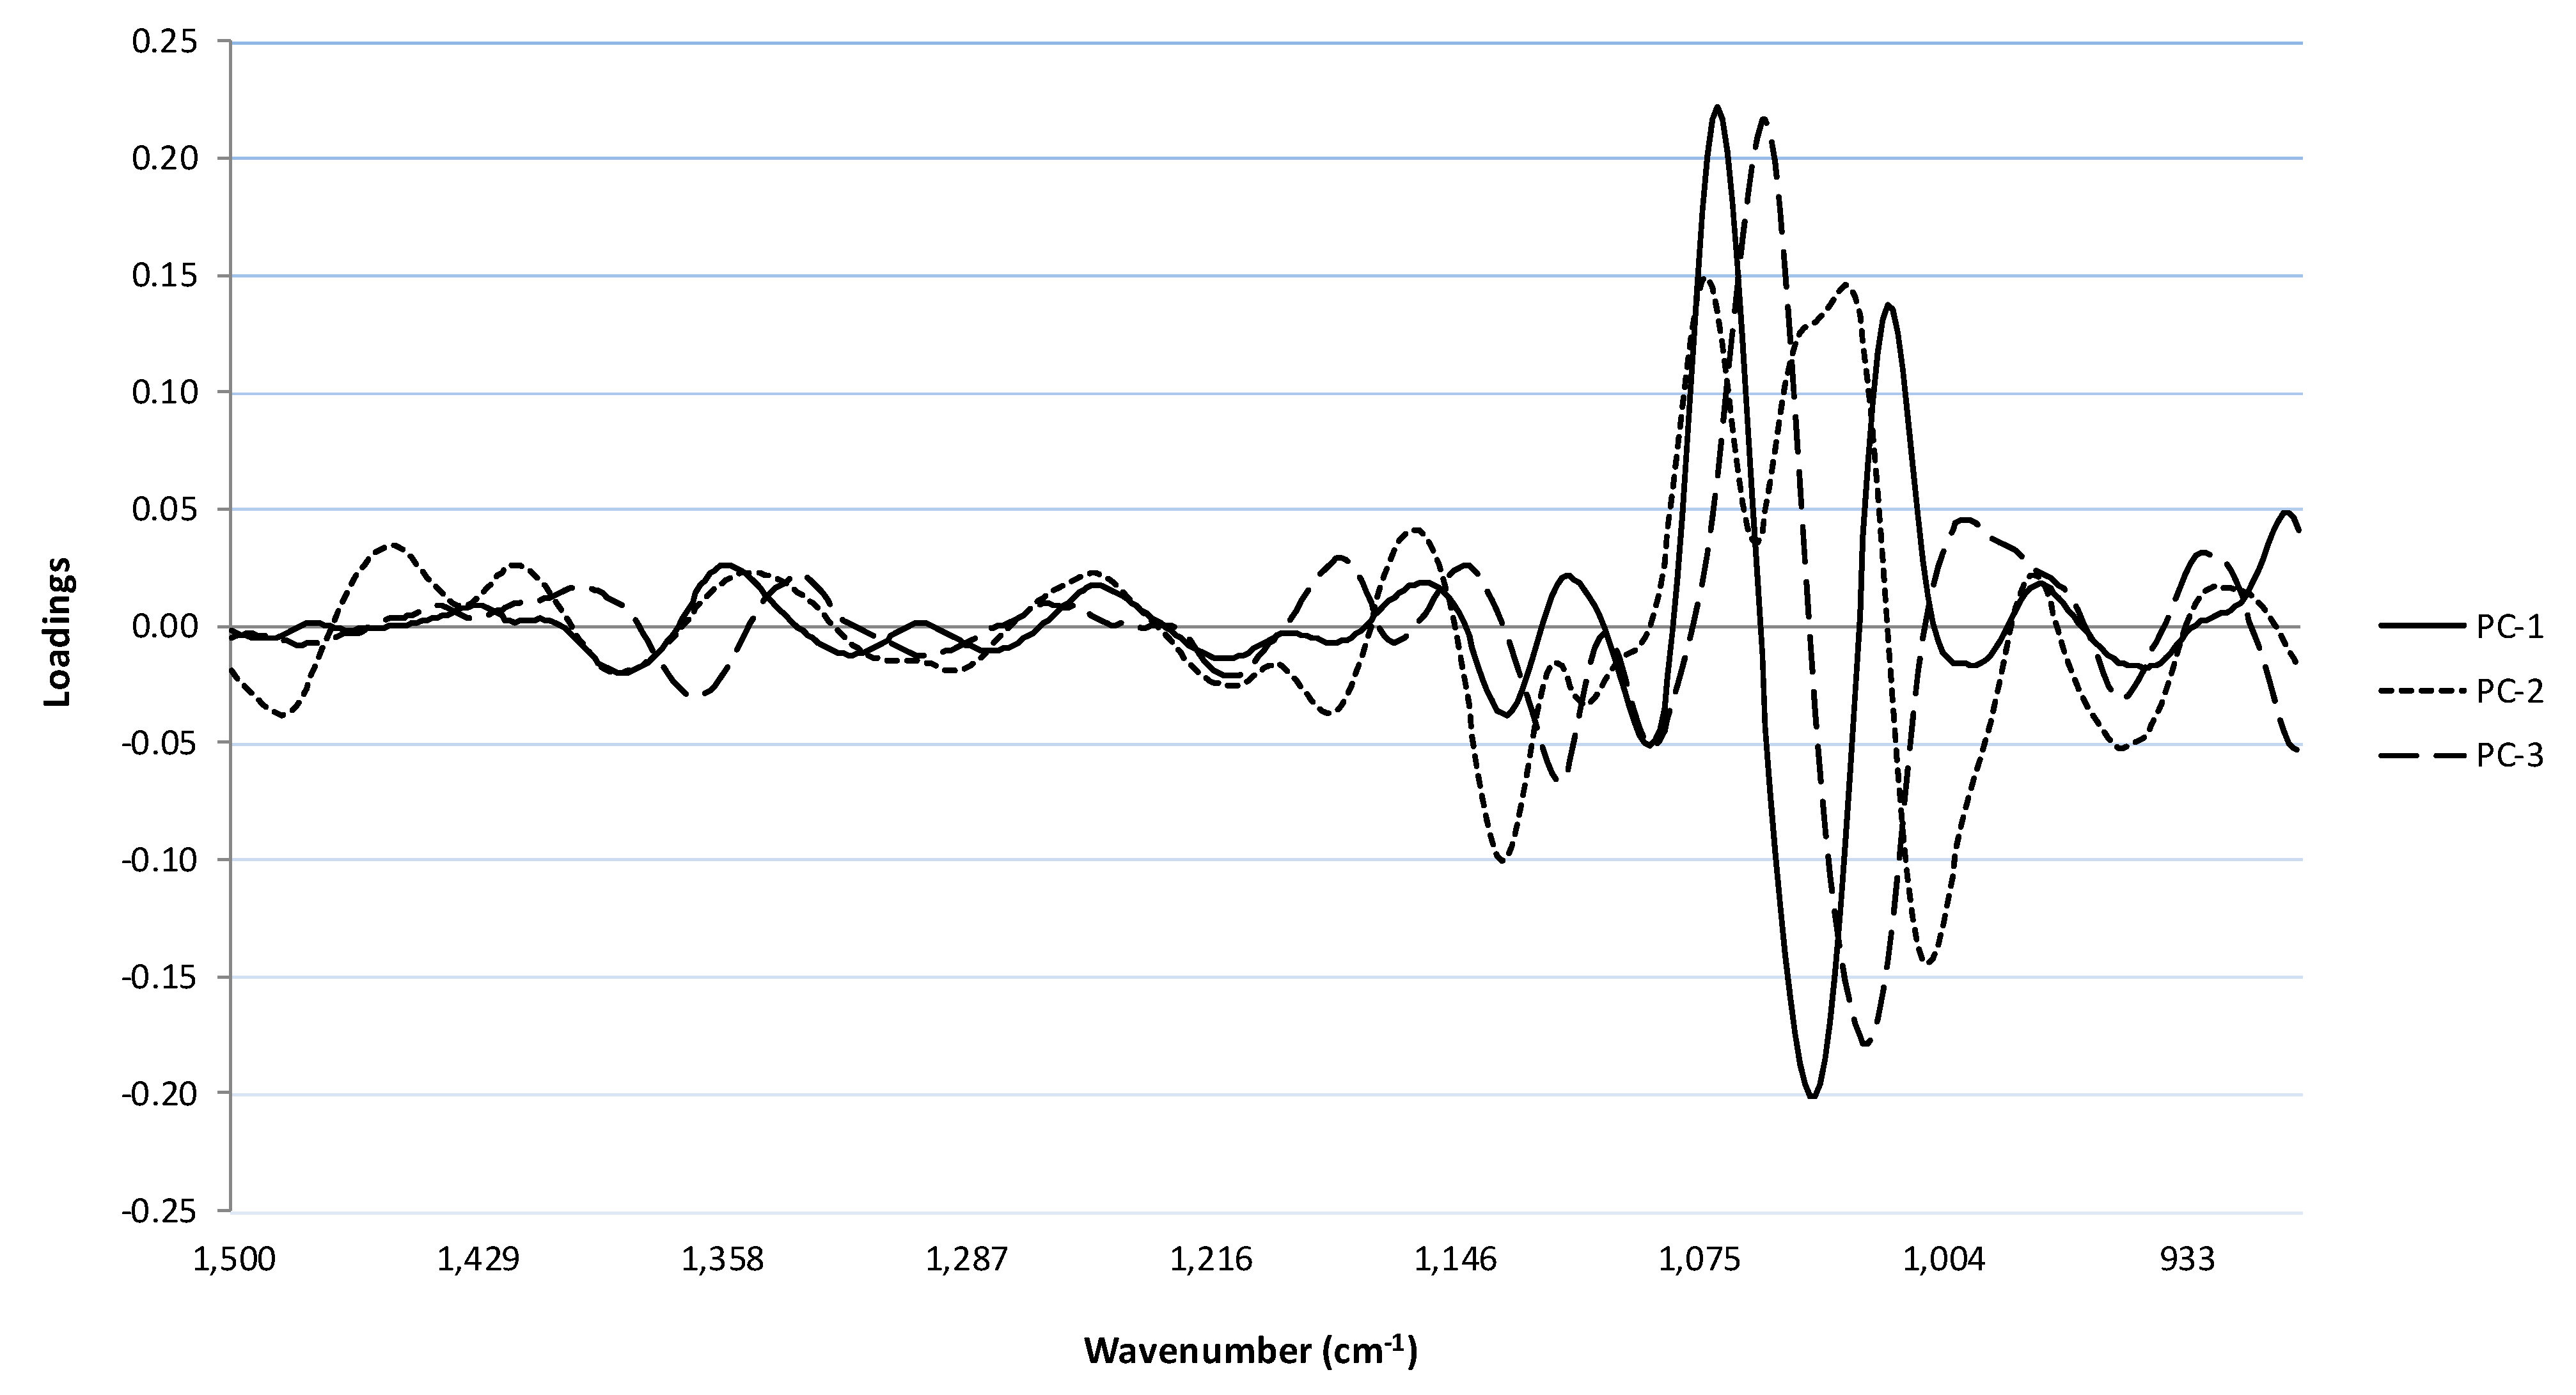
i.e., 7%, compared with 11% to 13%). Sparkling red wines typically had higher alcohol levels, and the highest total phenolics (due to the presence of grape skins during primary fermentation). To determine to what extent these constituents influenced wine clustering in the PCA score plot, the loadings for the first three PCs derived from the fingerprint region of sparkling wine MIR spectra were evaluated (
Figure 3).
Table 1.
Composition of the different styles of sparkling wine studied.
Table 1.
Composition of the different styles of sparkling wine studied.
| Sparkling Wine Style | pH | TA (g/L) | RS (g/L) | Alcohol (% abv) | Total Phenolics (au) |
|---|
| White (n = 50) | range mean | 3.0–3.5 3.2 | 5.8–9.6 7.5 | 0.5–20.1 11.2 | 10.3–13.1 11.9 | 0.3–5.8 2.9 |
| Rosé (n = 25) | range mean | 3.1–3.5 3.3 | 5.3–8.4 6.8 | 5.1–86.7 22.9 | 7.9–13.7 11.6 | 2.2–6.2 4.0 |
| Red (n = 25) | range mean | 3.4–3.9 3.5 | 5.1–7.5 6.3 | 7.2–117.6 32.7 | 8.4–15.0 13.4 | 37.1–67.0 49.9 |
| Prosecco (n = 14) | range mean | 2.9–3.5 3.2 | 5.6–7.8 6.4 | 0.4–22.4 10.6 | 9.2–12.2 11.0 | 0.0–3.3 0.9 |
| Moscato (n = 25) | range mean | 3.0–3.5 3.2 | 4.9–9.0 6.7 | 57.9–143.1 90.5 | 5.1–9.9 7.4 | 0.8–15.5 4.6 |
Figure 3.
Loadings for the first three principal components for the fingerprint region derived from the MIR spectra of the sparkling wines.
Figure 3.
Loadings for the first three principal components for the fingerprint region derived from the MIR spectra of the sparkling wines.
The highest loadings for PC-1 were observed at 1069, 1040 and 1020 cm
−1. As indicated above, absorbance in the region of 1080 to 1045 cm
−1 is usually associated with the C–C and C–OH bonds of primary alcohols (e.g., ethanol), glycerol and sugars [
4,
5,
11,
13,
14,
15]. This suggests the variation observed between samples in the first principal component is largely explained by differences in residual sugar and alcohol content. For PC-2, which explained 9% of variation, the highest loadings were also in this region (
i.e., at 1073 to 1008 cm
−1). Less significant, but larger loadings were also observed for PC-2 within the 1500 to 1400 cm
−1 region, which may be indicative of aromatic C–C stretching [
14] and/or absorbance by CO=O, C=C, C–H
2 and C–H
3 bonds from organic acids and aldehydes [
11,
13,
15]. PC-2 loadings were also observed at 1130 and 1150 cm
−1, with the latter possibly being characteristic of pyranose sugars [
16]. Therefore, in addition to sugar and alcohol, phenolics and organic acids may also have contributed to the clustering patterns of the different sparkling wines.
Consideration of the basic chemical parameters of individual sparkling wines also helped to explain the clustering of wines identified (above) as outliers. The three sparkling rosé wines and the sparkling red wine that clustered amongst the Moscato wines were found to contain high residual sugar levels; between 63 and 87 g/L, and 118 g/L, for the sparkling rosé and sparkling red wines, respectively. Of the two remaining sparkling rosé wines that were clustered amongst the sparkling red wines, one also had high residual sugar (i.e., 60 g/L), and both had unusually high alcohol levels (i.e., 13.4% and 13.7%). The residual sugar and/or alcohol content of these sparkling wines may therefore have more strongly influenced their clustering, than varietal expression. Collectively, these observations highlight the influence of sugar and alcohol on the positioning of individual sparkling wines on the PCA score plot.
2.2. Classification of Sparkling White Wine Style and Quality by MIR Spectroscopy
In 2012, the sparkling white wine segment held the lion share of Australian sparkling wine sales, both by value (54%) and by volume (61%) [
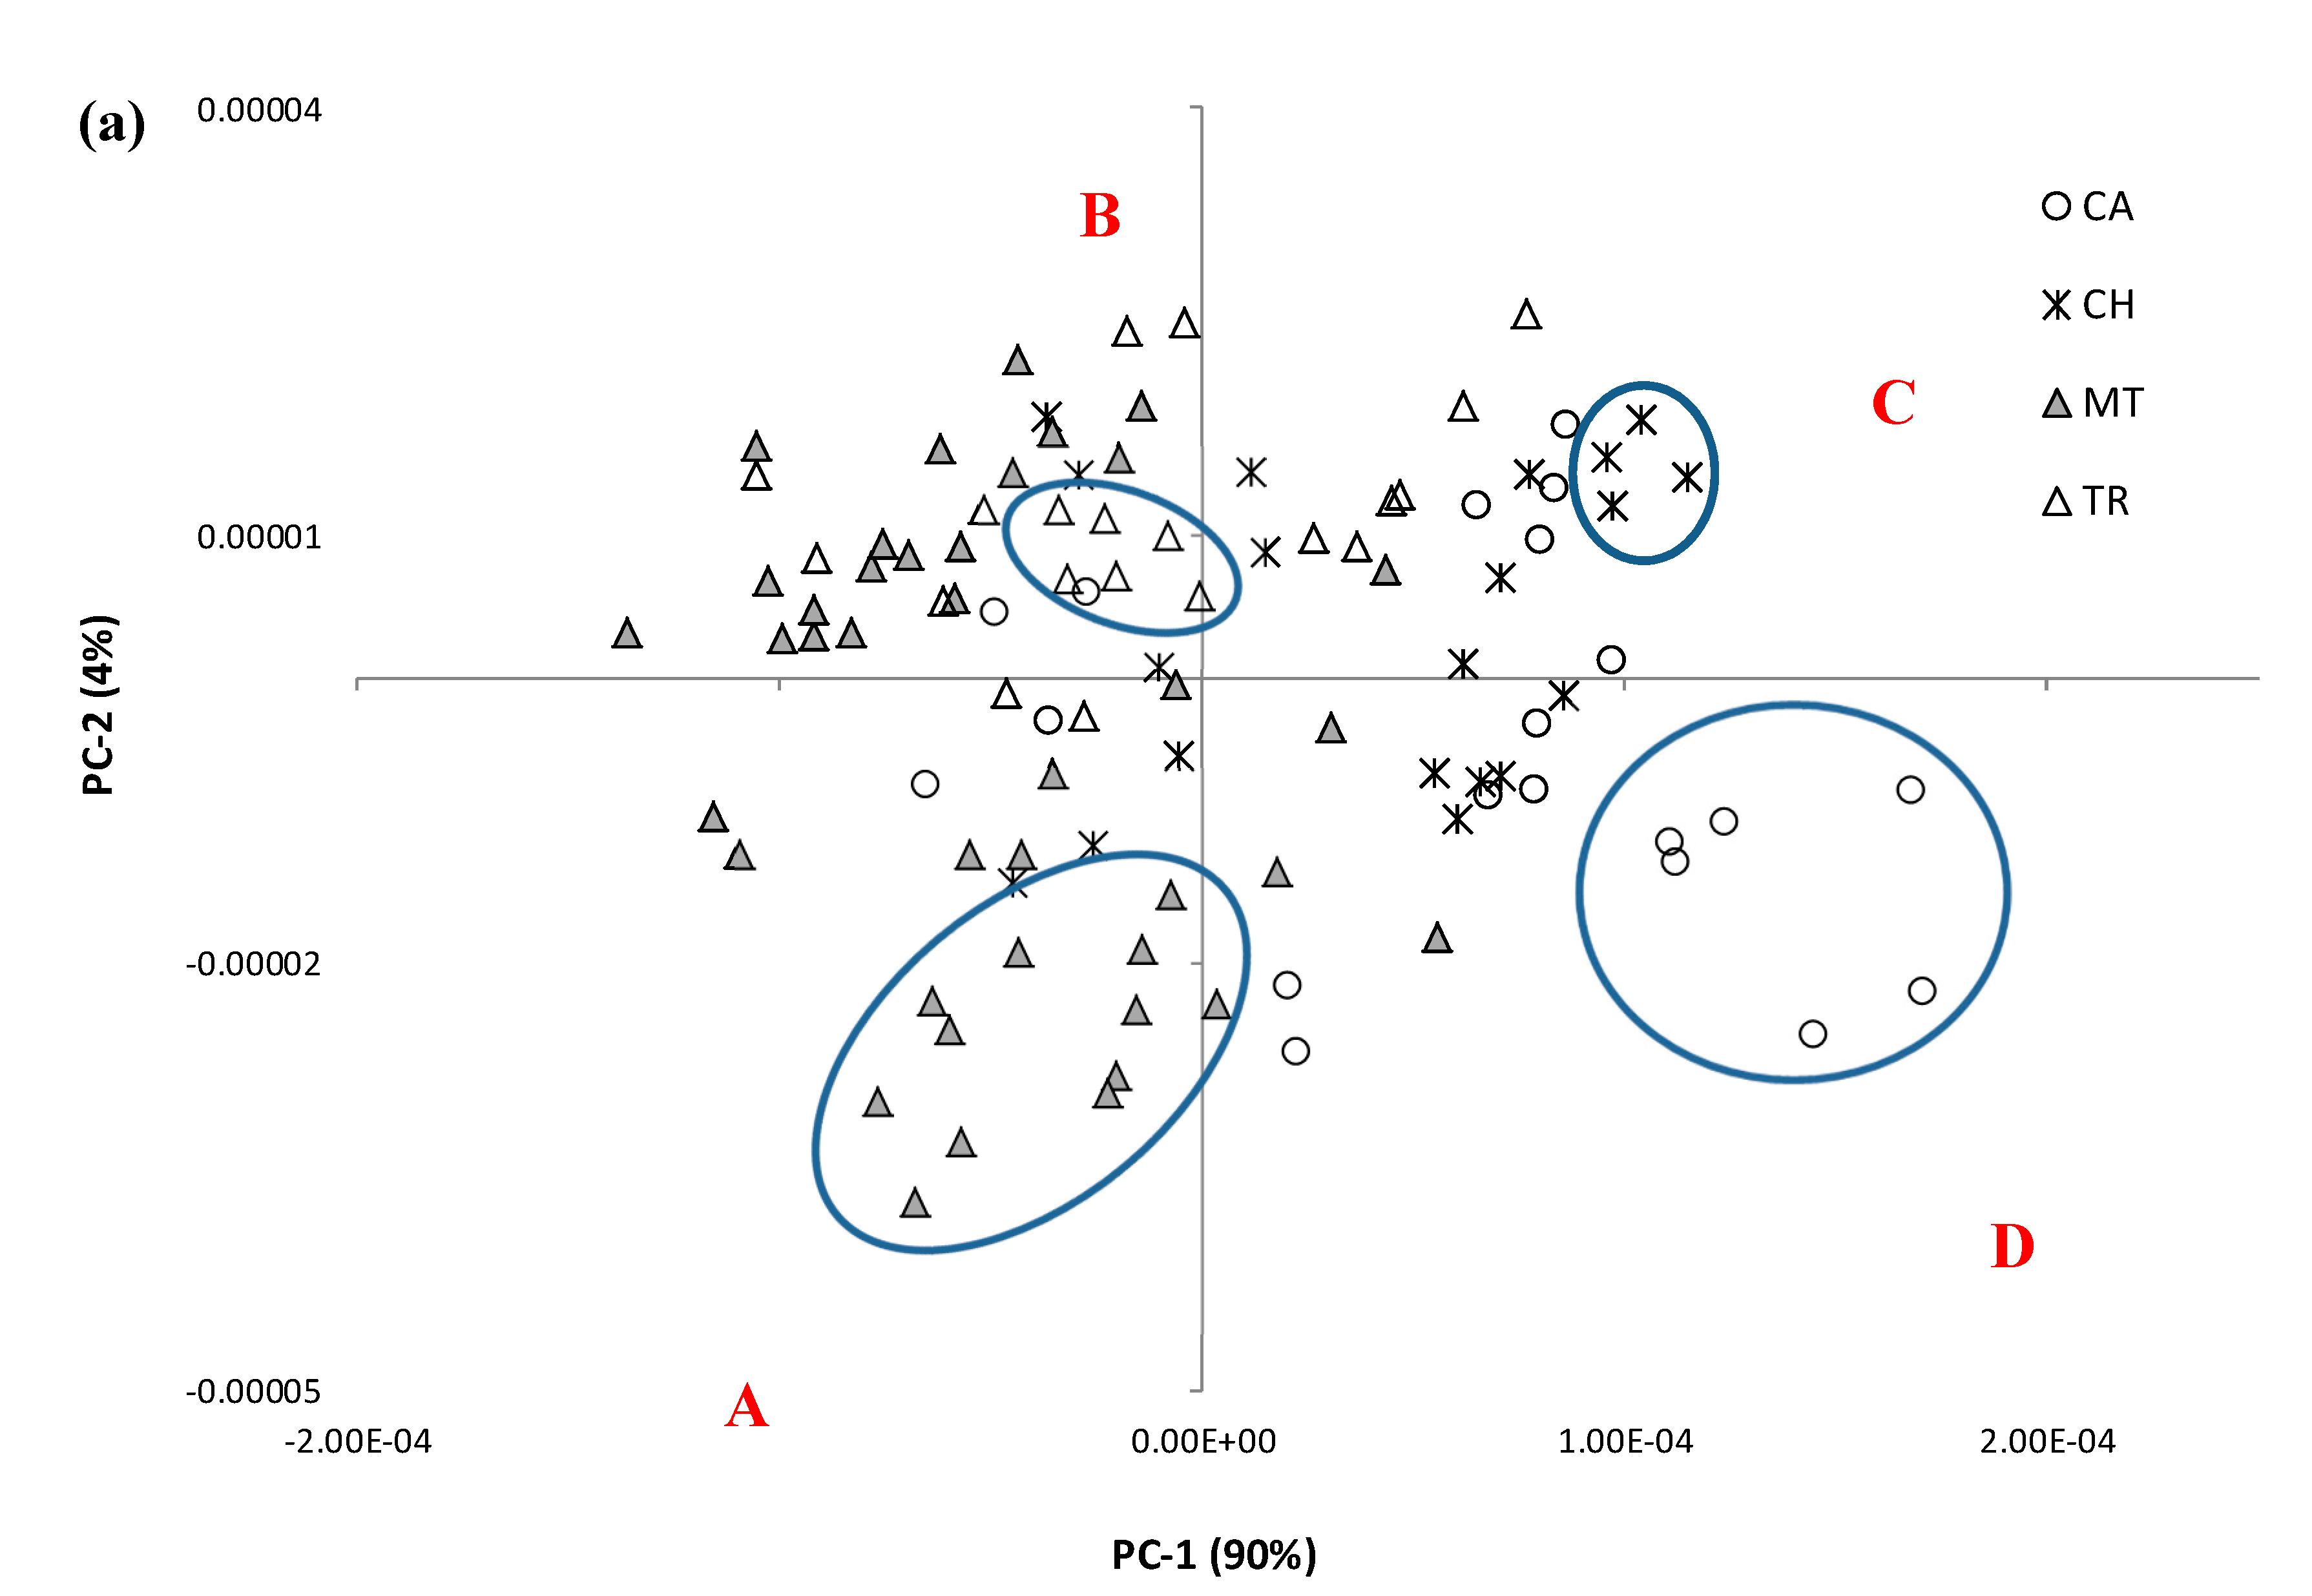
18]. Sparkling white wines can also exhibit diverse sensory properties, depending on their method of production, which in turn influences quality and price. As such, the potential for ATR-MIR combined with PCA to classify sparkling white wines according to production method and/or quality was evaluated. Score plots displaying the first two PCs derived from the ‘fingerprint’ region of MIR spectra from 50 sparkling white wine samples (analyzed in duplicate, from two wine replicates) labelled according to production method and quality scores are shown as
Figure 4a,b, respectively.
Figure 4.
Score plots of the first two PC’s derived from the ‘fingerprint’ region (1500–900 cm
−1) of MIR spectra from (degassed) sparkling white wines, labelled by (
a) production method, CA = carbonated (
n = 10), CH = Charmat (
n = 10), MT = Methodé Traditionelle (
n = 20) and TR = Transfer (
n = 10); and by (
b) quality scores. Sparkling wines located within the circled regions designated as
A,
B,
C and
D have sensory profiles displayed in
Figure 6.
Differences were observed in the PCA score plot of sparkling white wines by method of production (
Figure 4a). Carbonated and Charmat sparkling wines mostly clustered in the quadrants on the right; while Transfer and Methodé Traditionelle sparkling wines mostly clustered in the quadrants on the left. However, two carbonated wines and three Charmat wines overlapped with Transfer and Methodé Traditionelle wines. Furthermore, while wine replicates (
i.e., samples of the same wine, taken from different bottles) clustered closely together, they rarely overlapped, which indicates some bottle to bottle variation. The influence of production method on the style and sensory properties of sparkling wines is well established; carbonated and Charmat sparkling wines are typically fruit-driven styles, whereas Transfer and Methodé Traditionelle sparkling wines tend to exhibit complexity due to yeast autolysis and lees aging, post-secondary fermentation [
2]; albeit sensory analysis indicated some carbonated and Charmat wines exhibited complexity, while some Transfer and Methodé Traditionelle wines displayed overt fruit aroma and flavor (data not shown). This may explain the overlap of some carbonated and Charmat wines, with Transfer and Methodé Traditionelle wines, and
vice versa.
Classification of sparkling wines according to quality ratings was less evident, albeit a trend was observed (
Figure 4b). With the exception of one wine, wines given a quality score of 15.5 or above (
n = 14) were located in the left-hand quadrants. However, within these quadrants there were also ten wines with ratings between 15 and 15.4 and six wines given ratings below 15. The remaining 20 wines (with quality scores of 15.4 or less), were located in the right-hand quadrants. The difficulty in classifying sparkling wines based on quality scores may reflect the subjective nature of assessing quality. Assessments which rely on individual’s perceptions, even assessments by experts,
i.e., winemakers or wine show judges, are inevitably less well calibrated than analytical instruments. Furthermore, wines themselves can be deceiving. For instance, one of the carbonated sparkling wines was produced from an aged base wine and it therefore exhibited an unusual level of complexity, which may have contributed to its high quality score. Conversely, one Methodé Traditionelle wine exhibited noticeable volatile acidity (VA) and consequently received an especially low quality score. Whilst VA is ordinarily considered a winemaking fault, in this case, it was an intended to be indicative of a deliberate house style.
Partial least square (PLS) regression models were developed in order to determine any relationship between sparkling wine sensory attributes and MIR spectral data. The sensory profiles of each sparkling white wine were determined by descriptive analysis. A trained panel rated the intensity of 27 attributes, including a range of fruit and yeast-derived aromas and/or flavors, as well as sweetness, acidity and complexity. Nine of these attributes gave coefficients of determination (
i.e., R
2) ≥ 0.50 (
Table 2).
Table 2.
Range, mean, standard deviation (SD) and cross validation statistics for sensory attributes in sparkling white wine samples analyzed by ATR-MIR spectroscopy.
Table 2.
Range, mean, standard deviation (SD) and cross validation statistics for sensory attributes in sparkling white wine samples analyzed by ATR-MIR spectroscopy.
| Sensory Attribute | Range | Mean | SD | R2 | SECV | PLS Terms |
|---|
| Sweetness P | 2.3–8.3 | 4.81 | 1.37 | 0.72 | 0.73 | 4 |
| Confection P | 1.6–7.2 | 3.57 | 1.27 | 0.63 | 0.77 | 4 |
| Tropical Fruit P | 4.3–9.4 | 6.27 | 1.30 | 0.61 | 0.82 | 4 |
| Meaty/Savoury P | 1.3–6.0 | 2.86 | 1.05 | 0.59 | 0.68 | 3 |
| Toasty P | 2.4–8.0 | 4.83 | 1.29 | 0.57 | 0.86 | 4 |
| Tropical Fruit A | 3.6–8.8 | 5.20 | 1.48 | 0.56 | 1.00 | 4 |
| Floral P | 3.2–7.7 | 4.72 | 1.07 | 0.51 | 0.76 | 4 |
| Floral A | 2.6–8.4 | 4.83 | 1.54 | 0.51 | 1.08 | 4 |
| Confection A | 1.6–7.2 | 3.43 | 1.27 | 0.50 | 0.91 | 4 |
The perception of
sweetness gave the highest correlation, being R
2 = 0.72;
i.e.,
sweetness ratings explained 72% of the variation within the PLS regression model. Ratings of
confection and
tropical fruit (on the palate) explained more than 60% of variation in the models; while >50% of variation was explained by intensity ratings for
tropical fruit,
floral and
confectionary aromas and
meaty/savoury,
toasty and
floral flavors on the palate. Previous studies have suggested correlations between spectral data and sensory attribute scores might result from co-linearity of compositional variables such as ethanol or residual sugar, or between wavelengths or other sensory properties [
19,
20]. It was interesting to note that the highest correlations were observed for the sensory attributes rated on the palate, rather than on the nose (
i.e., as aroma). Since most wine volatile compounds are present at low concentrations (
i.e., ng/L to mg/L levels), they are less likely to influence MIR spectra than more abundant wine constituents. Furthermore, when sensory panelists rate the intensity of aroma attributes, they may be preferentially evaluating the more volatile aroma compounds,
i.e., volatiles that are more abundant in the headspace of a wine glass. However, these volatiles may not be representative of a sample’s entire composition [
20].
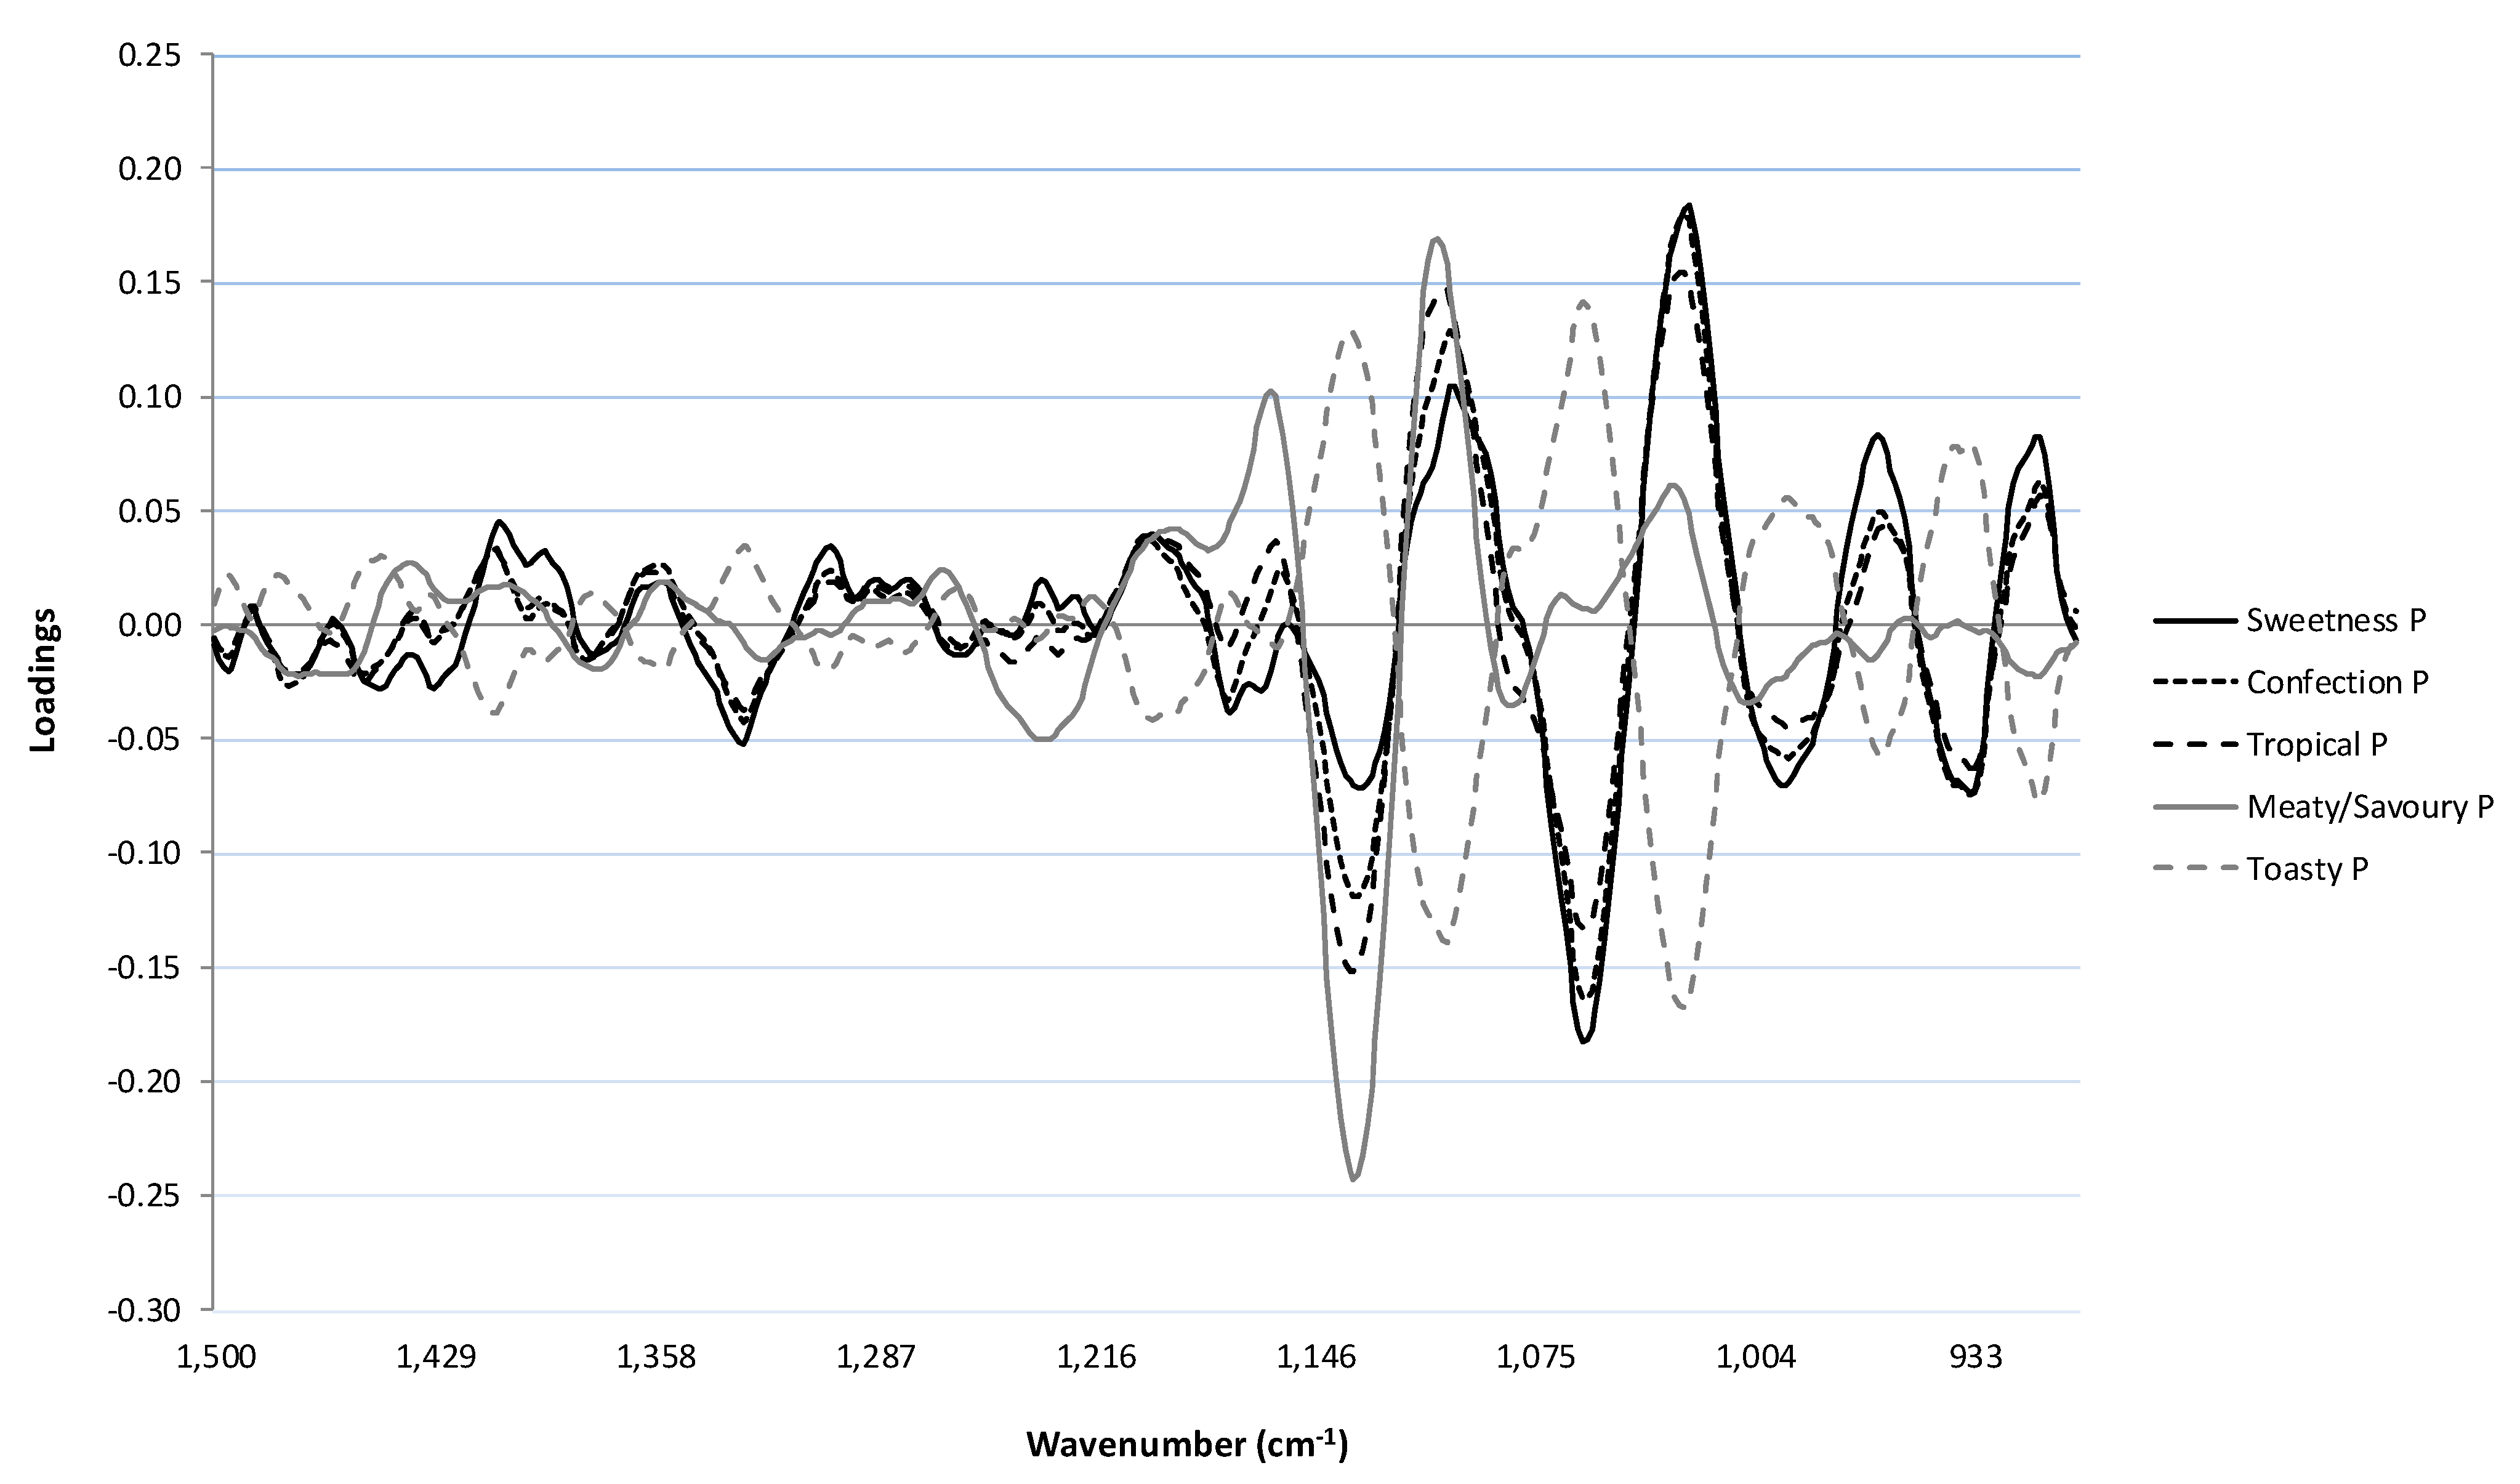
The loadings for optimal PLS1 calibrations for the five most highly correlated sensory attributes (
i.e.,
sweetness P,
confectionary P,
tropical fruit P,
meaty/savoury P and
toasty P) are shown in
Figure 5. The PLS loadings for
sweetness,
confectionary and
tropical fruit followed similar patterns, with the highest positive loadings at 1025 and 1100 cm
−1;
i.e., regions that had a large influence on the calibration models that were developed. As indicated above, these regions correspond to vibrational frequencies associated with the C–C and C–OH bonds of primary alcohols, glycerol and sugars [
4,
5,
11,
13,
14,
15]. Since the perception of sweetness is strongly influenced by both sugar and alcohol content, it is not surprisingly that regions corresponding to these compounds showed the greatest influence in the model. While the loadings for these three sensory attributes followed a similar pattern, there were differences in the size of loadings for some regions. For instance, the model for
tropical fruit had less influence at 1025 cm
−1 but more influence at 1100 cm
−1, compared to the other two attributes. Furthermore,
sweetness had higher positive loadings at 912 and 934 cm
−1; regions associated with alkene and aromatic C–H vibrational frequencies [
3]. There was also some variation in the region between 1420 and 1380 cm
−1, which may be associated with stretching of C–H bonds from polysaccharides. Interestingly, the loadings for the
toasty attribute had an inverse relationship to
sweetness,
confectionary and
tropical fruit. Therefore, the wine constituents that contributed positively to the models for
sweetness,
confectionary and
tropical fruit had a negative influence on the model for
toasty. This suggests that the
toasty model is driven by different wine constituents, particularly those corresponding to bonds with vibrational frequencies at 1060 and 1136 cm
−1. Furthermore, the
toasty attribute had positive loadings in the region of 1500–1400 cm
−1, which could be related to volatile phenols, such as guaiacol and 4-methylguaiacol, which can impart
smoky characters to wine [
14]. However, this region has less influence in the model, as the loadings were relatively small. The
meaty/savoury and
toasty attributes are indicative of yeast autolysis or lees aging, whereas the ‘fresher’ characters of
sweetness,
confectionary and tropical fruit are likely to be grape or fermentation derived. It is therefore not surprising that the fresh characters appear to be driven by similar wine constituents.
To further investigate the relationship between sparkling wine sensory attributes and MIR spectra, comparisons were made between the sensory profiles of selected sparkling wines that were clustered closely together;
i.e., those circled in regions designated as A, B, C and D in
Figure 4a. The sensory profiles of Methodé Traditionelle (
n = 6), Transfer (
n = 3), Charmat (
n = 2) and carbonated (
n = 3) sparkling wines are shown in
Figure 6a–d, respectively. For simplification, only sensory attributes which gave good correlations in the PLS regression models were included. Furthermore, the carbonated sparkling wine located within circled region B was excluded. In general, wines that clustered together in the PCA score plot (
Figure 4a) were found to exhibit similar sensory profiles.
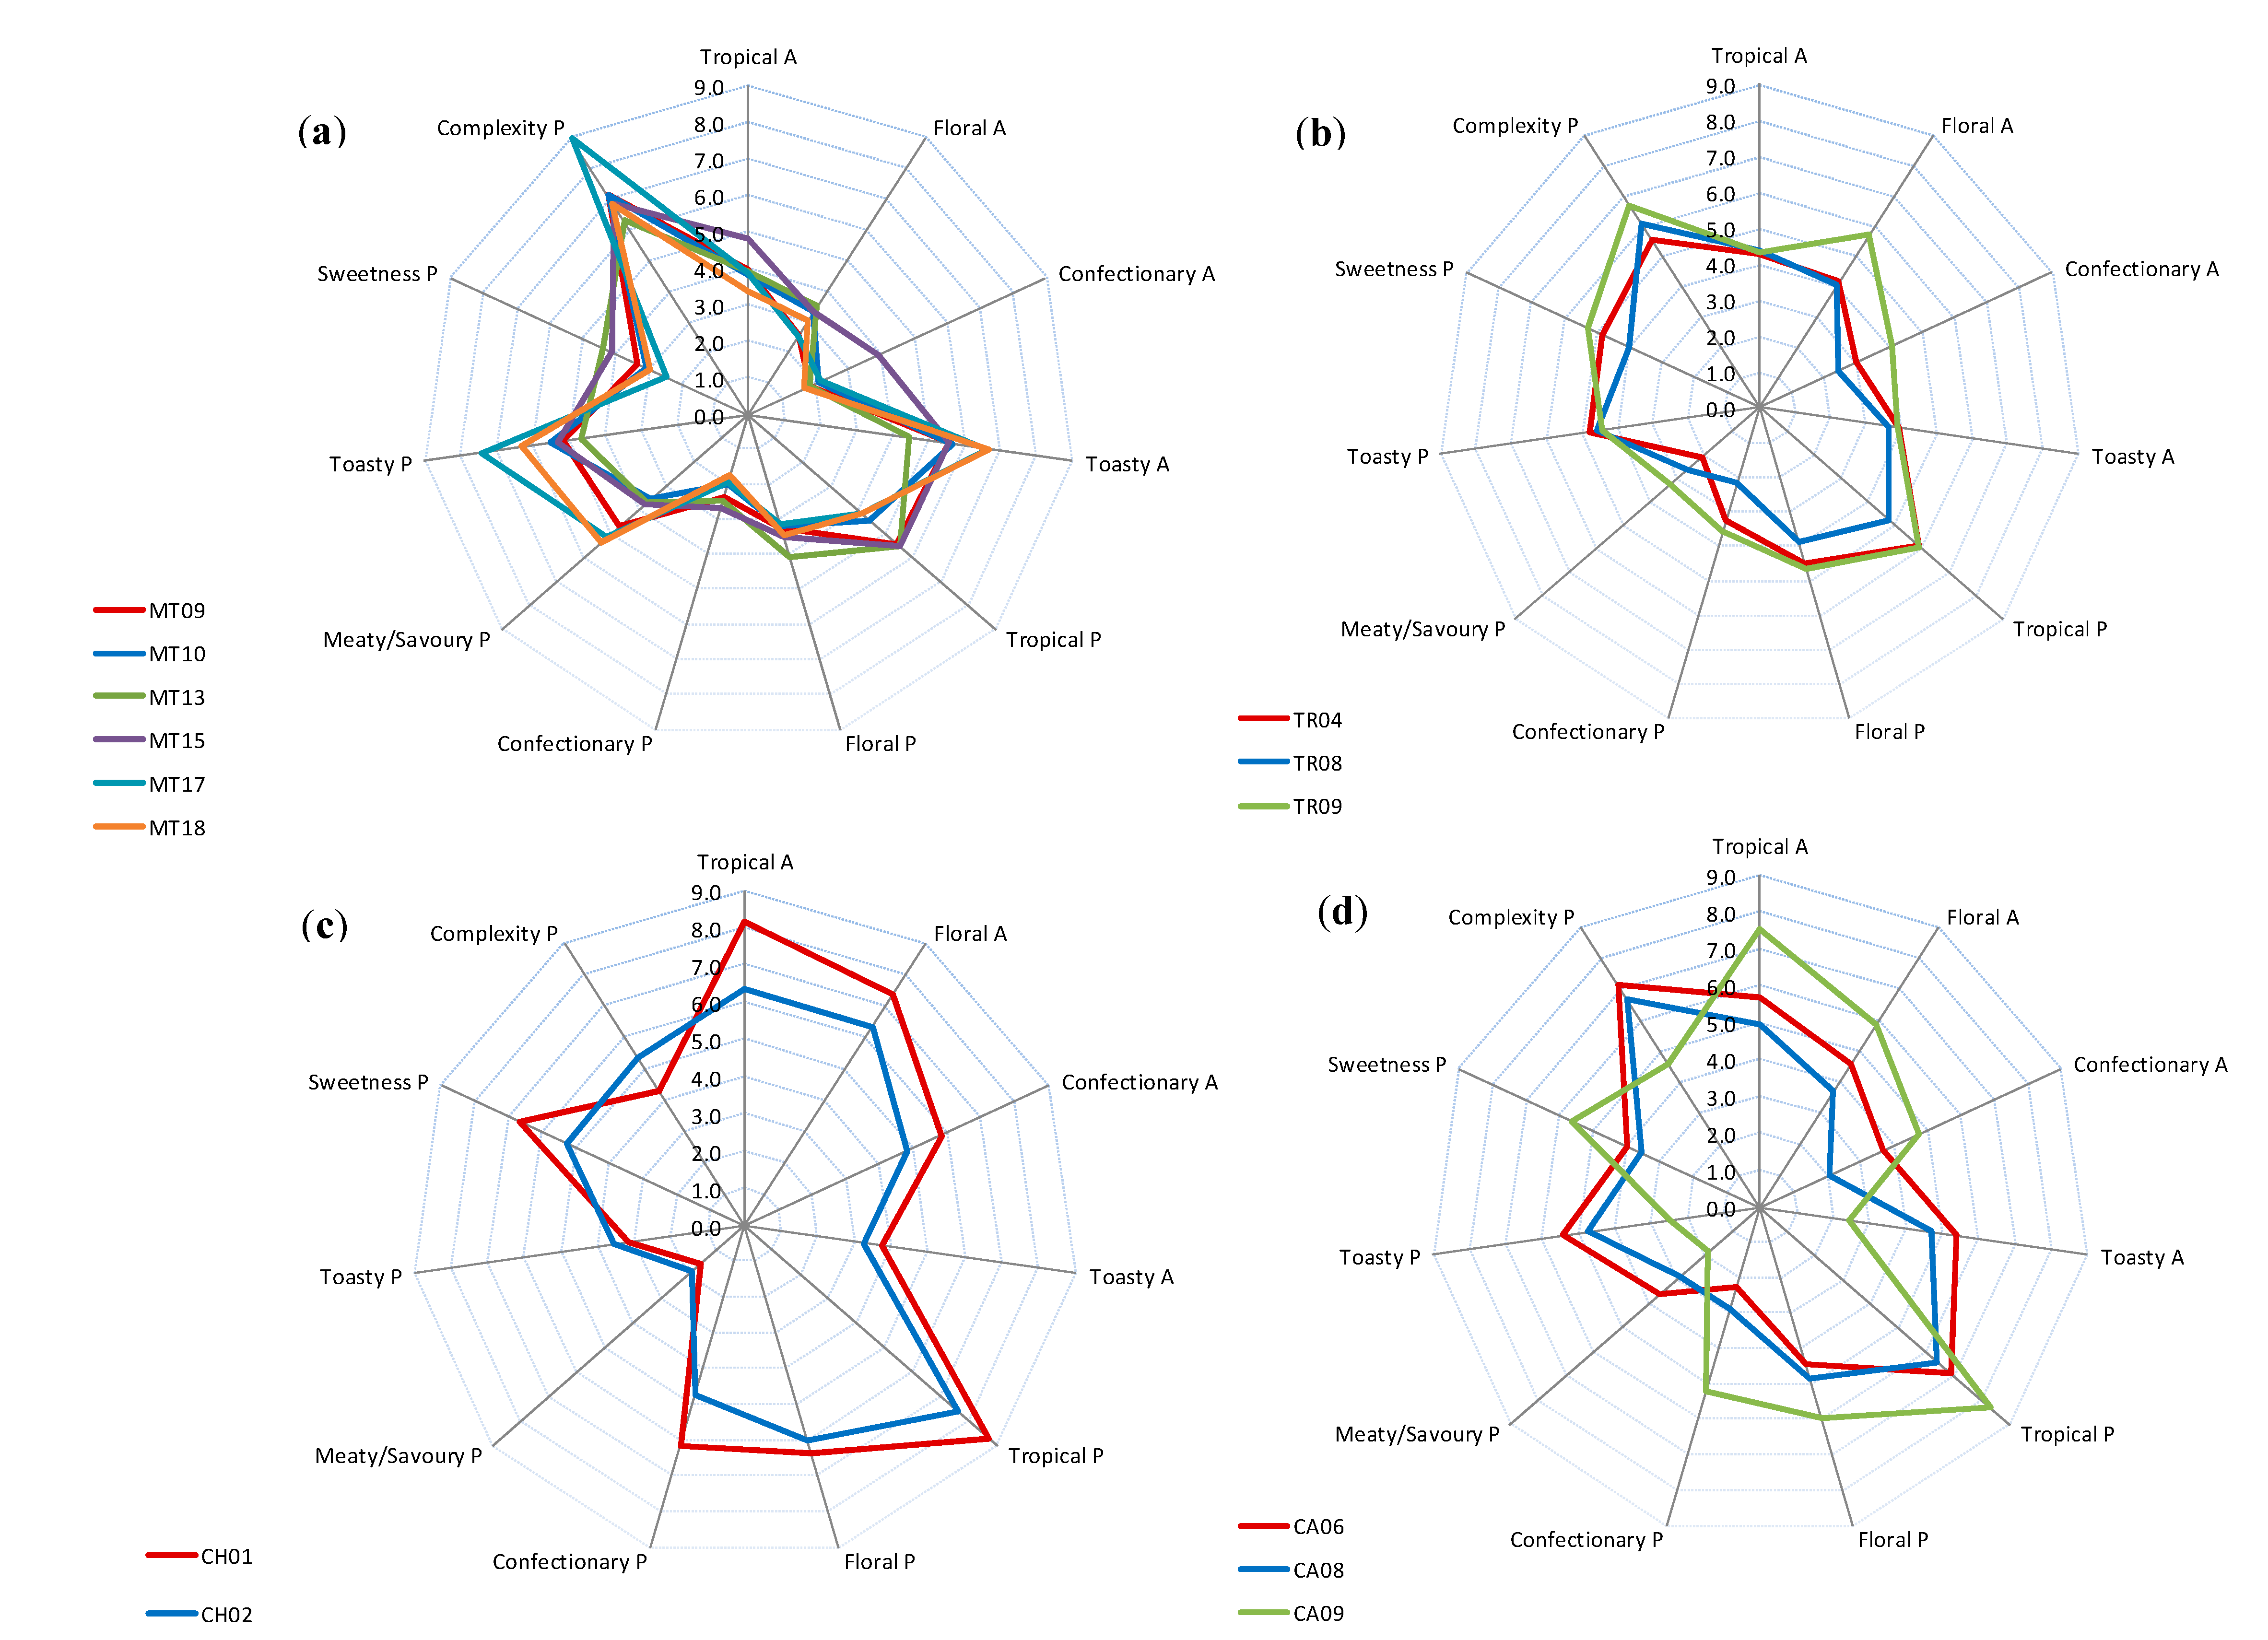
This was particularly evident for Methodé Traditionelle, Transfer and Charmat sparkling wines, but less so for carbonated sparkling wines, which exhibited the most style variation. The Methodé Traditionelle and Transfer wines exhibited considerable complexity, characterized by
meaty/savoury and
toasty characters, which typically result from yeast autolysis and lees-aging post-secondary fermentation. In some cases, sparkling wines are deliberately aged on yeast lees to enhance wine complexity and texture [
2]. For example, production of MT17 involved >6 years lees aging; this almost certainly contributed to the high ratings of
toasty and
complexity on the palate (
Figure 6a). In contrast, carbonated and Charmat sparkling wines predominantly exhibited fruit characters (
Figure 6c,d). The sensory profile of CA09 was more representative of the carbonated sparkling wines studied; whereas CA06 and CA08 displayed unusually high complexity, due to extended ageing of their base wine. Although these three carbonated wines were clustered together on the PCA score plot (
Figure 4a), their sensory profiles were less similar, suggesting different wine constituents influenced the MIR spectra and sensory properties. Since the PLS loadings suggested sugar and alcohol content both impacted the MIR spectra of sparkling wines, the sugar and alcohol concentrations of the wines depicted in
Figure 6 were compared (
Table 3) and clustering did indeed appear to be based on sugar and alcohol content. The Transfer sparkling wines (upper left quadrant) were high in both sugar and alcohol; Methodé Traditionelle sparkling wines (lower left quadrant) were low in sugar but higher in alcohol; Charmat sparkling wines (upper right quadrant) were high in sugar, but lower in alcohol; and carbonated sparkling wines (lower right quadrant) were low in both sugar and alcohol.
Figure 5.
Optimal partial least squares regression coefficients derived from analysis of the MIR fingerprint spectra (1500–900 cm−1) against the top five correlated sensory attributes (sweetness P, confection P, tropical P, meaty/savoury P and toasty P) for the sparkling white wines. P denotes that the sensory attribute was rated on the palate.
Table 3.
Mean sugar and alcohol concentrations for those wines located in the circled regions A, B, C and D in each of the quadrants in the PCA score plot (
Figure 4a).
Table 3.
Mean sugar and alcohol concentrations for those wines located in the circled regions A, B, C and D in each of the quadrants in the PCA score plot (Figure 4a).
| Upper Left Quadrant | Upper Right Quadrant |
| Transfer (n = 3) | Charmat (n = 2) |
| RS = 12.2 g/L | RS = 17.3 g/L |
| Alcohol = 11.8% (abv) | Alcohol = 11.2% (abv) |
| Lower Left Quadrant | Lower Right Quadrant |
| Methodé Traditionelle (n = 6) | Carbonated (n = 2) |
| RS = 6.2 g/L | RS = 9.0 g/L |
| Alcohol = 11.9% (abv) | Alcohol = 10.5% (abv) |
Figure 6.
Sensory profiles of (
a) Methodé Traditionelle (
n = 6); (
b) Transfer (
n = 3); (
c) Charmat (
n = 2); and (
d) carbonated (
n = 3) sparkling wines that clustered in the circled regions A, B, C and D respectively, on the PCA score plot displayed as
Figure 4a, (NB: circled regions comprise duplicates).
The first PC therefore appears to be differentiating wines according to alcohol content, while the second PC gives separation based on sugar content. A similar trend was observed when the sugar and alcohol content of all sparkling wines was considered; on average: wines located within the upper left quadrant (n = 17) had 11.7 g/L of RS and 12.5% abv; wines within the upper right quadrant (n = 12) had 13.7 g/L of RS and 11.2% abv; wine from the lower left quadrant (n = 13 wines) had 8.2 g/L of RS and 12.1% abv; and wines situated in the lower right quadrant (n = 8) had 11.3 g/L of RS and 11.2% abv.


