
Synthesis, Biological Evaluation, and Docking Studies of a Novel Sulfonamido-Based Gallate as Pro-Chondrogenic Agent for the Treatment of Cartilage

Abstract
:
1. Introduction
2. Results
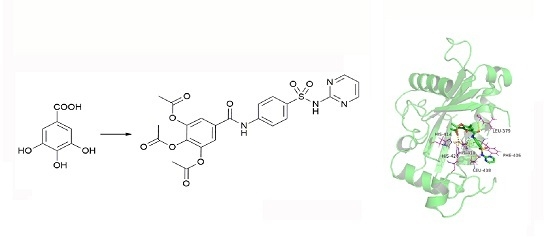
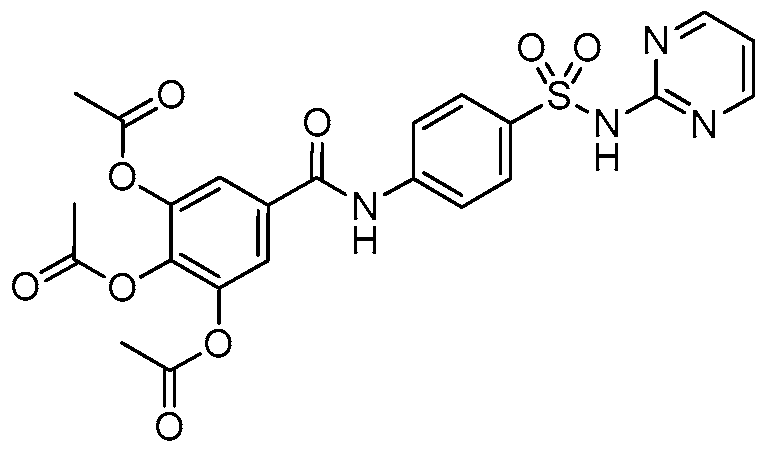
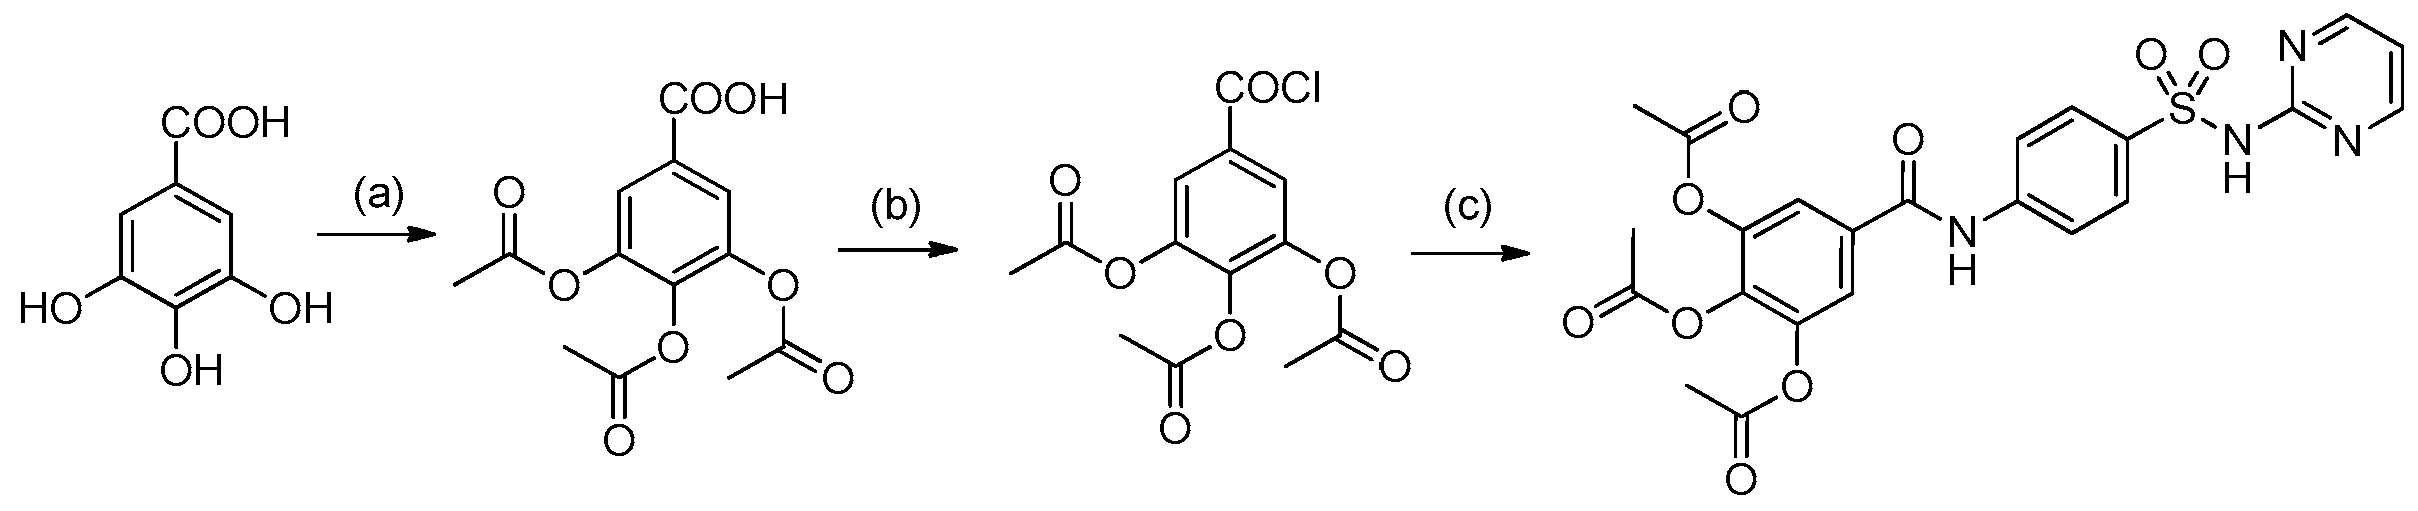
2.1. Chemistry
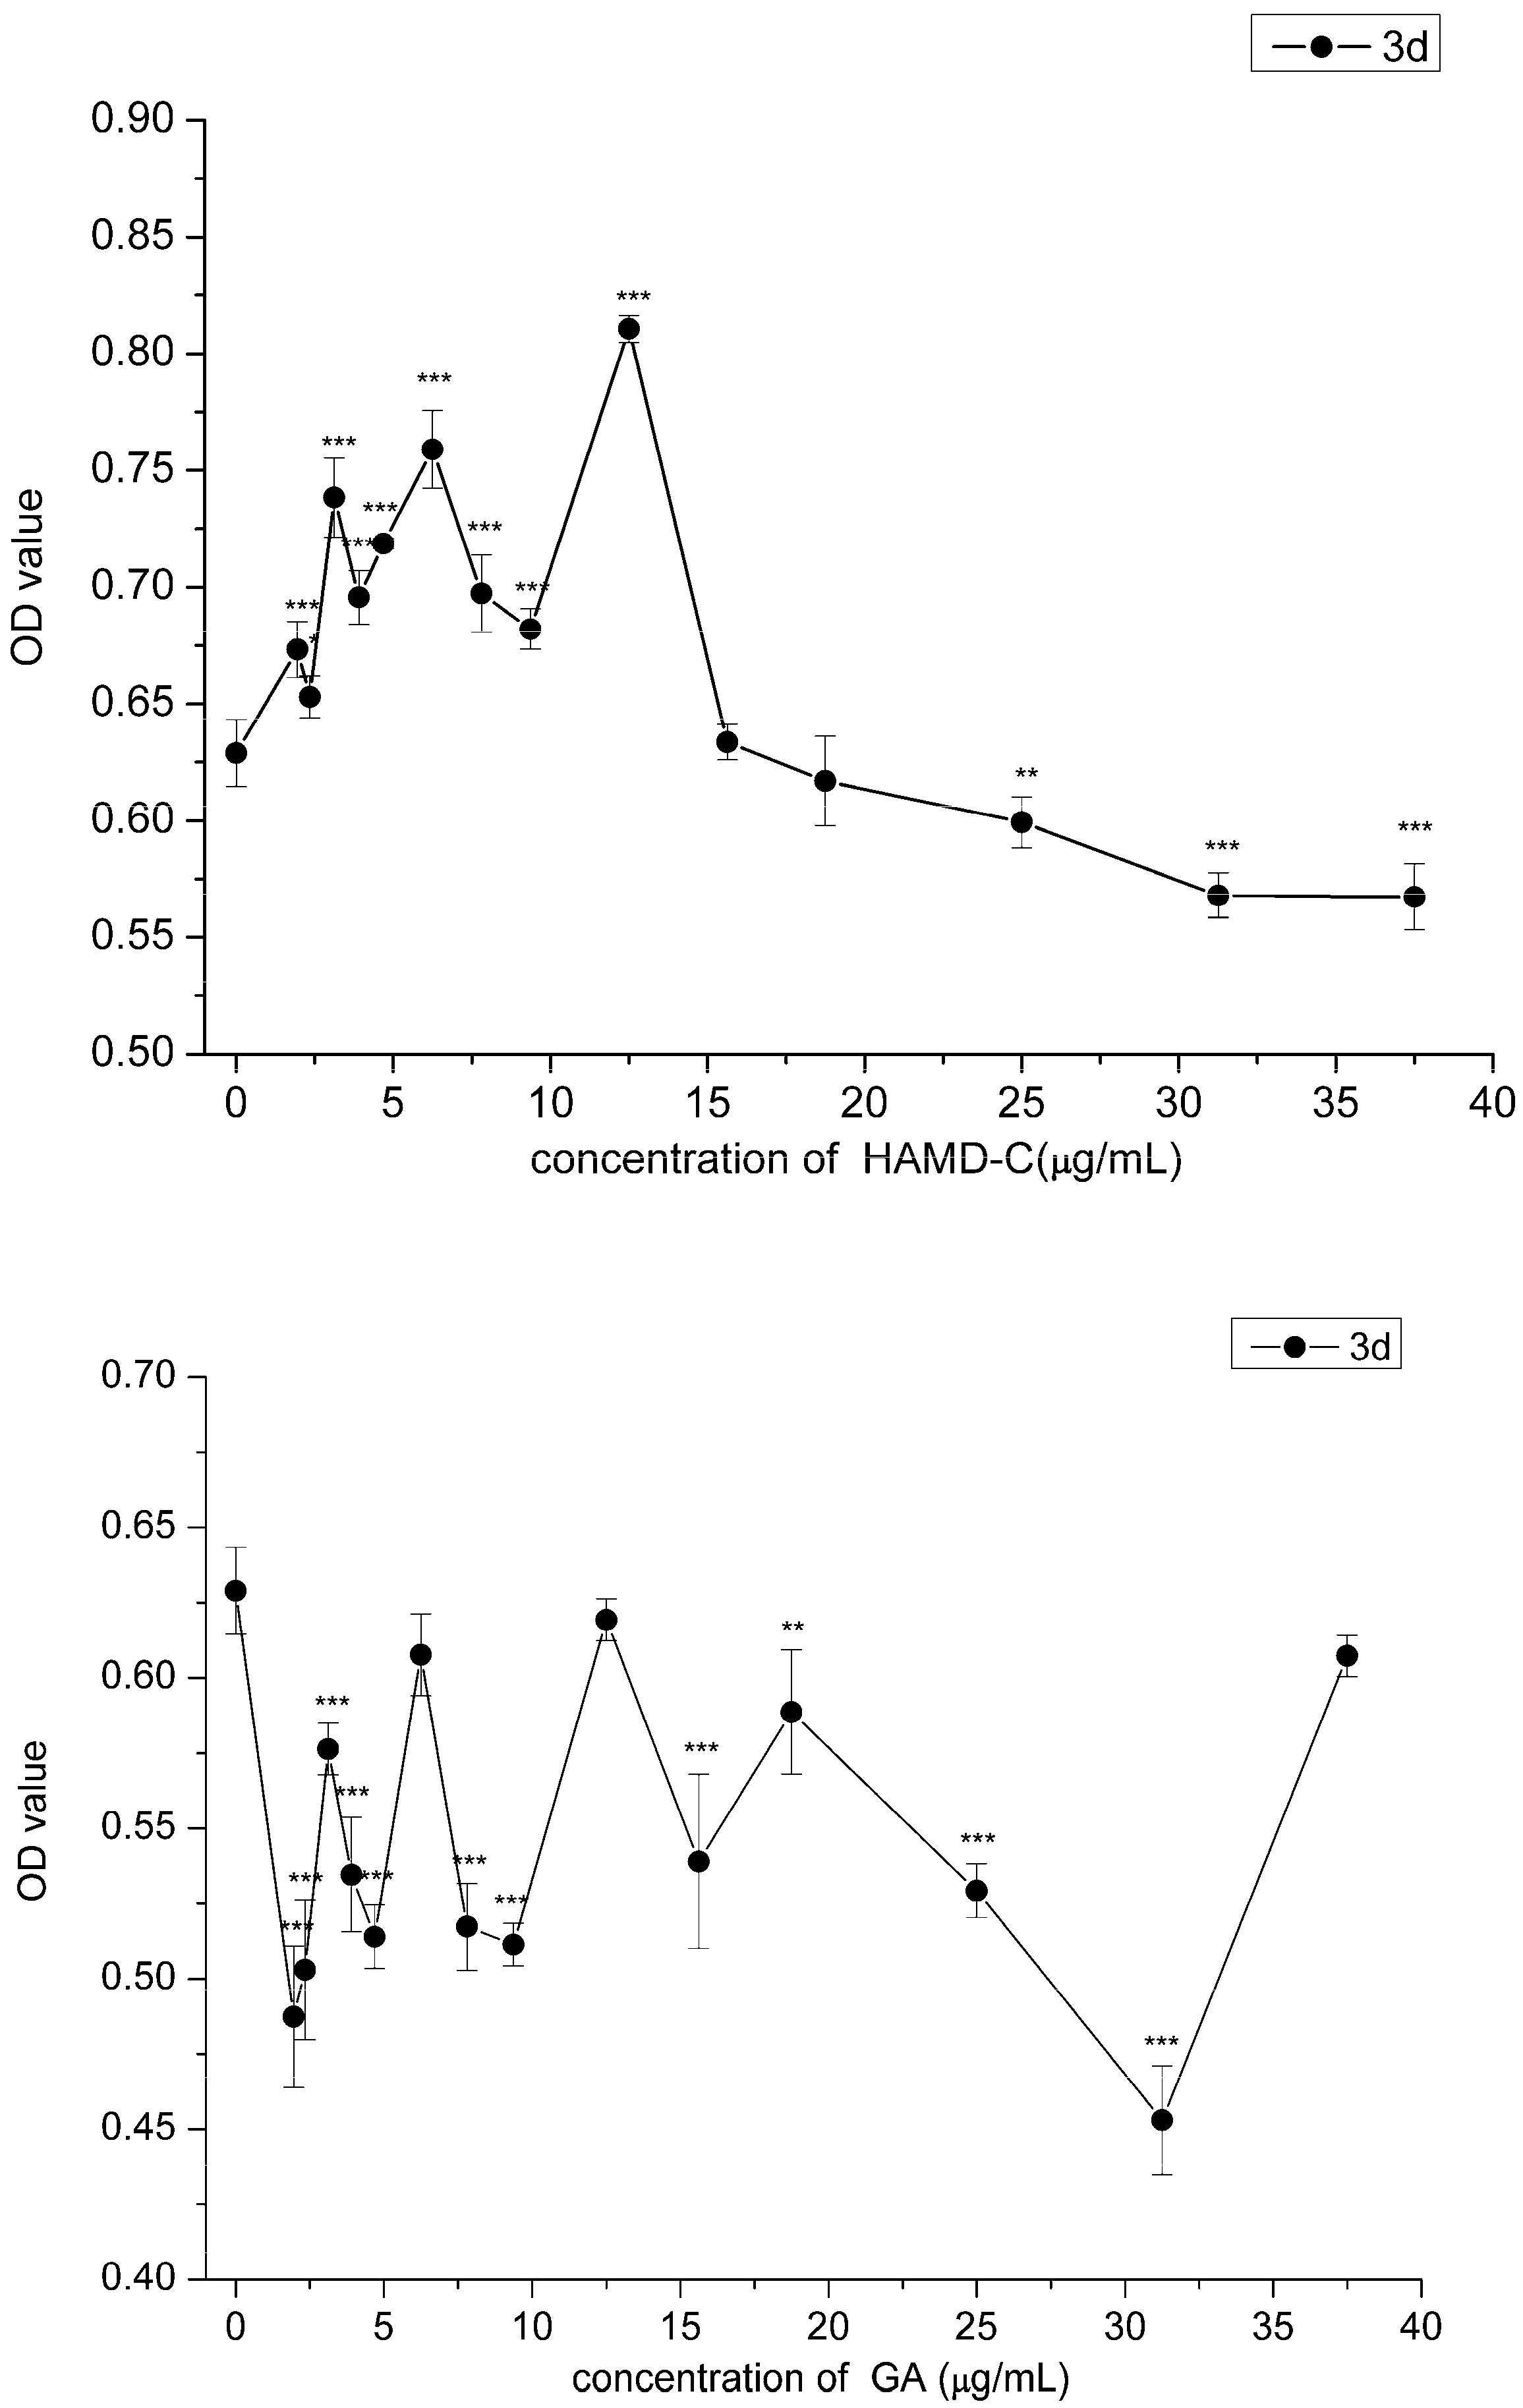
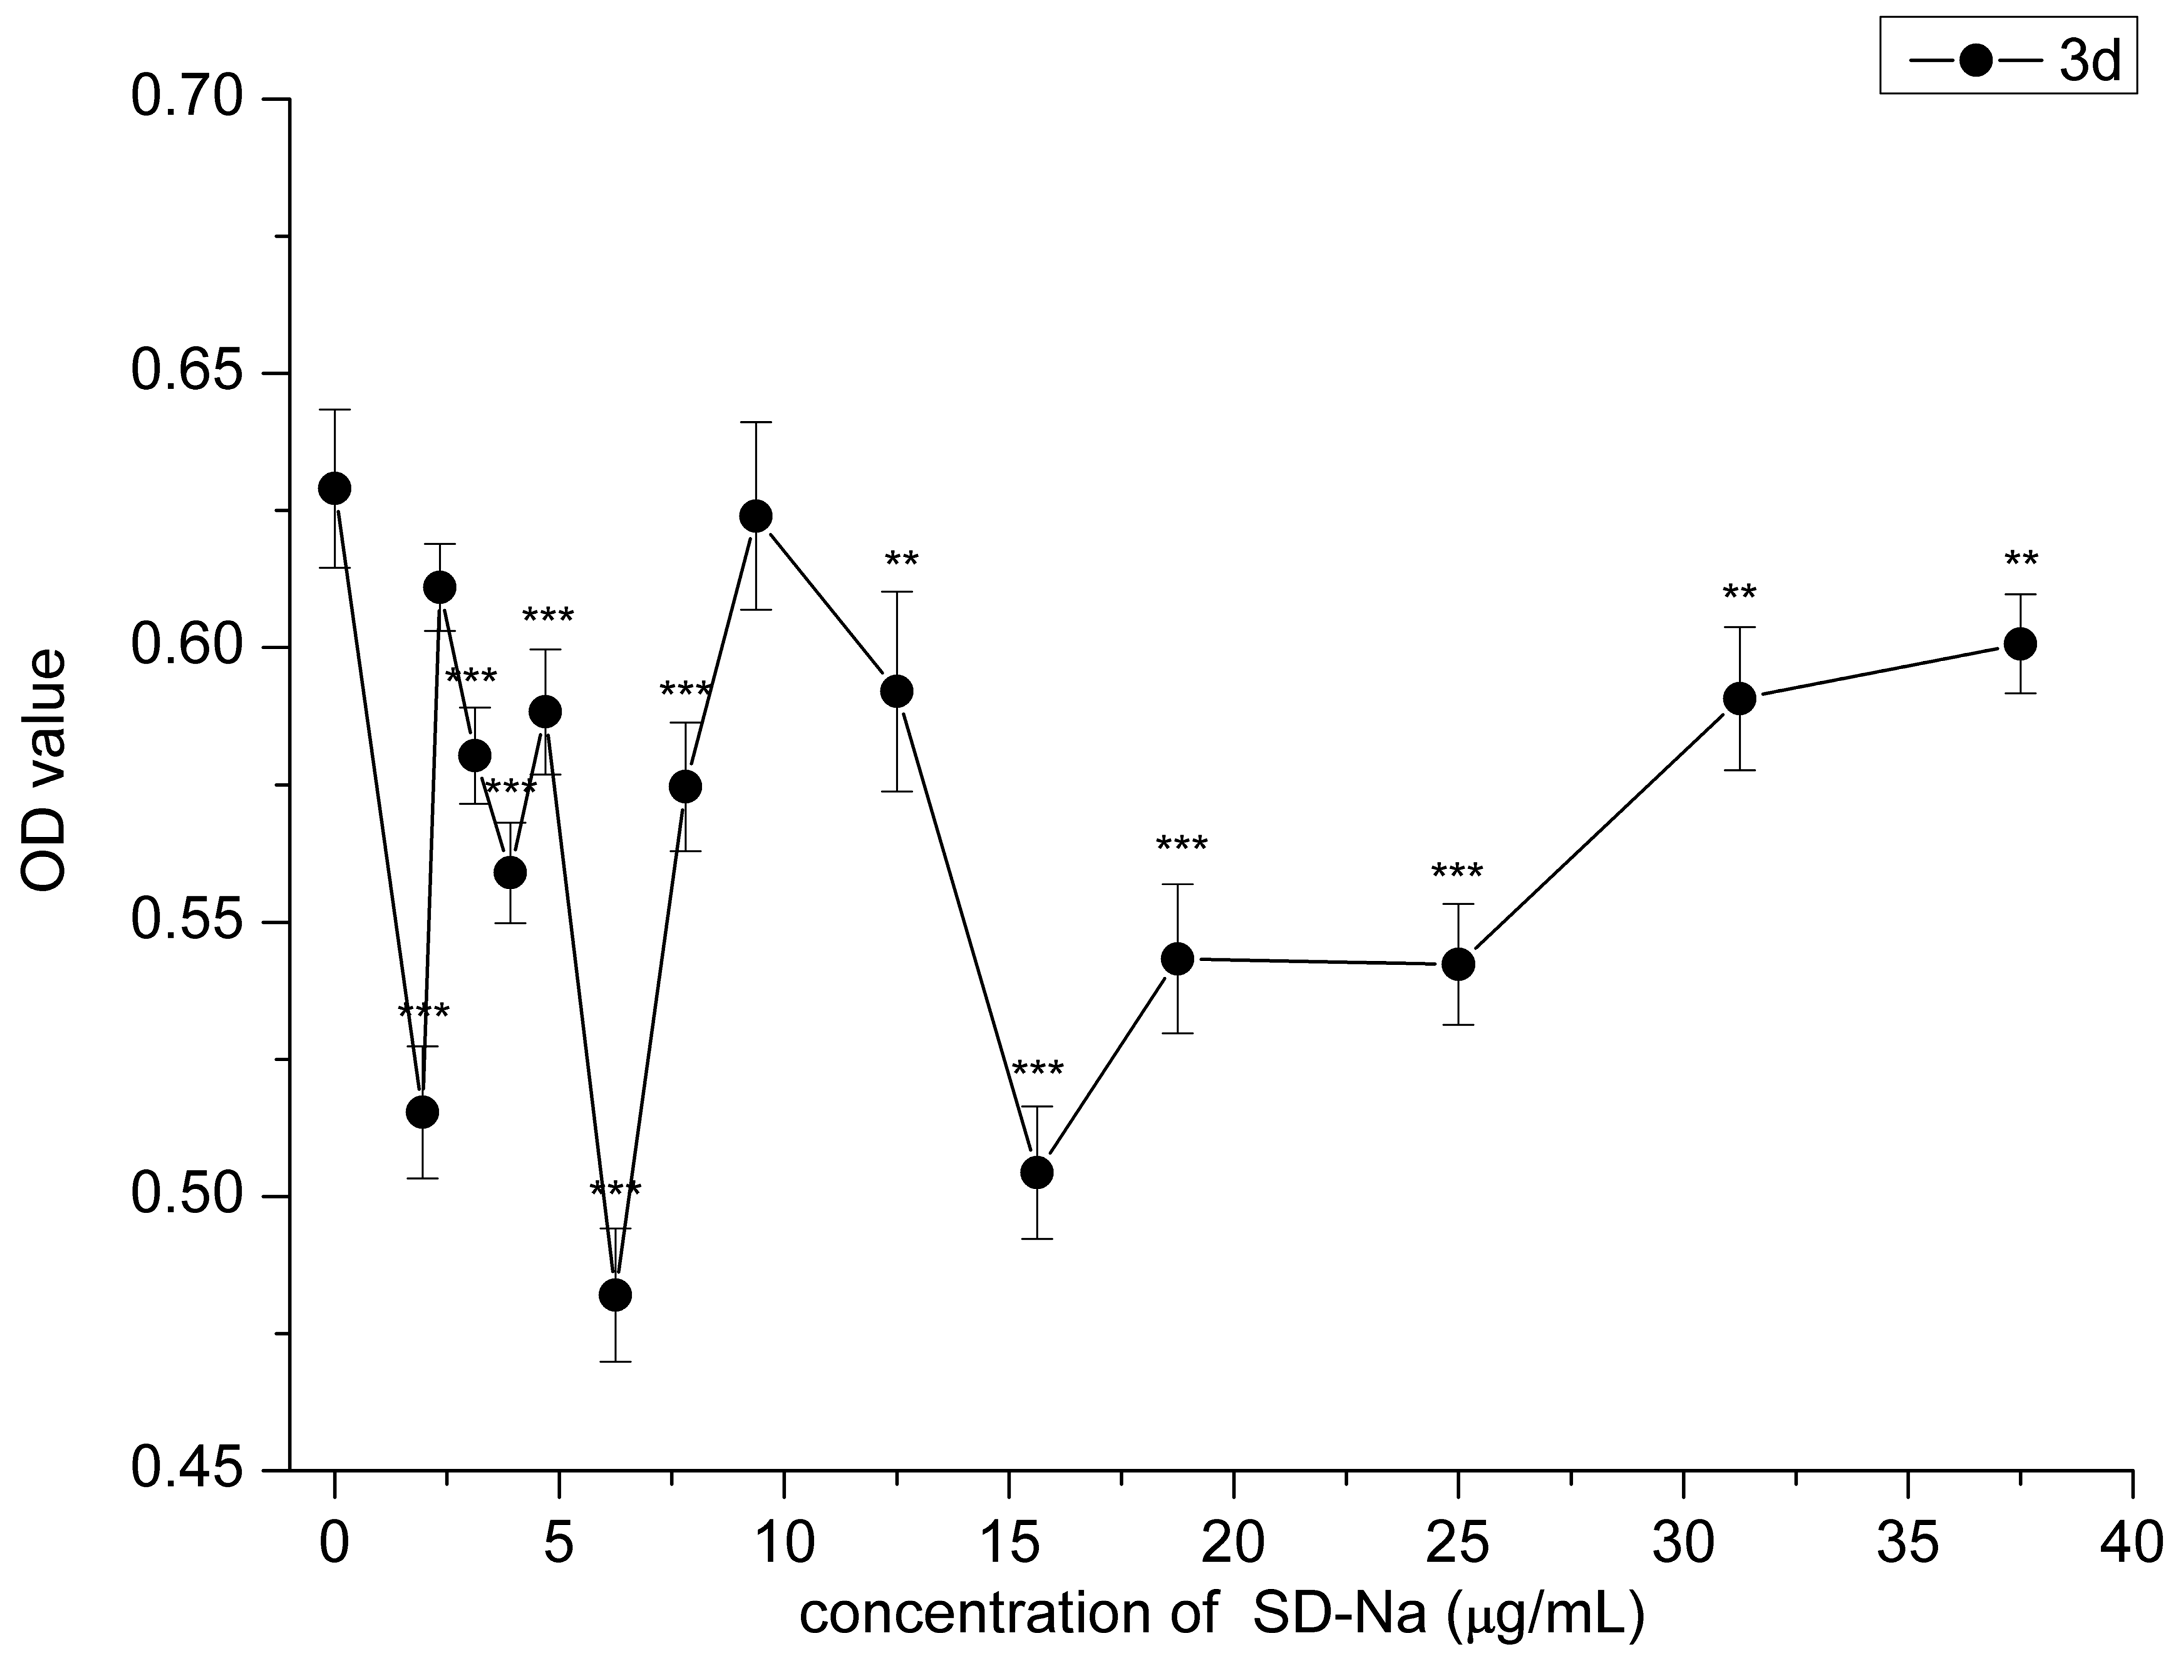
2.2. Cytotoxicity Assay
2.3. Effect of HAMDC, SD-Na and GA on IL-1β Stimulated Chondrocytes
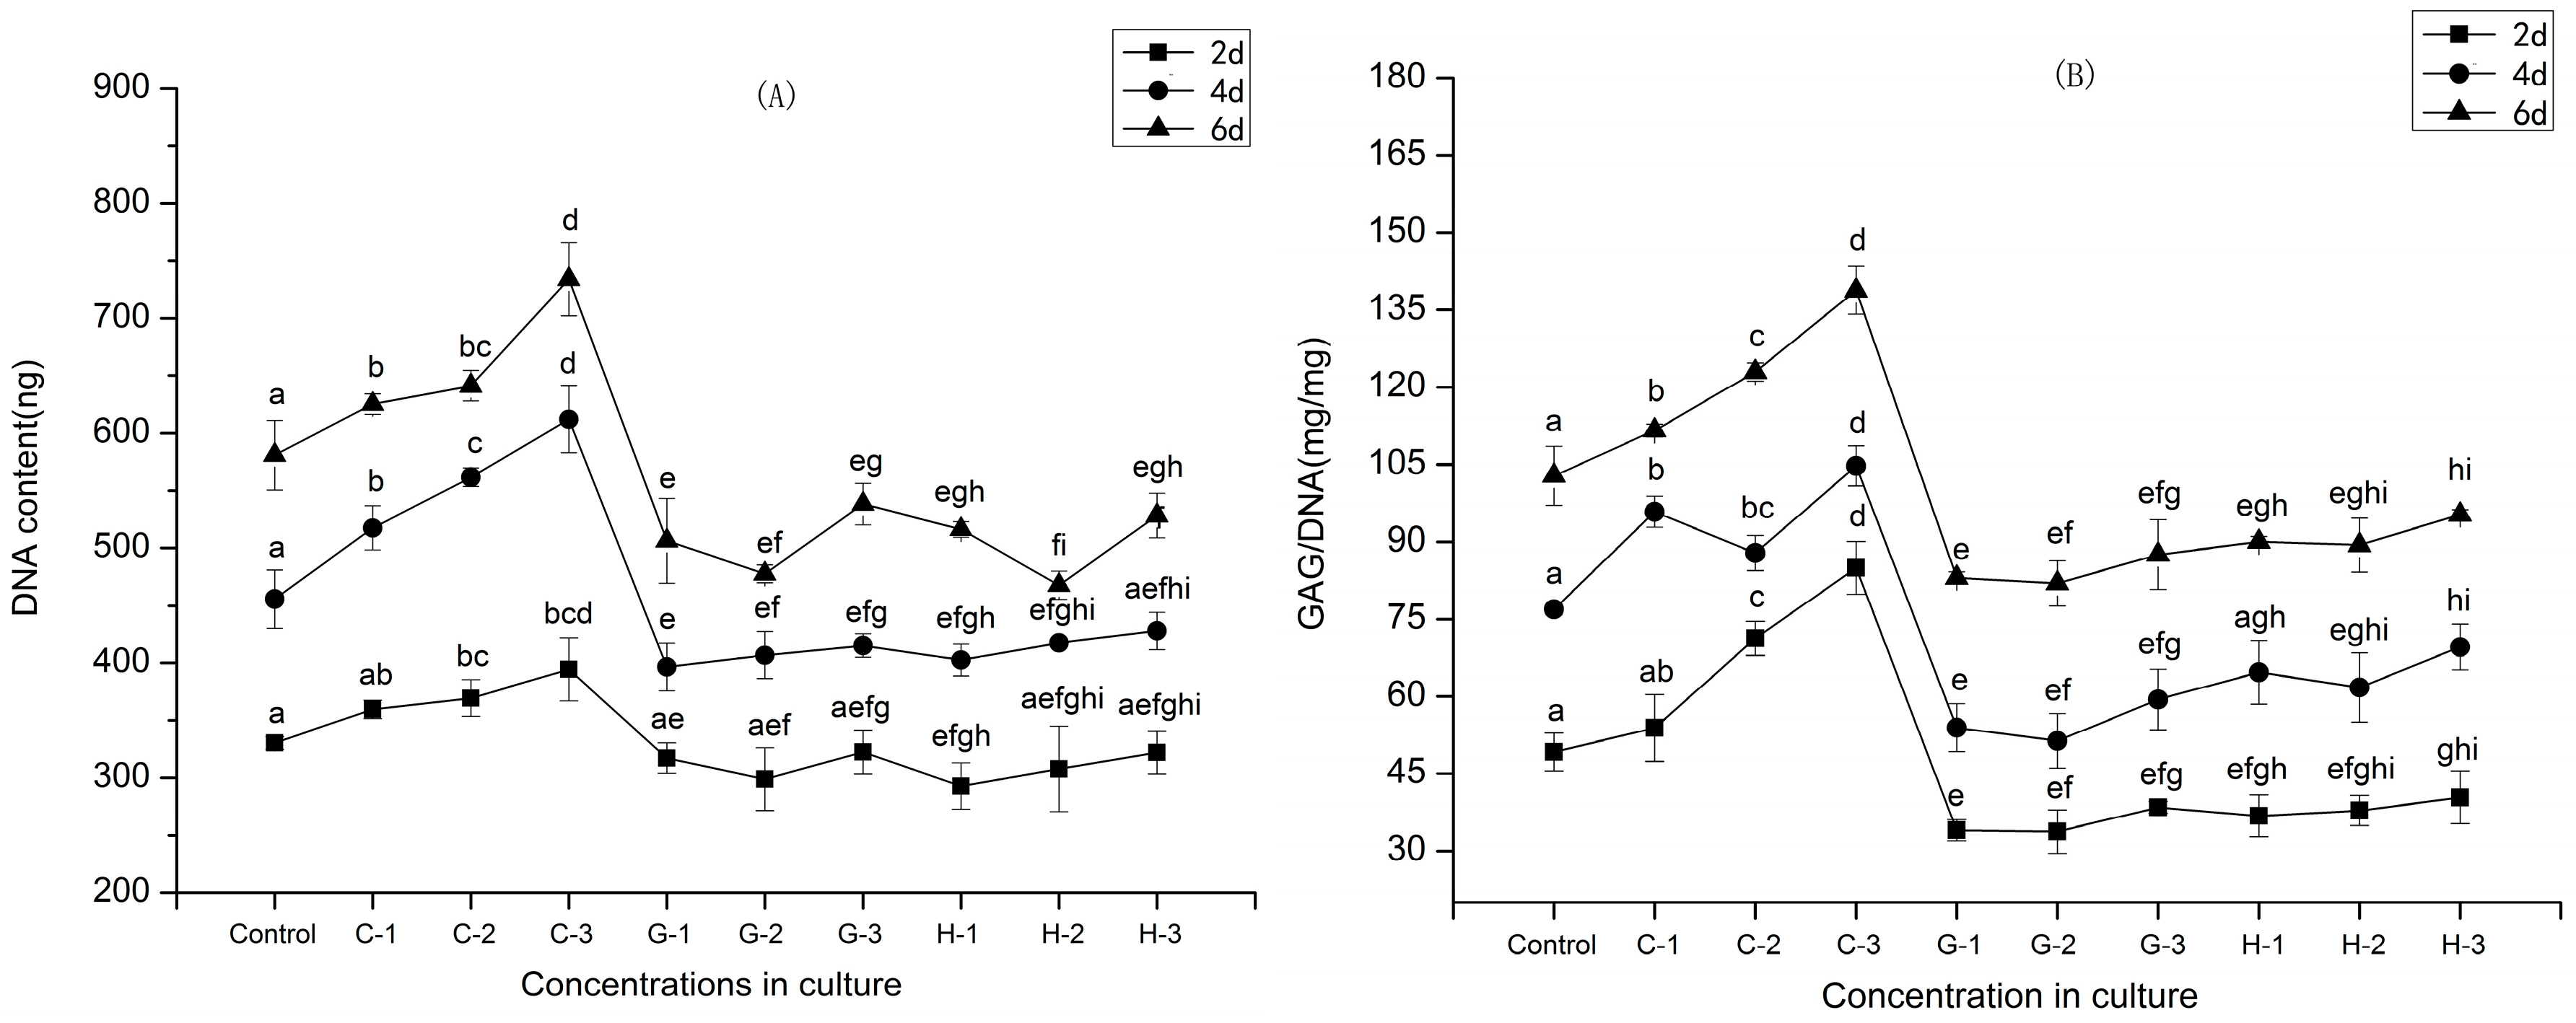
2.4. Cell Proliferation
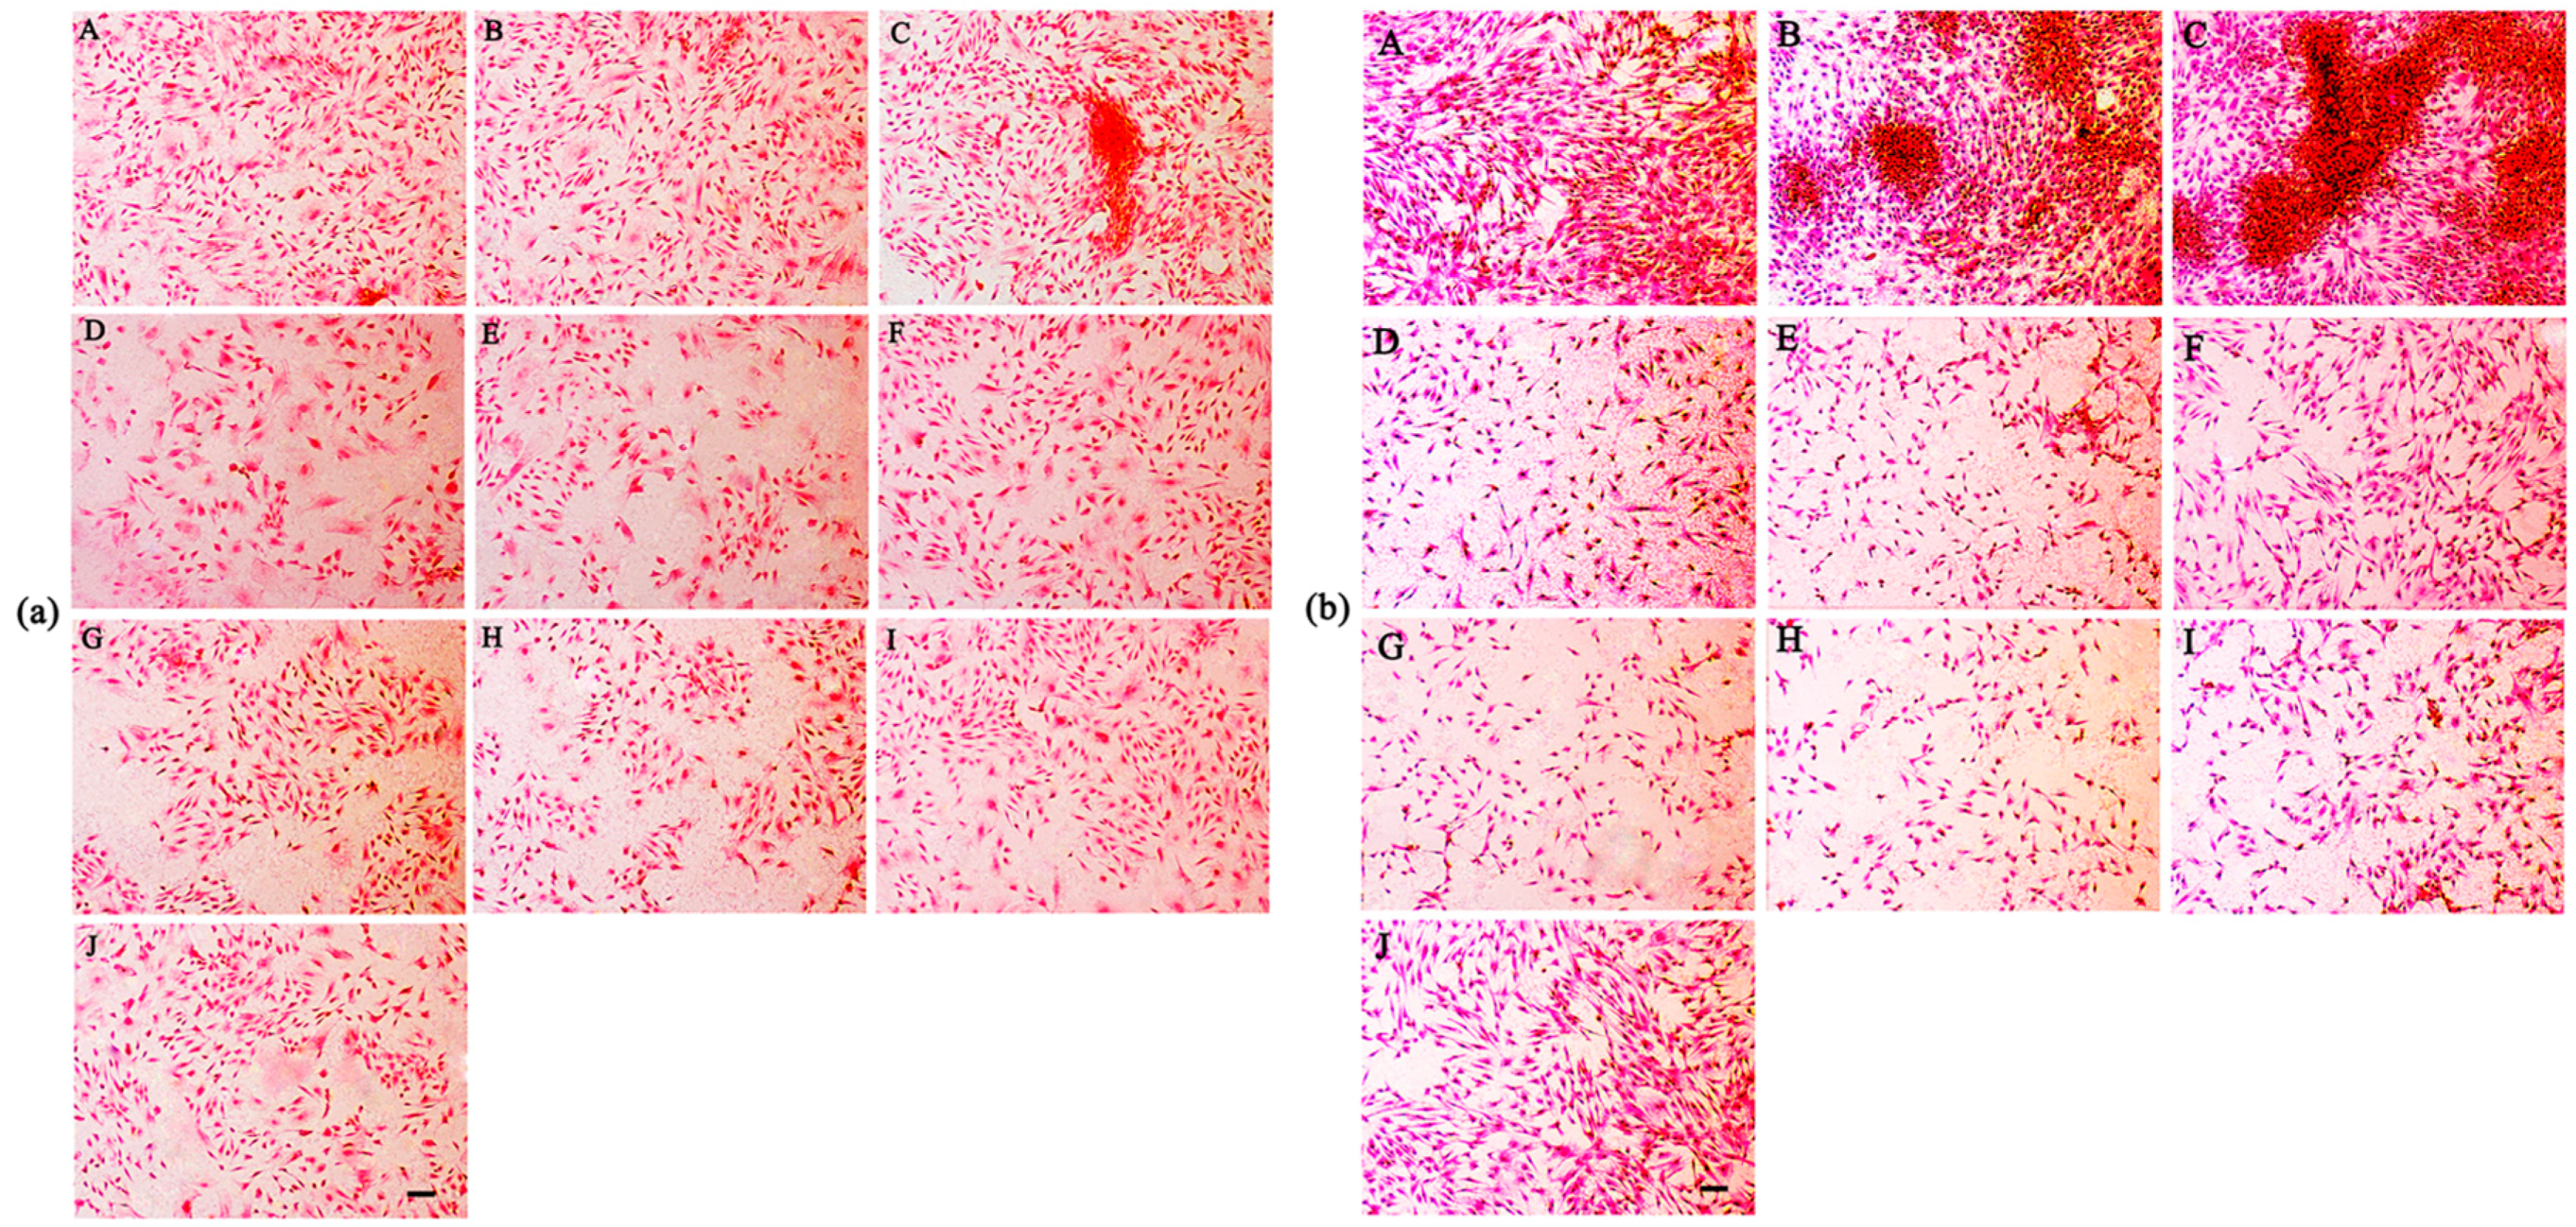
2.5. Secretion of GAGs
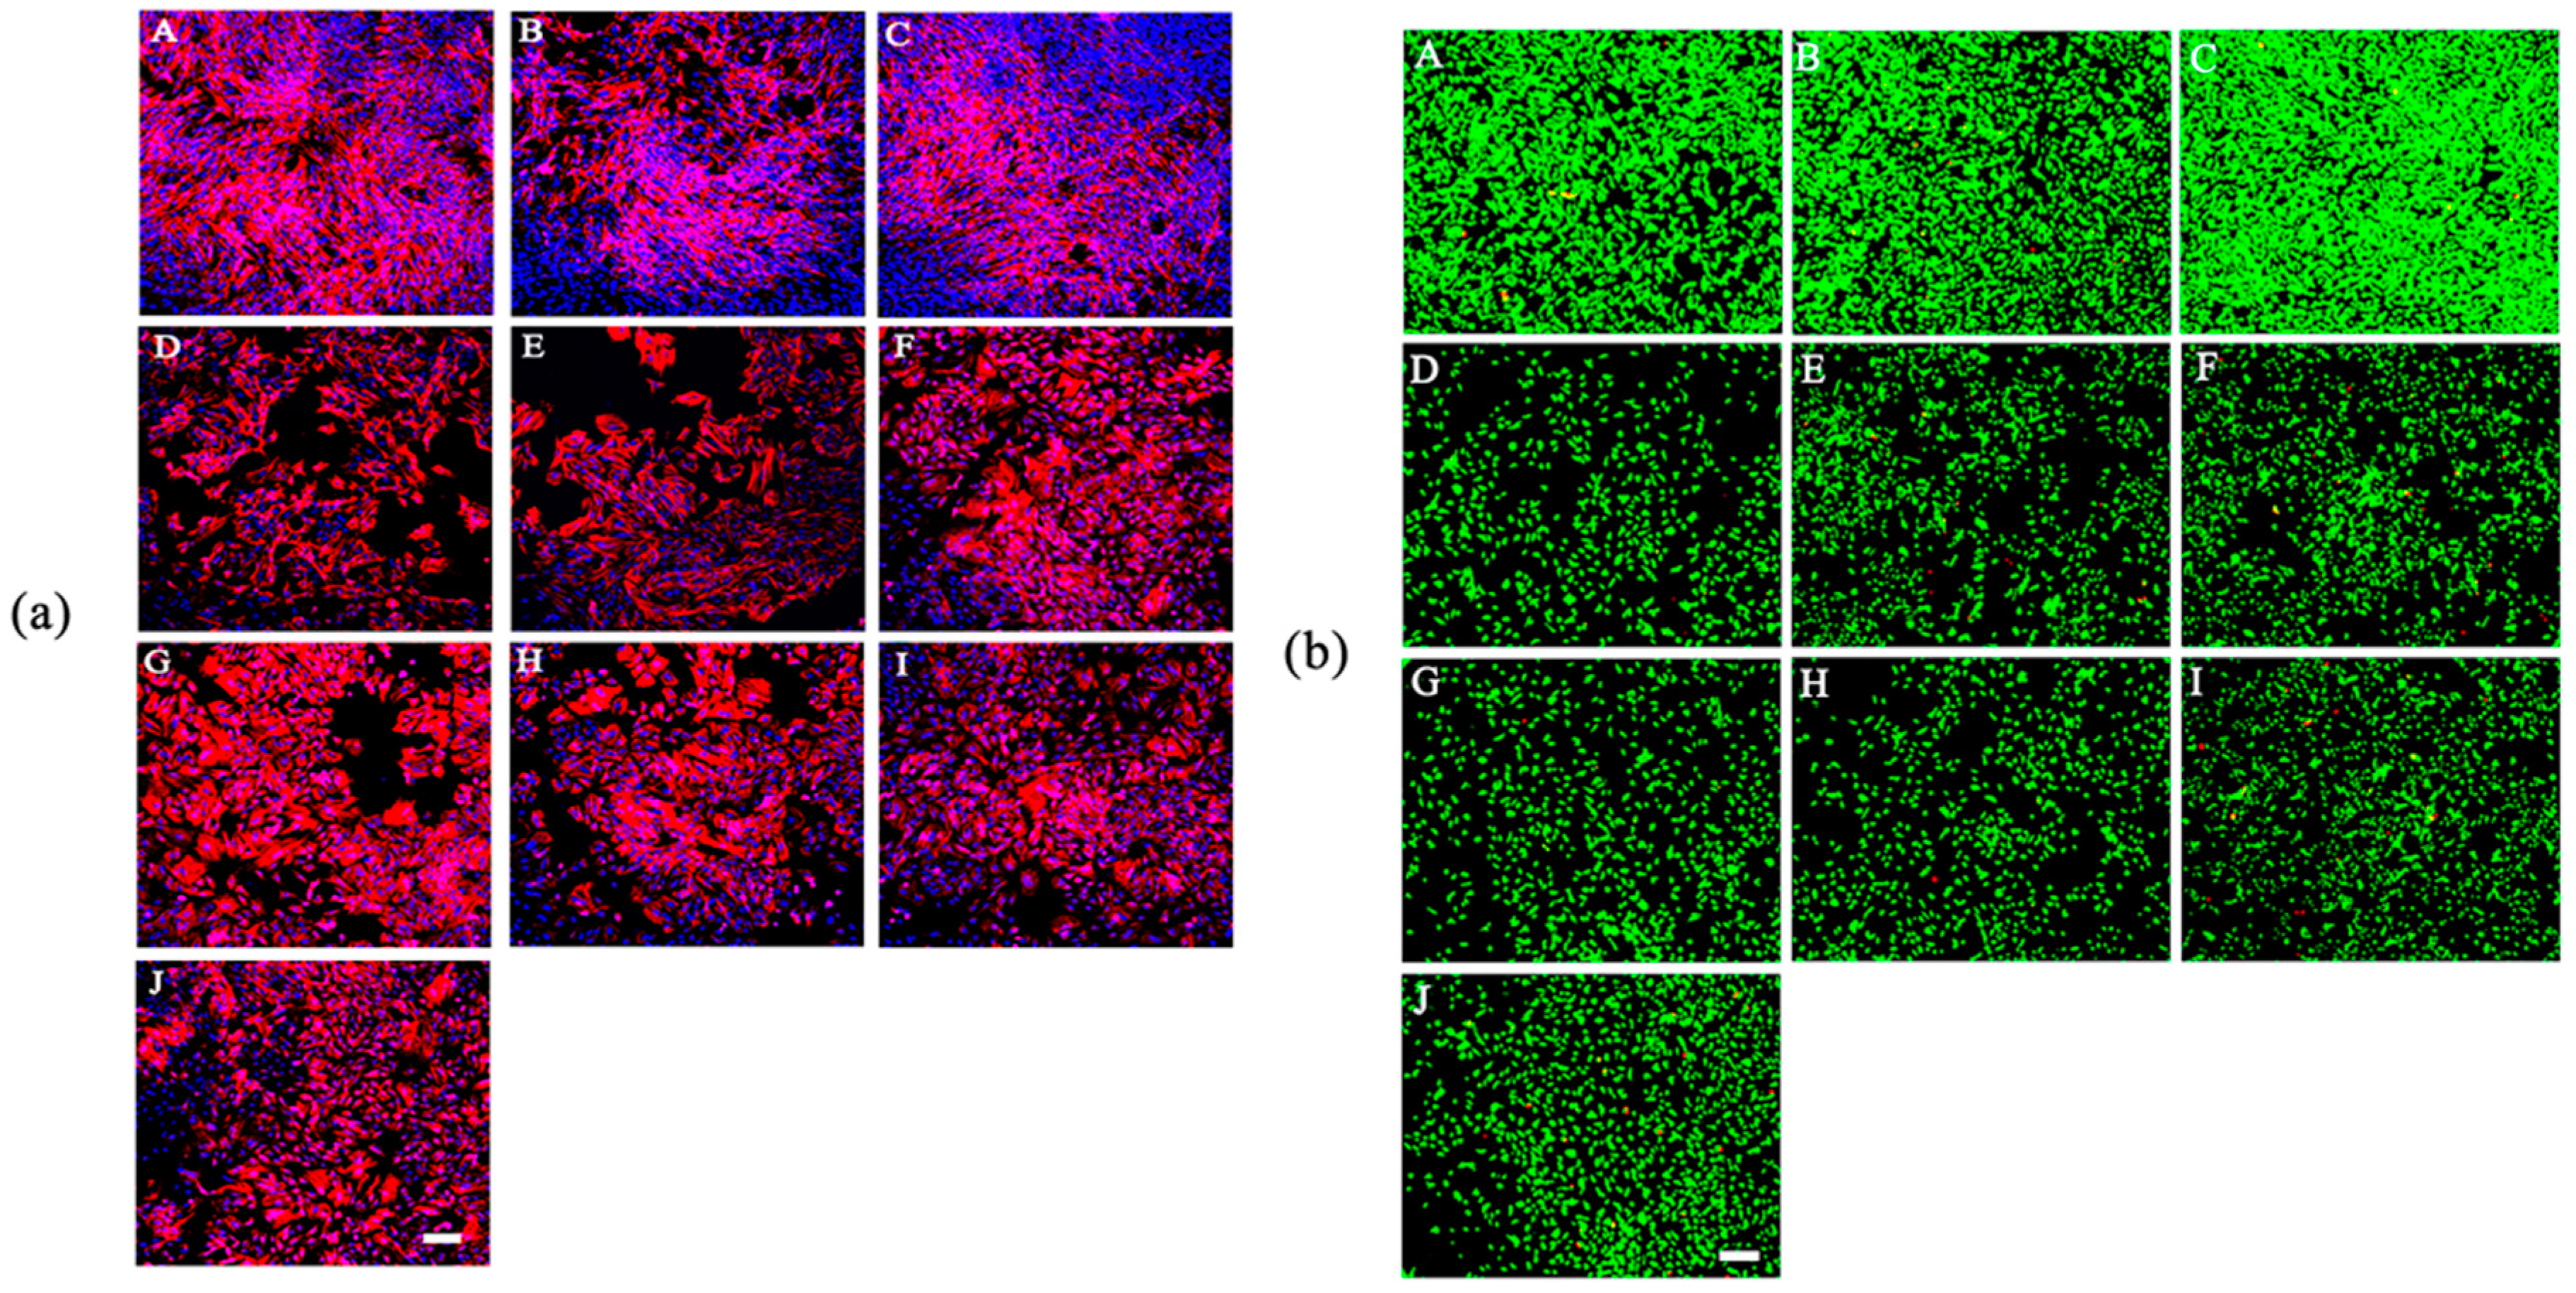
2.6. Cell Morphology
2.7. Cell Viability Assay
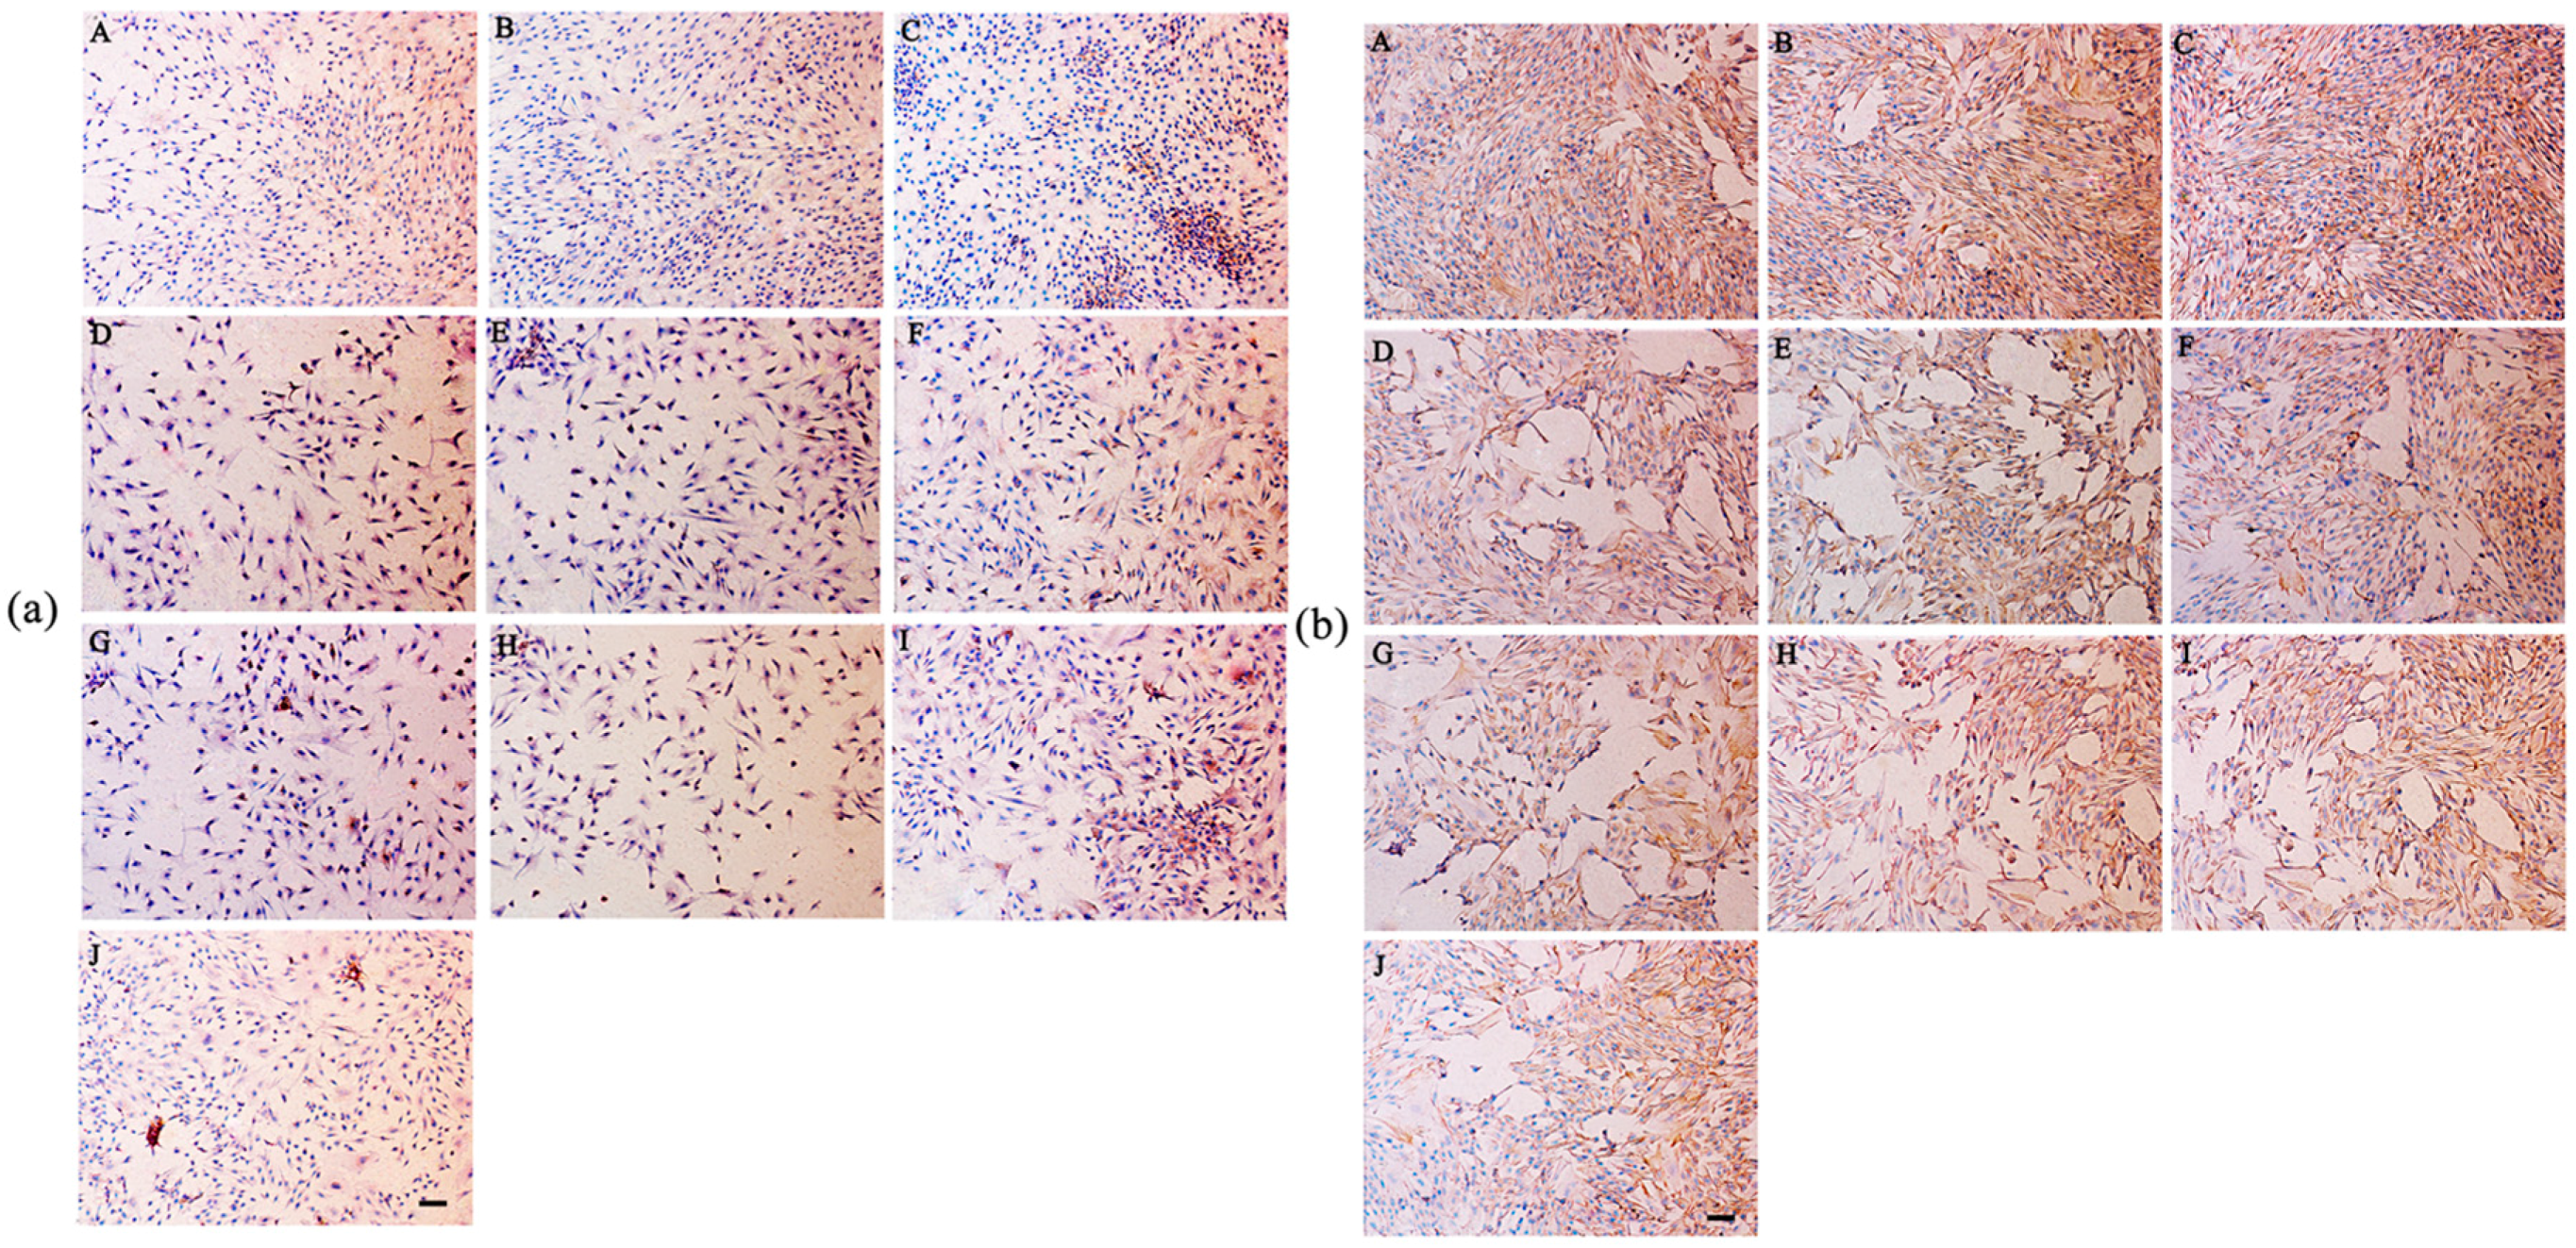
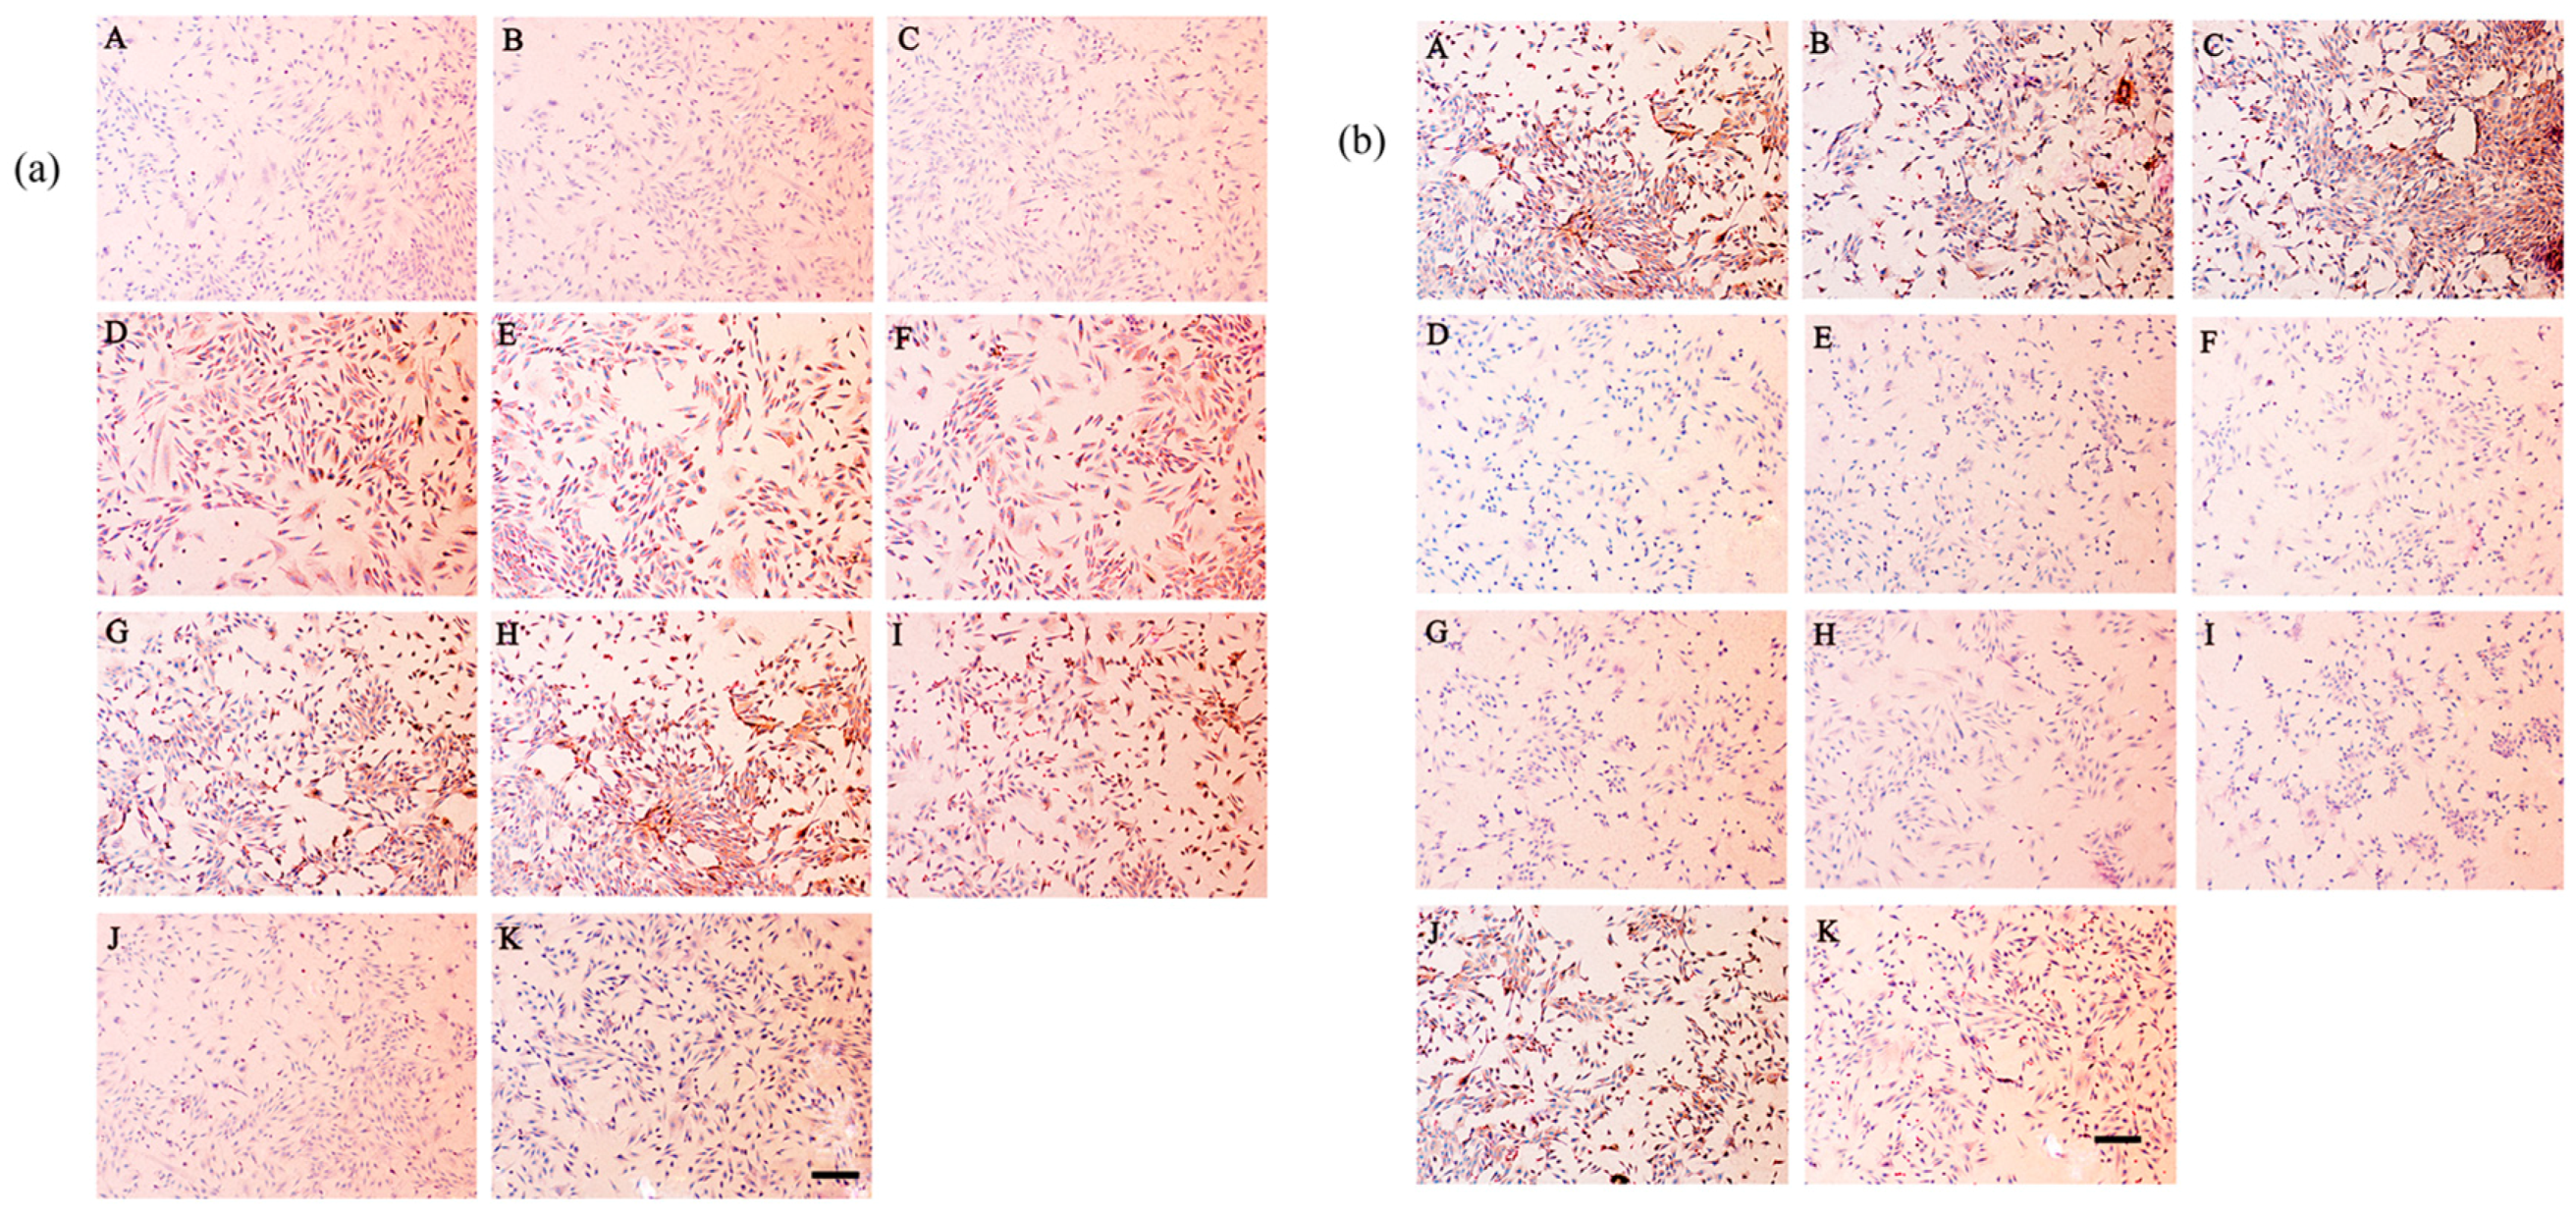
2.8. Secretion of Type I and Type II Collagen
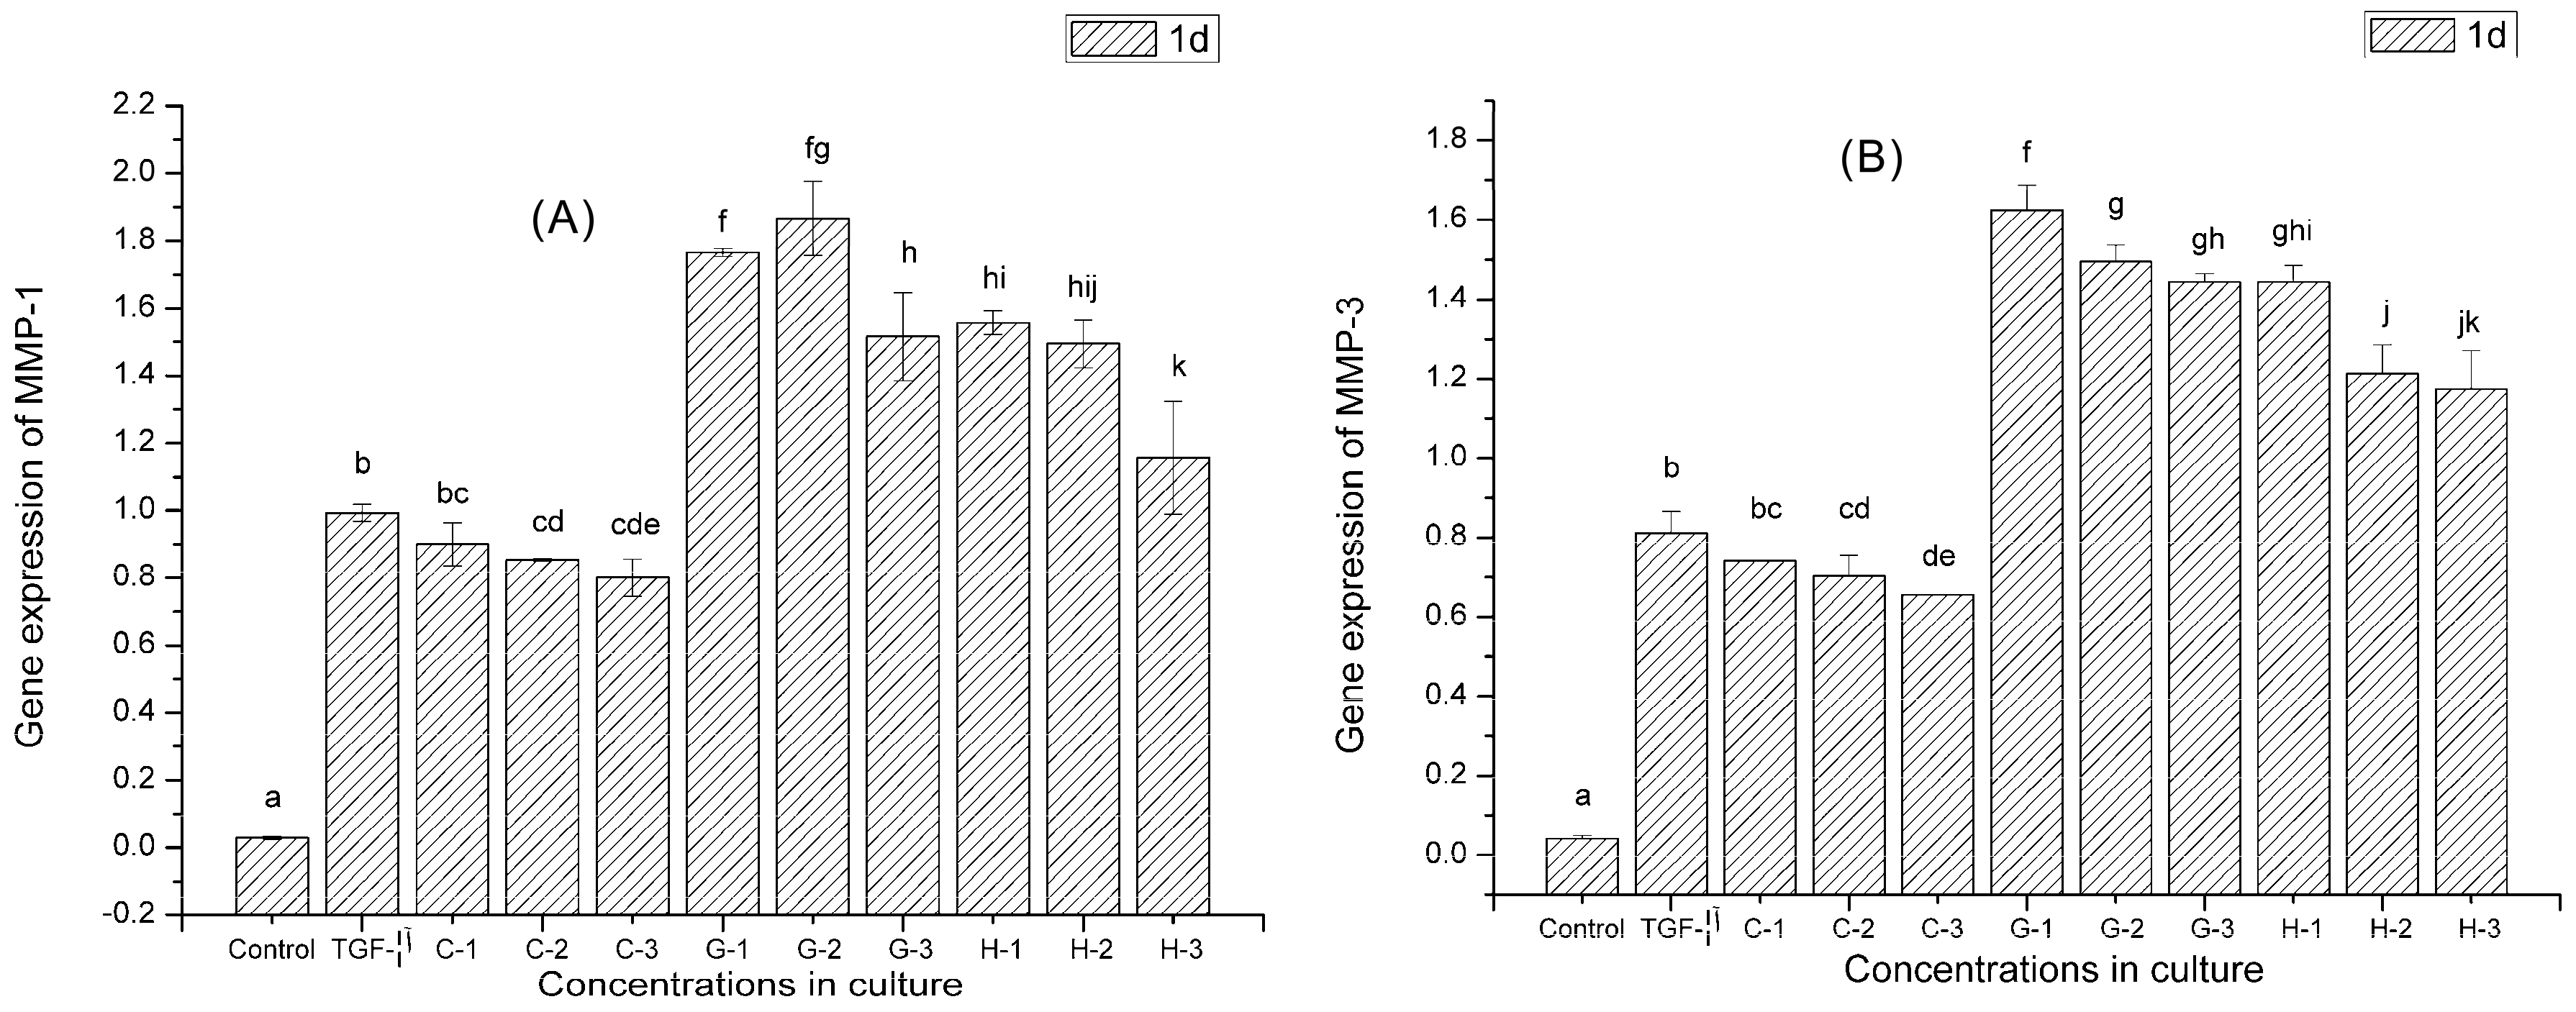
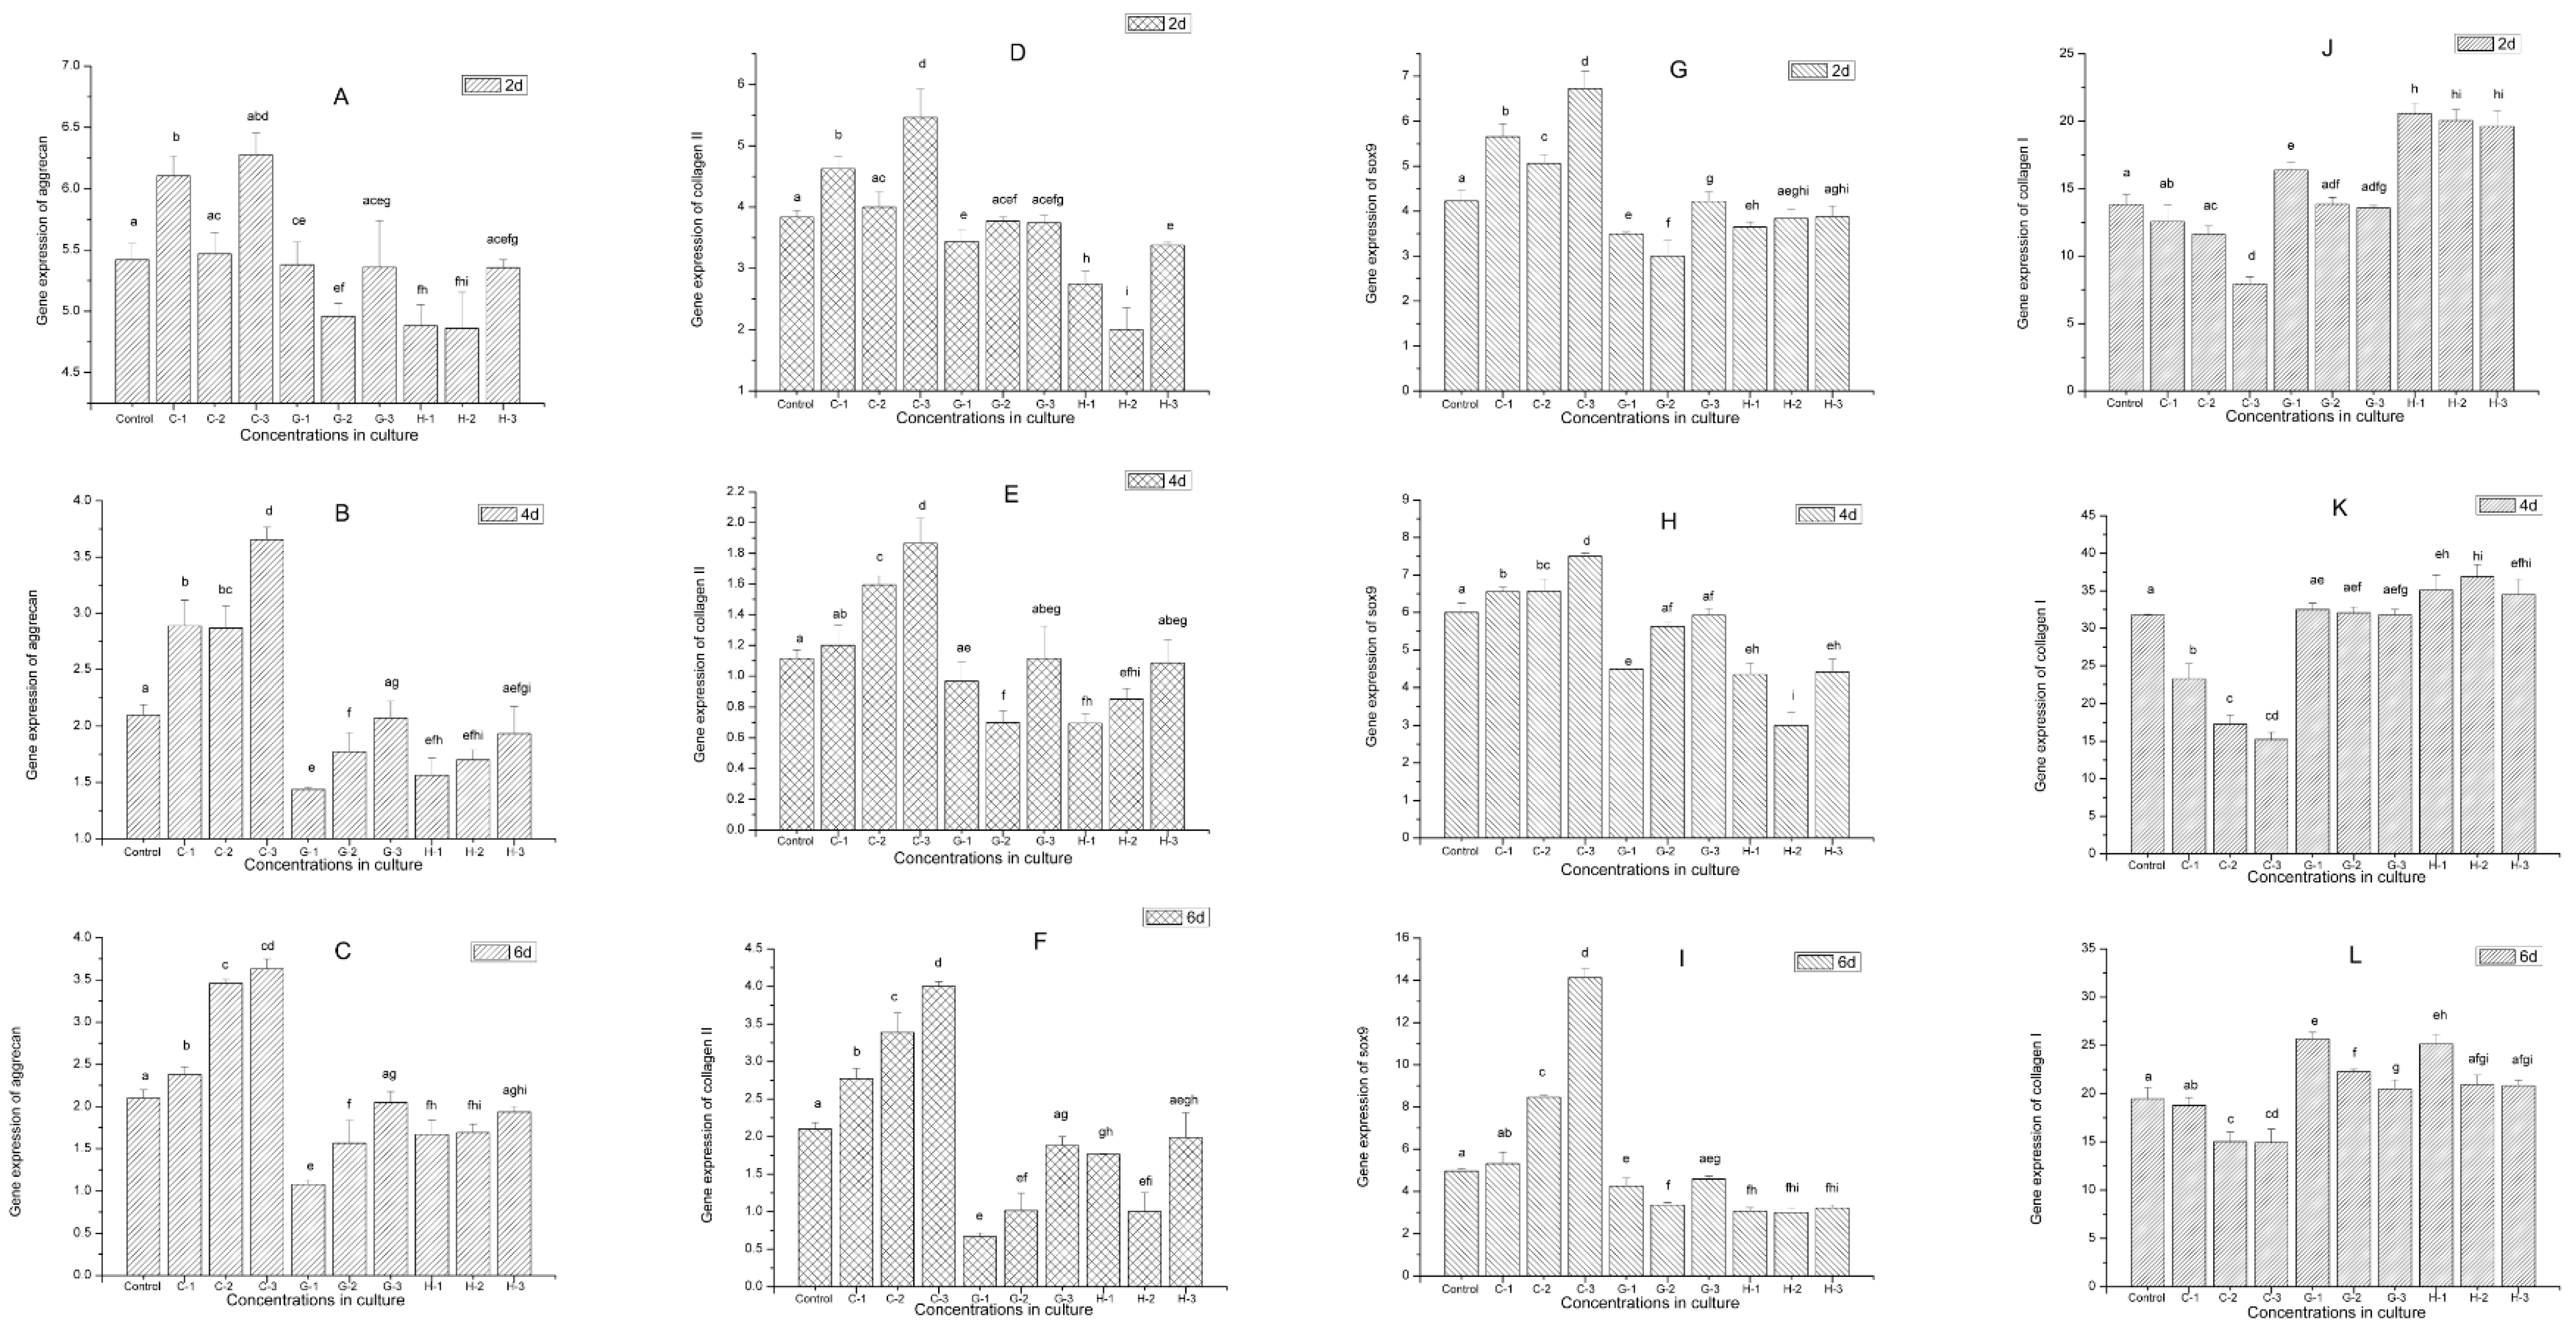
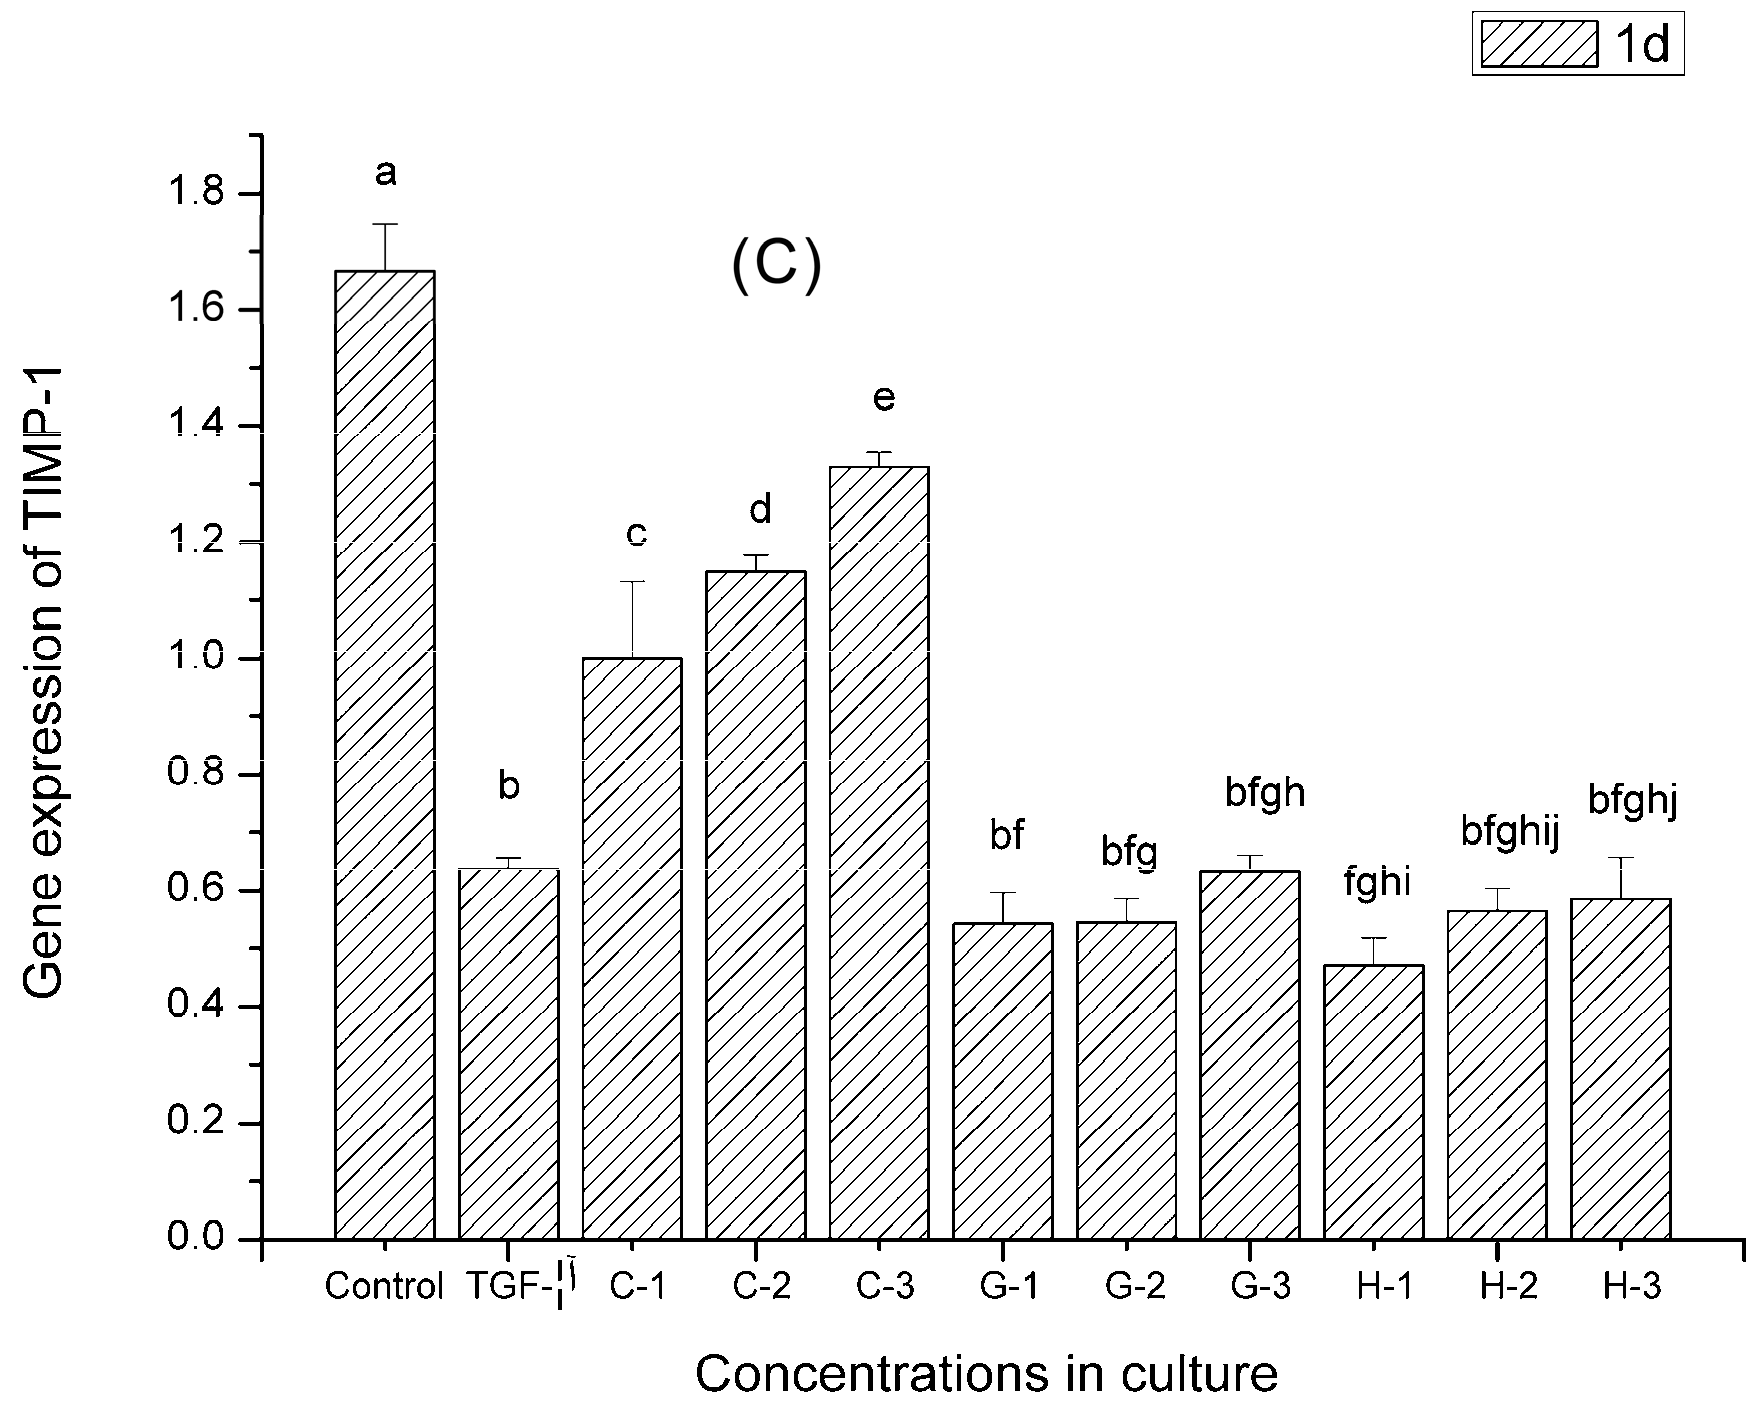
2.9. Gene Expression
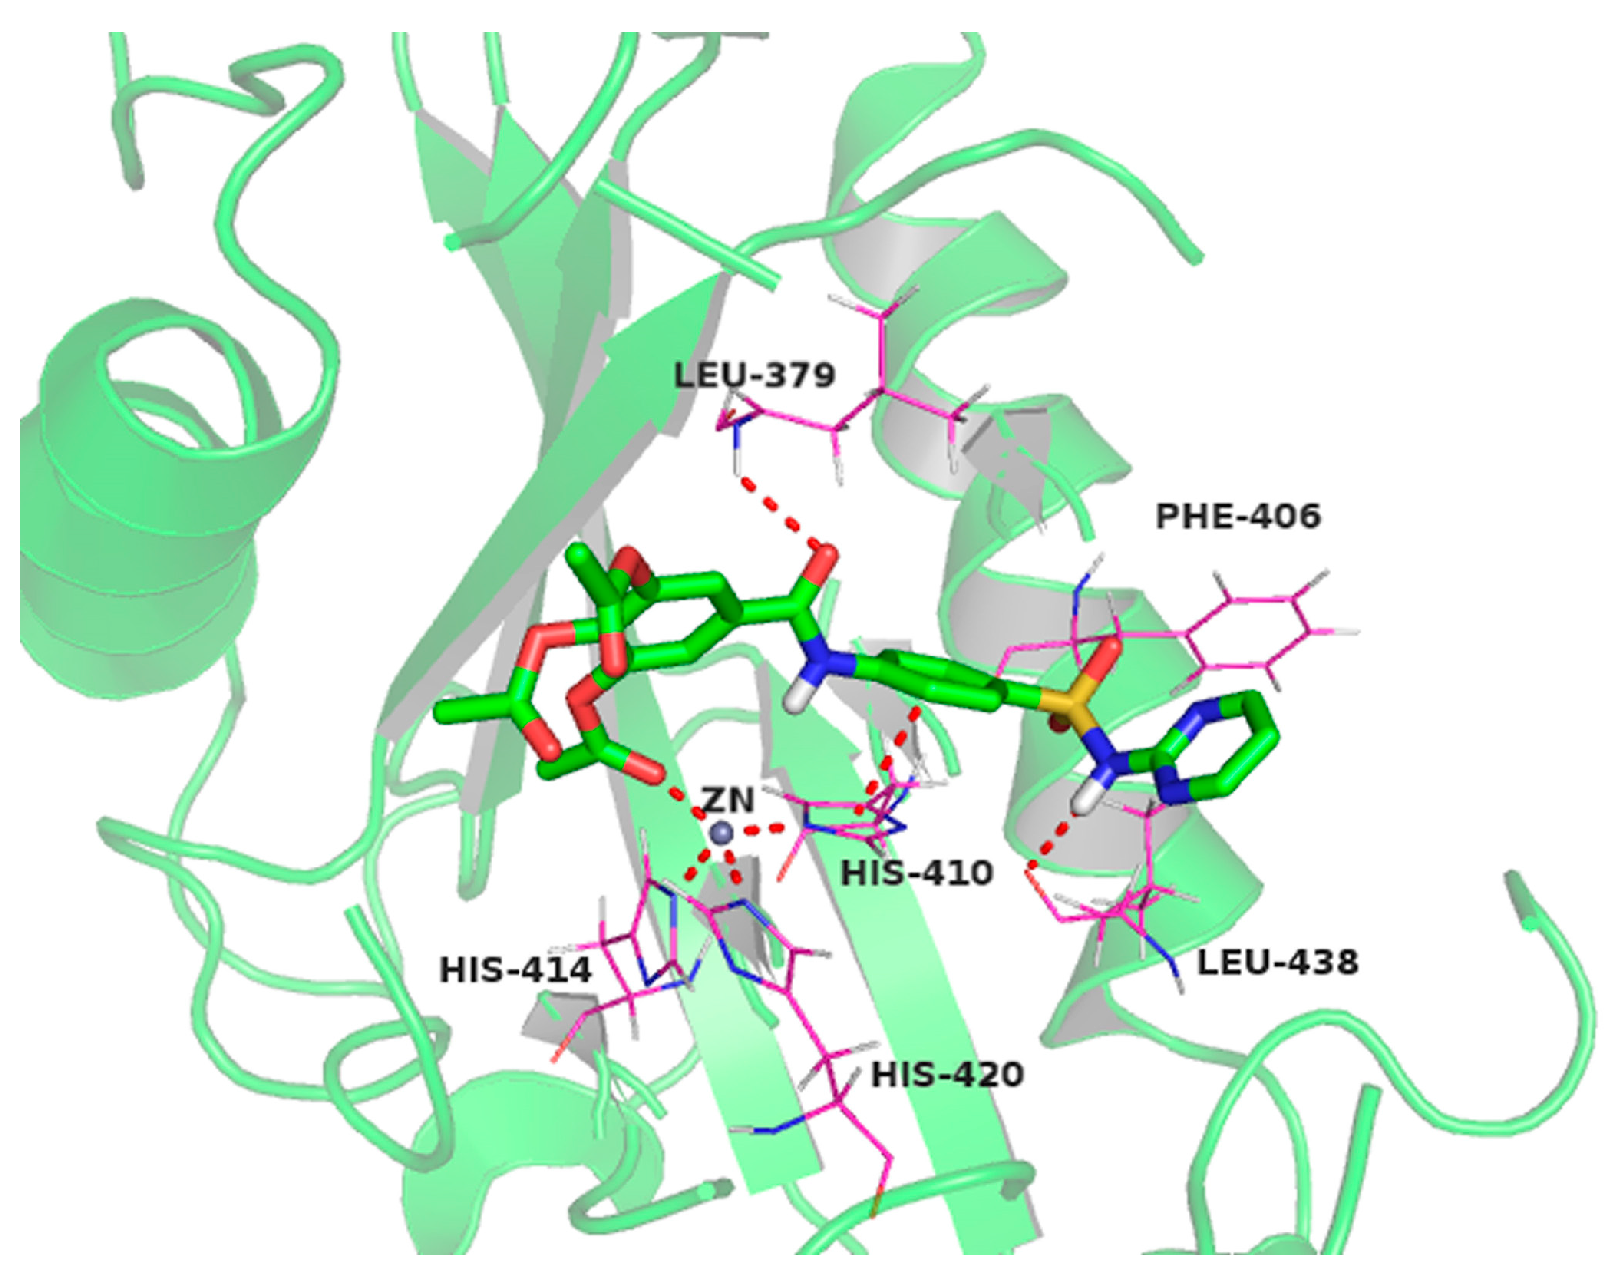
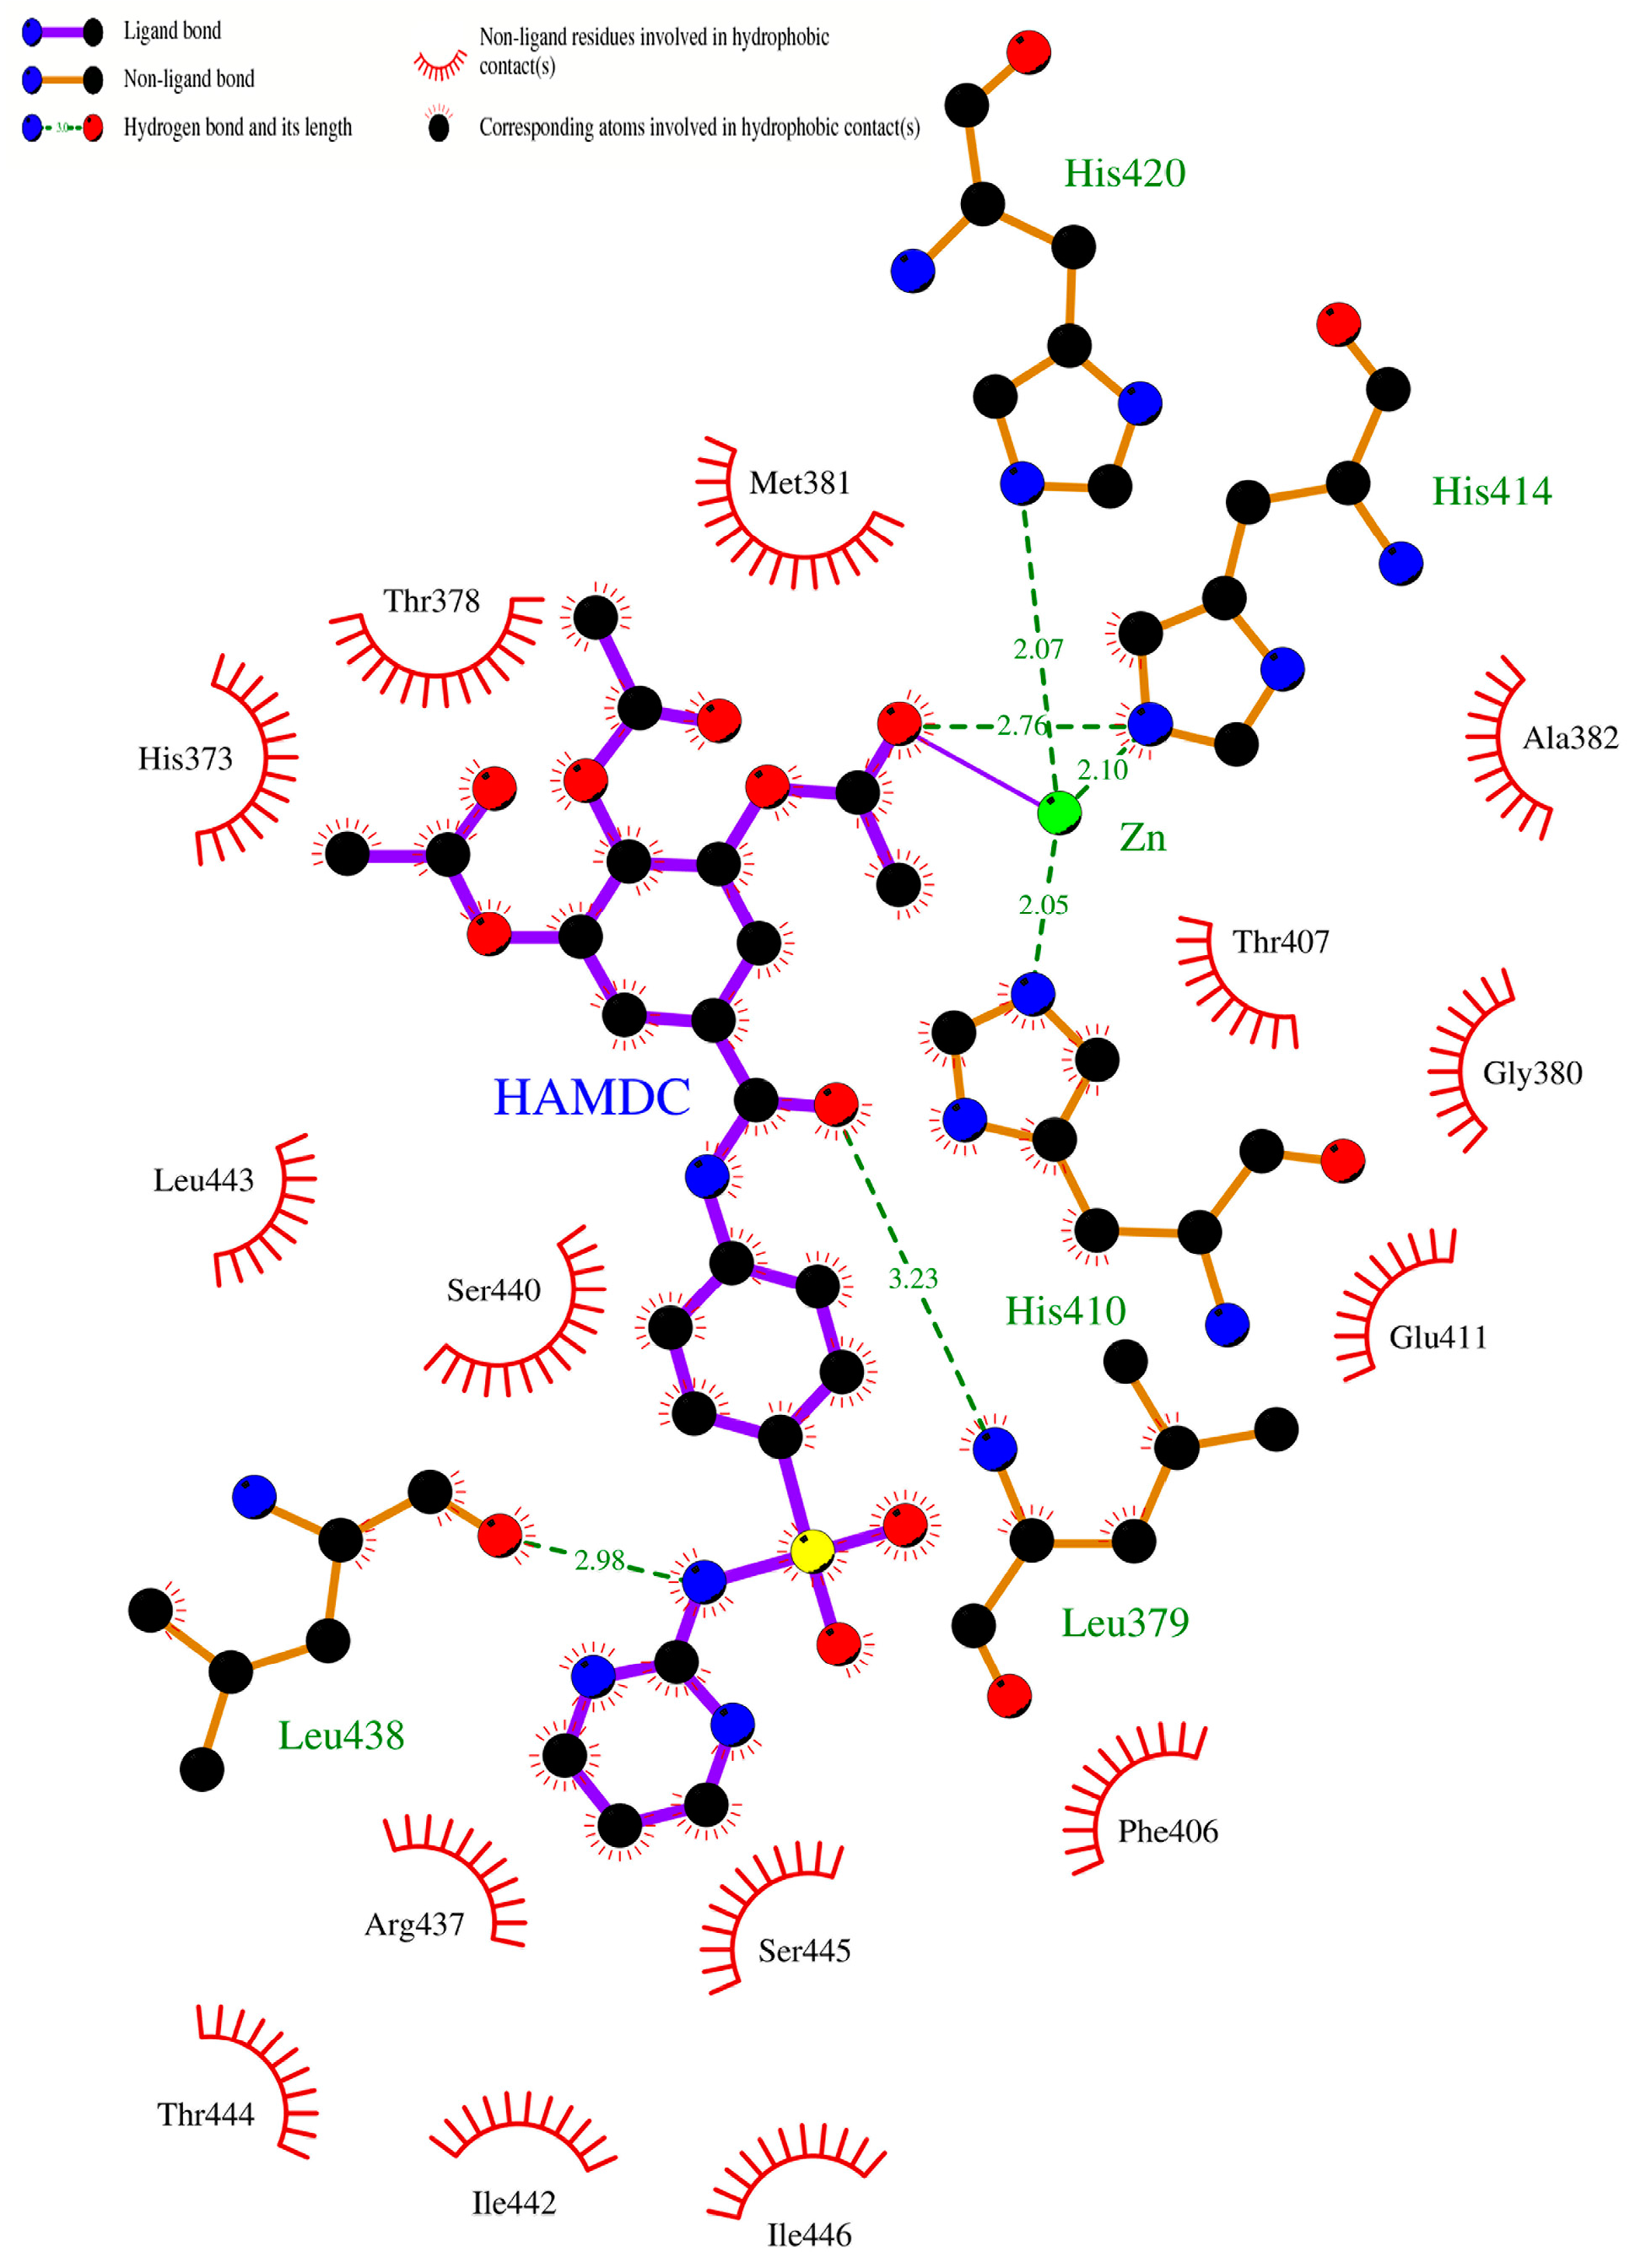
2.10. Molecular Docking Studies of Sulfonamido-Based Gallates
3. Discussion
4. Materials and Methods
4.1. Synthesis and Preparation of HAMDC
4.2. Articular Chondrocyte Culture
4.3. Cytotoxicity Assay
4.4. Effect of HAMDC on IL-1 Stimulated Chondrocytes
4.5. Cell Proliferation Analysis and Biochemical Assay
4.6. Safranin O Staining
4.7. Morphological Examination
4.8. Cell Viability Assay
4.9. Immunohistochemical Staining
4.10. RNA Extraction, Real-Time Fluorescence Quantitative Reverse Transcription–Polymerase Chain Reaction (qRT-PCR)
4.11. Docking Setup
5. Conclusions
Supplementary Materials
Acknowledgments
Author Contributions
Conflicts of Interest
References
- Goldring, M.B.; Goldring, S.R. Osteoarthritis. J. Cell. Physiol. 2007, 213, 626–634. [Google Scholar] [CrossRef] [PubMed]
- Aigner, T.; Sachse, A.; Gebhard, P.M.; Roach, H.I. Osteoarthritis: Pathobiology-targets and ways for therapeutic intervention. Adv. Drug Deliv. Rev. 2006, 58, 128–149. [Google Scholar] [CrossRef] [PubMed]
- Fajardo, M.; di Cesare, P.E. Disease-modifying therapies for osteoarthritis: Current status. Drugs Aging 2005, 22, 141–161. [Google Scholar] [CrossRef] [PubMed]
- Goldring, S.R.; Goldring, M.B. The role of cytokines in cartilage matrix degeneration in osteoarthritis. Clin. Orthop. Relat. Res. 2004, S27–S36. [Google Scholar] [CrossRef]
- Aida, Y.; Maeno, M.; Suzuki, N.; Namba, A.; Motohashi, M.; Matsumoto, M.; Makimura, M.; Matsumura, H. The effect of IL-1beta on the expression of inflammatory cytokines and their receptors in human chondrocytes. Life Sci. 2006, 79, 764–771. [Google Scholar] [CrossRef] [PubMed]
- Okada, Y.; Shinmei, M.; Tanaka, O.; Naka, K.; Kimura, A.; Nakanishi, I.; Bayliss, M.T.; Iwata, K.; Nagase, H. Localization of matrix metalloproteinase 3 (stromelysin) in osteoarthritic cartilage and synovium. Lab. Investig. 1992, 66, 680–690. [Google Scholar] [PubMed]
- Hembry, R.M.; Bagga, M.R.; Reynolds, J.J.; Hamblen, D.L. Immunolocalisation studies on six matrix metalloproteinases and their inhibitors, TIMP-1 and TIMP-2, in synovia from patients with osteo- and rheumatoid arthritis. Ann. Rheum. Dis. 1995, 54, 25–32. [Google Scholar] [CrossRef] [PubMed]
- Nuti, E.; Santamaria, S.; Casalini, F.; Yamamoto, K.; Marinelli, L.; la Pietra, V.; Novellino, E.; Orlandini, E.; Nencetti, S.; Marini, A.M.; et al. Arylsulfonamide inhibitors of aggrecanases as potential therapeutic agents for osteoarthritis: Synthesis and biological evaluation. Eur. J. Med. Chem. 2013, 62, 379–394. [Google Scholar] [CrossRef] [PubMed]
- Noe, M.C.; Natarajan, V.; Snow, S.L.; Mitchell, P.G.; Lopresti-Morrow, L.; Reeves, L.M.; Yocum, S.A.; Carty, T.J.; Barberia, J.A.; Sweeney, F.J.; et al. Discovery of 3,3-dimethyl-5-hydroxypipecolic hydroxamate-based inhibitors of aggrecanase and mmp-13. Bioorg. Med. Chem. Lett. 2005, 15, 2808–2811. [Google Scholar] [CrossRef] [PubMed]
- Noe, M.C.; Natarajan, V.; Snow, S.L.; Wolf-Gouveia, L.A.; Mitchell, P.G.; Lopresti-Morrow, L.; Reeves, L.M.; Yocum, S.A.; Otterness, I.; Bliven, M.A.; et al. Discovery of 3-OH-3-methylpipecolic hydroxamates: Potent orally active inhibitors of aggrecanase and MMP-13. Bioorg. Med. Chem. Lett. 2005, 15, 3385–3388. [Google Scholar] [CrossRef] [PubMed]
- Gil, D.M.A.; Falé, P.L.V.; Serralheiro, M.L.M.; Rebelo, M.J.F. Herbal infusions bioelectrochemical polyphenolic index: Green tea—The gallic acid interference. Food Chem. 2011, 129, 1537–1543. [Google Scholar] [CrossRef]
- Liu, Y.; Pukala, T.L.; Musgrave, I.F.; Williams, D.M.; Dehle, F.C.; Carver, J.A. Gallic acid is the major component of grape seed extract that inhibits amyloid fibril formation. Bioorg. Med. Chem. Lett. 2013, 23, 6336–6340. [Google Scholar] [CrossRef] [PubMed]
- Jean-Gilles, D.; Li, L.; Ma, H.; Yuan, T.; Chichester, C.O.; Seeram, N.P. Anti-inflammatory effects of polyphenolic-enriched red raspberry extract in an antigen-induced arthritis rat model. J. Agric. Food Chem. 2012, 60, 5755–5762. [Google Scholar] [CrossRef] [PubMed]
- Bhadoriya, U.; Sharma, P.; Solanki, S.S. In vitro free radical scavenging activity of gallic acid isolated from caesalpinia decapetala wood. Asian Pac. J. Trop. Dis. 2012, 2, S833–S836. [Google Scholar] [CrossRef]
- Soong, Y.-Y.; Barlow, P.J. Quantification of gallic acid and ellagic acid from longan (Dimocarpus longan lour.) seed and mango (Mangifera indica L.) kernel and their effects on antioxidant activity. Food Chem. 2006, 97, 524–530. [Google Scholar] [CrossRef]
- Hsiang, C.-Y.; Hseu, Y.-C.; Chang, Y.-C.; Kumar, K.J.S.; Ho, T.-Y.; Yang, H.-L. Toona sinensis and its major bioactive compound gallic acid inhibit lps-induced inflammation in nuclear factor-κb transgenic mice as evaluated by in vivo bioluminescence imaging. Food Chem. 2013, 136, 426–434. [Google Scholar] [CrossRef] [PubMed]
- Chandramohan Reddy, T.; Bharat Reddy, D.; Aparna, A.; Arunasree, K.M.; Gupta, G.; Achari, C.; Reddy, G.V.; Lakshmipathi, V.; Subramanyam, A.; Reddanna, P. Anti-leukemic effects of gallic acid on human leukemia k562 cells: Downregulation of COX-2, inhibition of BCR/ABL kinase and NF-κB inactivation. Toxicol. Vitro 2012, 26, 396–405. [Google Scholar] [CrossRef] [PubMed]
- Ho, H.-H.; Chang, C.-S.; Ho, W.-C.; Liao, S.-Y.; Wu, C.-H.; Wang, C.-J. Anti-metastasis effects of gallic acid on gastric cancer cells involves inhibition of NF-κb activity and downregulation of PI3K/AKT/small gtpase signals. Food Chem. Toxicol. 2010, 48, 2508–2516. [Google Scholar] [CrossRef] [PubMed]
- Pal, C.; Bindu, S.; Dey, S.; Alam, A.; Goyal, M.; Iqbal, M.S.; Maity, P.; Adhikari, S.S.; Bandyopadhyay, U. Gallic acid prevents nonsteroidal anti-inflammatory drug-induced gastropathy in rat by blocking oxidative stress and apoptosis. Free Radic. Biol. Med. 2010, 49, 258–267. [Google Scholar] [CrossRef] [PubMed]
- Yoon, C.-H.; Chung, S.-J.; Lee, S.-W.; Park, Y.-B.; Lee, S.-K.; Park, M.-C. Gallic acid, a natural polyphenolic acid, induces apoptosis and inhibits proinflammatory gene expressions in rheumatoid arthritis fibroblast-like synoviocytes. Jt. Bone Spine 2013, 80, 274–279. [Google Scholar] [CrossRef] [PubMed]
- Shukla, M.; Gupta, K.; Rasheed, Z.; Khan, K.A.; Haqqi, T.M. Consumption of hydrolyzable tannins-rich pomegranate extract suppresses inflammation and joint damage in rheumatoid arthritis. Nutrition 2008, 24, 733–743. [Google Scholar] [CrossRef] [PubMed]
- Na, C.S.Y.; Sun, Y.; Kim, J.B.; Noh, H.J.; Eom, N.; Lee, J.M.; Nam, D.E.; Kim, O.K. Gyeong Rhus Verniciflua Stokes Extracts for Preventing and Treating Degenerative Arthritis. KR Patent 2013083570, 23 July 2013. [Google Scholar]
- Baran, W.; Adamek, E.; Ziemiańska, J.; Sobczak, A. Effects of the presence of sulfonamides in the environment and their influence on human health. J. Hazard. Mater. 2011, 196, 1–15. [Google Scholar] [CrossRef] [PubMed]
- Marc, N.; Nis, H.; Friedemann, S.; Tilo, W.; Uwe, D. Armin Hofmeister N-[4-(1H-pyrazolo [3,4-b]pyrazin-6-yl)-phenyl]-sulfonamides and Their Use as Pharmaceuticals. WO Patent 2013041119, 28 March 2013. [Google Scholar]
- Taylor, S.; Hallett, D.J.; Townsend, R.J. Sulfonamide Compounds, Pharmaceutical Compositions and Uses Thereof. WO Patent 2010130638, 18 November 2010. [Google Scholar]
- Wei, S.; Lu, Z.; Zou, Y.; Lin, X.; Lin, C.; Liu, B.; Zheng, L.; Zhao, J. A novel synthesized sulfonamido-based gallate-jez-c as potential therapeutic agents for osteoarthritis. PLoS ONE 2015, 10, e0125930. [Google Scholar] [CrossRef] [PubMed]
- Lin, X.; Zheng, L.; Liu, Q.; Liu, B.; Jiang, B.; Peng, X.; Lin, C. In vitro effect of a synthesized sulfonamido-based gallate on articular chondrocyte metabolism. Bioorg. Med. Chem. Lett. 2014, 24, 2497–2503. [Google Scholar] [CrossRef] [PubMed]
- Liu, Q.; Li, M.-Y.; Lin, X.; Lin, C.-W.; Liu, B.-M.; Zheng, L.; Zhao, J.-M. Effect of a novel synthesized sulfonamido-based gallate-szntc on chondrocytes metabolism in vitro. Chem. Biol. Interact. 2014, 221, 127–138. [Google Scholar] [CrossRef] [PubMed]
- Xu, G.J.; Lu, Z.H.; Lin, X.; Lin, C.W.; Zheng, L.; Zhao, J.M. Effect of JJYMD-C, a novel synthetic derivative of gallic acid, on proliferation and phenotype maintenance in rabbit articular chondrocytes in vitro. Braz. J. Med. Biol. Res. Rev. 2014, 47, 637–645. [Google Scholar] [CrossRef]
- Lu, Z.; Wei, S.; Wu, H.; Lin, X.; Lin, C.; Liu, B.; Zheng, L.; Zhao, J. A novel synthesized sulfonamido-based gallic acid--LDQN-C: Effects on chondrocytes growth and phenotype maintenance. Bioorg. Chem. 2014, 57, 99–107. [Google Scholar] [CrossRef] [PubMed]
- Sample Availability: Samples of the compounds HAMDC are available from the authors.


| mRNA | Forward Primer | Reverse Primer |
|---|---|---|
| GAPDH | 5′-GTCATCATCTCAGCCCCCTC-3′ | 5′-GGATGCGTTGCTGACAATCT-3′ |
| Aggrecan | 5′-TTGCCTTTGTGGACACCAGT-3′ | 5′-GAGCCAAGGACGTAAACCCA-3′ |
| type I collagen | 5′-CCCAGCCACCTCAAGAGAAG-3′ | 5′-CGGGGCTCTTGATGTTCTCA-3′ |
| type II collagen | 5′-TCCGGAAACCAGGACCAAAG-3′ | CTTTGTCACCACGGTCACCT-3′ |
| type X collagen | 5′-CTACGCTGAGCGGTACCAAA-3′ | 5′-GGCTTCCCAGTGGCTGATAG-3′ |
| Sox9 | 5′-GACGCACATCTCGCCCAAC-3′ | 5′-TCTCGCTTCAGGTCAGCCTT-3′ |
© 2016 by the authors. Licensee MDPI, Basel, Switzerland. This article is an open access article distributed under the terms and conditions of the Creative Commons Attribution (CC-BY) license ( http://creativecommons.org/licenses/by/4.0/).
Share and Cite
Lin, X.; Chai, L.; Liu, B.; Chen, H.; Zheng, L.; Liu, Q.; Lin, C. Synthesis, Biological Evaluation, and Docking Studies of a Novel Sulfonamido-Based Gallate as Pro-Chondrogenic Agent for the Treatment of Cartilage. Molecules 2017, 22, 3. https://doi.org/10.3390/molecules22010003
Lin X, Chai L, Liu B, Chen H, Zheng L, Liu Q, Lin C. Synthesis, Biological Evaluation, and Docking Studies of a Novel Sulfonamido-Based Gallate as Pro-Chondrogenic Agent for the Treatment of Cartilage. Molecules. 2017; 22(1):3. https://doi.org/10.3390/molecules22010003
Chicago/Turabian StyleLin, Xiao, Ling Chai, Buming Liu, Hailan Chen, Li Zheng, Qin Liu, and Cuiwu Lin. 2017. "Synthesis, Biological Evaluation, and Docking Studies of a Novel Sulfonamido-Based Gallate as Pro-Chondrogenic Agent for the Treatment of Cartilage" Molecules 22, no. 1: 3. https://doi.org/10.3390/molecules22010003