Article

Intestinal Absorption of Triterpenoids and Flavonoids from Glycyrrhizae radix et rhizoma in the Human Caco-2 Monolayer Cell Model

1
School of Life Science and Technology, Beijing Institute of Technology, No. 5, Zhongguancun South Street, Haidian District, Beijing 100081, China
2
State Key Laboratory of Natural and Biomimetic Drugs, Department of Natural Medicines, School of Pharmaceutical Sciences, Peking University Health Science Center, Peking University, No. 38, Xueyuan Road, Haidian District, Beijing 100191, China
*
Authors to whom correspondence should be addressed.
Molecules 2017, 22(10), 1627; https://doi.org/10.3390/molecules22101627
Submission received: 12 September 2017 / Revised: 23 September 2017 / Accepted: 27 September 2017 / Published: 29 September 2017
(This article belongs to the Collection Herbal Medicine Research)

Abstract

:
Glycyrrhizae radix et rhizoma has been used as a traditional Chinese medicine for the treatment of various diseases. Triterpenoids and flavonoids from the plant have many beneficial effects and their chemical structures are modified in the gastrointestinal tract after oral administration. However, absorption of these triterpenoids and flavonoids still needs to be defined. Here, the uptake and transepithelial transport of the selected major triterpenoids, glycyrrhizin (1), glycyrrhetic acid-3-O-mono-β-d-glucuronide (2), and glycyrrhetinic acid (3); and the selected major flavonoids, licochalcone A (4), licochalcone B (5), licochalcone C (6), echinatin (7), isoliquiritin apioside (8), liquiritigenin (9), liquiritin apioside (10) isolated from Glycyrrhizae radix et rhizoma, were investigated in the human intestinal epithelium-like Caco-2 cell monolayer model. Compounds 3, 57, and 9 were designated as well-absorbed compounds, 2 and 4 were designated as moderately absorbed ones, and 1, 8, and 10 were assigned for the poorly absorbed ones. The absorption mechanism of well and moderately absorbed compound was mainly passive diffusion to pass through the human intestinal Caco-2 cell monolayer. These findings provided useful information for predicting their oral bioavailability and the clinical application.

1. Introduction

The genus Glycyrrhiza consists of about 30 species with a nearly global distribution, of which about 18 species are found in China. Among them, only three species—named Glycyrrhiza uralensis Fisch., Glycyrrhiza inflata Bat., and Glycyrrhiza glabra L.—have been used as traditional Chinese medicines for the treatment of hepatitis, spasmodic cough, gastric ulcer, etc. [1]. Phytochemical studies showed that over 300 diverse compounds have been identified from the genus Glycyrrhiza [2,3,4,5]. Among them, triterpenoids and flavonoids were the two major active substances, exerting a variety of pharmacological activities including antiviral [6,7,8], anti-inflammatory [9,10,11,12], antioxidative [13,14], hepatoprotective [15,16], antimicrobial [17,18,19,20,21,22], antitumor [23,24,25], antiallergic [26,27,28], and potent cytochrome P450 enzyme inhibitory [29] properties. To what extent these components are effective in the human body depends on their bioavailability and metabolism in vivo. As is well-known, intestinal permeability is a crucial factor which influences the bioavailability of drugs, especially for those oral ones. Therefore, rationalizing intestinal permeability of these components is a critical step towards understanding their potential bioactivity. The focus of this study was to investigate the transport and cellular uptake of three major triterpenoids; glycyrrhizin (1), glycyrrhetic acid-3-O-mono-β-d-glucuronide (2) and glycyrrhetinic acid (3), and seven flavonoids; licochalcone A (4), licochalcone B (5), licochalcone C (6), echinatin (7), isoliquiritin apioside (8), liquiritigenin (9), and liquiritin apioside (10), whose chemical structures are shown in Figure 1, isolated from Glycyrrhizae radix et rhizoma, in Caco-2 cell monolayer model [30,31,32], and to predict human intestinal absorption and cellular accumulation of these compounds.

2. Results and Discussion

2.1. Validation of the Caco-2 Cell Monolayer

The integrity of differentiated Caco-2 cell monolayer was examined by measuring the transepithelial electrical resistance (TEER) with an epithelial voltohmmeter (EVOM, World Precision Instrument, Sarasota, FL, USA). Only cell monolayers with a TEER value above 500 Ω·cm2 were used for transport assays [31,32]. The apparent permeability coefficients (Papp) values of propranolol and atenolol, the well- and poor-transported markers by passive diffusion mechanism across Caco-2 cell monolayer, were assessed as (2.51 ± 0.21) × 10−5 cm/s and (2.35 ± 0.11) × 107 cm/s, respectively. The results were in a good agreement with the reported values [32], indicating that the applicability of the cell monolayer as in vitro intestinal absorption model was verified. 3-(4,5-Dimethyl-2-thiazolyl)-2,5-diphenyl-2H-tetrazolium bromide (MTT) assays [32] showed that all compounds at their maximum test concentration exerted no significant influences on the cell viability.

2.2. Validation of High Performance Liquid Chromatography Analysis Method

The high performance liquid chromatography (HPLC) analysis methods for the all test compounds had been validated. The standard calibration curves were constructed by plotting peak area (y) versus concentration (x, µM). Regression equations, coefficient correlations (r2), and concentration ranges of the calibration curve for the test compounds were listed in Supplemental Materials (Table S1). The methodological evaluation including the precision, accuracy, and method recovery were summarized in Table S2. The HPLC method was confirmed to be compliant with the Guidance for Industry Bioanalytical Method Validation of FDA [33]. The HPLC method validations of compounds 1, 8, and 10 were not performed, because they were extremely difficult to transport through Caco-2 cell monolayer.

2.3. Bidirectional Transport Determination

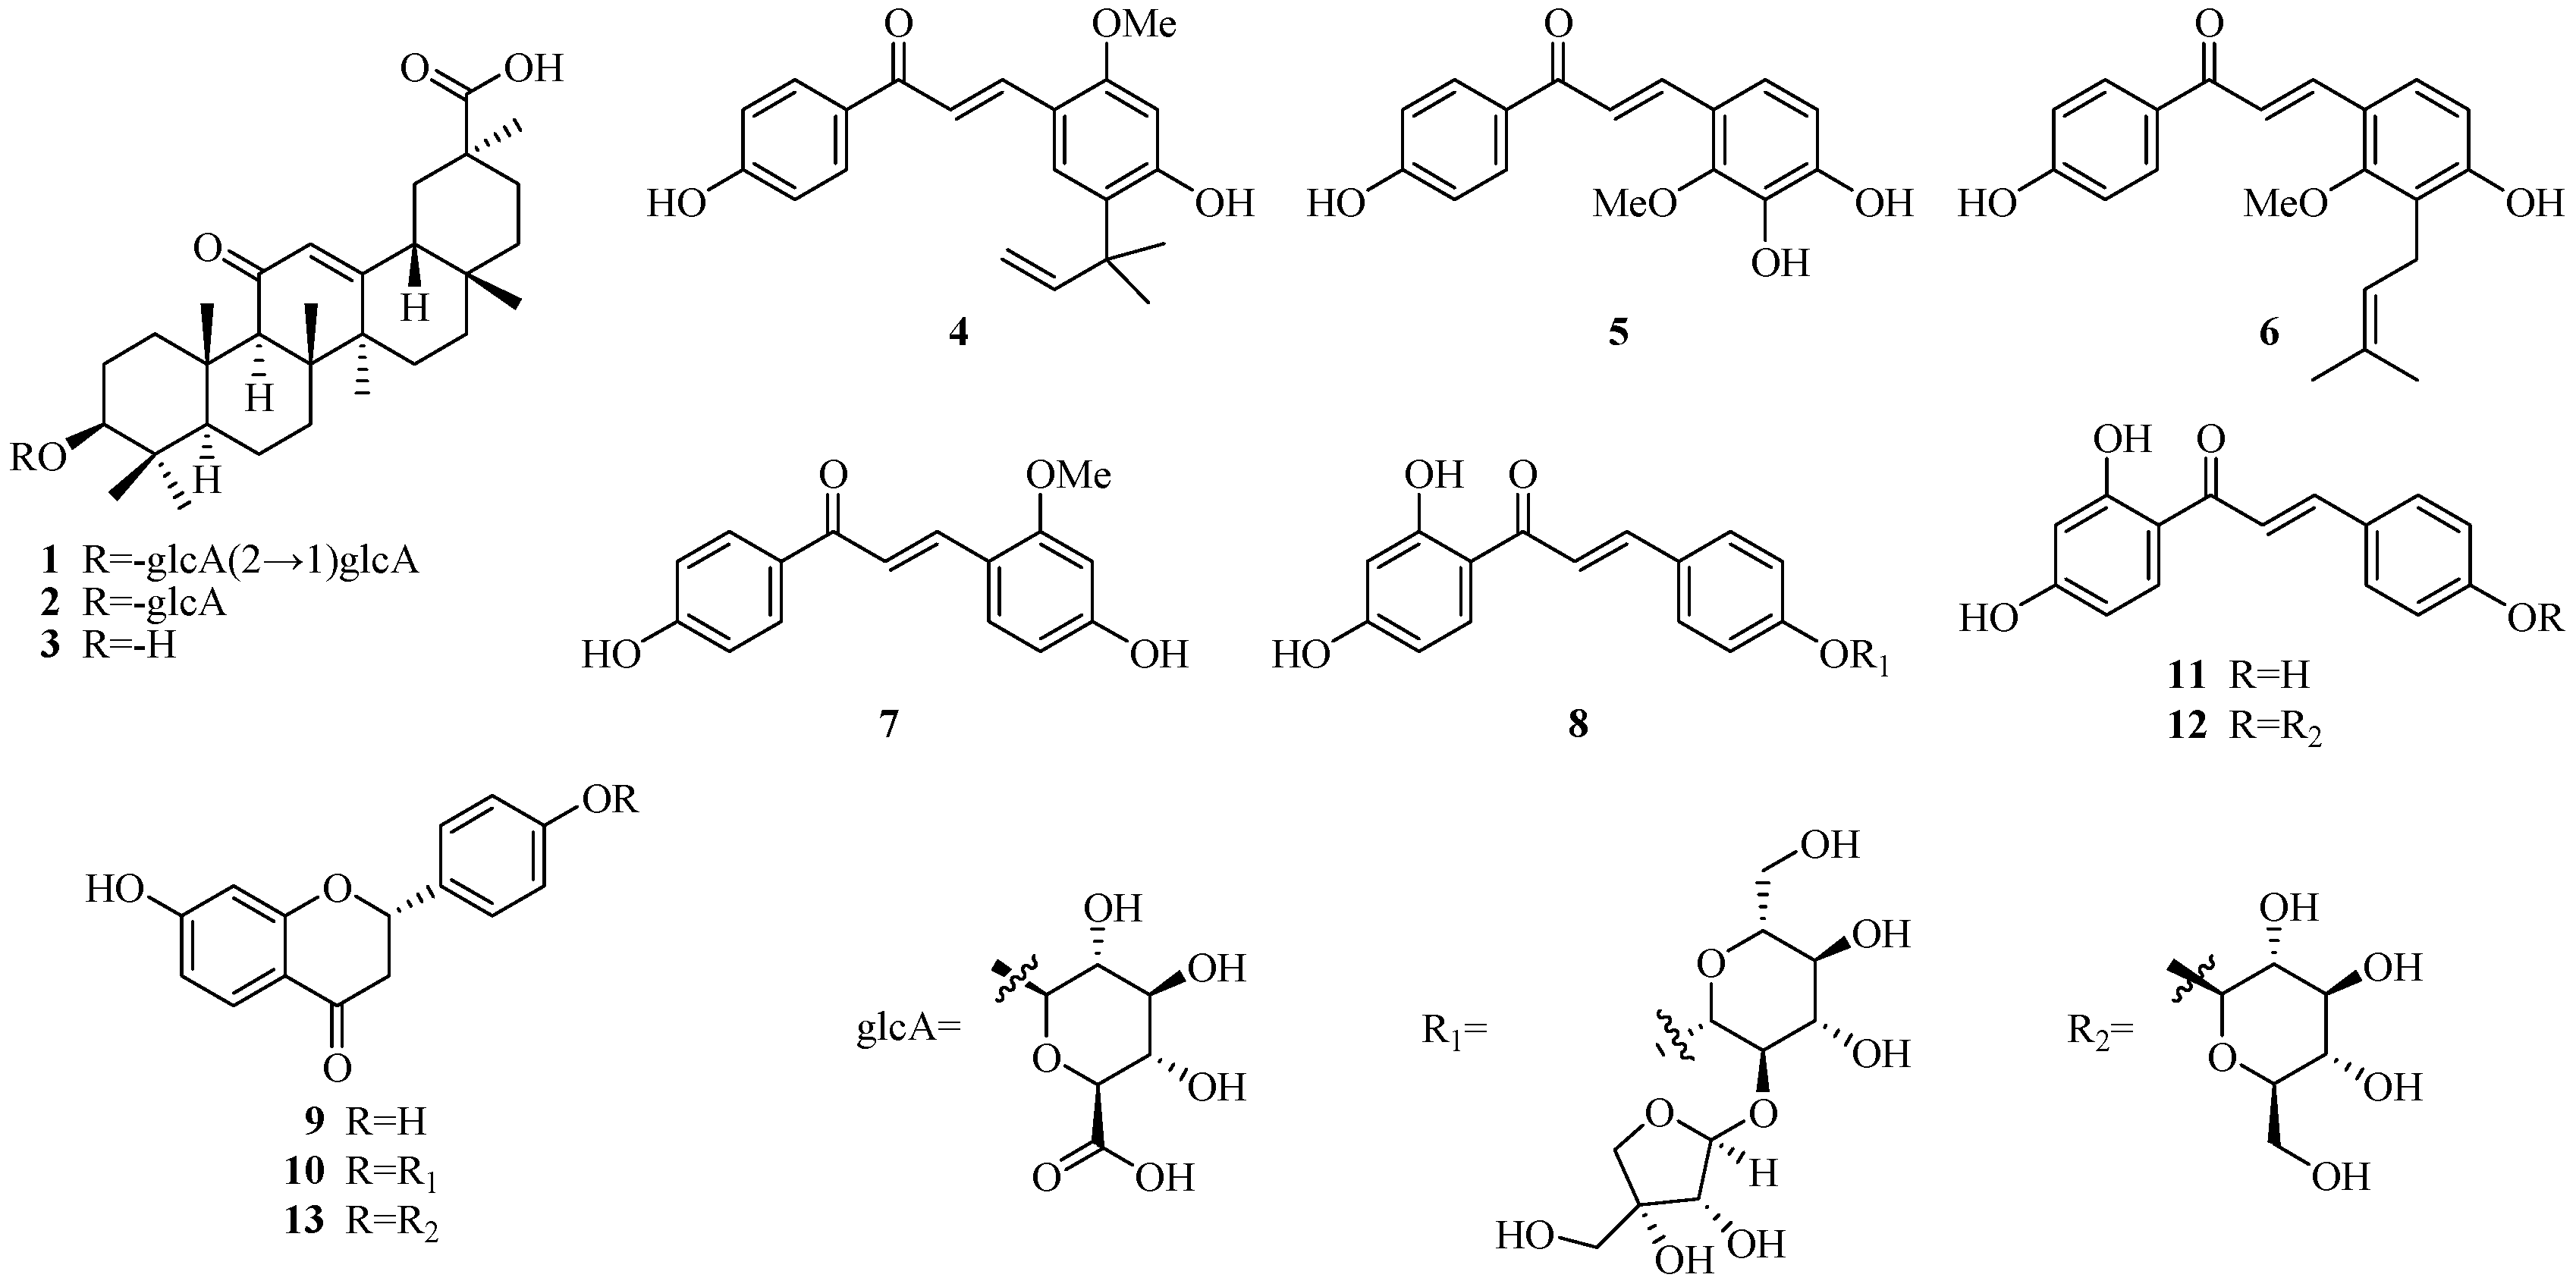
2.3.1. Bidirectional Transport of Triterpenoids 13

The bilateral (apical side (AP)→basolateral side (BL) and BL→AP) Papp values of triterpenoids 13 are summarized in Table 1. Compound 1 was not detected in the receiving sides after incubation for 90 min in both AP→BL and BL→AP transports, indicating that compound 1 was very poorly absorbed. Whereas the Papp values of compound 3 were well over 10−5 cm/s, which was comparable to that of propranolol ((2.51 ± 0.21) × 10−5 cm/s), a well-transported marker of the transcellular pathway [32], so compound 3 was designated as a well-absorbed compound. The Papp values of compound 2 in the bidirectional transportation were of 1 × 10⁻⁶ cm/s magnitude, which lay between that of propranolol and atenolol, so compound 2 was designated as a moderately absorbed compound.
Compound 3 is a triterpenoid aglycone, while compounds 1 and 2 are C3-O-β-d-bisglucopyranuronoside and C3-O-β-d-monoglucopyranuronoside of 3 (Figure 1), respectively. Apparently, reducing the number of sugar moieties increased the membrane permeability. Compound 1 displayed very poor intestinal absorption that may be attributed to poor membrane permeability. The comparable bidirectional Papp values (a ratio of 1.06−1.11 for Papp BL→AP/Papp AP→BL) of compounds 2 and 3 suggested passive diffusion as the main transport mechanism. It has been demonstrated in many reports that compound 1 shows substantial pharmacological effects [2,6]. On the other hand, it has also been revealed that compound 1 can be transformed to compounds 2 and 3 by intestinal bacteria following the oral intake of licorice in humans [34]. Therefore, predictions could be made that the compounds 2 and 3 were absorbed in blood as the active metabolite of licorice, especially compound 3.

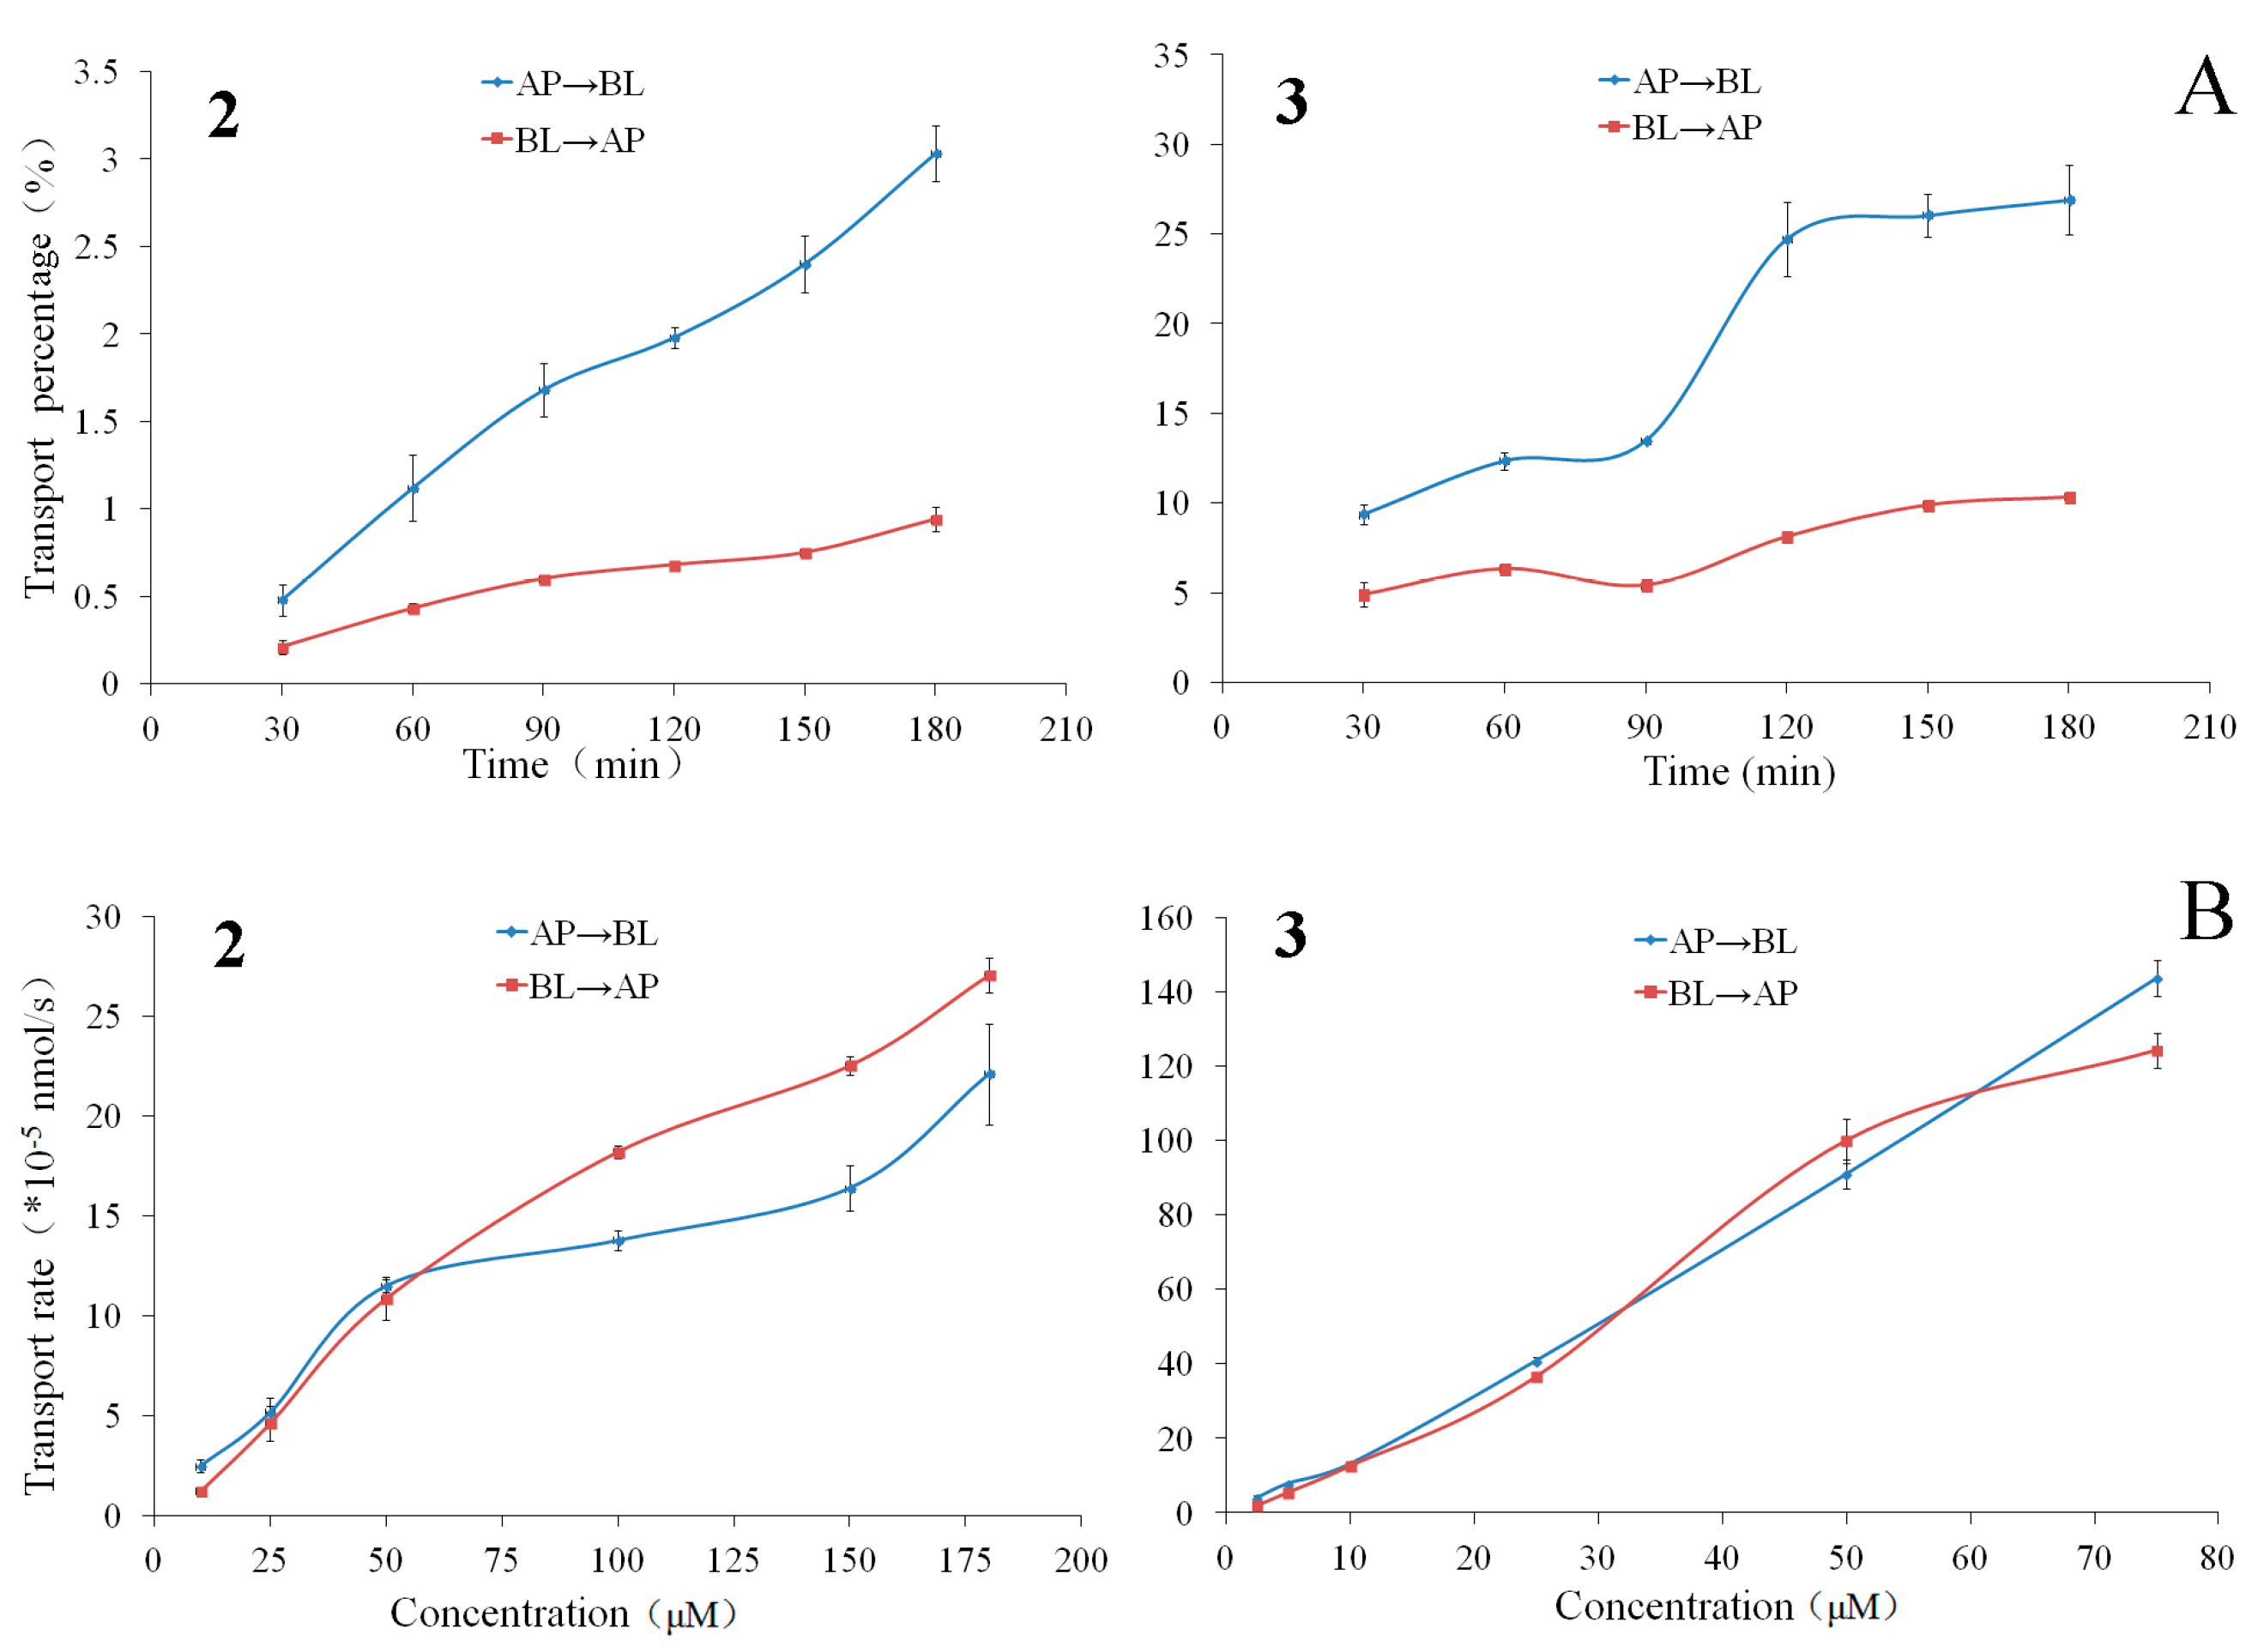
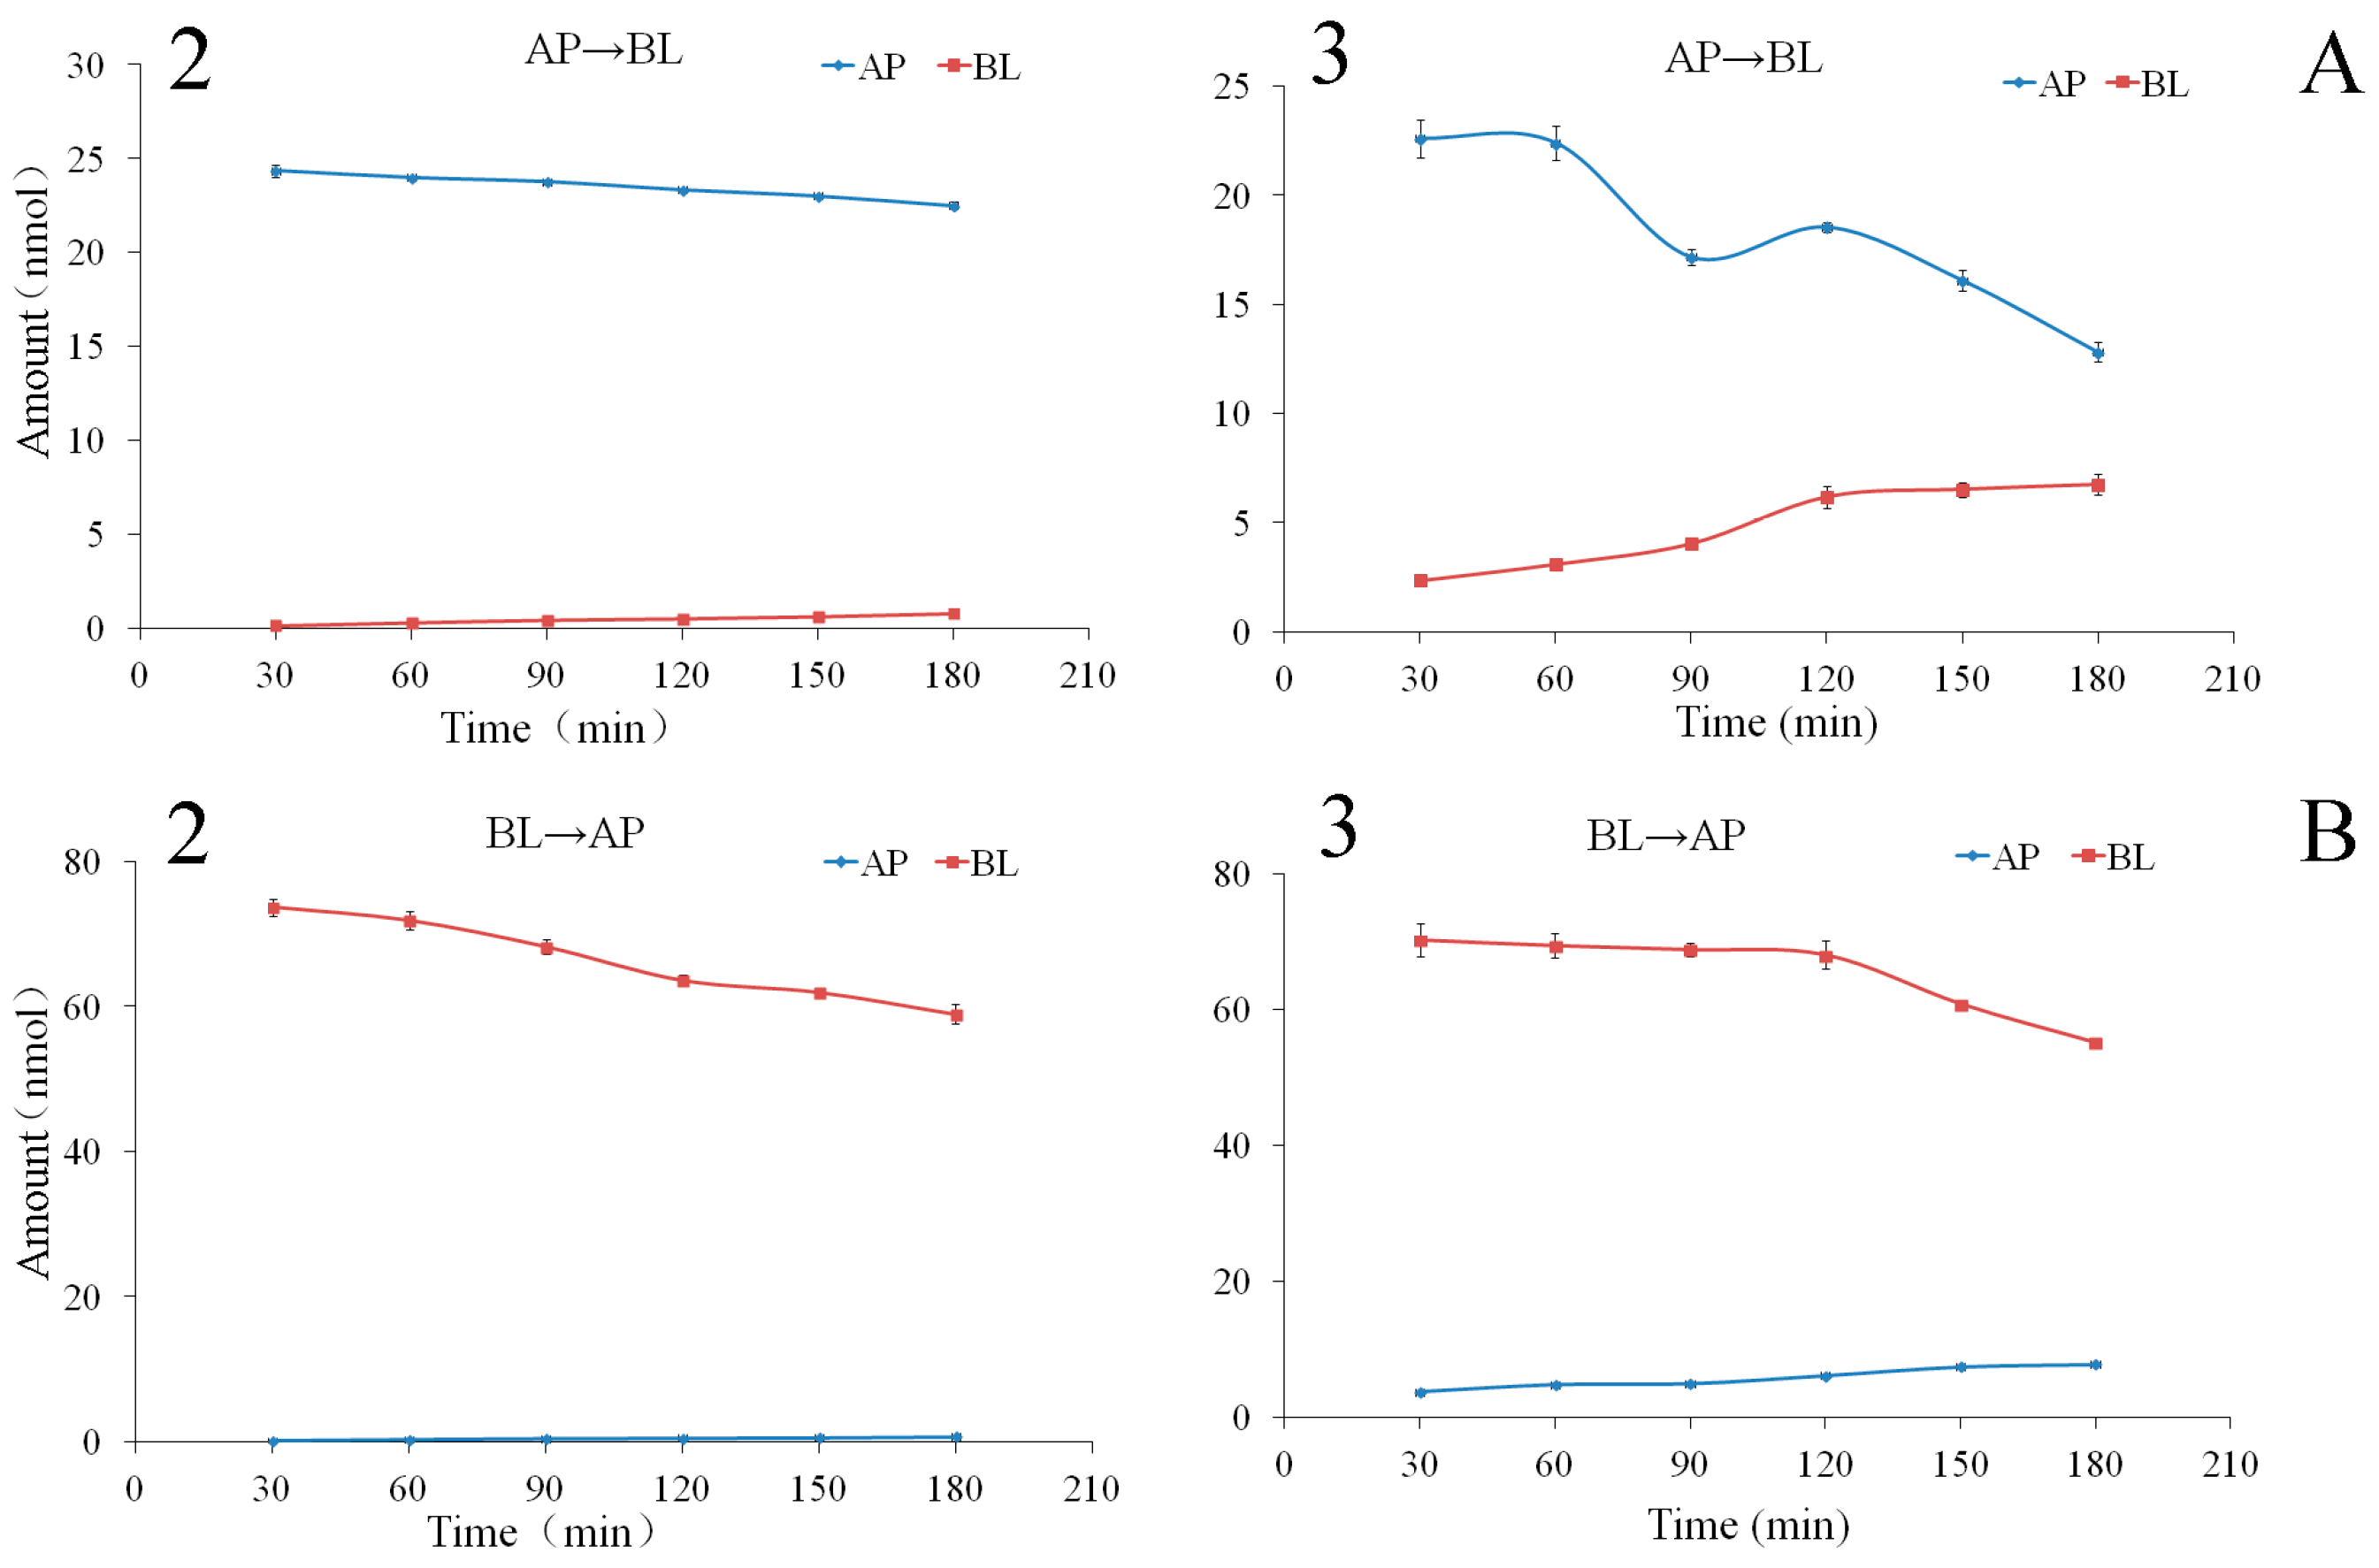
2.3.2. The Time Course and Concentration-Dependence of Permeation of Triterpenoids 2 and 3

The bilateral permeation of compounds 2 and 3 increased approximately linearly with time (0–180 min) at 50 μM (Figure 2), and the rates of membrane permeation increased approximately linearly at 90 min (Figure 2) within the test range of concentration (10–175 μM for compound 2 and 2.5–75 μM for compound 3). From kinetic curves presented in Figure 3, the amount of compounds 2 and 3 decreased approximately linearly in AP side and increased approximately linearly in BL side within the incubation time.

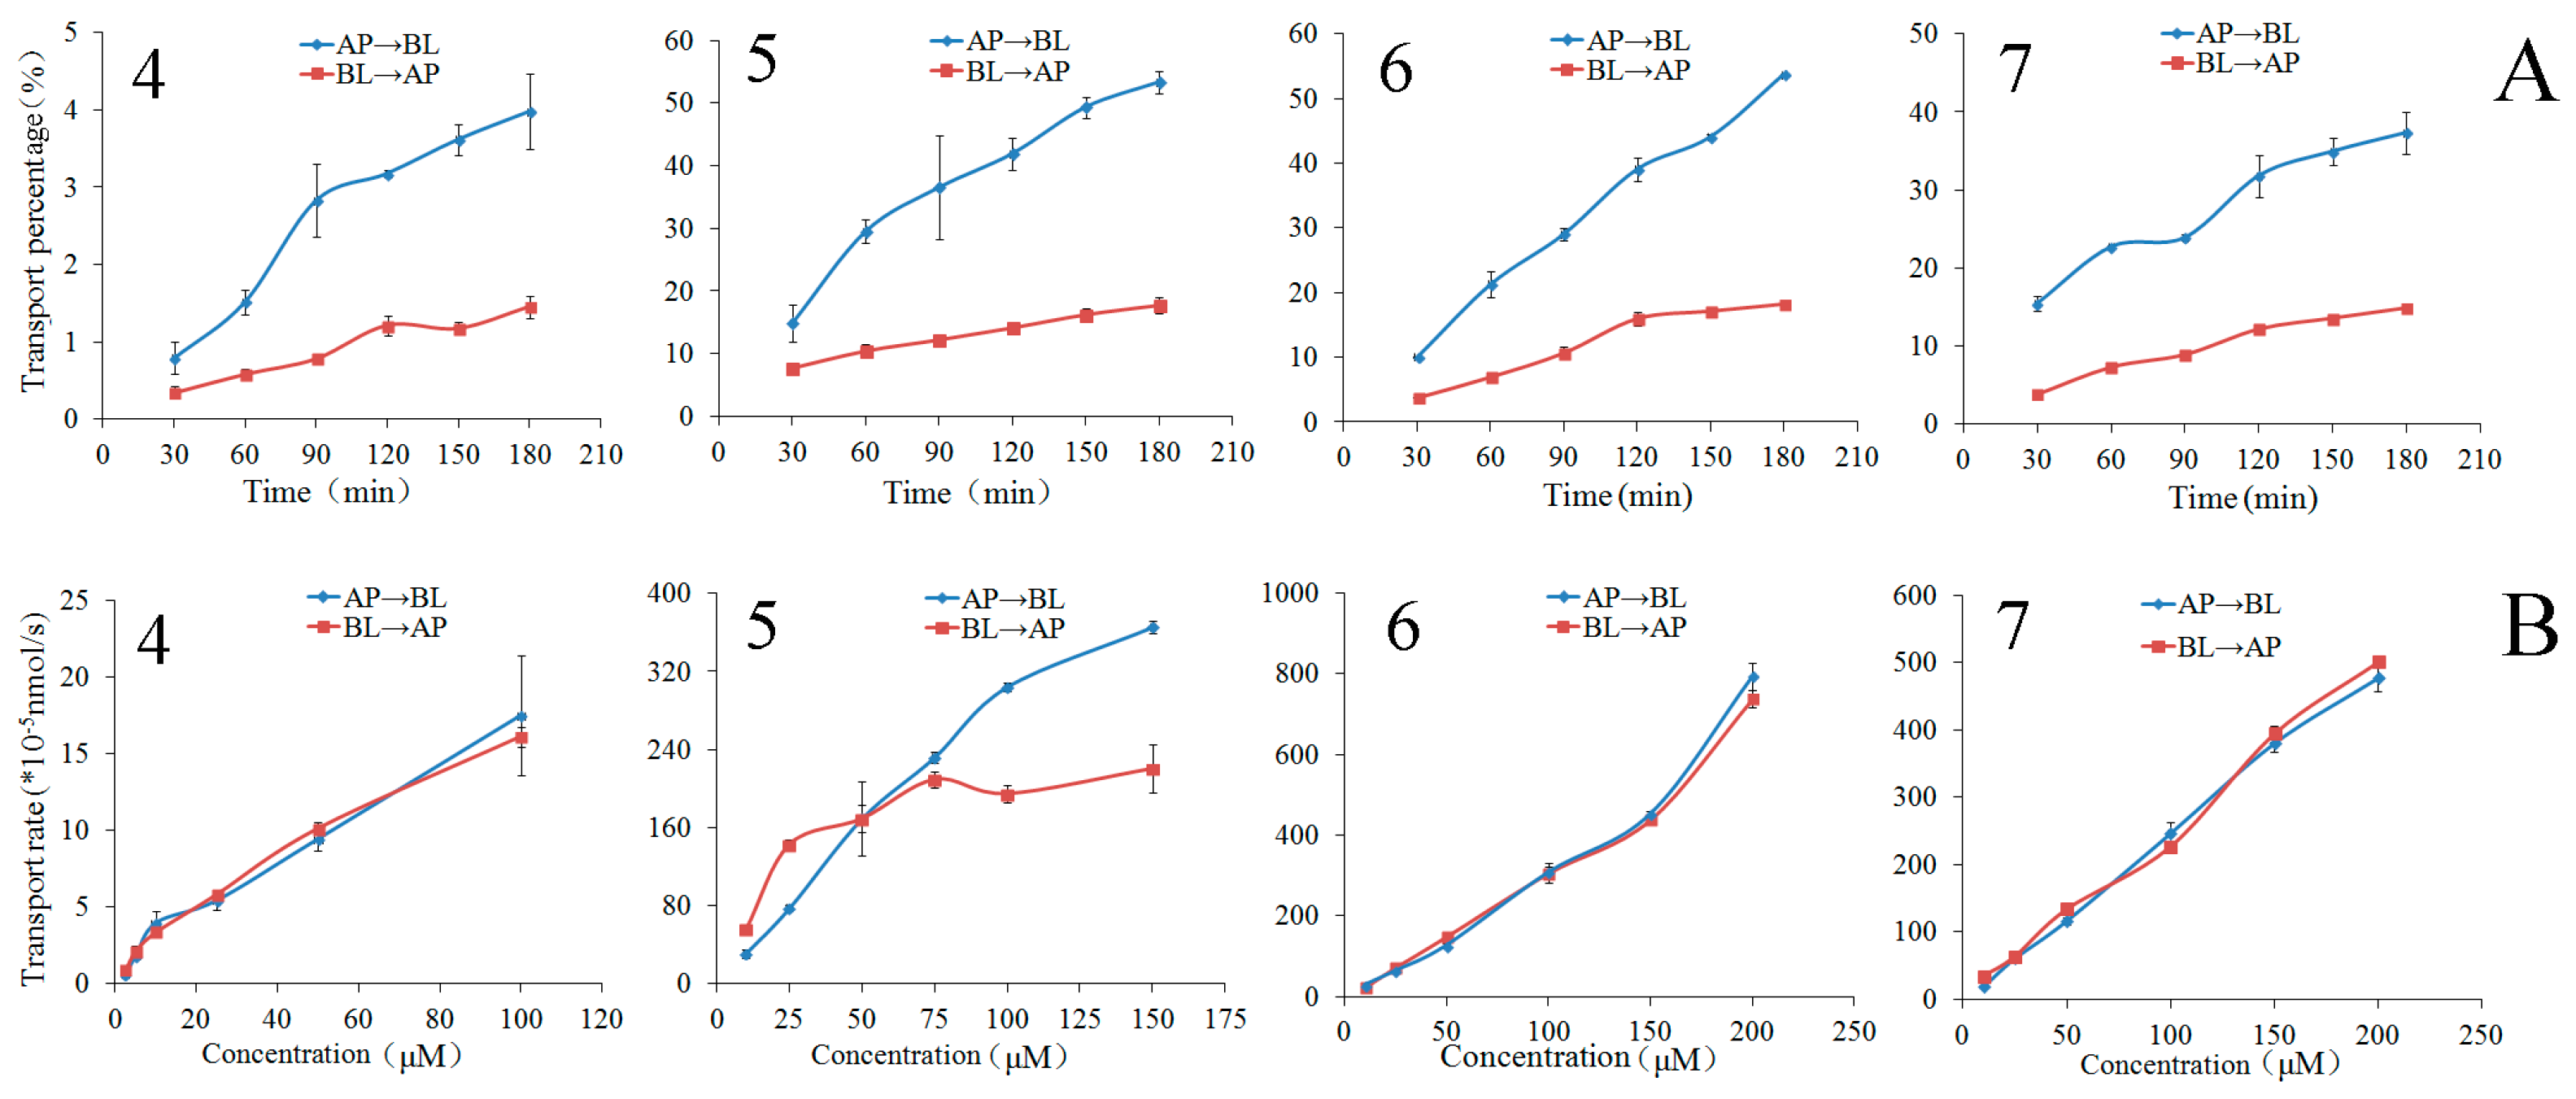
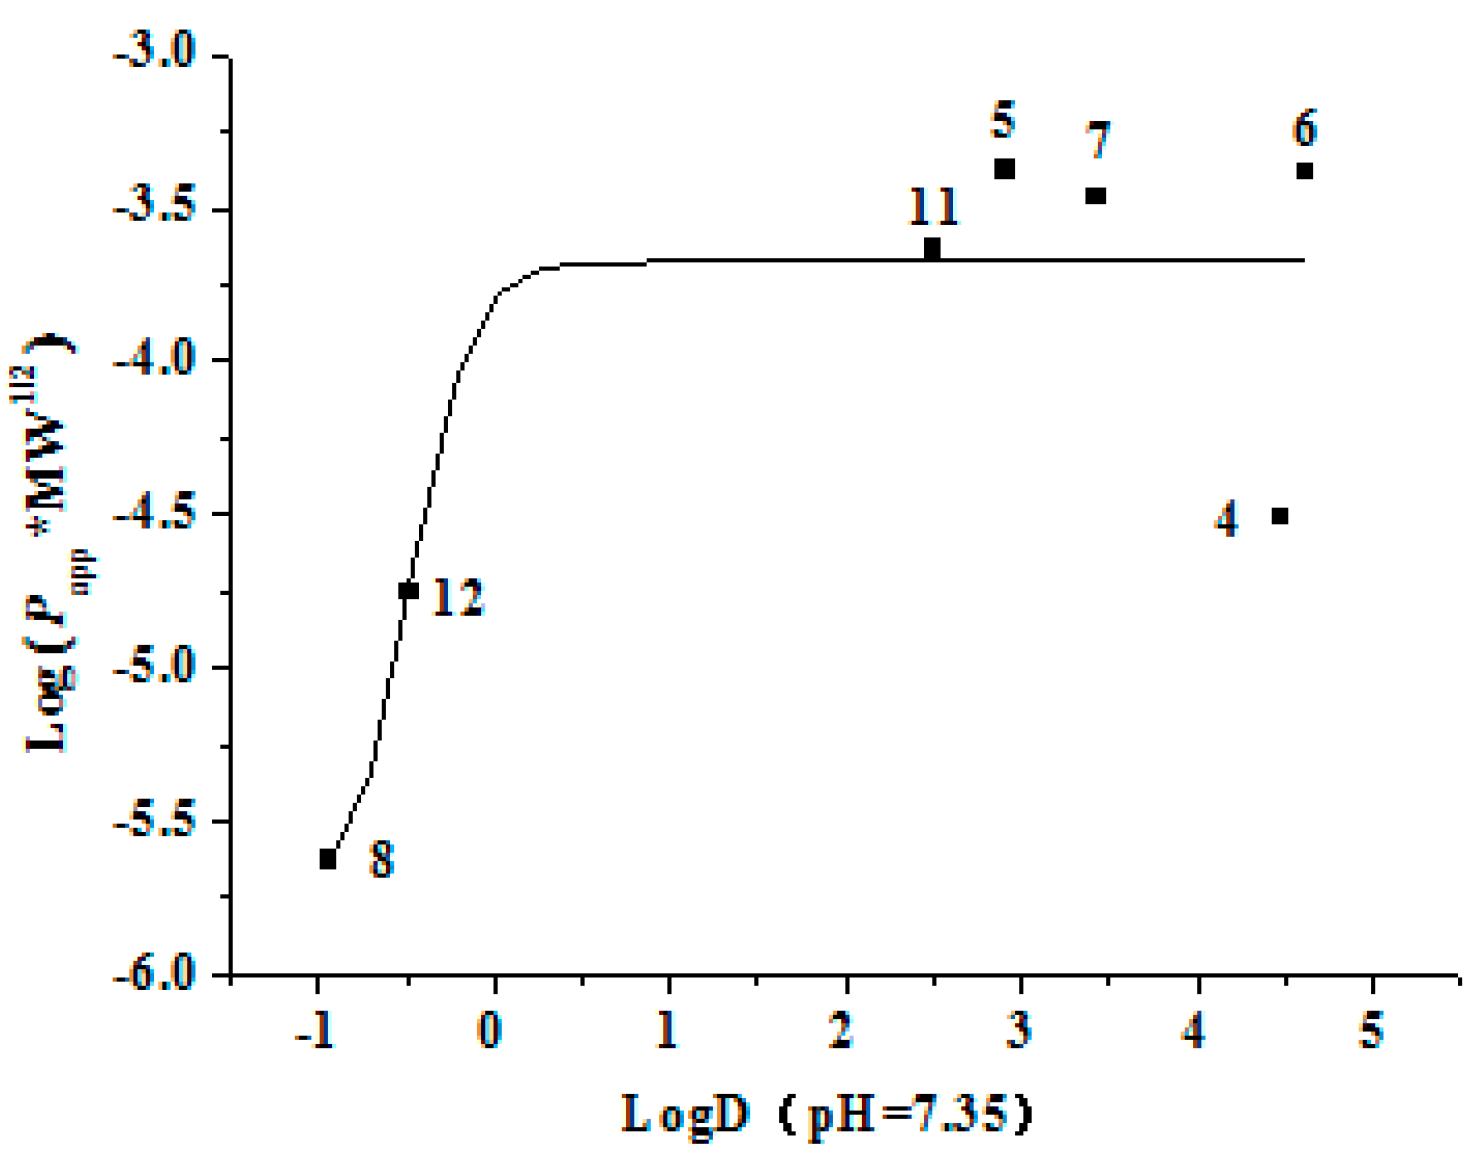
2.3.3. Bidirectional Transport of Chalcones 48

The bidirectional Papp values of chalcones 48 are summarized in Table 1. Chalcones 57 were designated as well-absorbed compounds, while chalcones 4 and 8 were designated as a moderately and poorly absorbed compounds, respectively. The Papp values of chalcone 11 (isoliquiritigenin) were reported to be (1.46 ± 0.01) × 10−5 cm/s from AP to BL direction and (9.35 ± 0.43) × 10−6 cm/s from BL to AP direction [35], and those of chalcone 12 (isoliquiritin) were reported to be (8.69 ± 0.15) × 10−7 cm/s from AP to BL direction and (7.68 ± 0.66) × 10−7 cm/s from BL to AP direction in our previous papers [36]. The results indicated that chalcone aglycones were well or moderately absorbed compounds. Whereas the magnitude of the bidirectional Papp values of chalcone glycosides (chalcones 12 and 8) were 1 × 10⁻⁷ cm/s or below, they were designated as the poorly absorbed compounds.

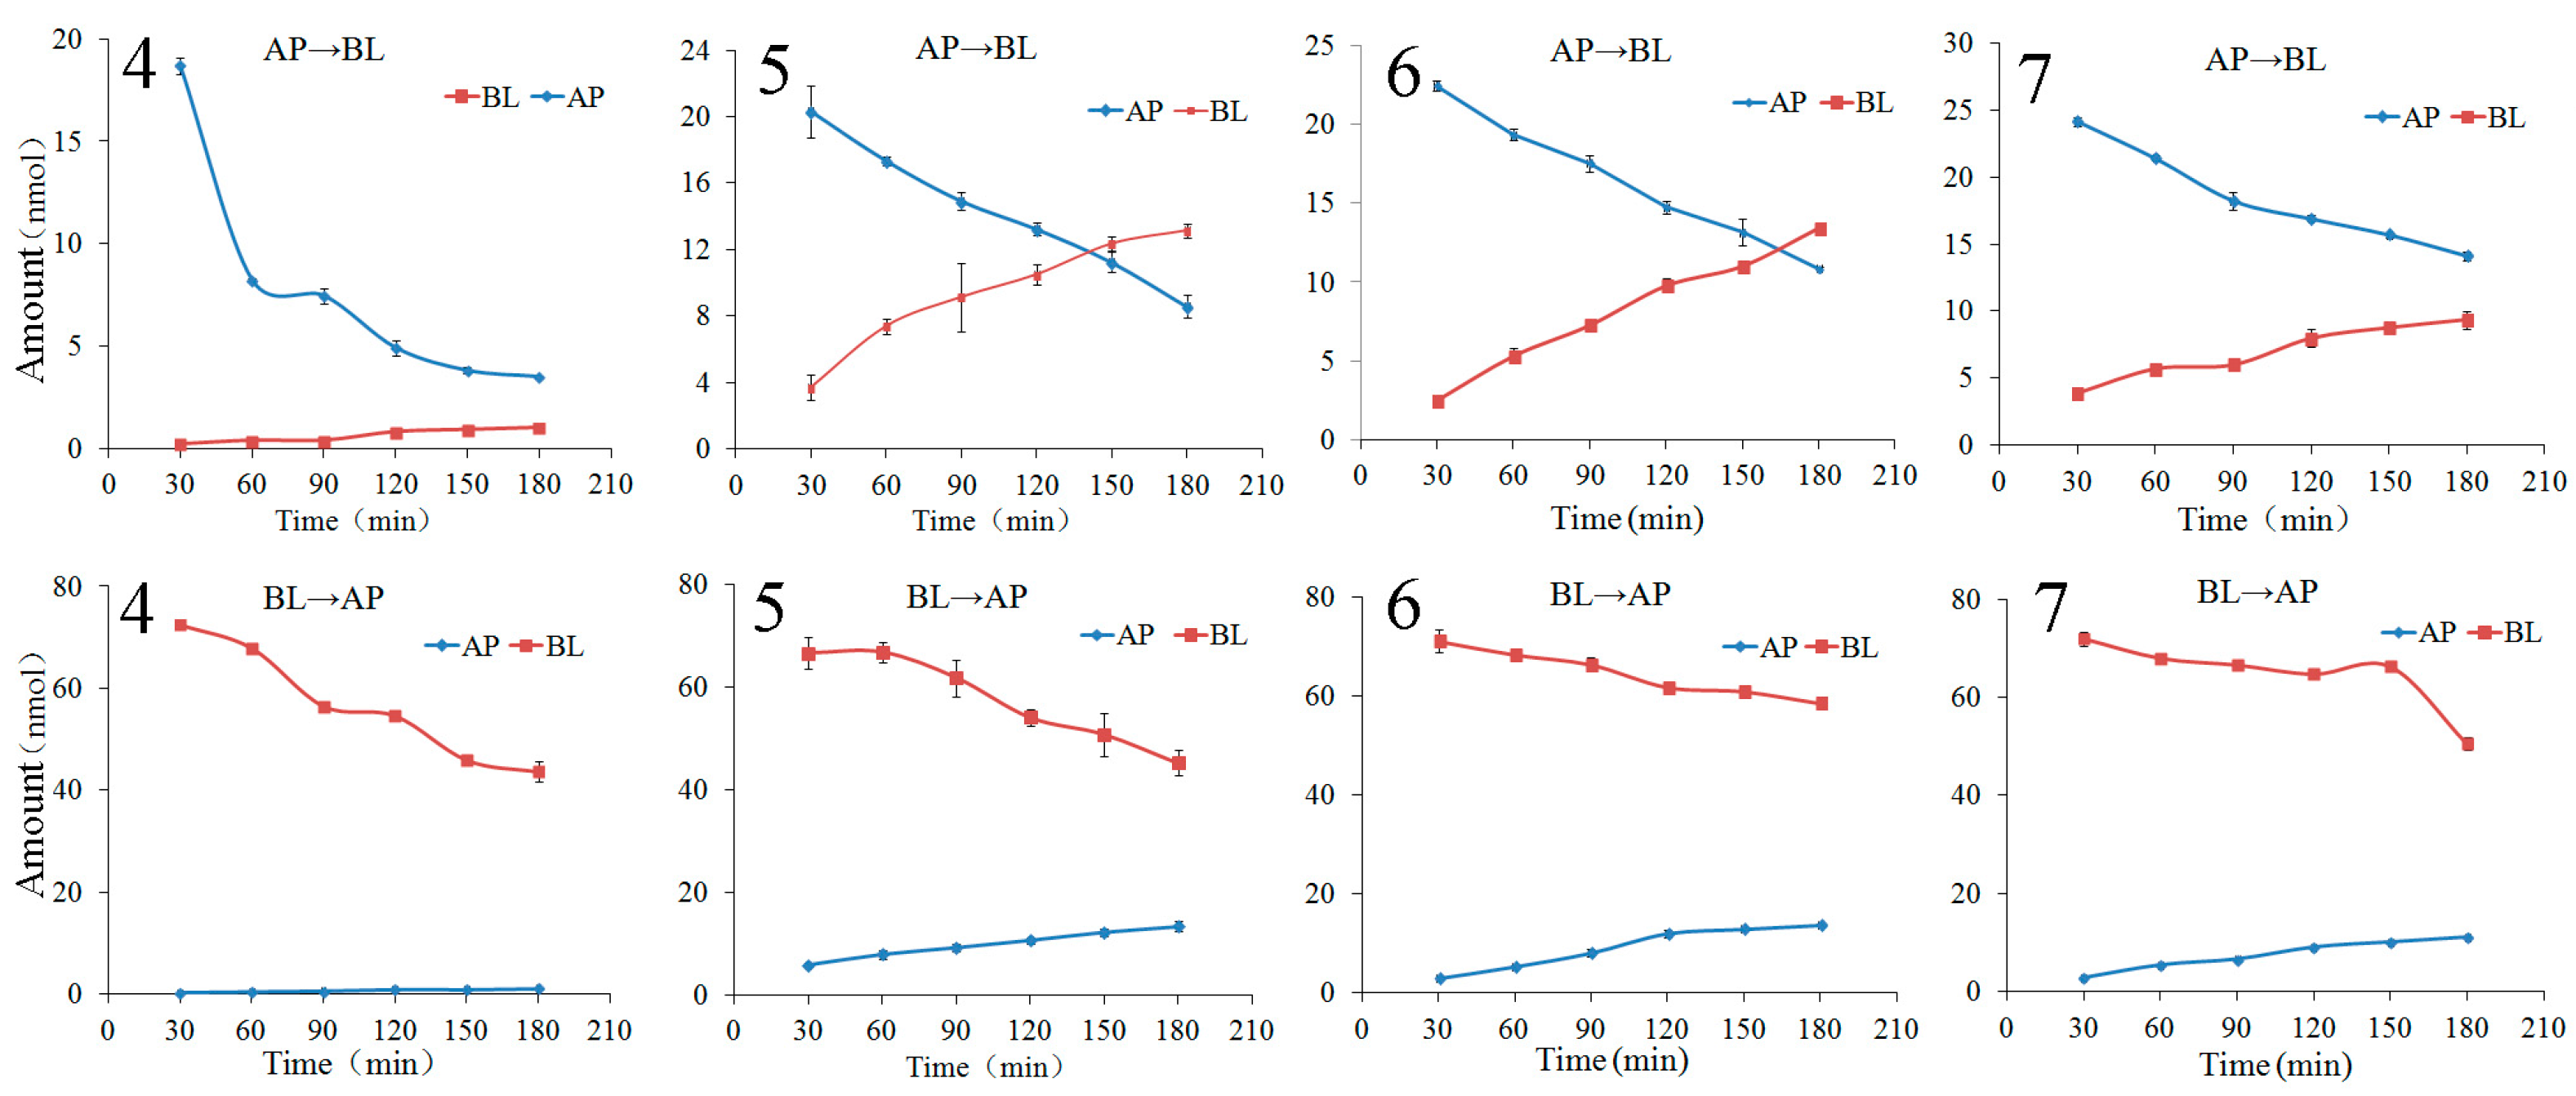
2.3.4. The Time Course and Concentration-Dependence of Membrane Permeation of Chalcones 47

The bilateral permeation of the chalcones 47 increased approximately linearly with time (0–180 min) at 50 μM (Figure 4), while the rates of membrane permeation increased approximately linearly at 90 min (Figure 4) within the test range of concentration (2.5–100 μM for chalcone 4, 10–150 μM for chalcone 5, 10–200 μM for chalcones 6 and 7). From kinetic curves presented in Figure 5, the amount of the chalcones 47 decreased in AP side and increased in BL side approximately linearly within the incubation time.

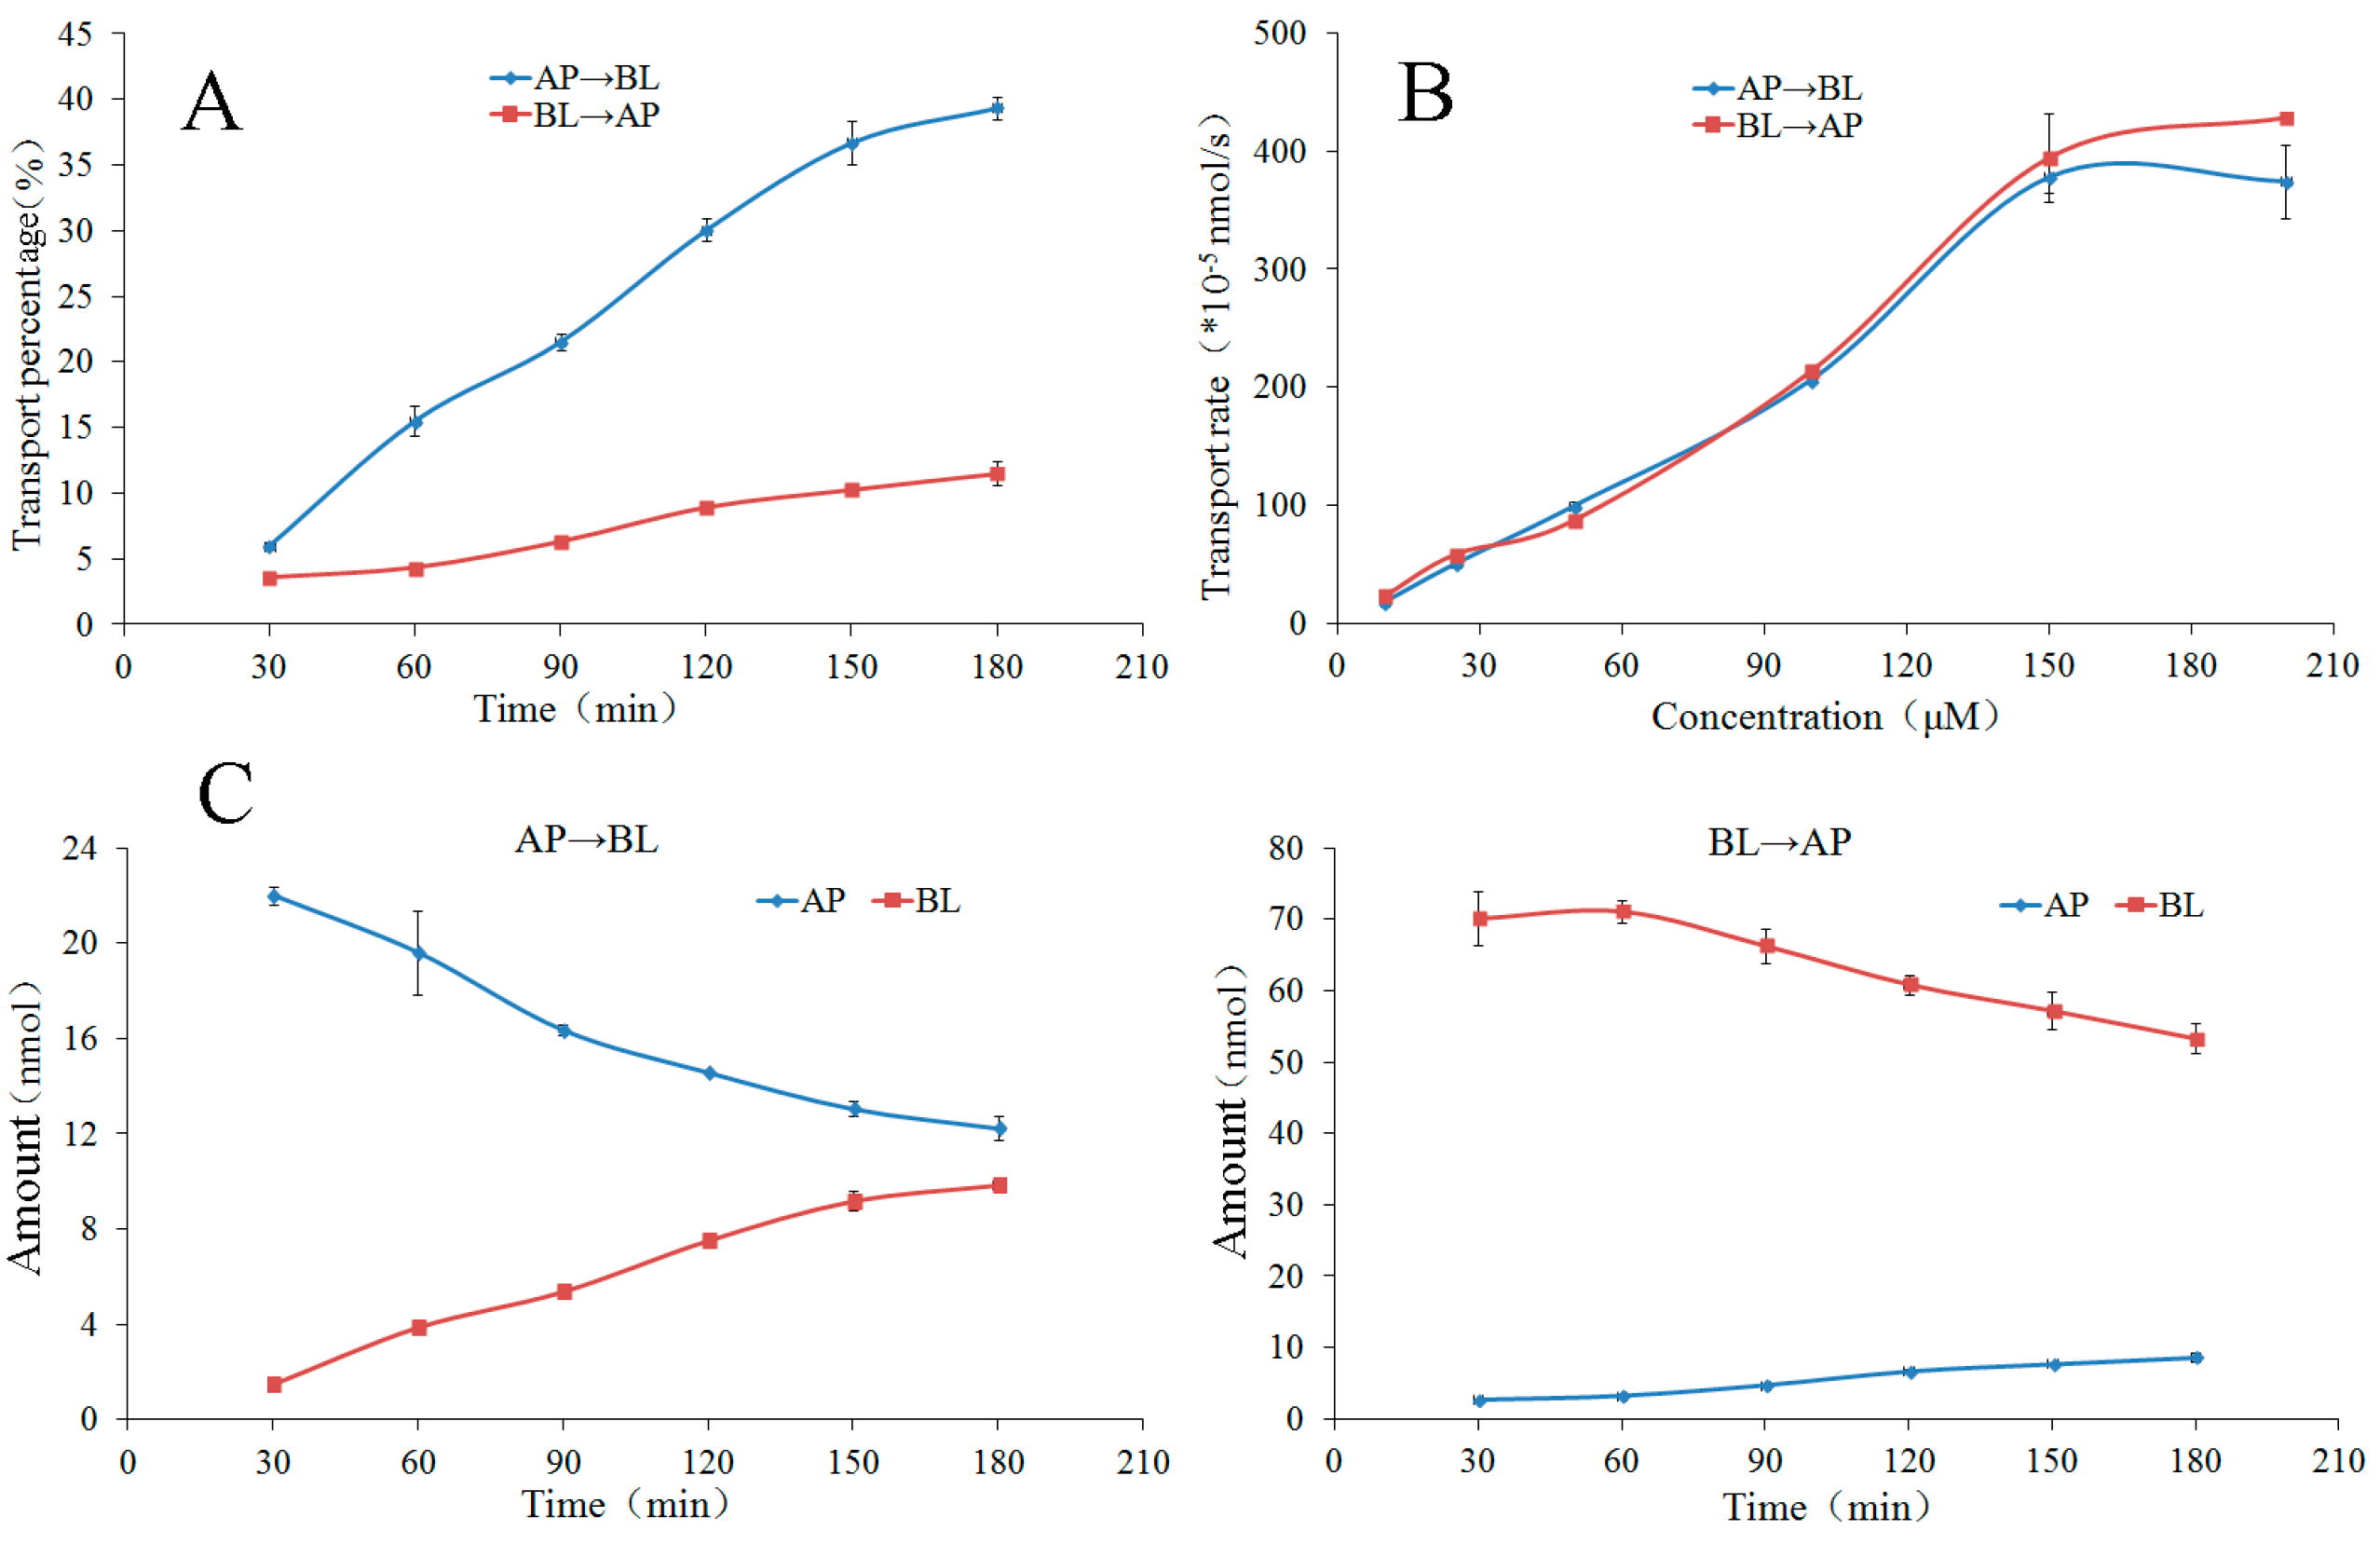
2.3.5. Bidirectional Transport of Flavonones 9 and 10

The bidirectional Papp values of flavonones 9 and 10 are summarized in Table 1. Flavonone 9 was assigned as a well-absorbed compound with Papp value of around 1 × 10⁻⁵ cm/s. Flavonone 10 was found to hardly permeate Caco-2 cell monolayer with Papp value < 1 × 10⁻⁷ cm/s. The Papp values of flavonone 13 (liquiritin) were reported to be (5.40 ± 0.16) × 10−7 cm/s from AP to BL direction and (5.32 ± 0.31) × 10−7 cm/s from BL to AP direction in our previous study [36], and it was designated as a poorly absorbed compound. The decreasing order of the permeability was 9 > 13 > 10, i.e., disaccharide glycoside (10) showed less permeability than monosaccharide glycoside (13), and both of them had far less permeability than the corresponding aglycone (9). This was in accordance with the finding in the case of triterpenoids 13 that the permeability of compounds in the Caco-2 cell monolayer can be reduced with the increase in the number of glycosyl groups on the core molecular nuclei.

2.3.6. The Time Course and Concentration-Dependence of Permeation of Flavonone 9

The bilateral permeation of the flavonone 9 increased approximately linearly with time (0–180 min) at 50 μM (Figure 6), while the rates of permeation increased approximately linearly at 90 min (Figure 6) within the test range of concentration (10–200 μM). From kinetic curves presented in Figure 6, the amount of the flavonone 9 in AP side decreased approximately linearly and in BL side increased approximately linearly within the incubation time.
At the end of the transport experiments, the mass balance was calculated (see Supplementary data, Table S3). The recoveries of compounds 2, 3, 57, and 9 were 85.06–98.24% in all bidirectional transport studies with very low cell accumulation. This suggests no significant first-pass metabolism during their intestinal absorption and transport. The recovery of compound 4 was relatively lower in the AP→BL transport with the higher intracellular uptake in all bidirectional transport. The efflux ratios (Table 1) of the compounds 27, and 9 were within the range of 0.88–1.22, suggesting that their bidirectional transport was comparable and lack of directional preference. The results of the concentration-dependency presented in Figure 2, Figure 4 and Figure 6 suggested a passive diffusion mechanism of compounds 27, and 9 across the Caco-2 cell monolayer. The kinetics curves for time-dependency (Figure 2, Figure 4 and Figure 6) indicated no efflux or active transport and again confirmed the passive diffusion mechanism. In general, the passively transported compounds with Papp AP→BL values > 1 × 10⁻⁶ cm/s can cross the intestinal barrier efficiently with the percentage of absorption > 20% [32]. Papp AP→BL values of compounds 27, and 9 all exceeded 1 × 10⁻⁶, predicting that they would be absorbed in human intestine.
Physicochemical characters such as log D (logarithm of octanol–water partition coefficient) and MW (molecular weight) were generally utilized for the prediction of the permeability of compounds [37]. An analysis of the relationship between the log D, MW, and the determined Papp value of different kinds of compounds may help to rich the predictive database. The log D values at pH 7.35 of compounds 113, calculated with Pallas 3.3.2.6 ADME/Tox Software (CompuDrug, Bal Harbor, FL, USA), as well as their MW values were shown in Table 1. Herein, a sigmoid trendline of log (Papp AP→BL × MW1/2) versus logD was plotted (Figure 7) with Origin Pro 7.5 SR1 (Origin Lab. Corporation, Northampton, MA, USA) to elucidate the structure-permeability relationship of chalcones 48, 11, and 12. It was found that the permeability of chalcones increased in the log D range of −1–3, which was consistent with the common regulation that the more lipophilicity one compound shows, the more permeability it has; however, those of chalcones kept nearly invariable in the log D range of 3−5, which led to a higher permeability with the exception of chalcones 4.

3. Experimental Section

3.1. Assayed Compounds

Triterpenoids glycyrrhizin (1), glycyrrhetic acid-3-O-mono-β-d-glucuronide (2), and glycyrrhetinic acid (3) were supplied by Natural Product Sample Library in State Key Laboratory of Natural and Biomimetic Drugs of Peking University (Beijing, China). Chalcones licochalcone A (4), licochalcone B (5), licochalcone C (6), and echinatin (7) were obtained from Tianjin Chroma-standard Medical Science & Technology Development Co. Ltd. (Tianjin, China), and isoliquiritin apioside (8) was obtained from Shanghai Tauto Biotech Co. Ltd. (Shanghai, China). Flavonones liquiritigenin (9) and liquiritin apioside (10) were obtained from Shanghai Tauto Biotech Co. Ltd. (Shanghai, China).

3.2. Chemicals and Reagents

HPLC grade methanol (MeOH) was purchased from Fisher Scientific (Fair lawn, NJ, USA). Analytical grade acetic acid and Hank’s Balanced Salts Solution (HBSS) were purchased from Beijing Chemical Works (Beijing, China). Water was purified by a Mili-system (Millipore, Bedford, MA, USA). Propranolol, atenolol and dimethyl sulfoxide (DMSO) were purchased from Sigma-Aldrich Co. (St. Louis, MO, USA). Penicillin-streptomycin solution was obtained from Suolaibao Technology Ltd. (Beijing, China). Dulbecco's Modified Eagle's Medium (DMEM), fetal bovine serum (FBS), phosphate buffered saline (PBS), nonessential amino acids (NEAA), and trypsin were supplied by Gibco® Laboratories (Life Technologies Inc., Grand Island, NY, USA).

3.3. Instrumental Analyses

Quantitative analysis of compounds 27 and 9 was performed on a Dionex Ultimate™ 3000 UHPLC system (Dionex Corp., Sunnyvale, CA, USA), comprised of Ultimate 3000 pump, autosampler, column compartment, and diode array detector. The signals were acquired and processed applying a Chromeleon version 6.80 software (Dionex Corp., Sunnyvale, CA, USA). HPLC separation was performed on a Dikma Diamonsil™ C18 column (250 mm × 4.6 mm, 5 μm, Dikma Technology, Inc., Beijing, China). The mobile phase was consisted of MeOH and 0.6% acetic acid in aqueous solution (v/v) in 81:19 for compound 2, 86:14 for compound 3, 70:30 for compound 4, 45:55 for compounds 5, 6, and 9, 50:50 for compound 7, with a flow rate of 1 mL/min, a column temperature of 30 °C and a injected volume of 10 μL for compounds 27 and 9. The detection wavelength was set at 254 nm for compounds 2 and 3, 372 nm for compound 4, 360 nm for compound 5, 276 nm for 6, 370 nm for 7, and 276 nm for compound 9. The calibration curves were constructed by plotting peak area (y) versus concentration (x, µM), which concentration series (µM) were 5, 25, 50, 75, 150, 200 for compound 2; 2.5, 5, 10, 15, 25, 50 for compound 3; 5, 10, 15, 25, 50, 75 for compound 4; 2.5, 5, 10, 25, 50, 75 for compound 5; 5, 10, 25, 50, 75, 150 for compound 6; 10, 25, 50, 75, 150, 200 for compound 7; 5, 10, 25, 75, 100, 200 for compound 9. The amounts of compounds 1, 8, and 10 in the receiving chambers were below the lower limit of detection (LLOD). Quantification was carried out by peak area measurements in comparison with the calibration curves. Methodology was examined for precision, accuracy, and recovery (see Supplemental Material Table S1) and was demonstrated to meet the requirements of determination.

3.4. Cell Culture

The human intestinal Caco-2 cell line (ATCC #HTB-37) was purchased from American Type Culture Collection (ATCC, Rockville, MD, USA). The cell culture was carried out in a Sanyo MCO-15 AC carbon dioxide (CO2) incubator (Sanyo Electric Co., Ltd., Osaka, Japan). The integrity of the Caco-2 cell monolayer was examined by measuring the TEER with an epithelial voltohmmeter (EVOM, World Precision Instrument, Sarasota, FL, USA) [32]. All cells used in this study were between passages 30 and 40.

3.5. Caco-2 Cell Permeability

The Caco-2 cell monolayer permeability was carried out according to the previously reported method [32,38]. Briefly, the Caco-2 cells were maintained in DMEM containing 10% FBS, 1% NEAA, 100 units/mL of penicillin, and 100 µg/mL of streptomycin, in a constant humidity atmosphere of 5% CO2 and 95% air at 37 °C. For confluence and differentiation, cells were seeded at a density of 1 × 10⁵ cells/cm2 into 12-well Transwell plates (insert diameter 12 mm, pore size 3.0 μm, membrane growth area 1.12 cm2, Costar® #3402) and were allowed to grow for 21 days before the permeation experiment. On day 21, the monolayers with TEER values > 500 Ω·cm2 were qualified for the transport experiment. The transport study was initiated by the careful removal of the culture medium from AP and BL sides of the inserts. Caco-2 monolayers were rinsed twice with pre-warmed HBSS and were incubated by pre-warmed HBSS for 30 min at 37 °C. Stock solutions of assayed compounds 110 were prepared in DMSO and diluted to 50 µM with HBSS. The final DMSO concentration was less than 2%, a concentration that did not alter the Caco-2 cells viability or permeability. The assayed solutions (50 µM) were added to the AP side (0.5 mL, for absorption transport) or BL side (1.5 mL, for efflux transport) of the inserts, while the receiving chamber contained the corresponding volume of HBSS. Incubation was performed at 37 °C for 90 min, with shaking at 50 rpm. Samples were collected from the inserts and lyophilized. The dried sample was then sonicated with the appropriate volume of MeOH, followed by centrifugation at 15,000× g for 10 min. The supernatant was filtered through a 0.45 μm filter and injected into HPLC system for quantitative analysis.
The AP to BL or BL to AP permeability coefficient (Papp) value of each compound was calculated based on the following equation:
Papp = (dQ/dt) × (1/A) × (1/C0) (cm/s)
where dQ/dt is the rate of the appearance of the test compound on the receiver compartment (μmol/s), C0 is the initial test compound concentration on the donor compartment (μmol/mL), and A is the surface area of Caco-2 monolayer (cm2).

3.6. Time- and Concentration-Dependent Transport of the Compounds 27 and 9 across the Caco-2 Cell Monolayer

To observe the time-dependence, 50 μM of the compounds 27 and 9 were added to either AP or BL side of the inserts. While shaking the samples (37 °C, 50 rpm), 1.3 mL aliquots were taken from BL side or 0.45 mL aliquots were taken from AP side at 30 min intervals from 30 to 180 min.
To observe the concentration-dependence, the compounds 27 and 9 were added to either AP or BL side of the inserts at the final concentration in the range of 10–175 μM for compound 2, 2.5–75 μM for compound 3, 2.5–100 μM for compound 4, 10–150 μM for compound 5, 10–200 μM for compounds 6, 7, and 9. After shaking the samples (37 °C, 50 rpm) in a shaking water bath for 90 min, aliquots were collected as described above. As in the case of time-dependent transport experiments, the kinetics curves of the compounds 27 and 9 were drawn at an initial concentration of 50 μM and intervals from 30 to 180 min.

3.7. Intracellular Accumulation and Recovery

To measure the amount of intracellular accumulation, the Caco-2 cells were rinsed three times with ice-cold HBSS at the end of transport experiments. After three freeze (−20 °C)-thaw (room temperature) cycles, the lysed Caco-2 cells were lyophilized. The dried cells were sonicated in 0.2 mL of 70% aqueous MeOH for 20 min and then centrifuged at 15,000× g for 10 min. The supernatant was filtered through a 0.45 μm filter and a 10 μL aliquot was injected into the HPLC system for analysis. To check the mass balance, the recoveries of the assayed compounds were measured at both sides of the insert and intracellular accumulation of the Caco-2 cells.

4. Conclusions

The transport rates of the six selected compounds 3, 57, and 9, lipophilic aglycones including major triterpenoid, chalcone, and flavonone compounds in licorice, increased linearly with the concentration and saturation was not observed at the concentrations tested, indicating that the permeation mechanism for these compounds was passive diffusion. The magnitude of the bidirectional flux of these compounds was comparable to propranolol (Papp = (2.51 ± 0.21) × 10−5 cm/s). These data suggest that the compounds 3, 57, and 9 were well-absorbed compounds and were transported mainly through passive diffusion by the transcellular pathway. The recoveries of compounds 3, 57, and 9 were higher in bidirectional transport studies with very low cell accumulation, suggesting metabolism may not be involved during their intestinal absorption and transport. In spite of the fact that chalcone 4 was also an aglycone, the higher accumulation in Caco-2 cells resulted in its Papp value laying between Papp values of propranolol and atenolol, and chalcone 4 was designated as a moderately absorbed compound. Permeation of the bisglycosides 1, 8, and 10, across the Caco-2 cell monolayer was not detected, suggesting their Papp values less than 1 × 10⁻⁷ cm/s, and they were designated as the very poorly absorbed compounds. While the monoglycosides 2 with 1 × 10⁻⁶ cm/s degree of Papp value, 12 and 13 with 1 × 10⁻⁷ cm/s degree of Papp value [36] were designated as the moderately or poorly absorbed compounds, indicating that the number of sugar groups linked in aglycone molecule was one of the important factors to affect their intestinal absorption by comparison with the corresponding aglycone. In addition, analysis on the relationship between the log D, MW, and the determined Papp value of different kinds of compounds may help to rich the predictive database of drug ADME/T. These new findings provided useful information for predicting their oral bioavailability, pharmacokinetics, and the clinical application as well as determination of the bioactive substance basis of Glycyrrhizae radix et rhizoma [39,40].

Supplementary Materials

Supplementary materials are available online: Table S1 for regression data of compounds 27 and 9. Table S2 for precision, accuracy and recovery of compounds 27 and 9. Table S3 for the total recovery and the intracellular accumulation percentage of the assayed compounds 27 and 9 from the Caco-2 cell monolayer at the end of transport.

Acknowledgments

This research was partly supported by the National Natural Science Foundation of China (81530097) and the National Key Technology R & D Program of China (2011BAI07B08).

Author Contributions

The list authors contributed to this work as follows: X.-W.Y. and G.-Y.L. conceived and designed the experiments; X.-X.W., Y.-F.Y., X.-W.W., and W.X. performed the experiments and analyzed the data; X.-X.W., G.-Y.L., and X.-W.Y. wrote the paper; X.-W.Y. and G.-Y.L. acquired funding for the research. All authors read and approved the final manuscript.

Conflicts of Interest

The authors declare no conflict of interest.

References

  1. Chinese Pharmacopoeia Commission. Pharmacopoeia of the People’s Republic of China, 1st ed.; China Medical Science and Technology Press: Beijing, China, 2015; Volume I, pp. 86–87. ISBN 978-7-5067-7337-9. [Google Scholar]
  2. Zhang, Q.Y.; Ye, M. Chemical analysis of the Chinese herbal medicine Gan-Cao (licorice). J. Chromatogr. A 2009, 1216, 1954–1969. [Google Scholar] [CrossRef] [PubMed]
  3. Qiao, X.; Song, W.; Ji, S.; Wang, Q.; Guo, D.A.; Ye, M. Separation and characterization of phenolic compounds and triterpenoid saponins in licorice (Glycyrrhiza. uralensis) using mobile phase-dependent reversed-phase × reversed-phase comprehensive two-dimensional liquid chromatography coupled with mass spectrometry. J. Chromatogr. A 2015, 1402, 36–45. [Google Scholar] [PubMed]
  4. Karkanis, A.; Martins, N.; Petropoulos, S.A.; Ferreira, I.C.F.R. Phytochemical composition, health effects, and crop management of liquorice (Glycyrrhiza. glabra L.): Α medicinal plant. Food Rev. Int. 2016, 1–22. [Google Scholar] [CrossRef]
  5. Li, W.; Asada, Y.; Yoshikawa, T. Flavonoid constituents from Glycyrrhiza. glabra hairy root cultures. Phytochemistry 2000, 55, 447–456. [Google Scholar] [CrossRef]
  6. Adianti, M.; Aoki, C.; Komoto, M.; Deng, L.; Shoji, I.; Wahyuni, T.S.; Lusida, M.I.; Soetjipto, H.; Fuchino, N.; Hotta Kawahara, H. Anti-hepatitis C virus compounds obtained from Glycyrrhiza. uralensis and other Glycyrrhiza. species. Microbiol. Immunol. 2014, 58, 180–187. [Google Scholar] [CrossRef] [PubMed]
  7. Wolkerstorfer, A.; Kurz, H.; Bachhofner, N.; Szolar, O.H. Glycyrrhizin inhibits influenza A virus uptake into the cell. Antiviral Res. 2009, 83, 171–178. [Google Scholar] [CrossRef] [PubMed]
  8. Ashfaq, U.A.; Masoud, M.S.; Nawaz, Z.; Riazuddin, S. Glycyrrhizin as antiviral agent against hepatitis C virus. J. Transl. Med. 2011, 9, 112. [Google Scholar] [CrossRef] [PubMed]
  9. Fujisawa, Y.; Sakamoto, M.; Matsushita, M.; Fujita, T.; Nishioka, K. Glycyrrhizin inhibits the lytic pathway of complement—possible mechanism of its anti-inflammatory effect on liver cells in viral hepatitis. Micrrobiol. Immunol. 2000, 44, 799–804. [Google Scholar] [CrossRef]
  10. Fu, Y.; Chen, J.; Li, Y.J.; Zheng, Y.F.; Li, P. Antioxidant and anti-inflammatory activities of six flavonoids separated from licorice. Food Chem. 2013, 141, 1063–1073. [Google Scholar] [CrossRef] [PubMed]
  11. Chu, X.; Ci, X.X.; Wei, M.M.; Yang, X.F.; Cao, Q.J.; Guan, M.F.; Li, H.Y.; Deng, Y.H.; Feng, H.H.; Deng, X.M. Licochalcone A inhibits lipopolysaccharide-induced inflammatory response in vitro and in vivo. J. Agric. Food Chem. 2012, 60, 3947–3954. [Google Scholar] [CrossRef] [PubMed]
  12. Li, C.M.; Eom, T.K.; Jeong, Y.H. Glycyrrhiza. glabra L. extract inhibits LPS-induced inflammation in RAW macrophages. J. Nutr. Sci. Vitaminol. 2015, 61, 375–381. [Google Scholar] [CrossRef] [PubMed]
  13. Dong, Y.; Zhao, M.; Zhao, T.; Feng, M.; Chen, H.; Zhuang, M.; Lin, L. Bioactive profiles, antioxidant activities, nitrite scavenging capacities and protective effects on H2O2-injured PC12 cells of Glycyrrhiza. glabra L. leaf and root extracts. Molecules 2014, 19, 9101–9113. [Google Scholar] [CrossRef] [PubMed]
  14. Vaya, J.; Belinky, P.A.; Aviram, M. Antioxidant constituents from licorice roots: Isolation, structure elucidation and antioxidative capacity toward LDL oxidation. Free Radic. Biol. Med. 1997, 23, 302–313. [Google Scholar] [CrossRef]
  15. Zheng, Y.F.; Wei, J.H.; Fang, S.Q.; Tang, Y.P.; Cheng, H.B.; Wang, T.L.; Li, C.Y.; Peng, G.P. Hepatoprotective triterpene saponins from the roots of Glycyrrhiza. inflata. Molecules 2015, 20, 6273–6283. [Google Scholar] [CrossRef] [PubMed]
  16. Sil, R.; Ray, D.; Chakraborti, A.S. Glycyrrhizin ameliorates metabolic syndrome-induced liver damage in experimental rat model. Mol. Cell. Biochem. 2015, 409, 177–189. [Google Scholar] [CrossRef] [PubMed]
  17. Chen, M.; Christensen, S.B.; Blom, J.; Lemmich, E.; Nadelmann, L.; Fich, K.; Theander, T.G.; Kharazmi, A. Licochalcone A, a novel antiparasitic agent with potent activity against human pathogenic protozoan species of Leishmania. Antimicrob. Agents Chemother. 1993, 37, 2550–2556. [Google Scholar] [CrossRef] [PubMed]
  18. Gupta, V.K.; Fatima, A.; Faridi, U.; Negi, A.S.; Shanker, K.; Kumar, J.K.; Rahuja, N.; Luqman, S.; Sisodia, B.S.; Saikia, D.; et al. Antimicrobial potential of Glycyrrhiza. glabra roots. J. Ethnopharmacol. 2008, 116, 377–380. [Google Scholar] [CrossRef] [PubMed]
  19. Fatima, A.; Gupta, V.K.; Luqman, S.; Negi, A.S.; Kumar, J.K.; Shanker, K.; Saikia, D.; Srivastava, S.; Darokar, M.P.; Khanuja, S.P.S. Antifungal activity of Glycyrrhiza. glabra extracts and its active constituent glabridin. Phytother. Res. 2009, 23, 1190–1193. [Google Scholar] [CrossRef] [PubMed]
  20. Asha, M.K.; Debraj, D.; Prashanth, D.S.; Edwin, J.R.; Srikanth, H.S.; Muruganantham, N.; Dethe, S.M.; Anirban, B.; Jaya, B.; Deepak, M.; et al. In vitro anti-Helicobacter pylori activity of a flavonoid rich extract of Glycyrrhiza glabra and its probable mechanisms of action. J. Ethnopharmacol. 2013, 145, 581–586. [Google Scholar] [CrossRef] [PubMed]
  21. Cheema, H.S.; Prakash, O.; Pal, A.; Khan, F.; Bawankule, D.U.; Darokar, M.P. Glabridin induces oxidative stress mediated apoptosis like cell death of malaria parasite Plasmodium falciparum. Parasitol. Int. 2014, 63, 349–358. [Google Scholar] [CrossRef] [PubMed]
  22. Chakotiya, A.S.; Tanwar, A.; Narula, A.; Sharma, R.K. Alternative to antibiotics against Pseudomonas aeruginosa: Effects of Glycyrrhiza. glabra on membrane permeability and inhibition of efflux activity and biofilm formation in Pseudomonas aeruginosa and its in vitro time-kill activity. Microb. Pathog. 2016, 98, 98–105. [Google Scholar] [CrossRef] [PubMed]
  23. Smolarczyk, R.; Cichoń, T.; Matuszczak, S.; Mitrus, I.; Lesiak, M.; Kobusińska, M.; Kamysz, W.; Jarosz, M.; Sieroń, A.; Szala, S. The role of glycyrrhizin, an inhibitor of HMGB1 protein, in anticancer therapy. Arch. Immunol. Ther. Exp. 2012, 60, 391–399. [Google Scholar] [CrossRef] [PubMed]
  24. Kwon, S.J.; Park, S.Y.; Kwon, G.T.; Lee, K.W.; Kang, Y.H.; Choi, M.S.; Yun, J.W.; Jeon, J.H.; Jun, J.G.; Park, J.H.Y. Licochalcone E present in licorice suppresses lung metastasis in the 4T1 mammary orthotopic cancer model. Cancer Prev. Res. 2013, 6, 603–613. [Google Scholar] [CrossRef] [PubMed]
  25. He, S.Q.; Gao, M.; Fu, Y.F.; Zhang, Y.N. Glycyrrhizic acid inhibits leukemia cell growth and migration via blocking AKT/mTOR/STAT3 signaling. Int. J. Clin. Exp. Pathol. 2015, 8, 5175–5181. [Google Scholar] [PubMed]
  26. Kamei, J.; Nakamura, R.; Ichiki, H.; Kubo, M. Antitussive principles of Glycyrrhizae radix, a main component of the Kampo preparations Bakumondo-to (Mai-men-dong-tang). Eur. J. Pharmacol. 2003, 469, 159–163. [Google Scholar] [CrossRef]
  27. Ram, A.; Mabalirajan, U.; Das, M.; Bhattacharya, I.; Dinda, A.K.; Gangal, S.V.; Ghosh, B. Glycyrrhizin alleviates experimental allergic asthma in mice. Int. Immunopharmacol. 2006, 6, 1468–1477. [Google Scholar] [CrossRef] [PubMed]
  28. Shin, Y.W.; Bae, E.A.; Lee, B.; Seung, H.L.; Jeong, A.K.; Kim, Y.S.; Kim, D.H. In vitro and in vivo antiallergic effects of Glycyrrhiza glabra and its components. Planta Med 2007, 73, 257–261. [Google Scholar] [CrossRef] [PubMed]
  29. Qiao, X.; Ji, S.; Yu, S.W.; Lin, X.H.; Jin, H.W.; Duan, Y.K.; Zhang, L.R.; Guo, D.A.; Ye, M. Identification of key licorice constituents which interact with cytochrome P450: Evaluation by LC/MS/MS cocktail assay and metabolic profiling. AAPS J. 2014, 16, 101–113. [Google Scholar] [CrossRef] [PubMed]
  30. Artursson, P.; Karlsson, J. Correlation between oral drug absorption in humans and apparent drug permeability coefficients in human intestinal epithelial (Caco-2) cells. Biochem. Biophys. Res. Commun. 1991, 175, 880–885. [Google Scholar] [CrossRef]
  31. Yee, S. In vitro permeability across Caco-2 cells (colonic) can predict in vivo (small intestinal) absorption in man-fact or myth. Pharm. Res. 1997, 14, 763–766. [Google Scholar] [CrossRef] [PubMed]
  32. Yang, X.W.; Yang, X.D.; Wang, Y.; Ma, L.; Zhang, Y.; Yang, X.G.; Wang, K. Establishment of Caco-2 cell monolayer model and standard operation procedure for assessing intestinal absorption of chemical components of traditional Chinese medicine. J. Chin. Integr. Med. 2007, 5, 634–641. [Google Scholar] [CrossRef]
  33. U.S. Department of Health and Human Services, Food and Drug Administration, Center for Drug Evaluation and Research (CDER), Center for Veterinary Medicine (CVM). Guidance for Industry, Bioanalytical Method Validation. Available online: http://www.fda.gov/ucm/groups/fdagov-public/@fdagov-drugs-gen/documents/document/ucm368107.pdf. (accessed on 27 September 2017).
  34. Yang, X.W. Absorption, Distribution, Metabolism, Excretion, Toxicity and Activity in Traditional Chinese Medicines, 1st ed.; China Medical Science and Technology Press: Beijing, China, 2006; pp. 1075–1104. ISBN 7-5067-3337-4. [Google Scholar]
  35. Tian, X.J.; Yang, X.W.; Yang, X.D.; Wang, K. Studies of intestinal permeability of 36 flavonoids using Caco-2 cell monolayer model. Int. J. Pharm. 2009, 367, 58–64. [Google Scholar] [CrossRef] [PubMed]
  36. Zhang, L.Q.; Huang, Y.D.; Yang, X.W. Intestinal permeability of liquiritin and isoliquiritin in the Caco-2 cell monolayer model. J. Chin. Pharm. Sci. 2010, 19, 451–458. [Google Scholar] [CrossRef]
  37. Chan, O.H.; Stewart, B.H. Physicochemical and drug-delivery considerations for oral drug bioavailability. Drug Discov. Today 1996, 1, 461–473. [Google Scholar] [CrossRef]
  38. Wu, X.W.; Wei, W.; Yang, X.W.; Zhang, Y.B.; Xu, W.; Yang, Y.F.; Zhong, G.Y.; Liu, H.N.; Yang, S.L. Anti-inflammatory phenolic acid esters from the roots and rhizomes of Notopterygium. incisium and their permeability in the human Caco-2 monolayer cell model. Molecules 2017, 22, 935. [Google Scholar] [CrossRef] [PubMed]
  39. Yang, X.W. Discovery strategy for effective and active constituents of Chinese material medica based on the processes of metabolism and disposition in intra-body. China J. Chin. Mater. Med. 2007, 32, 365–370. [Google Scholar]
  40. Yang, X.W. Substance basis research on Chinese materia medica is one of key scientific problems of inheriting, development and innovation of Chinese materia medica. China J. Chin. Mater. Med. 2015, 40, 3429–3434. [Google Scholar]
Sample Availability: Samples of the compounds 110 are not available from the authors.
Figure 1. The structures of compounds 110 isolated from Glycyrrhizae radix et rhizoma and three related compounds 1113.
Molecules 22 01627 g001
Figure 2. The transport percentage as a function of time at 50 μM (A) and transport rates as a function of concentration at 90 min (B) of the compounds 2 and 3 in Caco-2 cell monolayer. Data are the mean ± SD (n = 3).
Molecules 22 01627 g002
Figure 3. Kinetics curves of the compounds 2 and 3 transports in Caco-2 monolayer from apical to basolateral direction at 50 μM. (A) AP→BL, (B) BL→AP. Data are the mean ± SD (n = 3).
Molecules 22 01627 g003
Figure 4. The transport percentage as a function of time at 50 μM (A) and transport rates as a function of concentration at 90 min (B) of the chalcones 47 in Caco-2 cell monolayer. Data are the mean ± SD (n = 3).
Molecules 22 01627 g004
Figure 5. Transport kinetics curves of the chalcones 47 in Caco-2 monolayer from apical to basolateral direction at 50 μM. Data are the mean ± SD (n = 3).
Molecules 22 01627 g005
Figure 6. The transport percentage as a function of time at 50 μM (A), transport rate as a function of concentration at 90 min (B) and transport kinetics curves (C) of the flavonone 9 in Caco-2 monolayer. Data are the mean ± SD (n = 3).
Molecules 22 01627 g006
Figure 7. The relationship between log (Papp AP→BL × MW1/2) and log D (pH = 7.35) for seven chalcones (48, 11, and 12).
Molecules 22 01627 g007
Table 1. The bidirectional Papp values of compounds 113 in Caco-2 cell monolayer (n = 3). a
AnalytesPapp AP→BL b (×10−6 cm/s)Papp BL→AP c (×10−6 cm/s)Efflux Ratio dMWLog D (pH = 7.35)
100822−8.02
21.55 ± 0.091.65 ± 0.951.06646−2.94
312.63 ± 0.4014.00 ± 1.301.114702.57
41.68 ± 0.131.78 ± 0.031.063384.48
524.71 ± 2.8030.18 ± 2.401.222862.91
622.51 ± 1.0026.44 ± 1.301.173384.62
720.70 ± 1.0023.80 ± 0.301.152703.43
800550−0.94
917.80 ± 0.6015.68 ± 0.300.882562.95
1000550−0.23
1114.60 ± 0.109.35 ± 0.430.642562.50
120.87 ± 0.020.77 ± 0.070.89418−0.48
130.54 ± 0.020.53 ± 0.030.984180.02
a The incubation time was up to 90 min. b Transport of assayed compounds from AP to BL direction. c Transport of assayed compounds from BL to AP direction. d The ratio of Papp BL→AP to Papp AP→BL.

