Deep Convolutional Neural Network-Based Early Automated Detection of Diabetic Retinopathy Using Fundus Image

1
School of Information and Communication, National University of Defense Technology, Wuhan 430019, China
2
School of Computer, National University of Defense Technology, Changsha 410073, China
*
Author to whom correspondence should be addressed.
Molecules 2017, 22(12), 2054; https://doi.org/10.3390/molecules22122054
Submission received: 10 November 2017
/
Revised: 20 November 2017
/
Accepted: 22 November 2017
/
Published: 23 November 2017
(This article belongs to the Special Issue Selected Papers from the Second CCF Bioinformatics Conference (CBC 2017))
Abstract
:The automatic detection of diabetic retinopathy is of vital importance, as it is the main cause of irreversible vision loss in the working-age population in the developed world. The early detection of diabetic retinopathy occurrence can be very helpful for clinical treatment; although several different feature extraction approaches have been proposed, the classification task for retinal images is still tedious even for those trained clinicians. Recently, deep convolutional neural networks have manifested superior performance in image classification compared to previous handcrafted feature-based image classification methods. Thus, in this paper, we explored the use of deep convolutional neural network methodology for the automatic classification of diabetic retinopathy using color fundus image, and obtained an accuracy of 94.5% on our dataset, outperforming the results obtained by using classical approaches.
1. Introduction
The number of people diagnosed as having diabetes has increased dramatically over the last several decades, and diabetes increases the risk of a range of eye diseases, of which diabetic retinopathy is one of the most severe [1]. Moreover, diabetic retinopathy is the main cause of blindness in the mid-age population [2]. Despite sustained efforts having been made, early detection of diabetic retinopathy is a time-consuming process even for a well–trained clinician, which may result in delayed treatment, miscommunication, etc. The importance of an automatic method for diabetic retinopathy detection has been recognized. In our study, we focus on the classification of retinal images into normal images and diabetic retinopathy images (sample frames used for our classification problem are given in Figure 1). Previous efforts using image feature extraction and machine learning methods made good progress. The features used for the classifiers include hard exudates [3,4], red lesions [5], micro-aneurysms and blood vessel detection [6], etc., while the classifiers used for the task contain neural networks, sparse representation classifiers, linear discriminant analysis (LDA), support vector machine (SVM), k-nearest neighbors (KNN) algorithm and so on. However, none of the handcrafted features can cover all the symptoms of diabetic retinopathy in the images, and a large fraction of cases turn out to be normal while much time has been spent diagnosing normal cases. Consequently, the practical clinical applications of the automatic diagnosing system are limited.
Recent advances in convolutional neural networks (CNNs) have made it a state-of-the-art technique in image classification tasks [7], and its variants have begun to dominate many fields in computer vision, such as object detection [8], image classification [9], object tracking [10], edge detection [11]. Instead of making essential use of handcrafted features, CNN can learn a hierarchy of features, which can be used for image classification purposes. As the hierarchy approach is available to learn more complex features, as well as translation and distortion features in higher layers, the accuracy of the CNN-based image classification method can be higher. Based on this assumption, we explore the use of the CNN-based method for the diabetic retinopathy test in this work. Moreover, a specific multi-layer CNN architecture is designed, and experiments are conducted on real retina data. In addition, the results obtained demonstrate our assumption as we achieve 94.5% accuracy, which ranks as the highest in comparison with previous handcrafted feature-based classifiers. This paper is organized as follows: Section 2 describes the preprocessing method and gives an overview of the CNN architecture used in this work, while Section 3 presents the results to demonstrate the performance of the proposed approach compared to previous handcrafted feature-based classification methods. The conclusion and future work are discussed in Section 4.
2. Methodology
2.1. Data Augmentation
Until recently, datasets of labeled images with diabetic retinopathy were relatively small. Here, we used the data provided by Kaggle Community [12]. Indeed, the shortcomings of small image datasets have been widely recognized, thus, data augmentation is needed to artificially enlarge the datasets using label-preserving transformation, which can reduce overfitting on the image data and increase the performance of the algorithm [13]. In our experiment, we apply translation, stretching, rotation and flipping to the labeled dataset. A summary of the transformations is given in Table 1, while the sample transformed frames are presented in Figure 2. Five different transformation types are used in our experiment, including rotation, flipping, shearing, rescaling and translation. For each type, the parameter details are given in Table 1.
2.2. Convolutional Neural Network-Based Image Classification
The convolutional neural network (CNN) belongs to the feed-forward artificial neural network (ANN), which is very similar to ordinary neural networks. The CNN is a well-known deep learning architecture, in which individual neurons are tiled in such a way that they respond to overlapping regions in the visual fields [14]. CNNs are an important class of learnable representation applications, and they were inspired by biological neural networks. Numerous variants have been proposed over last several years. However, the basic components are very similar. CNNs consist of alternating convolution and pooling operations [15]. Typically, the convolutional layers are interspersed with pooling layers to reduce computation time, and build up further spatial and configuration invariance [16]; the last few layers (close to the outputs) will be fully connected 1-dimensional layers. In more detail, a feed-forward neural network can be viewed as a function f of mapping data x:
Each function takes ( is the input data x) as input with a learnable parameter vector . L denotes the depth of the neural network. Although the type and sequence of functions are usually handcrafted, the parameters can be discriminatively learned from example data such that the resulting function f realizes a useful mapping. Formally, in a CNN, each will be a M×N×C array. As our problem can be simplified as a binary-classification problem, we can define the loss function of the CNN as:
where n is the number of samples, is the true label of sample i. The training problem can be converted to training a neural network to minimize the loss function L. Figure 3 gives the general architecture of a CNN network, which consists of multiple layers of small neurons. The results of these collections are then tiled so that they overlap to obtain a better representation of the original image (such as edges in the image). Convolutional layers consist of a rectangle grid of neurons, which takes a rectangle region of the previous layer as input. Moreover, there may be several grids in each convolutional layer, using potentially different filters. Typically, there is a pooling layer after each convolutional layer, which are subsampled from the previous convolutional layer. This pooling can be carried out in several ways, such as the average, maximum, etc. Finally, after several convolutional layers and max pooling layers, a fully connected layer (or several layers) will be built using outputs from previous layers (maybe the fully connected, pooling or convolutional layer), which is used as a compact feature to describe the whole input image. The network is optimized by backpropagation and stochastic gradient descent. Note that the forward and backward propagations may differ depending on the type of the layer.
Several different CNN architectures have been proposed and evaluated in our experiments. The depth of the tested neural network ranges from 9–18, and the convolution kernel size ranges from 1 to 5. To fit the input size of the CNN, we resize the image size to 224 × 224 × 3. The final architecture of the network used in our work is given in Table 2. For a given input, the network outputs two probabilities that sum up to 1, one for each class (our problem is a binary classification problem). In our experiment, 800 labeled images are used to train the neural network, while 200 images are used to evaluate the performance of the trained neural network.
3. Experimental Results
To evaluate the performance of the proposed method, the classification task was conducted using the CNN and Gradient boosting machines. Moreover, to compare the results obtained by automatic classification algorithms with the performance of human judgement, a human specialist is introduced to label the images as ground-truth.
In more detail, four different feature extraction approaches have been employed: hard exudates, red lesions, micro-aneurysms and blood vessel detection. Two different kinds of classifiers were trained for the classification task: one kind of which combines the aforementioned extracted features and gradient boosting trees-based (GBM) classification method (Hard exudates + GBM, Red lesions + GBM, Micro-aneurysms + GBM and Blood vessel detection + GBM shown in Table 3.), and the other kind is the CNN-based methods (with or without data augmentation). Specifically, we use the default hyper parameters for GBM, with the number of classes set to 2, and the maximum depth set to 6. The GBM package used in this paper is the eXtreme Gradient Boosting method (XGBoost) [17], as it shows superior performance in our experiments when compared to other approaches (i.e., Support Vector Machine, Random Forest). Regarding implementation of the CNN, we made use of the R package named “MXNet” [18]. A visualization of the trained neural networks is given in Figure 4.
The classification accuracies are given in Table 3. As can be seen from the table, the CNN-based method provides superior performance compared to other methods, which supports the assumption made in the introduction section. Also, as can be seen from the table, the results obtained using the CNN with data augmentation are better than the CNN without data augmentation, and the reason may be that the data augmentation can be helpful for the CNN to deal with small rotation or translations during the data recording.
Our experiment was conducted on a Windows 8 operation system with Intel 4-Core 3.7GHz CPU, 16GB RAM, Dual AMD Filepro 512GB PCIe-based flash storage, and a Geforce 1070GPU. Although the training process of the CNN required 2 days, the trained network can provide the probability of diabetic retinopathy in less than 1 second, which can be used by clinicians in practice [19].
4. Discussion and Conclusions
With a limited number of medical staff, an automated system can significantly decrease the tedious manual labor involved in diagnosing large quantities of retinal images. Feature extraction-based diabetic retinopathy diagnosis has played a dominant role in previous studies. However, the progress made in deep convolutional neural networks has led to them becoming a state-of-the-art technique in optical image classification. In this paper, we explored the potential usage of the CNN in retinal image classification. The contribution of this paper is two-fold: firstly, we proposed a special neural network architecture for the diabetic retinopathy image classification task, which demonstrates superior performance over conventional feature extraction-based methods. Moreover, a data augmentation method was introduced for the proposed algorithm, which also improves the algorithm’s performance. The results are encouraging compared to the reports of human grading [20], thus a clinical evaluation will be undertaken in order to be able to integrate the presented algorithm into a tool to diagnose diabetic retinopathy [21].
Author Contributions
Kele Xu conceived and designed the experiments; Dawei Feng performed the experiments; Haibo Mi and Dawei Feng analyzed the data; Kele Xu contributed reagents/materials/analysis tools; Haibo Mi wrote the paper.
Conflicts of Interest
The authors declare no conflict of interest.
References
- Walter, T.; Klein, J.C.; Massin, P.; Erginay, A. A contribution of image processing to the diagnosis of diabetic retinopathy-detection of exudates in color fundus images of the human retina. IEEE Trans. Med. Imaging 2002, 21, 1236–1243. [Google Scholar] [CrossRef] [PubMed]
- Zheng, Y.; He, M.; Congdon, N. The worldwide epidemic of diabetic retinopathy. Indian J. Ophthalmol. 2012, 60, 428–431. [Google Scholar] [CrossRef] [PubMed]
- Sánchez, C.I.; García, M.; Mayo, A.; López, M.I.; Hornero, R. Retinal image analysis based on mixture models to detect hard exudates. Med. Image Anal. 2009, 13, 650–658. [Google Scholar] [CrossRef] [PubMed]
- Giancardo, L.; Meriaudeau, F.; Karnowski, T.P.; Li, Y.; Garg, S.; Tobin, K.W.; Chaum, E. Exudate-based diabetic macular edema detection in fundus images using publicly available datasets. Med. Image Anal. 2012, 16, 216–226. [Google Scholar] [CrossRef] [PubMed]
- Sánchez, C.I.; Hornero, R.; López, M.I.; Aboy, M.; Poza, J.; Abásolo, D. A novel automatic image processing algorithm for detection of hard exudates based on retinal image analysis. Med. Eng. Phys. 2008, 30, 350–357. [Google Scholar] [CrossRef] [PubMed] [Green Version]
- Zhang, B.; Karray, F.; Li, Q.; Zhang, L. Sparse Representation Classifier for microaneurysm detection and retinal blood vessel extraction. Inf. Sci. 2012, 200, 78–90. [Google Scholar] [CrossRef]
- LeCun, Y.; Bengio, Y.; Hinton, G. Deep learning. Nature 2015, 521, 436–444. [Google Scholar] [CrossRef] [PubMed]
- Sermanet, P.; Eigen, D.; Zhang, X.; Mathieu, M.; Fergus, R.; LeCun, Y. Overfeat: Integrated recognition, localization and detection using convolutional networks. Comput. Vis. Pattern Recognit. 2013, arXiv:1312.6229. [Google Scholar]
- He, K.; Zhang, X.; Ren, S.; Sun, J. Delving deep into rectifiers: Surpassing human-level performance on imagenet classification. In Proceedings of the IEEE International Conference on Computer Vision, Santiago, Chile, 7–13 December 2015. [Google Scholar]
- Ma, C.; Huang, J.B.; Yang, X.; Yang, M.H. Hierarchical Convolutional Features for Visual Tracking. In Proceedings of the IEEE International Conference on Computer Vision, Santiago, Chile, 7–13 December 2015. [Google Scholar]
- Shen, W.; Wang, X.; Wang, Y.; Bai, X.; Zhang, Z. DeepContour: A Deep Convolutional Feature Learned by Positive-sharing Loss for Contour Detection. In Proceedings of the IEEE Conference on Computer Vision and Pattern Recognition, Boston, MA, USA, 7–12 June 2015. [Google Scholar]
- Available online: https://www.kaggle.com/c/diabetic-retinopathy-detection (accessed on 10 March 2016).
- Krizhevsky, A.; Sutskever, I.; Hinton, G.E. Imagenet classification with deep convolutional neural networks. In Advances in Neural Information Processing Systems; MIT Press: Cambridge, MA, USA, 2012. [Google Scholar]
- Hubel, D.H.; Wiesel, T.N. Receptive fields and functional architecture of monkey striate cortex. J. Physiol. 1968, 195, 215–243. [Google Scholar] [CrossRef] [PubMed]
- Scherer, D.; Müller, A.; Behnke, S. Evaluation of pooling operations in convolutional architectures for object recognition. In Proceedings of the International Conference on Artificial Neural Networks, Thessaloniki, Greece, 15–18 September 2010. [Google Scholar]
- Chatfield, K.; Simonyan, K.; Vedaldi, A.; Zisserman, A. Return of the devil in the details: Delving deep into convolutional nets. In Proceedings of the British Machine Vision Conference, Nottingham, UK, 1–5 September 2014. [Google Scholar]
- Chen, T.; Guestrin, C. XGBoost: A Scalable Tree Boosting System. In Proceedings of the 22nd ACM Sigkdd International Conference on Knowledge Discovery and Data Mining, San Francisco, CA, USA, 13–17 August 2016. [Google Scholar]
- Chatfield, K.; Simonyan, K.; Vedaldi, A.; Zisserman, A. MXNet: A Flexible and Efficient Machine Learning Library for Heterogeneous Distributed Systems. In Proceedings of the Neural Information Processing Systems, Workshop on Machine Learning Systems, Barcelona, Spain, 5–10 December 2016; MIT Press: Cambridge, MA, USA. [Google Scholar]
- Valverde, C.; Garcia, M.; Hornero, R.; López-Gálvez, M.I. Automated detection of diabetic retinopathy in retinal images. Indian J. Ophthalmol. 2016, 64, 26–32. [Google Scholar] [CrossRef] [PubMed]
- Hansen, M.B.; Abràmoff, M.D.; Folk, J.C.; Mathenge, W.; Bastawrous, A.; Peto, T. Results of Automated Retinal Image Analysis for Detection of Diabetic Retinopathy from the Nakuru Study. PLoS ONE 2015, 10, e0139148. [Google Scholar] [CrossRef] [PubMed]
- Tufail, A.; Kapetanakis, V.V.; Salas-Vega, S.; Egan, C.; Rudisill, C.; Owen, C.G.; Anderson, V.; Louw, J.; Liew, G.; Bolter, L. An observational study to assess if automated diabetic retinopathy image assessment software can replace one or more steps of manual imaging grading and to determine their cost-effectiveness. Health Technol. Assess. 2016, 20, 1–72. [Google Scholar] [CrossRef] [PubMed]
Sample Availability: Not available. |
Figure 1.
Sample frames of the retina images. The first two frames in the top row come from normal subjects, while the two frames in the bottom row come from the patients who have diabetic retinopathy.
Figure 1.
Sample frames of the retina images. The first two frames in the top row come from normal subjects, while the two frames in the bottom row come from the patients who have diabetic retinopathy.
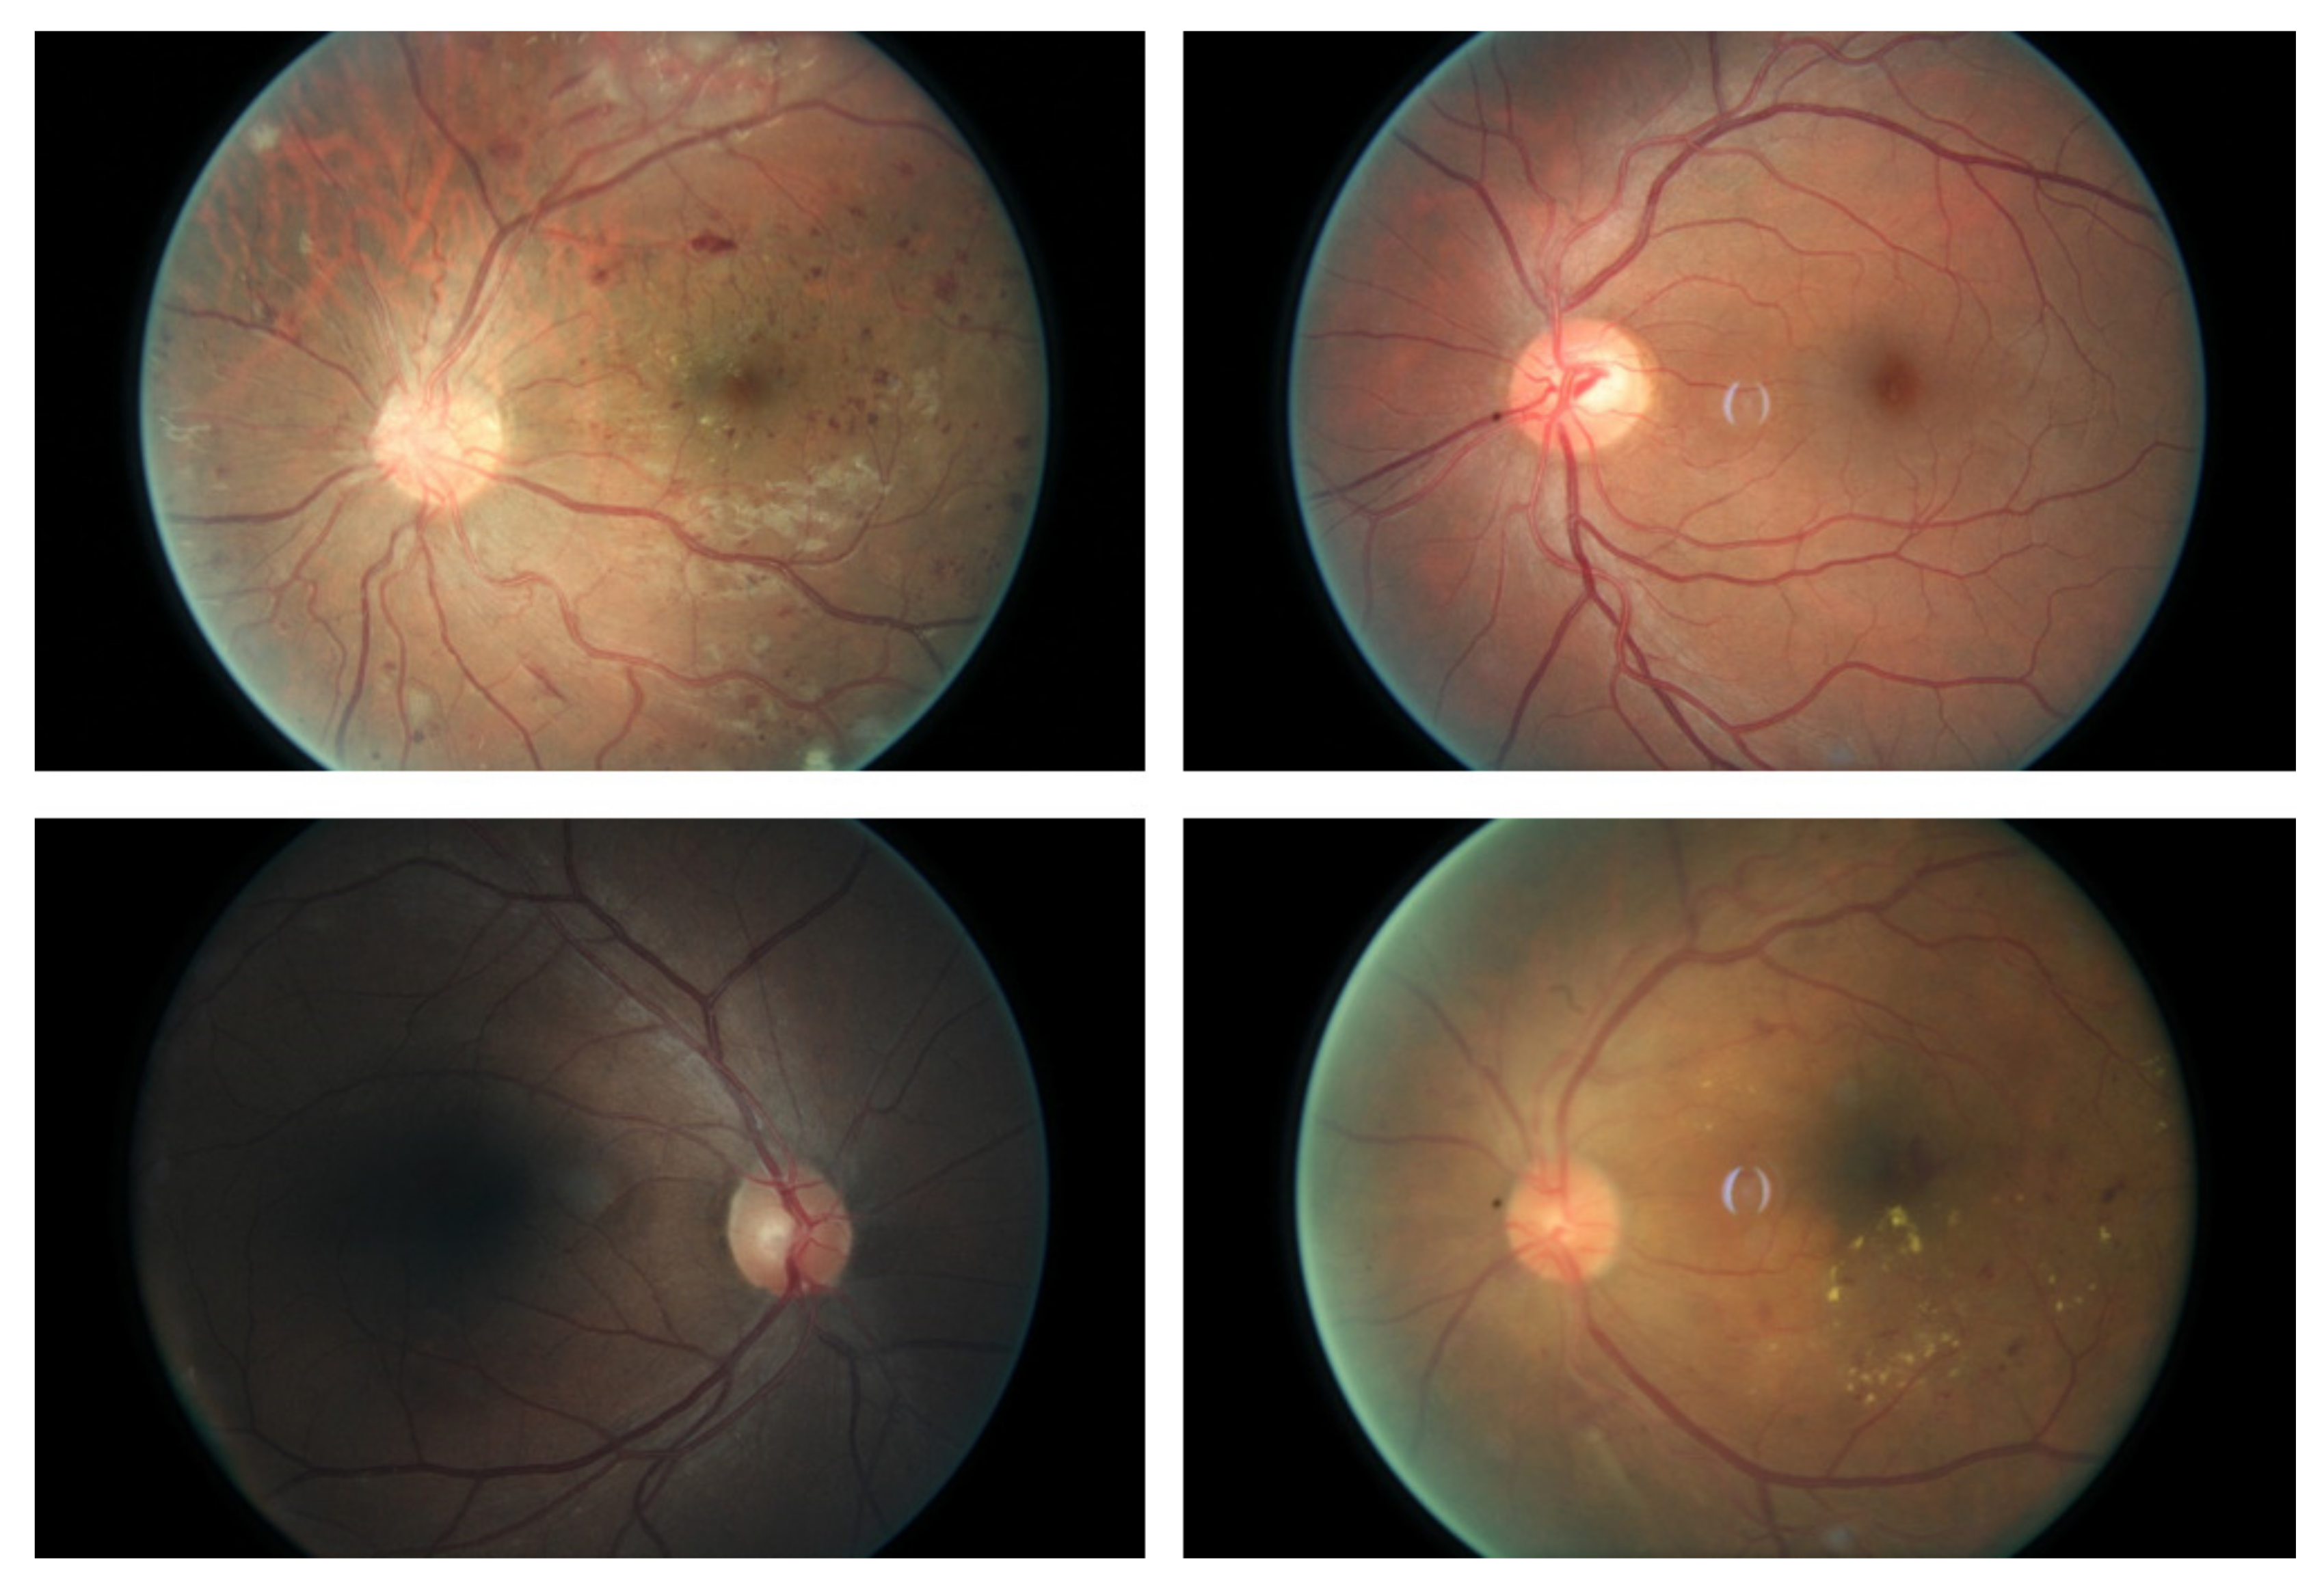
Figure 2.
Samples of the transformed frames.
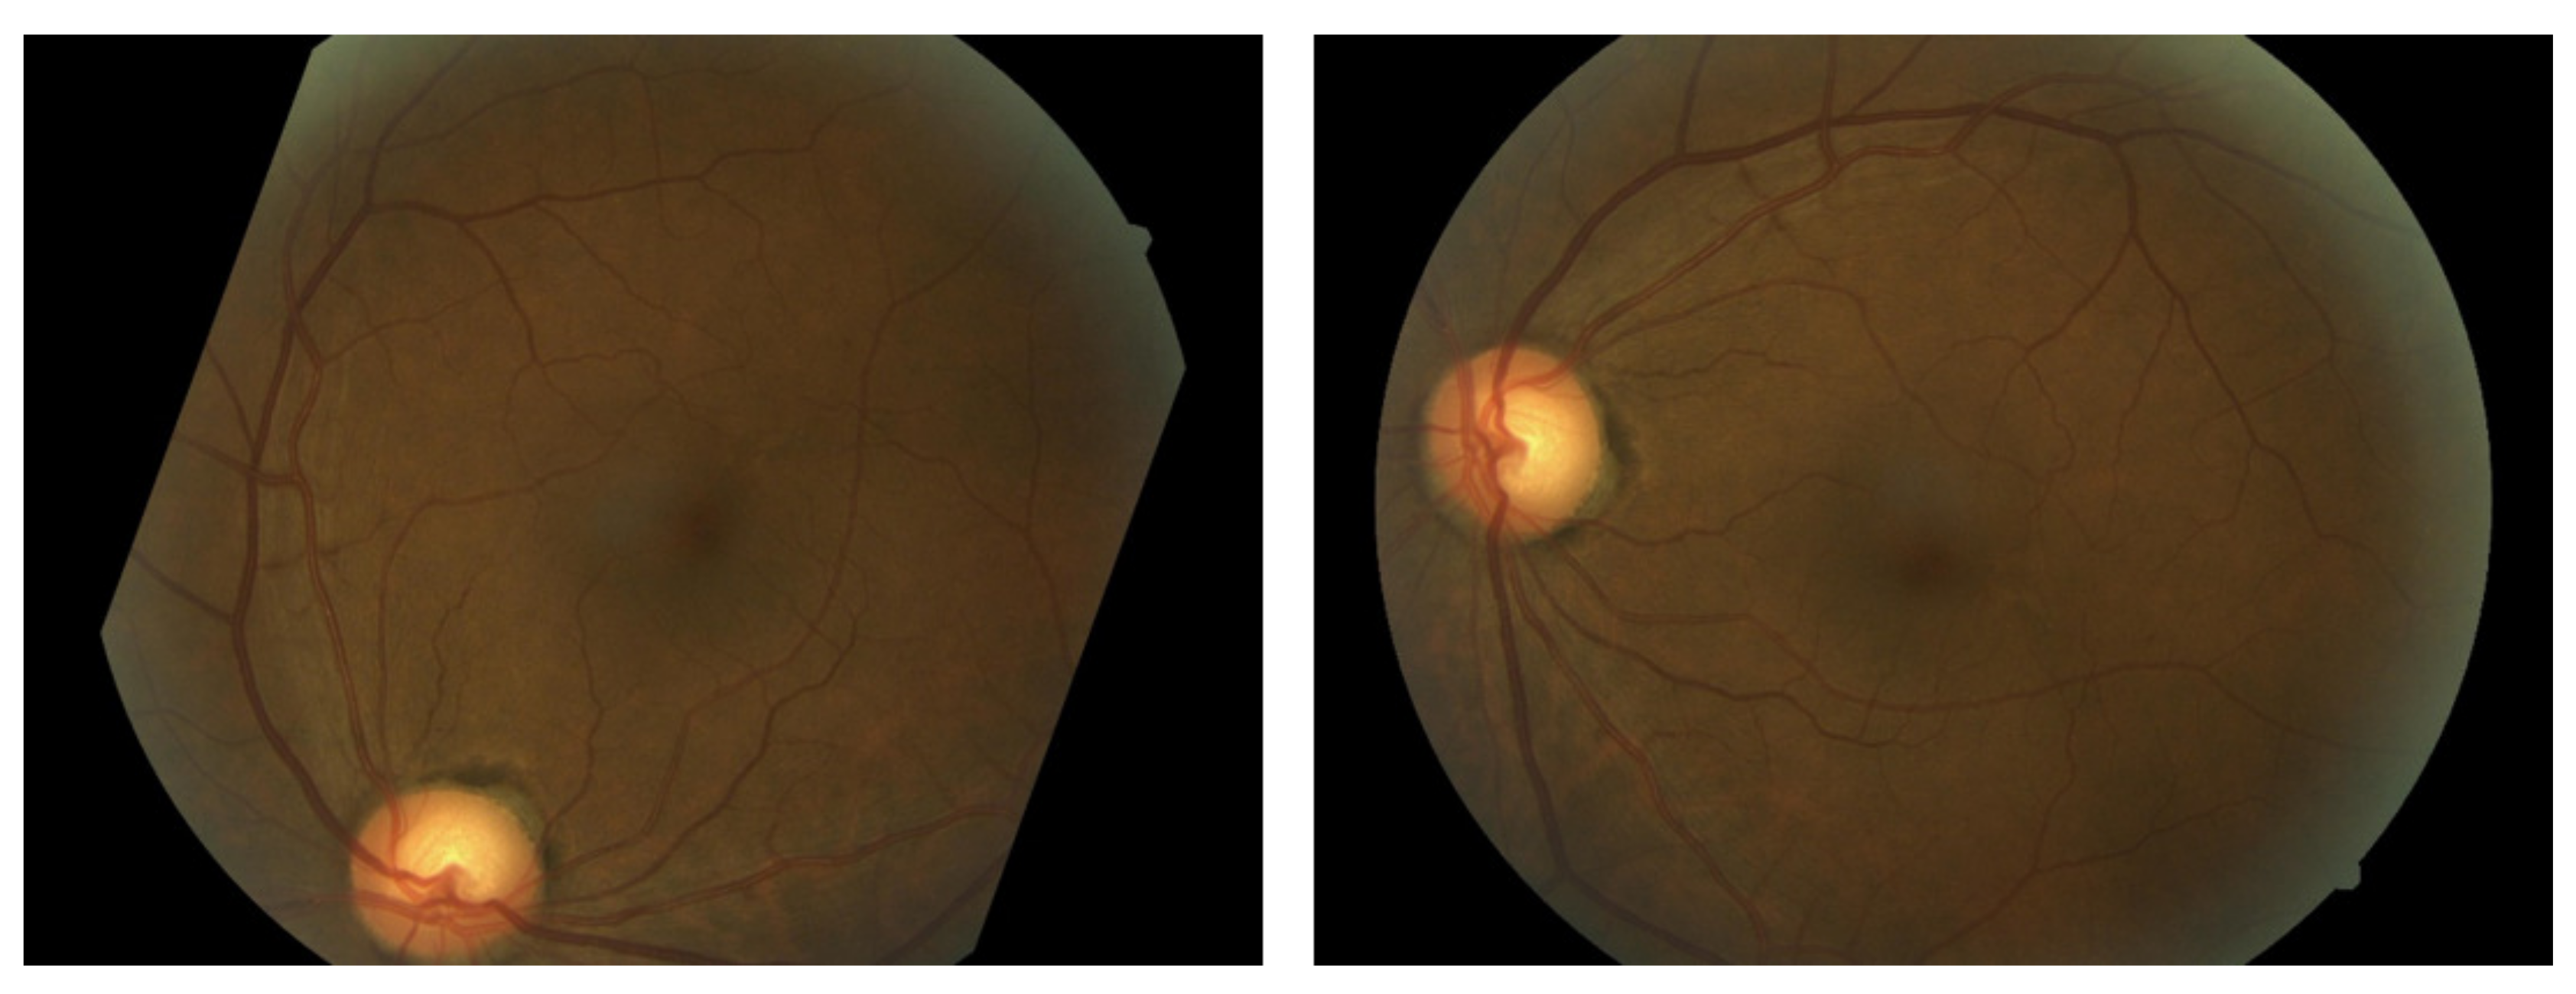
Figure 3.
An exemplary architecture of the convolutional neural network.
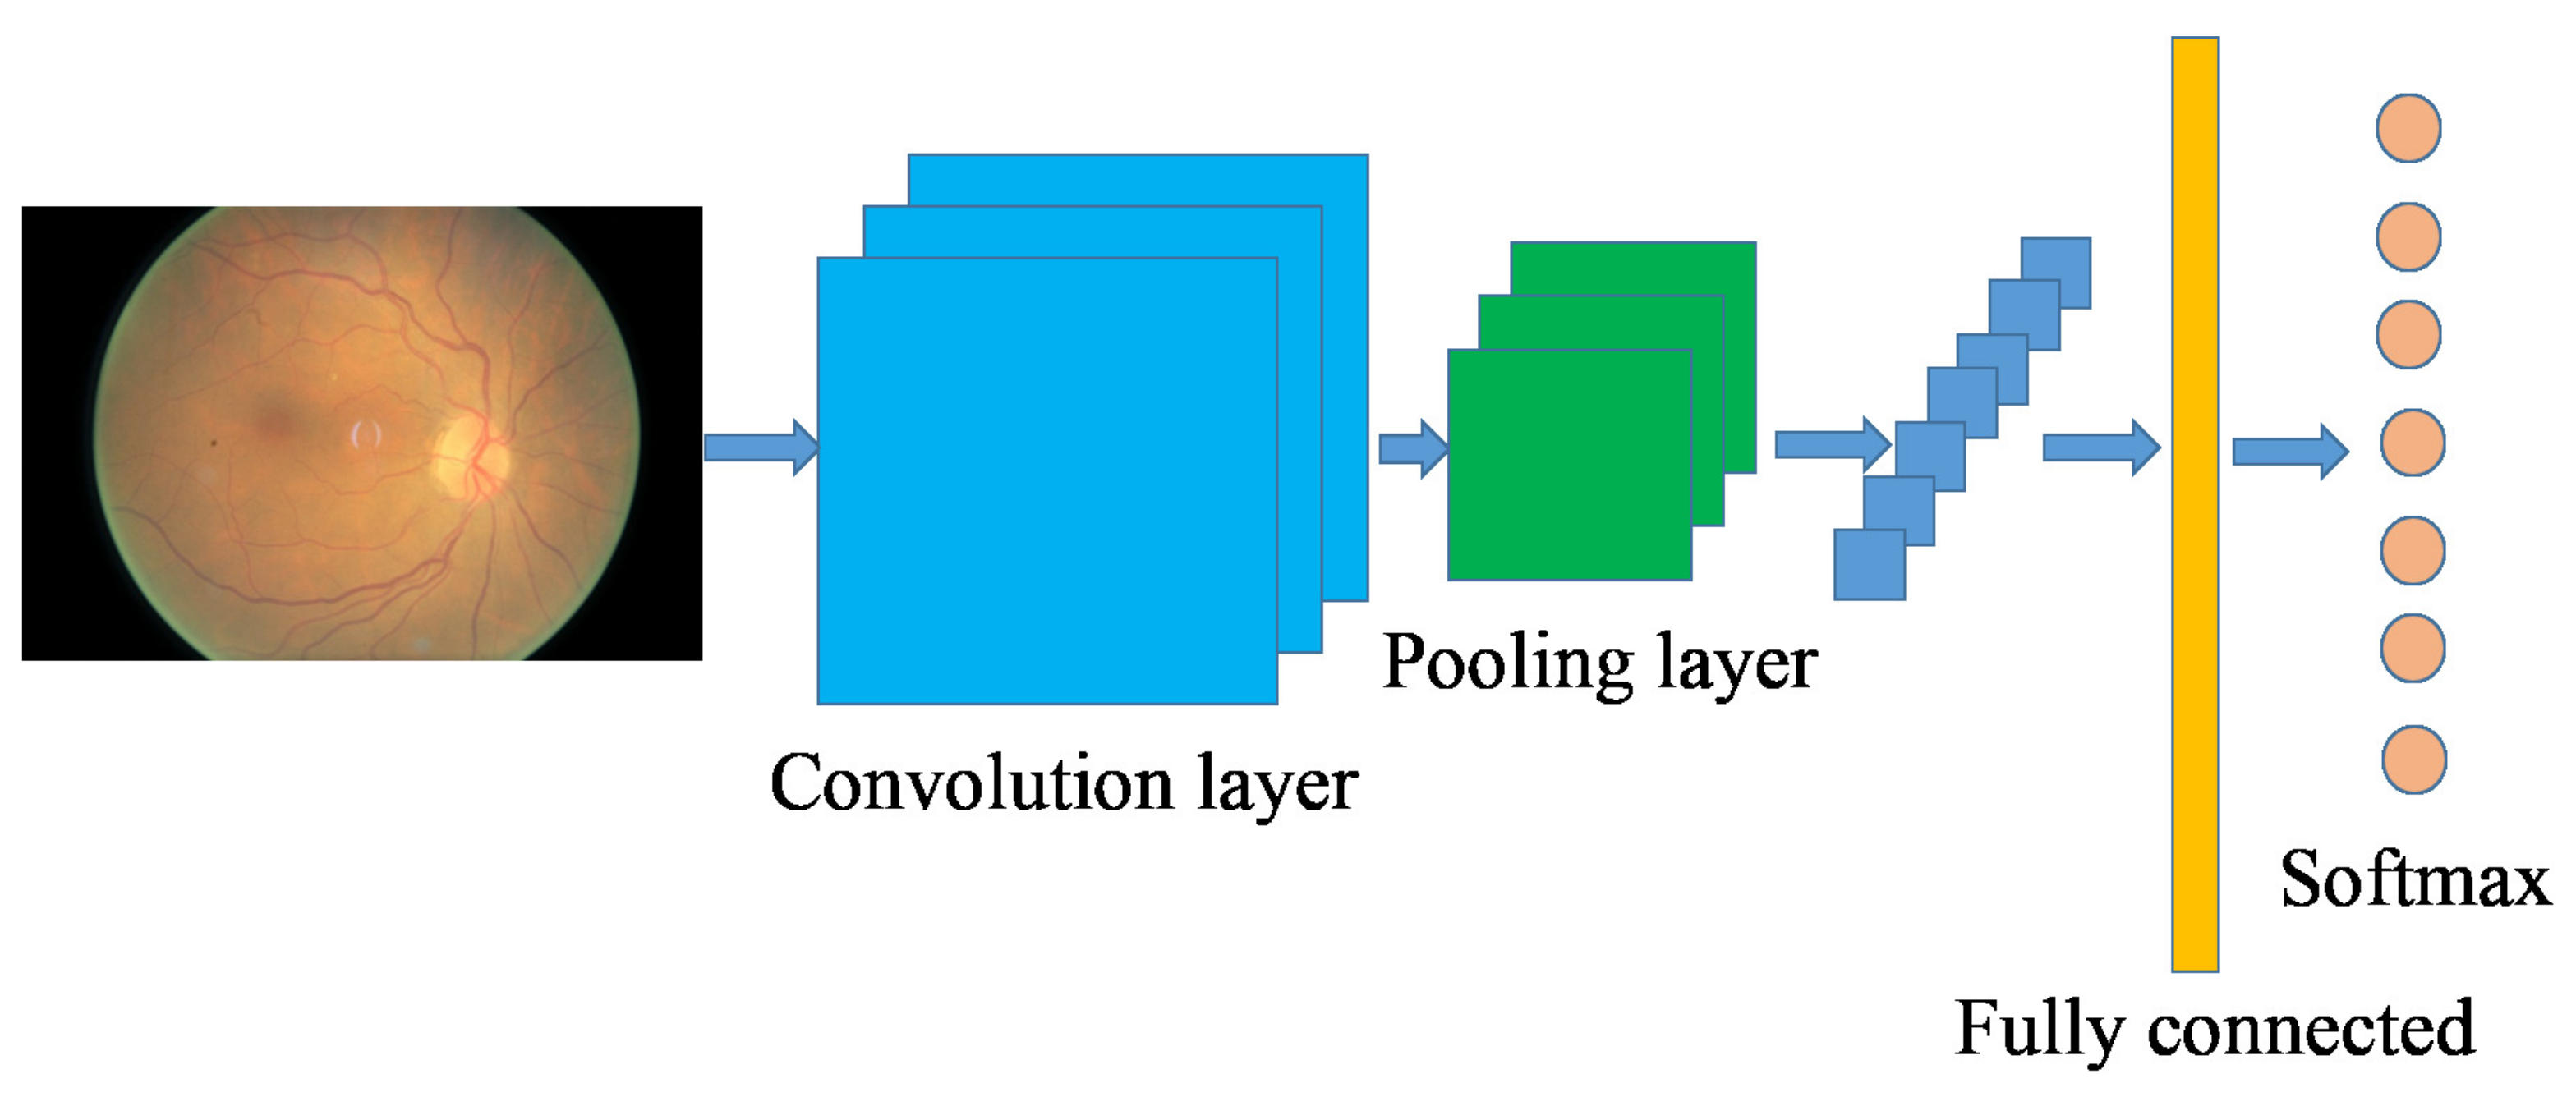
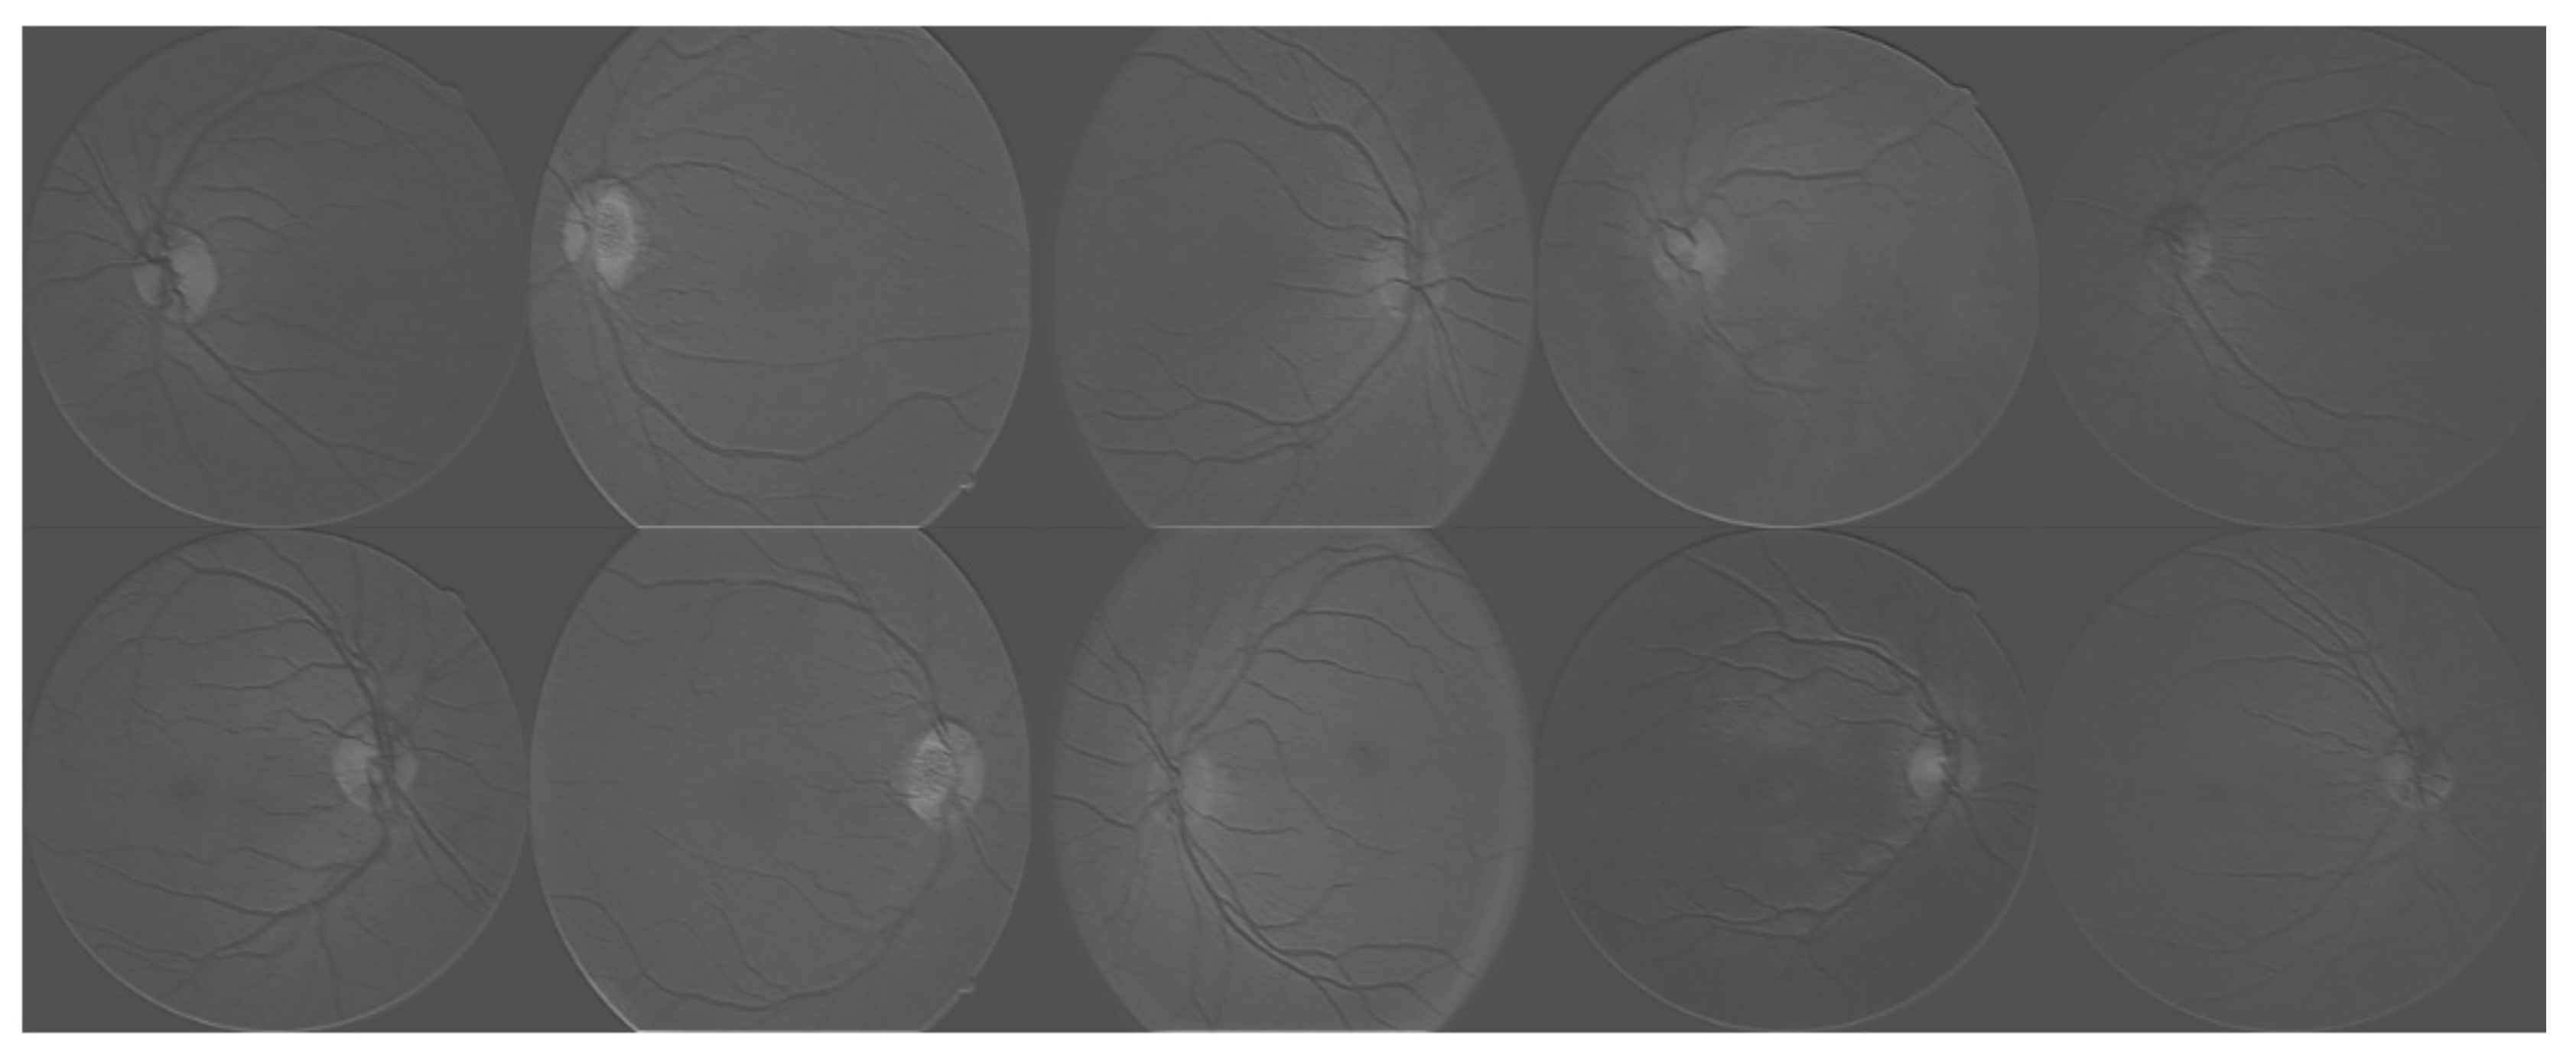
Figure 4.
Visualization of the trained neural networks. Each image represents the activations of the first layer during the forward pass.
Figure 4.
Visualization of the trained neural networks. Each image represents the activations of the first layer during the forward pass.


Table 1.
Data augmentation parameters.
| Transformation Type | Description |
|---|---|
| Rotation | 0–360 |
| Flipping | 0 (without flipping) or 1 (with flipping) |
| Shearing | Randomly with angle between −15 and 15 |
| Rescaling | Randomly with scale factor between 1/1.6 and 1.6 |
| Translation | Randomly with shift between −10 and 10 pixels |
Table 2.
Convolutional neural network (CNN) architecture used in our experiment.
| Output Shape | Description |
|---|---|
| 224 × 224 × 3 | input |
| 222 × 222 × 32 | 3 × 3 convolution, 32 filter |
| 220 × 220 × 32 | 3 × 3 convolution, 32 filter |
| 110 × 110 × 32 | 2 × 2 max-pooling |
| 108 × 108 × 64 | 3 × 3 convolution, 64 filter |
| 106 × 106 × 64 | 3 × 3 convolution, 64 filter |
| 53 × 53 × 64 | 2 × 2 max-pooling |
| 53 × 53 × 128 | 3 × 3 convolution, 128 filter |
| 51 × 51 × 128 | 3 × 3 convolution, 128 filter |
| 49 × 49 × 128 | 2 × 2 max-pooling |
| 24 × 24 × 256 | 3 × 3 convolution, 256 filter |
| 22 × 22 × 256 | 3 × 3 convolution, 256 filter |
| 11 × 11 × 256 | 2 × 2 max-pooling |
| 4096 | flatterned and fully connected |
| 1024 | fully connected |
| 2 | softmax |
Table 3.
Performance comparison with different approaches.
| Method | Accuracy |
|---|---|
| Hard exudates + GBM | 89.4% |
| Red lesions + GBM | 88.7% |
| Micro-aneurysms + GBM | 86.2% |
| Blood vessel detection + GBM | 79.1% |
| CNN without data augmentation | 91.5% |
| CNN with data augmentation | 94.5% |
© 2017 by the authors. Licensee MDPI, Basel, Switzerland. This article is an open access article distributed under the terms and conditions of the Creative Commons Attribution (CC BY) license (http://creativecommons.org/licenses/by/4.0/).
Share and Cite
MDPI and ACS Style
Xu, K.; Feng, D.; Mi, H. Deep Convolutional Neural Network-Based Early Automated Detection of Diabetic Retinopathy Using Fundus Image. Molecules 2017, 22, 2054. https://doi.org/10.3390/molecules22122054
AMA Style
Xu K, Feng D, Mi H. Deep Convolutional Neural Network-Based Early Automated Detection of Diabetic Retinopathy Using Fundus Image. Molecules. 2017; 22(12):2054. https://doi.org/10.3390/molecules22122054
Chicago/Turabian StyleXu, Kele, Dawei Feng, and Haibo Mi. 2017. "Deep Convolutional Neural Network-Based Early Automated Detection of Diabetic Retinopathy Using Fundus Image" Molecules 22, no. 12: 2054. https://doi.org/10.3390/molecules22122054