
Markers of Oxidative Stress and Antioxidant Defense in Romanian Patients with Type 2 Diabetes Mellitus and Obesity


 ,
,
Abstract
:1. Introduction
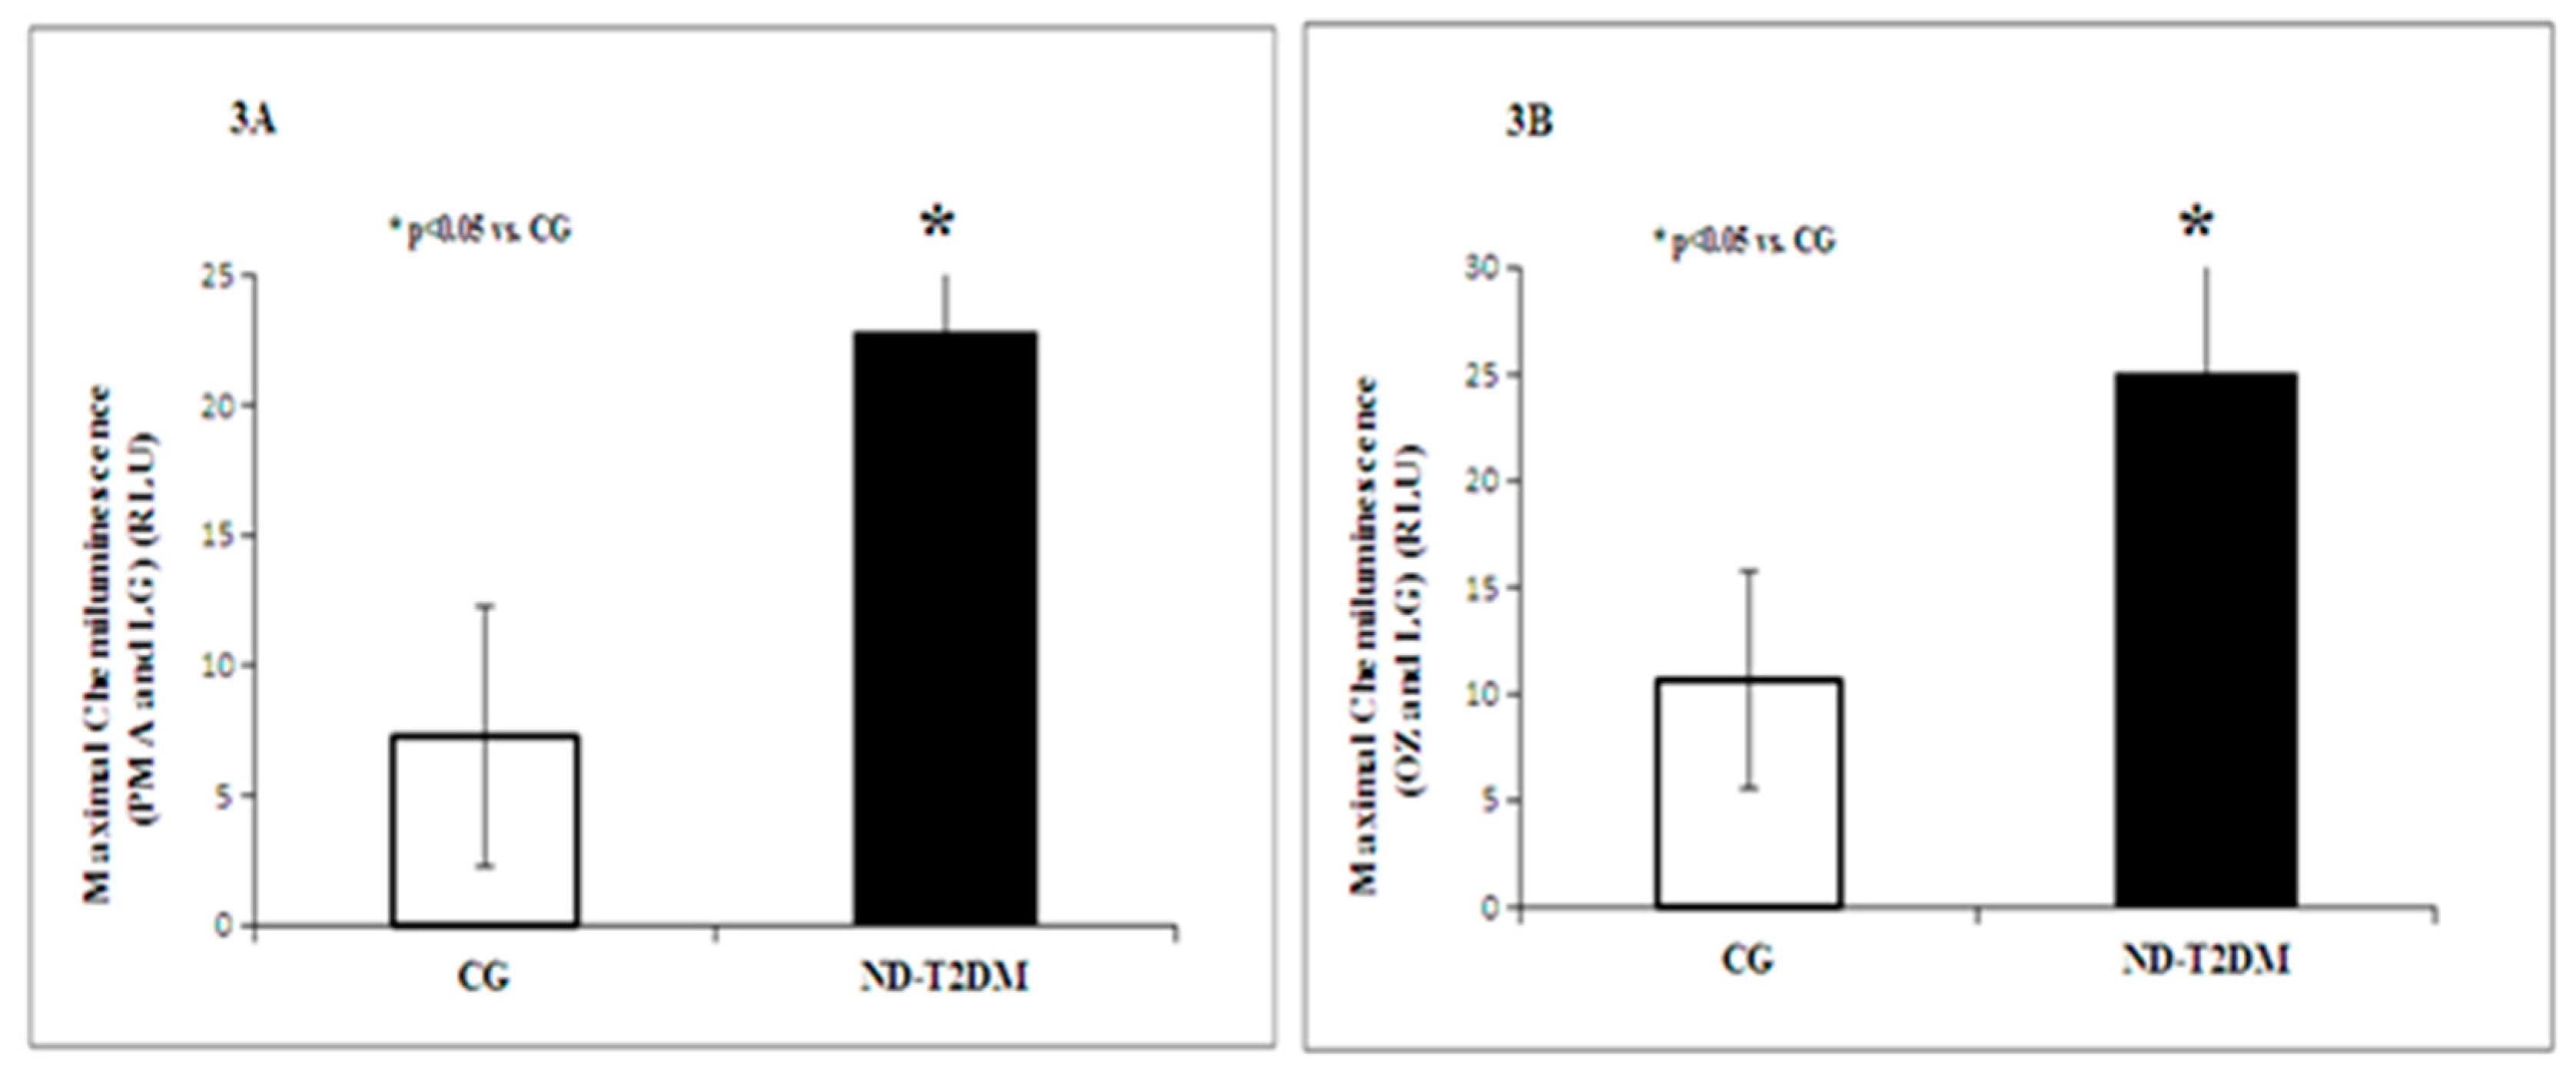
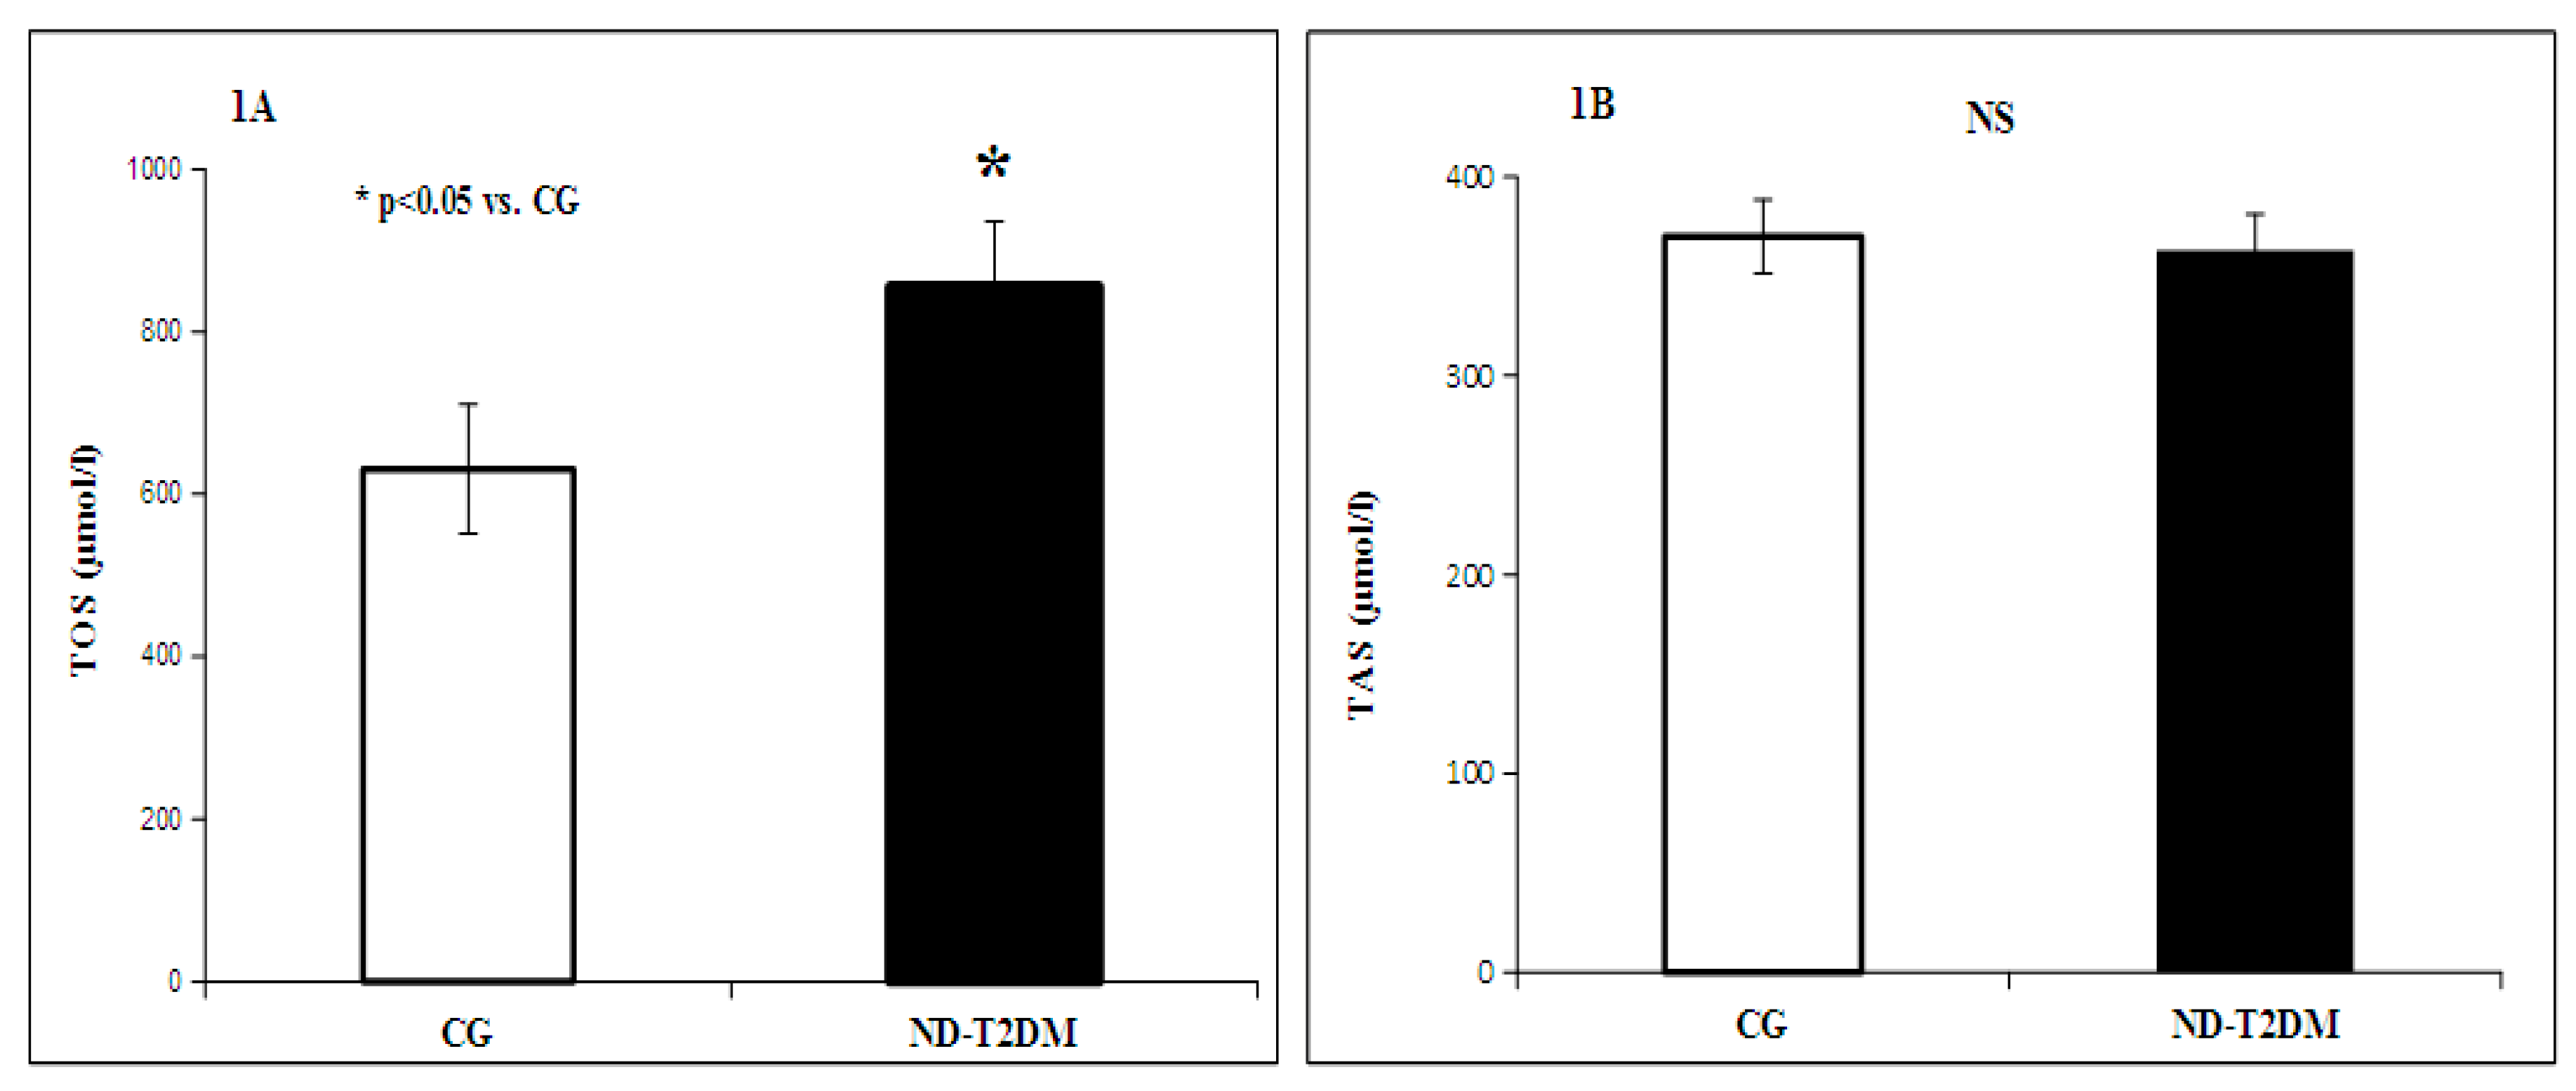
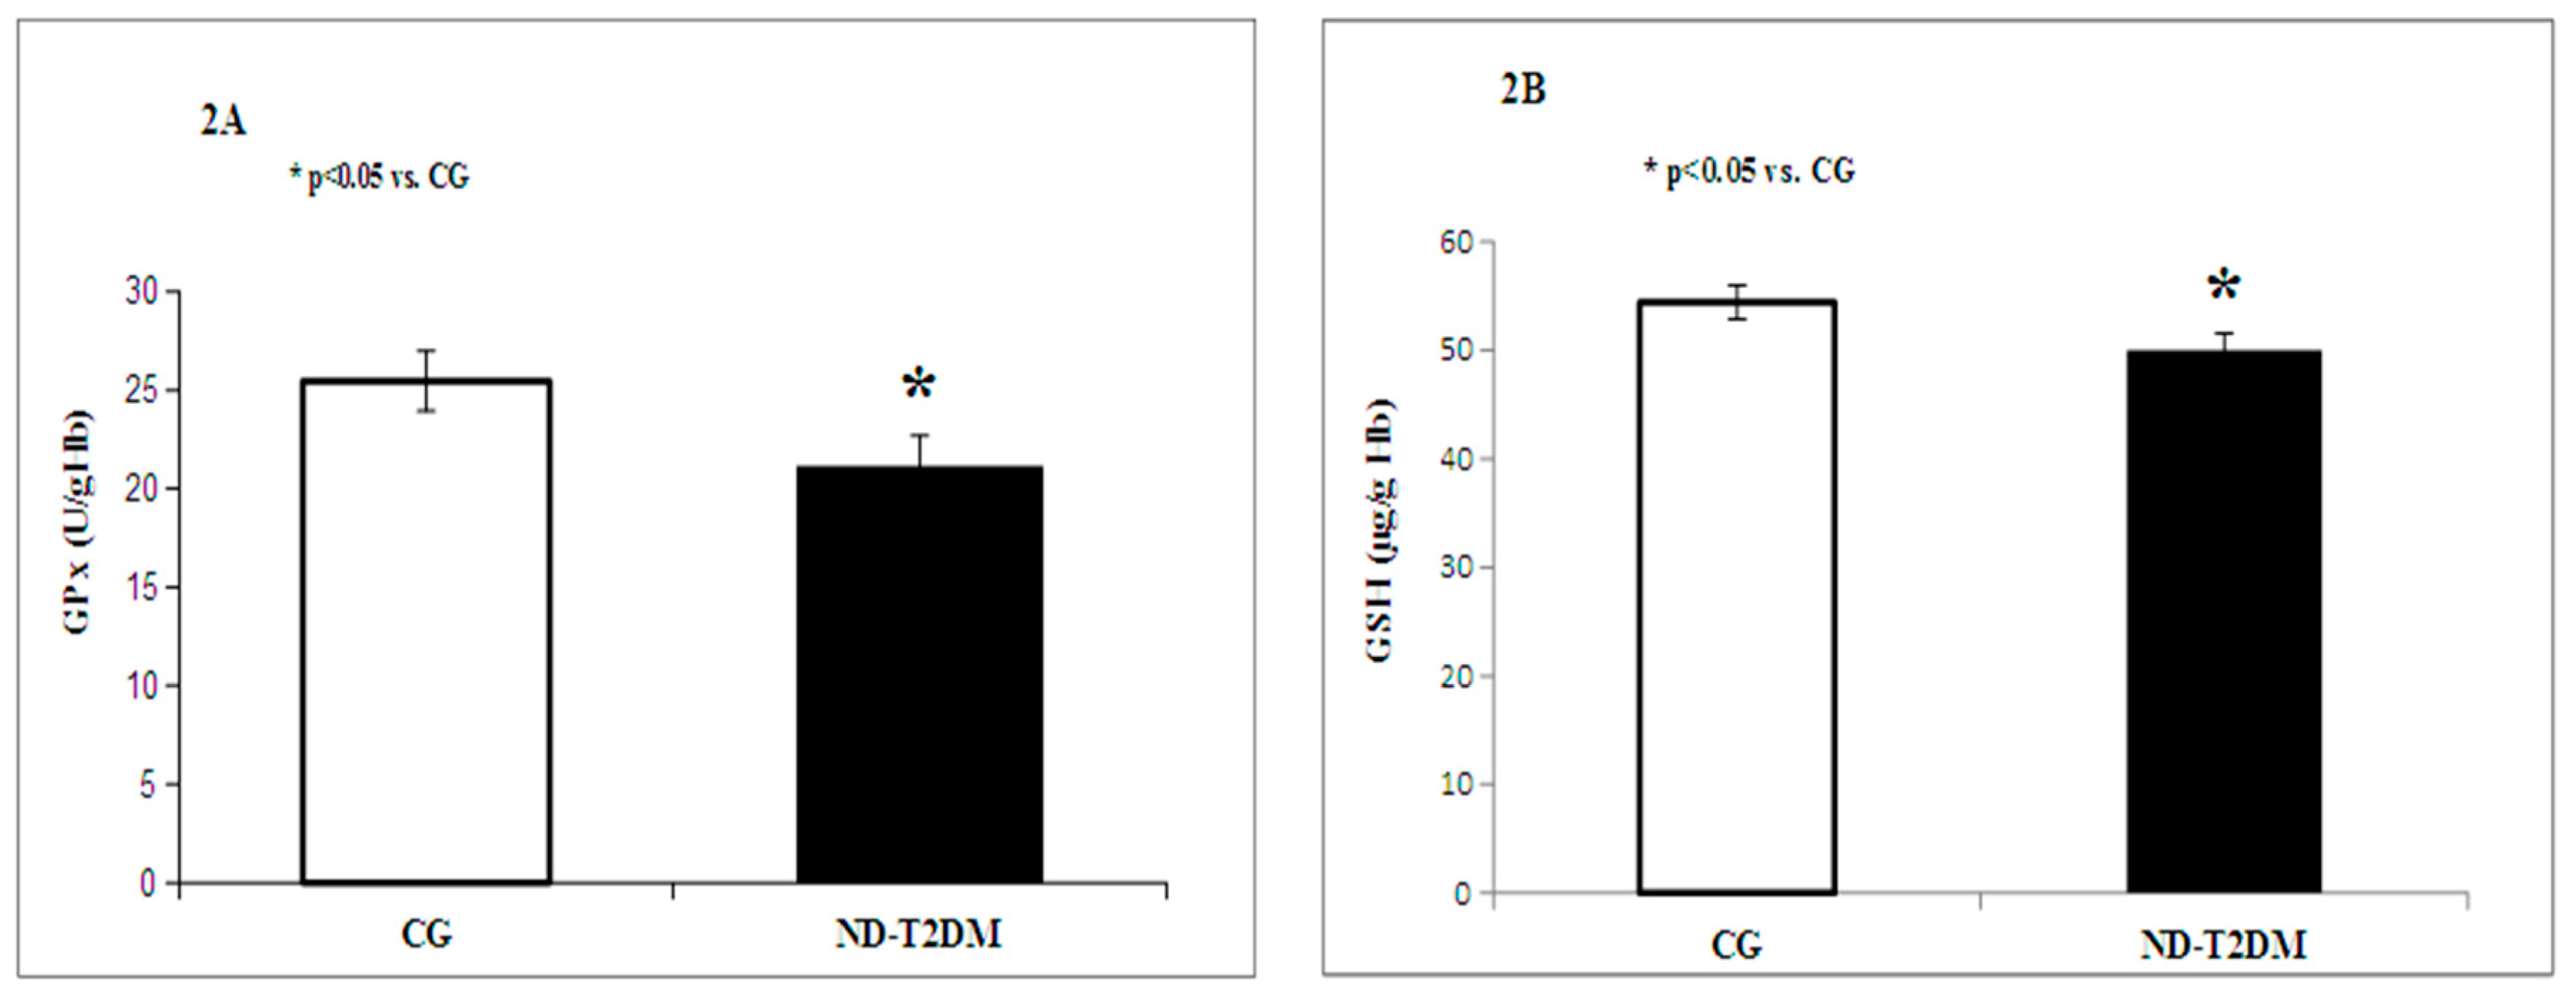
2. Results
3. Discussion
4. Materials and Methods
5. Conclusions
Acknowledgments
Author Contributions
Conflicts of Interest
References
- Natea, C.N. The evolution of diabetes mellitus in the Sibiu region in 2007–2009 period. Acta Medica Transilvanica 2010, 2, 47–51. [Google Scholar]
- World Health Organization. Global Report on Diabetes; WHO Press: Geneva, Switzerland, 2016; pp. 1–88. [Google Scholar]
- Mota, M.; Popa, S.G.; Mota, E.; Mitrea, A.; Catrinoiu, D.; Cheta, D.M.; Guja, C.; Hancu, N.; Ionescu-Tirgoviste, C.; Lichiardopol, R.; et al. Prevalence of Diabetes Mellitus and Prediabetes in the Adult Romanian Population: PREDATORR Study. J. Diabetes 2015, 8, 336–344. [Google Scholar] [CrossRef] [PubMed]
- Hanley, A.J.; Williams, K.; Stern, M.P.; Haffner, S.M. Homeostasis model assessment of insulin resistance in relation to the incidence of cardiovascular disease: The San Antonio Heart Study. Diabetes Care 2002, 25, 1177–1184. [Google Scholar] [CrossRef] [PubMed]
- Lakka, H.M.; Laaksonen, D.E.; Lakka, T.A.; Niskanen, L.K.; Kumpusalo, E.; Tuomilehto, J.; Salonen, J.T. The metabolic syndrome and total and cardiovascular disease mortality in middle-aged men. JAMA-J. Am. Med. Assoc. 2002, 288, 2709–2716. [Google Scholar] [CrossRef]
- Kannel, W.B.; McGee, D.L. Diabetes and cardiovascular disease. The Framingham study. JAMA-J. Am. Med. Assoc. 1979, 241, 2035–2038. [Google Scholar] [CrossRef]
- Stamler, J.; Vaccaro, O.; Neaton, J.D.; Wentworth, D. Diabetes, other risk factors, and 12-yr cardiovascular mortality for men screened in the Multiple Risk Factor Intervention Trial. Diabetes Care 1993, 16, 434–444. [Google Scholar] [CrossRef] [PubMed]
- Reaven, G.M. Banting Lecture 1988. Role of insulin resistance in human disease. Diabetes 1988, 37, 1595–1607. [Google Scholar] [CrossRef] [PubMed]
- Balagopal, P.B.; de Ferranti, S.D.; Cook, S.; Daniels, S.R.; Gidding, S.S.; Hayman, L.L.; McCrindle, B.W.; Mietus-Snyder, M.L.; Steinberger, J. American Heart Association Committee on Atherosclerosis Hypertension and Obesity in Youth of the Council on Cardiovascular Disease in the Young; et al. Nontraditional risk factors and biomarkers for cardiovascular disease: Mechanistic, research, and clinical considerations for youth: A scientific statement from the American Heart Association. Circulation 2011, 123, 2749–2769. [Google Scholar] [PubMed]
- Tripathi, Y.B.; Pandey, V. Obesity and endoplasmic reticulum (ER) stresses. Front. Immunol. 2012, 3. [Google Scholar] [CrossRef] [PubMed]
- De Ferranti, S.; Mozaffarian, D. The perfect storm: obesity, adipocyte dysfunction, and metabolic consequences. Clin. Chem. 2008, 54, 945–955. [Google Scholar] [CrossRef] [PubMed]
- Singer, D.E.; Nathan, D.M.; Fogel, H.A.; Schachat, A.P. Screening for diabetic retinopathy. Ann. Intern. Med. 1992, 116, 660–671. [Google Scholar] [CrossRef] [PubMed]
- Ceriello, A.; Motz, E. Is oxidative stress the pathogenic mechanism underlying insulin resistance, diabetes, and cardiovascular disease? Arterioscler. Thromb. Vasc. Biol. 2004, 24, 816–823. [Google Scholar] [CrossRef] [PubMed]
- Brownlee, M. Biochemistry and molecular cell biology of diabetic complications. Nature 2001, 414, 813–820. [Google Scholar] [CrossRef] [PubMed]
- King, G.L.; Brownlee, M. The cellular and molecular mechanisms of diabetic complications. Endocrinol. Metab. Clin. N. Am. 1996, 25, 255–270. [Google Scholar] [CrossRef]
- Maria-Luisa, L.-D.-L.-V.-M.; Cristina, F.-M. Oxidative stress in diabetes mellitus and the role of vitamins with antioxidant actions. In Oxidative Stress and Chronic Degenerative Diseases—A Role for Antioxidants; Intech: Rijeka, Croatia, 2013; Chapter 9. [Google Scholar] [CrossRef] [PubMed]
- Peppa, M.; Uribarri, J.; Vlassara, H. Glucose, Advanced Glycation End Products, and Diabetes Complications: What Is New and What Works. Clin. Diabetes 2003, 21, 186–187. [Google Scholar] [CrossRef]
- Halliwell, B.; Gutteridge, J.M.C. Free Radicals in Biology and Medicine, 4th ed.; Biosciences Oxford, Oxford University Press Inc.: New York, NY, USA, 2007; pp. 508–514. [Google Scholar]
- Ceriello, A. Hyperglycaemia: The bridge between non-enzymatic glycation and oxidative stress in the pathogenesis of diabetic complications. Diabetes. Nutr. Metab. 1999, 12, 42–46. [Google Scholar] [PubMed]
- Rösen, P.; Nawroth, P.P.; King, G.; Möller, W.; Tritschler, H.-J.; Packer, L. The role of oxidative stress in the onset and progression of diabetes and its complications: A summary of a Congress Series sponsored by UNESCO-MCBN, the American Diabetes Association and the German Diabetes Society. Diabetes Metab. Res. Rev. 2001, 17, 189–212. [Google Scholar] [CrossRef] [PubMed]
- Finucane, F.M.; Luan, J.; Warenham, N.J.; Sharp, S.J.; O’Rahilly, S.; Balkau, B.; Flyvbjerg, A.; Walker, M.; Hojlund, K.; Nolan, J.J.; et al. Correlation of the leptin/adiponectin ratio with measures of insulin resistance in non-diabetic individuals. Diabetologia 2009, 52, 2345–2349. [Google Scholar] [CrossRef] [PubMed]
- Zaletel, J.; Barlovic, D.P.; Prezelj, J. Adiponectin-leptin ratio: A useful estimate of insulin resistance in patients with type 2 diabetes. J. Endocrinol. Invest. 2010, 33, 514–518. [Google Scholar] [CrossRef] [PubMed]
- Oda, N.; Imamura, S.; Fujita, T.; Uchida, Y.; Inagaki, K.; Kakizawa, H.; Hayakawa, N.; Suzuki, A.; Takeda, J.; Horikawa, Y.; et al. The ratio of leptin to adiponectin can be used as an index of insulin resistance. Metabolism 2008, 57, 268–273. [Google Scholar] [CrossRef] [PubMed]
- Inoue, M.; Yano, M.; Yamakado, M.; Maehata, E.; Suzuki, S. Relationship between the adiponectin-leptin ratio and parameters of insulin resistance in subjects without hyperglycemia. Metabolism 2006, 55, 1248–1254. [Google Scholar] [CrossRef] [PubMed]
- Inoue, M.; Maehata, E.; Yano, M.; Taniyama, M.; Suzuki, S. Correlation between the adiponectin-leptin ratio and parameters of insulin resistance in patients with type 2 diabetes. Metabolism 2005, 54, 281–286. [Google Scholar] [CrossRef] [PubMed]
- Zhuo, Q.; Wang, Z.; Fu, P.; Piao, J.; Tian, Y.; Xu, J.; Yang, X. Comparison of adiponectin, leptin and leptin to adiponectin ratio as diagnostic marker for metabolic syndrome in older adults of Chinese major cities. Diabetes Res. Clin. Pract. 2009, 84, 27–33. [Google Scholar] [CrossRef] [PubMed]
- Jung, C.H.; Rhee, E.J.; Choi, J.H.; Bae, J.C.; Yoo, S.H.; Kim, W.J.; Park, C.Y.; Mok, J.O.; Kim, C.H.; Lee, W.Y.; et al. The relationship of adiponectin/leptin ratio with homeostasis model assessment insulin resistance index and metabolic syndrome in apparently healthy Korean male adults. Korean Diabetes J. 2010, 34, 237–243. [Google Scholar] [CrossRef] [PubMed]
- Ionescu-Tîrgovişte, C.; Lichiardopol, R.; Dobjanschi, C.; Guja, C.; Culman, M.; Brădescu, O.; Bojin, A. Type 2 diabetes therapeutic guide for general practitioner. Romanian J. Diabetes Nutr. Metab. Dis. 2006, 13, 4. [Google Scholar]
- Haffner, S.M.; Mykkanen, L.; Valdez, R.A.; Stern, M.P.; Holloway, D.L.; Monterrosa, A.; Bowsher, R.R. Disproportionately increased proinsulin levels are associated with the insulin resistance syndrome. J. Clin. Endocrinol. Metab. 1994, 79, 1806–1810. [Google Scholar] [PubMed]
- Pfützner, A.; Kunt, T.; Mondok, A.; Pahler, S.; Konrad, T.; Luebben, G.; Forst, T. Fasting intact proinsulin is a highly specific predictor of insulin resistance in type 2 diabetes. Diabetes Care 2004, 27, 682–687. [Google Scholar] [CrossRef] [PubMed]
- Roder, M.E.; Porte, D., Jr.; Schwartz, R.S.; Kahn, S.E. Disproportionately elevated proinsulin levels reflect the degree of impaired β cell secretory capacity in patients with noninsulin-dependent diabetes mellitus. J. Clin. Endocrinol. Metab. 1998, 83, 604–608. [Google Scholar] [CrossRef] [PubMed]
- Temple, R.C.; Carrington, C.A.; Luzio, S.D.; Owens, D.R.; Schneider, A.E.; Sobey, W.J.; Hales, C.N. Insulin deficiency in non-insulin-dependent diabetes. Lancet 1989, 1, 293–295. [Google Scholar] [CrossRef]
- Hotta, K.; Funahashi, T.; Arita, Y.; Takahashi, M.; Matsuda, M.; Okamoto, Y.; Iwahashi, H.; Kuriyama, H.; Ouchi, N.; Maeda, K.; et al. Plasma concentrations of a novel, adipose-specific protein, adiponectin, in type 2 diabetic patients. Arterioscler. Thromb. Vasc. Biol. 2000, 20, 1595–1599. [Google Scholar] [CrossRef] [PubMed]
- Halliwell, B.; Gutteridge, J.M.C. Free Radicals in Biology and Medicine, 4th ed.; Biosciences Oxford, Oxford University Press Inc.: New York, NY, USA, 2007; pp. 127–130. [Google Scholar]
- Cersosimo, E.; Solis-Herrera, C.; Trautmann, M.E.; Malloy, J.; Triplitt, C. Assessment of pancreatic beta cell function: Review of methods and clinical applications. Curr. Diabetes Rev. 2014, 10, 2–42. [Google Scholar] [CrossRef] [PubMed]
- Kahn, S.; Prigeon, R.; Schwartz, R.L. Obesity, body fat distribution, insulin sensitivity and islet beta-cell function as explanations for metabolic diversity. J. Nutr. 2001, 131, 354S–360S. [Google Scholar] [PubMed]
- Bastard, J.P.; Maachi, M.; Lagathu, C. Recent advances in the relationship between obesity, inflammation, and insulin resistance. Eur. Cytokine Netw. 2006, 17, 4–12. [Google Scholar] [PubMed]
- Trayhurn, P.; Wang, B.; Wood, I.S. Hypoxia in adipose tissue: A basis for the dysregulation of tissue function in obesity? Br. J. Nutr. 2008, 100, 227–235. [Google Scholar] [CrossRef] [PubMed]
- Ionescu-Tîrgovişte, C. Insulin resistance-what is myth and what is reality? Acta Endocrinol. 2011, 7, 123–146. [Google Scholar] [CrossRef]
- Napoli, C.; de Nigris, F.P. Multiple role of reactive oxygen species in the arterial wall. J. Cell. Biochem. 2001, 82, 674–682. [Google Scholar] [CrossRef] [PubMed]
- Libby, P.; Ridker, P.M.; Maseri, A. Inflammation and Atherosclerosis. Circ. Clin. Cardiol. New Front. 2002, 105, 1135–1143. [Google Scholar]
- Mohanty, P.; Hamouda, W.; Garg, R.; Aljada, A.; Ghanim, H.; Dandona, P. Glucose challenge stimulates reactive oxygen species (ROS) generation by leucocytes. J. Clin. Endocrinol. Metab. 2000, 85, 2970–2973. [Google Scholar] [CrossRef] [PubMed]
- Mohanty, P.; Ghanim, H.; Hamouda, W.; Aljada, A.; Garg, R.; Dandona, P. Both lipid and protein intakes stimulate increased generation of reactive oxygen species by polymorphonuclear leukocytes and mononuclear cells. Am. J. Clin. Nutr. 2002, 75, 767–772. [Google Scholar] [PubMed]
- Halliwell, B. Biochemistry of oxidative stress. Biochem. Soc. Trans. 2007, 35, 1147–1150. [Google Scholar] [CrossRef] [PubMed]
- Karen, B.; Karl-Heinz, K. The NOX Family of ROS-Generating NADPH Oxidases: Physiology and Pathophysiology. Physiol. Rev. 2007, 87, 245–313. [Google Scholar]
- Florence, C.-C.; Stephane, W.; Christophe, M.; Arlette, T.; Jacques, C.; Marie-Paule, V. Is the neutrophil reactive oxygen species production measured by luminol and lucigenin chemiluminescence intra or extracellular? Comparison with DCFH-DA flow cytometry and cytochrome c reduction. Clin. Chim. Acta 2002, 319, 9–17. [Google Scholar]
- Mandell, G.L. Bactericidal activity of aerobic and anaerobic polymorphonuclear neutrophils. Infect. Immun. 1974, 9, 337. [Google Scholar] [PubMed]
- Cathcart, M.K. Regulation of Superoxide Anion Production by NADPH Oxidase in Monocytes/Macrophages: Contributions to Atherosclerosis. Arterioscler. Thromb. Vasc. Biol. 2004, 24, 23–28. [Google Scholar] [CrossRef] [PubMed]
- Weiss, S.J. Tissue destruction by neutrophils. N. Engl. J. Med. 1989, 320, 365. [Google Scholar] [PubMed]
- Reeves, E.P.; Lu, H.; Jacobs, H.L.; Messina, C.G.; Bolsover, S.; Gabella, G.; Potma, E.O.; Warley, A.; Roes, J.; Segal, A.W. Killing activity of neutrophils is mediated through activation of proteases by K+ flux. Nature 2002, 416, 291. [Google Scholar] [CrossRef] [PubMed]
- Antonio, G.-C.; Luis, E.S.-M.; Sandra, E.-A. Elevated triglycerides/HDL-cholesterol ratio associated with insulin resistance. Cir. Cir. 2011, 79, 115–119. [Google Scholar]
- Du, T.; Yuan, G.; Zhang, M.; Zhou, X.; Sun, X.; Yu, X. Clinical usefulness of lipid ratios, visceral adiposity indicators, and the triglycerides and glucose index as risk markers of insulin resistance. Cardiovasc. Diabetol. 2014, 13, 146. [Google Scholar] [CrossRef] [PubMed]
- Hisalkar, P.J.; Patne, A.B.; Fawade, M.M.; Karnik, A.C. Evaluation of plasma superoxide dismutase and glutathione peroxidase in type 2 diabetic patients. Biol. Med. 2012, 4, 65–72. [Google Scholar]
- Sushma, V.; Nibha, S.; Pushpank, V.; Shukla, K.N.; Mohammad, A.; Monisha, B. Antioxidant enzyme levels as markers for type 2 diabetes mellitus. Int. J. Bioassays 2013, 2, 685–690. [Google Scholar]
- Robertson, R.P.; Jamie, H.; Phuong, O.T.; Yoshito, T.; Hiroki, T. Glucose toxicity in β-Cells: Type 2 diabetes, good radicals gone bad, and the glutathione connection. Diabetes 2003, 52, 581–587. [Google Scholar] [CrossRef] [PubMed]
- American Diabetes Association. Diagnosis and Classification of Diabetes Mellitus. Diabetes Care 2008, 31 (Suppl. 1), S55–S60. [Google Scholar] [CrossRef]
- Friedewald, W.T.; Levy, R.T.; Fredrickson, D.S. Estimation of the Concentration of Low-Density Lipoprotein Cholesterol in Plasma, Without Use of the Preparative Ultracentrifuge. Clin. Chem. 1972, 18, 499–502. [Google Scholar] [PubMed]
- Matthews, D.R.; Hosker, J.P.; Rudenski, A.S.; Naylor, B.A.; Treacher, D.F.; Turner, R.C. Homeostasis model assessment: insulin resistance and beta-cell function from fasting plasma glucose and insulin concentrations in man. Diabetologia 1985, 28, 412–419. [Google Scholar] [CrossRef] [PubMed]
- Lundqvist, H.; Dahlgren, C. Isoluminol-Enhanced Chemiluminescence: A Sensitive Method to Study the Release of Superoxide Anion from Human Neutrophils. Free Radic. Biol. Med. 1996, 6, 785–792. [Google Scholar] [CrossRef]
Sample Availability: Not available. |


| Anthropometrical and Clinical Parameters | Control Group (CG) | ND-T2DM Patients (ND-T2DM) | p Value | ||||||
|---|---|---|---|---|---|---|---|---|---|
| Males N = 15 | Females N = 17 | Total N = 32 | Males N = 60 | Females N = 55 | Total N = 115 | CG vs. ND-T2DM | Males CG vs. Males T2DM | Females CG vs. Females T2DM | |
| Age (years) | 48.40 ± 12.70 | 48.41 ± 17.32 | 48.41 ± 15.10 | 59.23 ± 9.57 | 57.34 ± 10.18 | 58.33 ± 9.87 | p < 0.001 | p = 0.006 | p = 0.057 |
| Weight (kg) | 81.32 ± 13.20 | 68.65 ± 20.26 | 74.33 ± 18.35 | 91.63 ± 13.37 | 83.63 ± 18.47 | 87.88 ± 16.39 | p < 0.001 | p < 0.05 | p < 0.05 |
| Waist circumference (WC) (cm) | 97.75 ± 14.68 | 88.75 ± 16.64 | 91.75 ± 15.96 | 106.52 ± 7.48 | 102.37 ± 11.47 | 104.55 ± 9.77 | p < 0.05 | NS | NS |
| Body mass index (BMI) (kg/m2) | 26.70 ± 3.23 | 25.96 ± 5.82 | 26.33 ± 4.78 | 30.50 ± 3.85 | 32.44 ± 6.06 | 31.43 ± 5.11 | p < 0.001 | p = 0.0015 | p < 0.001 |
| Fat mass (%) | 23.53 ± 6.39 | 33.82 ± 9.01 | 29.41 ± 9.42 | 30.56 ± 5.26 | 41.96 ± 5.43 | 36.20 ± 7.82 | p < 0.001 | p = 0.003 | p = 0.003 |
| Visceral fat level (%) | 9.75 ± 3.95 | 6.75 ± 4.26 | 8.04 ± 4.33 | 15.76 ± 4.19 | 11.02 ± 2.78 | 13.42 ± 4.27 | p < 0.001 | p < 0.001 | p = 0.0013 |
| SBP (mmHg) | 120 ± 8.16 | 124.1 ± 10.83 | 122 ± 9.57 | 128 ± 8.65 | 129 ± 13.68 | 128 ± 11.35 | p < 0.05 | p = 0.005 | NS |
| DBP (mmHg) | 67.30 ± 10.12 | 72.50 ± 8.66 | 69.80 ± 9.63 | 74.64 ± 9.30 | 75.09 ± 9.08 | 74.87 ± 9.15 | p < 0.05 | NS | NS |
| Biochemical Parameters | Control Group (Healthy Subjects) (CG) | ND-T2DM Patients (ND-T2DM) | pValue Control vs. ND-T2DM |
|---|---|---|---|
| Glycemia a jeun (mg/dL) | 96.20 ± 6.91 | 172.53 ± 74.29 | p < 0.001 |
| HbA1c (%) | 5.62 ± 0.26 | 7.74 ± 2.03 | p < 0.001 |
| Fructosamine (µmol/L) | 408.04 ± 82.39 | 572.32 ± 311.18 | p < 0.001 |
| Creatinine (mg/dL) | 0.84 ± 0.17 | 0.85 ± 0.18 | NS |
| Serum Urea (mg/dL) | 29.78 ± 6.64 | 34.60 ± 9.53 | p < 0.05 |
| Serum total cholesterol (mg/dL) | 211.20 ± 46.50 | 215.33 ± 52.72 | NS |
| Serum HDLc (mg/dL) | 51.55 ± 13.21 | 44.63 ± 12.31 | P < 0.05 |
| Triglycerides (mg/dL) | 120.08 ± 45.24 | 180.36 ± 101.67 | p < 0.001 |
| Serum LDLc (mg/dL) | 135.48 ± 47.53 | 136.09 ± 47.40 | NS |
| Total Chol./HDLc | 4.46 ± 1.64 | 5.12 ± 1.63 | p < 0.05 |
| Tg./HDLc (Atherogenic Index) | 2.66 ± 1.78 | 4.67 ± 3.37 | p < 0.001 |
| AST (U/I) | 22.99 ± 10.71 | 23.84 ± 12.95 | NS |
| ALT (U/I) | 25.20 ± 17.85 | 30.13 ± 15.35 | NS |
| Uric Acid (mg/dL) | 5.28 ± 1.99 | 5.99 ± 1.73 | NS |
| GGT(U/I) | 39.50 ± 9.15 | 46.27 ± 6.36 | NS |
| Albumin (g/dL) | 4.33 ± 0.27 | 4.31 ± 0.21 | NS |
| Total Serum Proteins (g/dL) | 7.00 ± 0.41 | 6.96 ± 0.46 | NS |
| Parameters | Control Group (Healthy Subjects) (CG) | ND-T2DM Patients (ND-T2DM) | pValue Control vs. ND-T2DM |
|---|---|---|---|
| Insulin (µUI/mL) | 9.20 ± 4.96 | 13.74 ± 10.68 | p < 0.001 |
| HOMA-IR Index (%) | 2.20 ± 1.23 | 5.74 ± 4.39 | p < 0.001 |
| HOMA-BETA Index (%) | 102.87 ± 52.23 | 63.92 ± 6.97 | p < 0.001 |
| Proinsulin (pmol/L) | 1.25 ± 0.49 | 6.69 ± 0.82 | p < 0.001 |
| Proinsulin/Insulin (P/I) | 0.10 ± 0.005 | 0.53 ± 0.06 | p < 0.001 |
| Proinsulin/Adiponectin (P/A) | 0.25 ± 0.07 | 1.81 ± 0.39 | p < 0.001 |
| C-Peptide (ng/mL) | 3.34 ± 2.19 | 4.66 ± 2.92 | p < 0.05 |
| Leptin (ng/mL) | 13.98 ± 3.19 | 17.50 ± 16.18 | NS |
| Adiponectin (µg/mL) | 13.08 ± 10.30 | 8.10 ± 7.57 | p < 0.05 |
| SuperoxideDismutase (SOD) (U/g Hb) | 99.72 ± 22.95 | 95.72 ± 19.92 | NS |
© 2017 by the authors. Licensee MDPI, Basel, Switzerland. This article is an open access article distributed under the terms and conditions of the Creative Commons Attribution (CC BY) license (http://creativecommons.org/licenses/by/4.0/).
Share and Cite
Picu, A.; Petcu, L.; Ştefan, S.; Mitu, M.; Lixandru, D.; Ionescu-Tîrgovişte, C.; Pîrcălăbioru, G.G.; Ciulu-Costinescu, F.; Bubulica, M.-V.; Chifiriuc, M.C. Markers of Oxidative Stress and Antioxidant Defense in Romanian Patients with Type 2 Diabetes Mellitus and Obesity. Molecules 2017, 22, 714. https://doi.org/10.3390/molecules22050714
Picu A, Petcu L, Ştefan S, Mitu M, Lixandru D, Ionescu-Tîrgovişte C, Pîrcălăbioru GG, Ciulu-Costinescu F, Bubulica M-V, Chifiriuc MC. Markers of Oxidative Stress and Antioxidant Defense in Romanian Patients with Type 2 Diabetes Mellitus and Obesity. Molecules. 2017; 22(5):714. https://doi.org/10.3390/molecules22050714
Chicago/Turabian StylePicu, Ariana, Laura Petcu, Simona Ştefan, Manuela Mitu, Daniela Lixandru, Constantin Ionescu-Tîrgovişte, Grațiela Grădișteanu Pîrcălăbioru, Felicia Ciulu-Costinescu, Maria-Viorica Bubulica, and Mariana Carmen Chifiriuc. 2017. "Markers of Oxidative Stress and Antioxidant Defense in Romanian Patients with Type 2 Diabetes Mellitus and Obesity" Molecules 22, no. 5: 714. https://doi.org/10.3390/molecules22050714