Chemoinformatics and Drug Discovery

Discovery Partners International, Inc., 9640 Towne Center Drive, San Diego, CA 92121, USA
*
Author to whom correspondence should be addressed.
Molecules 2002, 7(8), 566-600; https://doi.org/10.3390/70800566
Submission received: 21 June 2002
/
Revised: 14 August 2002
/
Accepted: 18 August 2002
/
Published: 30 August 2002
Abstract
:This article reviews current achievements in the field of chemoinformatics and their impact on modern drug discovery processes. The main data mining approaches used in cheminformatics, such as descriptor computations, structural similarity matrices, and classification algorithms, are outlined. The applications of cheminformatics in drug discovery, such as compound selection, virtual library generation, virtual high throughput screening, HTS data mining, and in silico ADMET are discussed. At the conclusion, future directions of chemoinformatics are suggested.
Introduction
Traditional Drug Discovery Process
There are seven steps in the drug discovery process: disease selection, target hypothesis, lead compound identification (screening), lead optimization, pre-clinical trail, and clinical trial and pharmacogenomic optimization. Traditionally, these steps are carried out sequentially [1], and if one of the steps is slow, it slows down the entire process. These slow steps are bottlenecks.
The Old Bottlenecks and HTS Technologies
Previously, the main bottlenecks in drug discovery were the time and costs of making (or finding) and testing new chemical entities (NCE). The average cost of creating a NCE in a major pharmaceutical company was estimated at around $7,500/compound [2]. In order to reduce costs, pharmaceutical companies have had to find new technologies to replace the old “hand-crafted” synthesis and testing NCE approaches. Since 1980, with the advent of high throughput screening (HTS), automated techniques have made possible robotized screening. Through this process, hundreds of thousands of individual compounds can be screened per drug target per year [2,3]. Since biologists can now test thousands of compounds per day, chemists are required to make enough compounds to meet the needs of biologists. But, can chemists make thousands of compounds a day?
Combinatorial Chemistry
In response to the increased demand for new compounds by biologists, chemists started using combinatorial chemical technologies to produce more new compounds in shorter periods. Combinatorial chemistry (CC) systematically and repetitively yields a large array of compounds from sets of different types of reagents, called “building blocks”. By 2000, many solution- and solid-phase CC strategies were well-developed [4]. Parallel syntheses techniques are nowadays used in all major pharmaceutical companies. By increasing the capabilities of making and testing compounds, it was hoped that the drug discovery process could be accelerated dramatically. Unfortunately, this did not turn out to be the case. Seeking the reasons for these disappointing results, it was believed that increasing the chemical diversity of compound libraries would enhance the drug discovery process. Cheminformatics approaches would now be introduced in order to optimize the chemical diversity of libraries.
Chemical Diversity and Cheminformatics
It was soon realized that millions of compounds could be made by CC technologies. However, this procedure did not yield many drug candidates. In order to avoid wasting CC efforts, it was believed that it would be best to make chemically diverse compound libraries. In order to make a compound library with great chemical diversity, a variety of structural processing technologies for diversity analyses were created and applied. These computational approaches are the components of cheminformatics. After 1990, many chemical-diversity-related approaches were developed, such as structural descriptor computations, structural similarity algorithms, classification algorithms, diversified compound selections, and library enumerations. However, help from these diversity analyses approaches has been limited. More hits have been found from these chemically diverse libraries, but most of these hits do not result in new drugs. Therefore, the process of making and screening drug-like compounds came under question.
Drug-likeness and Lead-likeness
A chemically diverse library can contain many non-drug-like compounds. Therefore, technologies have been developed to recognize drug-like compounds from a diverse compound library [5,6,7,8,9,10,11]. These drug-like measuring and filtering technologies have partly solved the screening problems. However, they have not been good enough to completely solve these problems. It has been observed that many drug-like compounds, which should be potential candidates, do not come up as hits when they are screened against biological targets. It is believed that further refinement of the filtering technologies should be made in order to recognize lead-like compounds [12,13] instead of drug-like compounds. Intrinsically, lead-likeness and drug-likeness are the descriptors of potency, selectivity, absorption, distribution, metabolism, toxicity, and scalability. In the past, these parameters were optimized sequentially. Now, it is believed that these parameters should be optimized simultaneously.
Paralleling Drug Discovery Process and Early ADMET Prediction
As the human genome project was completed, hundreds of new targets for drug discovery have been generated through genomics and modern molecular biology. Today’s reality is that the industry is facing many targets, but with little structural information. One now finds too many hits when searching for lead candidates, thus lead optimization is stymied. To get more target structural information, high-throughput protein crystallization has been explored [14,15]. However, many targets are membrane proteins and it is very difficult to obtain structural information for these proteins. Hence, lead optimization remains the most serious bottleneck. In addition, we know that, about forty percent of all development candidates fail due to absorption, distribution, metabolism, excretion and toxicity (“ADMET”) problems [16].
In the past, HTS for pharmaceutical discovery was used as a filter in order to identify the few potentially promising hits in a corporation’s synthetic archive. Therefore, HTS data analyses were focused on hits, and the bulk of the non-hit data was ignored [17]. Unfortunately, such hits generated from HTS can fail during efficiency or ADMET optimizations and thus increase drug discovery costs. A survey concluded that despite a doubling of R&D expenditures since 1980 and the widespread deployment of high throughput techniques, R&D timelines remain virtually unchanged. In other words, throwing money and technology at the discovery process has not made either it more efficient or profitable. In order to improve this situation, a new strategy is required using high throughput techniques (synthesis and screening) as tools to help both lead identification and lead optimization. In order to carry out this strategy, cheminformatics methods must be applied while generating data using high throughput techniques in order to assure that good ADMET properties are achieved while making and screening compounds, This approach is called a multi-parametric optimization strategy [18].
Challenges to Cheminformatics
This new drug discovery strategy, challenges cheminformatics in the following aspects: (1) cheminformatics should be able to extract knowledge from large-scale raw HTS databases in a shorter time periods, (2) cheminformatics should be able to provide efficient in silico tools to predict ADMET properties, This is normally very hard to do [19]. This review paper will outline the achievements of cheminformatics and, propose new directions for cheminformatics.
2. The Achievements of Cheminformatics
The Origins of Cheminformatics
Cheminformatics (sometimes spelled as chemoinformatics or chemo-informatics) is a relatively new discipline. Actually, it has emerged from several older disciplines such as computational chemistry, computer chemistry, chemometrics, QSAR, chemical information, etc. The names identifying these older disciplines can be controversial, but they have been studied for many years. Cheminformatics involves the use of computer technologies to process chemical data. Initial activities in the field started with chemical document processing (the Journal of Chemical Documentation was published in 1961 by ACS. It was renamed the Journal of Chemical Information & Computer Science after 1974) [20]. What differentiates chemical data processing from other data processing is that chemical data involves the requirement to work with chemical structures. This requirement necessitated the introduction of special approaches to represent, store and retrieve structures in a computer system. Another challenge faced by this new field was to establish clear relationships between structural patterns and activities or properties. One of the earliest cheminformatics studies involved chemical structure representations, such as structural descriptors.
Descriptors and chemical structure database retrieval
Before the 1980s, computer speed was slow. Since structure and substructure searches are typical NP problems, they were computationally costly [21]. In order to make structure and sub-structure searching feasible on slow computer systems, many methods were attempted in order to find concise structural representations, such as, linear notations. These convert structural graphs to strings that can easily be searched by a computer. The data screening strategies filtered out the compounds were not the main structural features (search keys) in a given query. Then, an atom-by-atom search algorithm was applied (this was usually time consuming) to a smaller number of compounds. Subsequently, screening approaches have been used in most of chemical database management systems. These approaches are briefly summarized in the following points.
Linear notations
Structure linear notations convert chemical structure connection tables to a string, a sequence of letters, using a set of rules. The earliest structure linear notation was the Wiswesser Line Notation (WLN). ISI® adopted WLN to be used in some of their products in 1968 and, it is still use today. It was also adopted in the mid 1960s for internal use by many pharmaceutical companies. At that time (mid 60s to 80s) [22], it was considered the best tool to represent, retrieve and print chemical structures. In WLN, letters represents structural fragments and a complete structure is represented as a string. This system efficiently compressed structural data and, was very useful to storing and searching chemical structures in low performance computer systems. However, the WLN is difficult for non-experts to understand. Later, David Weininger suggested a new linear notation designated as SMILESTM [23,24]. Since SMILESTM is very close to the “natural language” used by organic chemists, SMILESTM is widely accepted and used in many chemical database systems. To successfully represent a structure, a linear notation should be canonicalized. That is, one structure should not correspond to more than one linear notation string, and conversely, one linear notation string should only be interpreted as one structure.
Canonicalization
If a structure corresponds to a unique WLN or a unique SMILESTM string, then the structure search results in a string match. WLN could meet this requirement in most cases. The SMILESTM approach can do this after canonical processing. Therefore, both WLN and canonical SMILESTM are able to solve structure search problems by string matches. A molecular graph (2D structure) can also be canonicalized into a real number through a mathematical algorithm. The real number is identified as a molecular topologic index. However, two different structures can have the same topologic index. Therefore, topologic indices can only be used as screens for accelerating structure database searching. Actually, the concept of molecular index was originally proposed for QSAR and QSPR studies. Wiener reported the first molecular topological index in 1947 [25]. If a molecule and its specific topologic index had a one-to-one relationship, then structure search could be done by number comparison [25]. However, substructure search still had to use an atom-by-atom matching algorithm, which, as mentioned earlier, could be very time-consuming. In order to further enhance chemical database search performance, efforts have been on the way to seek better structural screening technologies.
Screens and search keys
In order to reduce the number of atom-by-atom matches, the screening approach was introduced. The idea is to pre-define a set of substructures (chemical functional groups) as a screen to filter out impossible structural search candidates. The search software avoids atom-by-atom matching of target structures that do not contain all the substructures appearing in the query structure. The pre-defined substructures can also be called as search keys. These were adopted in MDL’s ISIS structure database systems. In MDL’s structure database systems (MACCS and ISIS), there are 166 search keys, and 960 extended search keys [27]. The 166 search keys can be represented as a string that contains 166 letters. Later it was found to be much more efficient to use 166 bits instead of 166 letters since computers can carry out logic bit operations dramatically faster than string comparisons. On the other hand, one wonders how many search keys will suffice and, what substructures need to be covered by these search keys?
Bit-maps and fingerprints
Pre-defined substructures, such as those used by MDL search keys, can be biased and may not work well for the structures that are not covered. Therefore, systematical substructure generation approaches were introduced. Hundreds of thousands of substructures can be generated by a systematical approach. In order to reduce the storage cost and enhance the computation performance, bit-maps are used to hold the substructure information. The idea is that a bit position represents a specifically enumerated substructure. When a bit is set to 1, it means the corresponding substructure is present and, 0 means the substructure is absent [28,29]. Such bit-maps are called fingerprints. Thus, a structure is profiled by its fingerprint as designated by its bit-map. There are many types of molecular fingerprints depending on what set of substructures are used. For example, Daylight uses fingerprints that represent the substructures generated from the Daylight Fingerprint (software) Toolkit, and MDL fingerprints represent the substructures defined by the MACCS search keys, etc. Fingerprint approaches dramatically enhanced the performance of chemical structure database searching. The transition from linear notation strings to bit-maps was a profound development for cheminformatics. Having bit-map technology, one can compute the similarity of two different size structures. Although two structures may have a different number of atoms and bonds, they can have the same number of fingerprints that are each stored in the same size bit-maps (binary arrays). Since a bit-map profiles a structure, each component in the bit-map is termed as a structure descriptor. Further questions that need to be considered are: (1) can these binary structural descriptors be expanded to real numbers? (2) can we use this technology to profile a compound library that may contain millions of structures?
Structure descriptors and profiling compound libraries
After the pharmaceutical industry adopted high throughput techniques in the 1990s, quick profiling of a compound library with thousands or millions of chemical structures became an important issue. The purpose of profiling compound libraries is to answer the following questions: (1) how diverse is a library? (2) how similar are compounds in the corporate library compared with marketed drugs? (3) how should one select a sub-library, that structurally represents the whole library? (4) is a foreign library structurally complementary to the corporate library? Consideration of these questions is known as diversity analysis. In order to do diversity analysis, scientists realized that they needed high throughput data mining approaches. Therefore, cheminformatics was born. The earliest cheminformatics approaches employed chemical database concepts, such as MACCS search key based fingerprints and Daylight fingerprints, in order to profile chemical structures. Diversity analysis was carried out by means of these tools. Currently, structure descriptors are used not only as sub-structure bit-maps, but also, to represent any structural property. These can be based upon topological or three-dimensional properties, such as: molecular indices, molecular weight, number of H-bond donors, etc. The tools to calculate various structure descriptors are available publicly and commercially [30,31,32,33,34,35]. Structure descriptors are fundamental tools to profile compound libraries and diversity analysis is one of the main components of modern cheminformatics.
As mentioned previously, there are many structure descriptors. It is important to know how to use them. However, it should be noted that they couldn’t all be used together, because some of them may be redundant, some of them are correlated with each other, and too many descriptors will increase computation costs. Therefore, one needs rigorous approaches to generate and select descriptors. If a structure is represented by two or three structure descriptors, a compound library containing thousands of structures can be graphed in a two- or three-dimensional space using the descriptors as coordinates. Such graphs visually show compound structural diversity of a database. However, it should not be one’s objective to represent a structure just using three descriptors. It would be better to represent a structure with many (perhaps one hundred) descriptors. However, diversity graphs would then have to be one hundred-dimensional. In order to view a one hundred-dimensional space, one needs a technology to project higher dimensional data space to two- or three-dimensional space. This technology is known as dimension reduction.
Dimension reduction and descriptor selection
Mathematically, a library with n compounds and represented by m (m >3) descriptors is an n × m dimensional matrix. There is no way to graph the matrix, although one would like to review the diversity graphically. In order to solve this problem, dimensionality needs to be reduced to two or three. That is, dimension reduction is required. Many dimension reduction approaches are available. We will summarize some of the widely accepted dimension reduction technologies.
Multidimensional scaling
Multidimensional scaling (MDS) [36] or artificial neural network (ANN) methods are traditional approaches for dimension reduction. MDS is a non-linear mapping approach. It is not so much an exact procedure as rather a way to “rearrange” objects in an efficient manner, and thus to arrive at a configuration that best approximates the observed distances. It actually moves objects around in the space defined by the specified number of dimensions and, then checks how well the distances between objects can be reproduced by the new configuration. In other words, MDS uses a function minimization algorithm that evaluates different configurations with the goal of maximizing the goodness-of-fit (or minimizing “lack of fit”) [37].
Self-organising map
Self-organising map (SOM) is one of the ANN methods. Effectively, it is a vector quantization algorithm that creates reference vectors in a high-dimensional input space and uses them, in an ordered fashion, to approximate the input patterns in image space. It does this by defining local order relationships between the reference vectors so that they are made to depend on each other as though their neighboring values would lie along a hypothetical “elastic surface” [38,39,40]. The SOM is therefore able to approximate the point density function, p (x), of a complex high-dimensional input space, down to a two dimensional space, by preserving the local features of the input data.
PCA and FA
Principal component analysis (PCA) [41,42] and factor analysis (FA) [43] are usually used to filter out redundant descriptors and, eliminate descriptors having minor information contribution. PCA is used to transform a number of potentially correlated variables (descriptors) into a number of relatively independent variables that then can be ranked based upon their contributions for explaining the whole data set. The transformed variables that can explain most of the information in the data, are called principal components. The first principal component accounts for as much of the variability in the data as possible, and each succeeding component accounts for as much of the remaining variability as possible. The components having minor contribution to the data set may be discarded without losing too much information. FA uses an estimate of common variance among the original variables in order to generate the factor solution. A factor is the linear combination of original variables. The number of factors will always be less than the number of original variables. So, selecting the number of factors to keep for further analysis using common factor analysis is more problematic than is selecting the principle components. If the number of principal components or factors is less than four, then the multidimensional data can be graphed in two- or three-dimensional space, that is, PCA and FA can be used to reduce dimensionality. These dimension reduction approaches do not always work well. In order to validate the dimension reduction results, we need a technology to map a graphed point to its structure drawing. This technology is known as chemical structure-related data visualization.
Visualizing structures from graphed data points
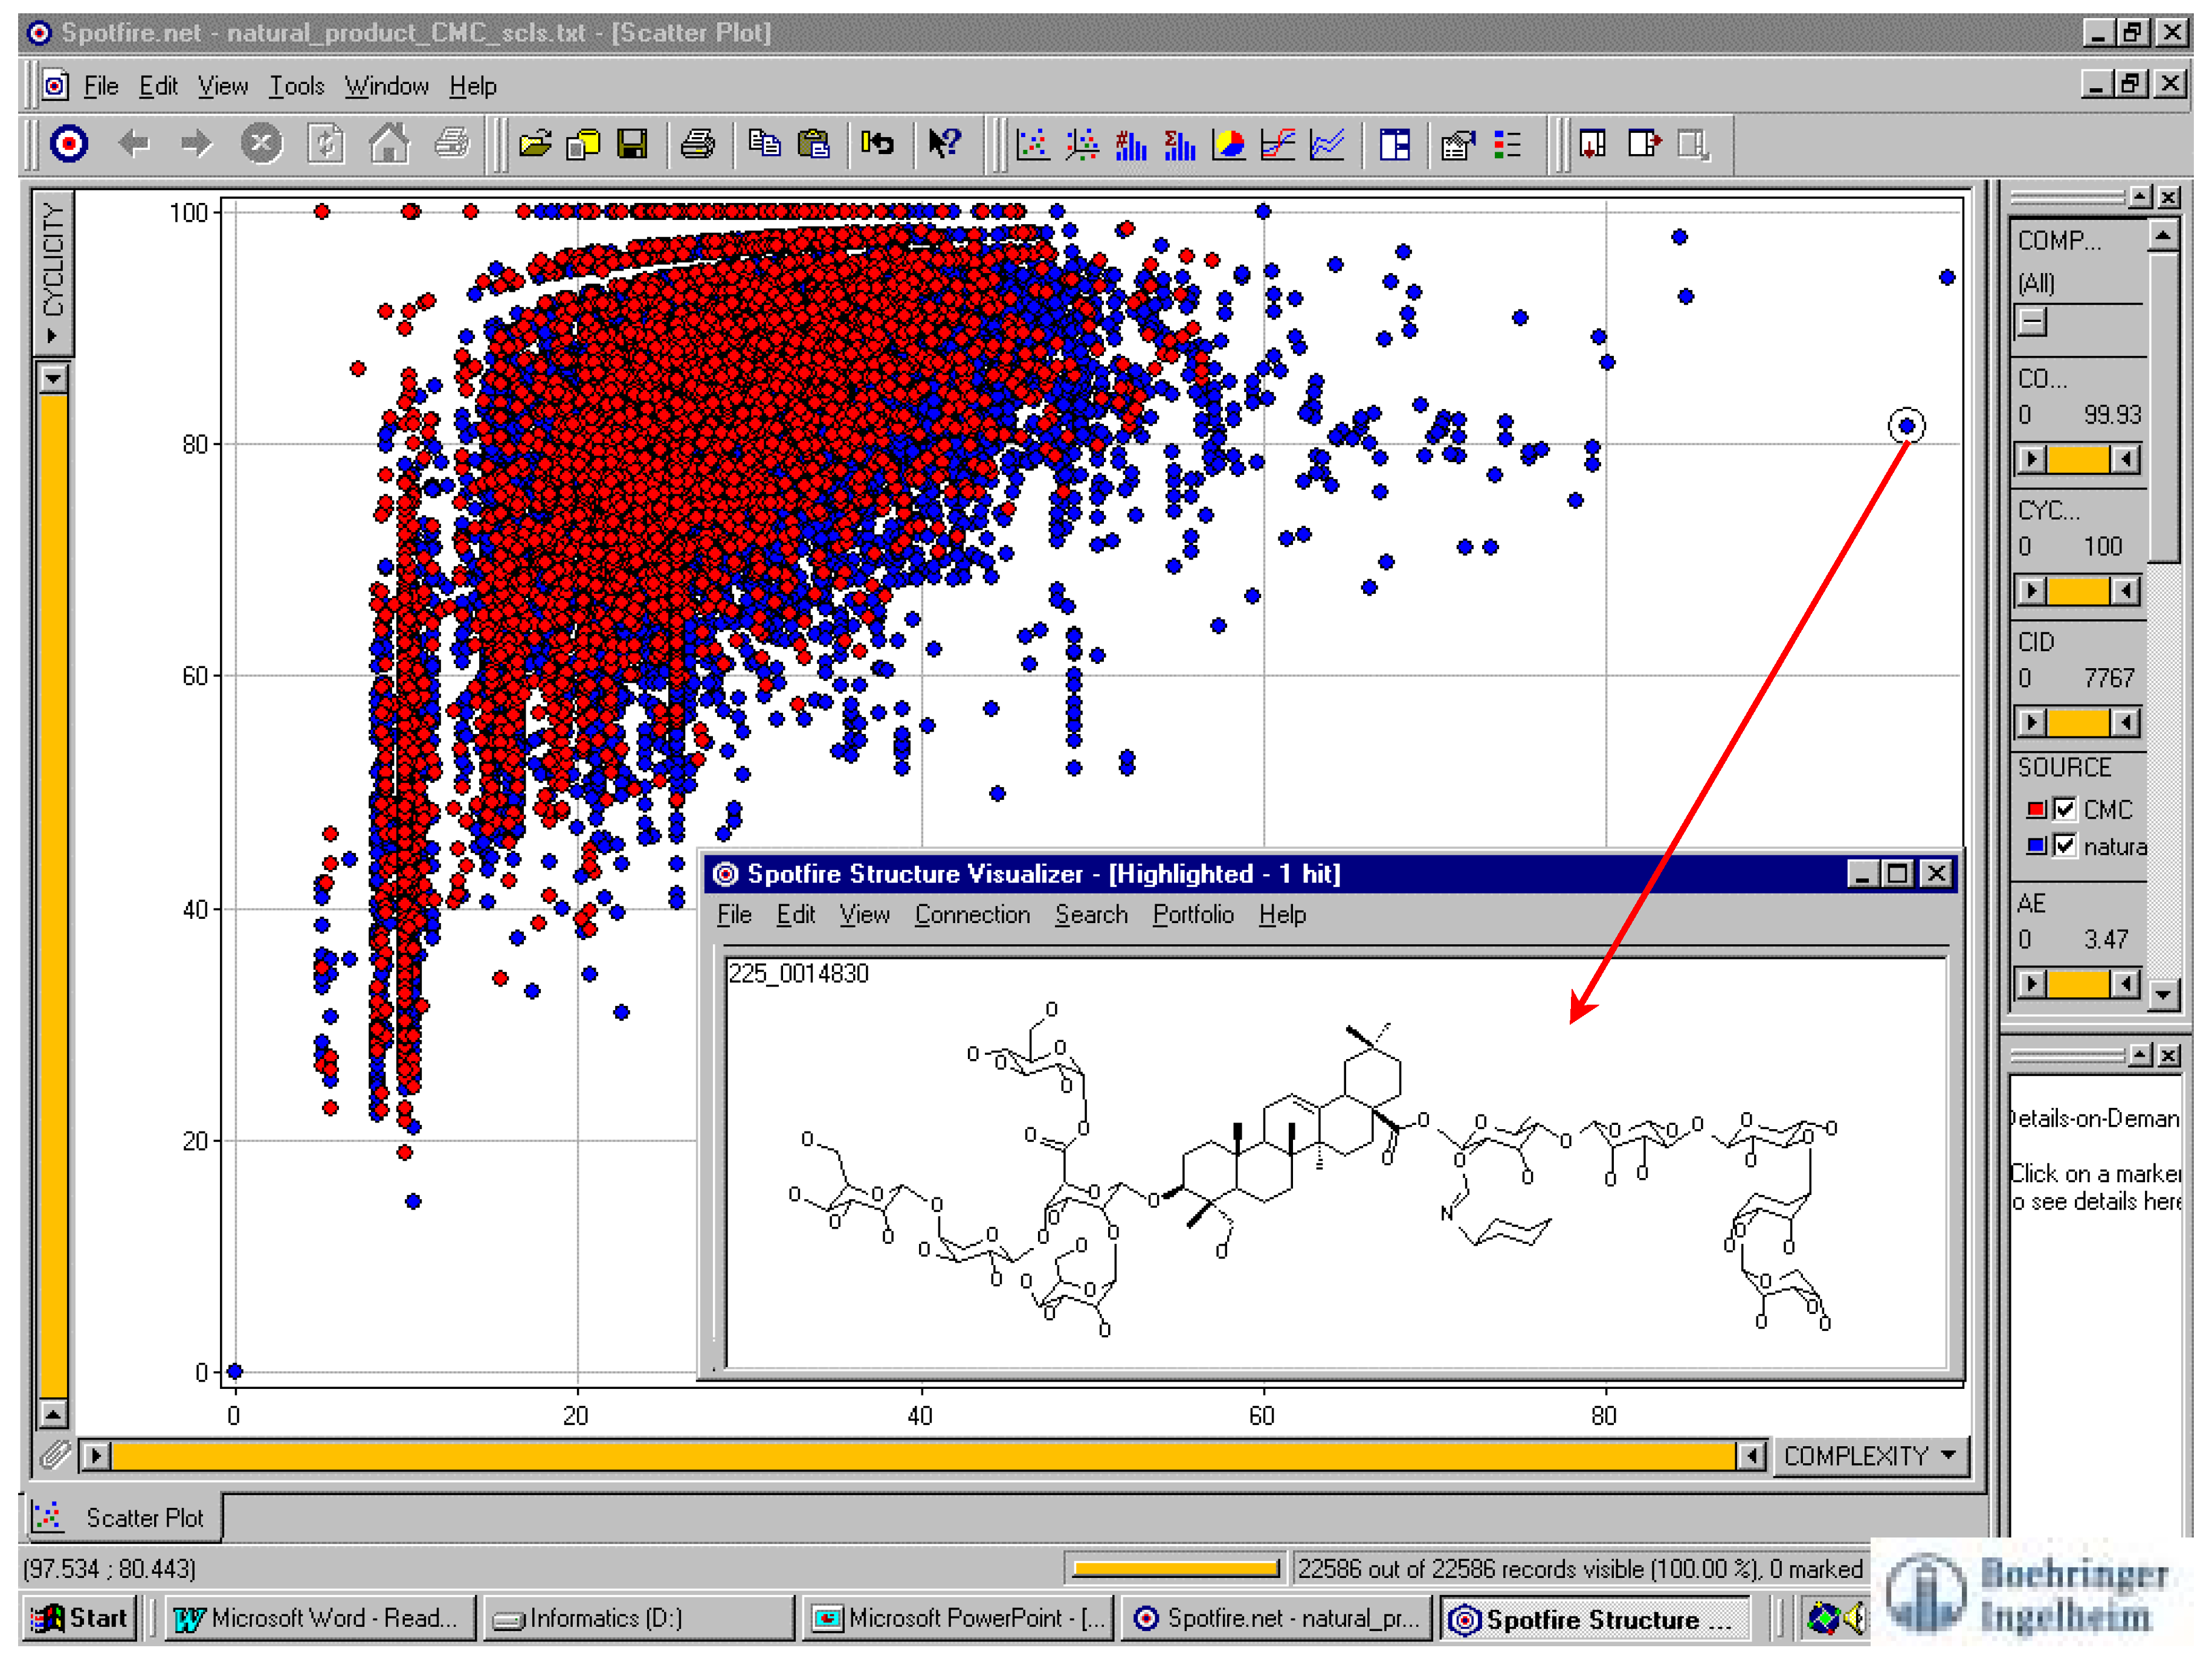
Chemical structure graphs are chemists’ natural language. Since a compound library is mapped to points on a two-dimensional graph, a reasonable requirement is for one to have an easy way to see the structure by pointing to the corresponding dot. This problem has been well resolved by Spotfire® software [44]. Figure 1 shows an example [45].
Figure 1.
Spotfire® software compares libraries and refers a structure from a dot. The red dots represent CMC (Comprehensive Medicinal Chemistry, MDL database product) compounds, and blue dots represent data from another library.
Figure 1.
Spotfire® software compares libraries and refers a structure from a dot. The red dots represent CMC (Comprehensive Medicinal Chemistry, MDL database product) compounds, and blue dots represent data from another library.

Descriptor selection
Successful data mining depends on good descriptor selection. If molecules are represented by improper descriptors, they will not lead to reasonable predictions. Correct descriptor selections rely on understanding the computational problem that one is trying to solve. Correlation analysis and relevant analysis approaches can help with this understanding. The criteria used for selecting descriptors should be: (1) the selected descriptors should be bioactivity related (requiring correlation analysis), (2) the selected descriptors should be informative (should have diversified value distributions), (3) the selected descriptors should be independent of each other (if two descriptors are correlated to each other, related property will be unfairly biased), (4) the selected descriptors should be simple to extract, easy to explain to a chemist, invariant to irrelevant transformations, insensitive to noise, and efficient to discriminate patterns in different categories (specificity). After comparing performance and predictability in high throughput data mining, researchers from multiple groups have consistently concluded that 2D descriptors perform significantly better than 3D descriptors [46,47,48,49]. This suggests that more research is needed in 3D descriptors.
The goal of data mining is to derive patterns that are related to specified activities or properties. By analyzing data, we may divide a compound library into several groups. The compounds in the same group have common structural features (patterns). This is considered its classification. In order to classify structures, pattern recognition algorithms are needed.
Classifications and pattern recognition
The core technology of data mining is pattern recognition. In cheminformatics, regression and classification are commonly used pattern recognition technologies. Regression analysis is usually applied to the variables that have continuous values. However, many structural descriptors are scattered or Boolean variables, which have to be processed by classification approaches, such as supervised or non-supervised learning algorithms. Before recognizing patterns, let’s understand what patterns are of interest to chemists.
Patterns
Deriving patterns from a large-scale data set requires first understanding the problem before attempting to select and try from the many data mining tools. A researcher should know the types of patterns that he or she is seeking. Table 1 lists some commonly studied patterns.

| Pattern | Method | Remarks |
|---|---|---|
 | Markush structure or generic structure | This is a topological pattern used by chemists for many years. It is determined by experience. It is an efficient way to represent an unlimited number of compounds with the same scaffold. Additional restrictions can be applied to make the pattern more specific. It is suitable for lead optimization and hit-to-lead efforts. |
 | Fingerprint | This is the topological pattern systematically generated from an algorithm. This pattern has no human bias, but can be meaningless to chemistry. It is used in HTS data mining. |
 | Three-dimensional pharmacophore | This pattern is derived, manually or computationally, from a three-dimensional molecular model. The pattern is based upon a physical model and binding mechanism. It is sensitive to conformation changes. Better results are obtained when supported by crystal or NMR structural data. It is suitable for lead optimization. |
 | Regression | Regression methods are the most traditional approaches for pattern recognition. These methods assume the variables are continuous and the curve shapes are pre-defined. For multidimensional data, curve patterns are not known and trying all possible curves is very time consuming. In these cases, genetic algorithms may be applied to partially solve the problem of identifying curve patterns. |
 | Decision tree classification | This approach is applied when there are a great number of descriptors and, the descriptors have various value types and ranges. |
 | Hierarchical clustering | This approach assumes the objects have hierarchical characters. The methods require similarity or distance matrices. The approach may produce multiple answers for users to explain or with which to experiment. |
 | Non-hierarchical clustering | The approach assumes the objects have non-hierarchical characters, and the number of clusters is known prior the computation. The method requires similarity or distance matrices. The approach may produce multiple answers for users to explain or with which to experiment. |
 | Self-Organization Map (SOM) | This is a neural network approach. The number of neurons, configuration of neurons, neighboring function, training rate and area, and monitoring parameters should be predefined. This method needs similarity or distance measurements [50]. |
In order to compare patterns, one needs similarity or distance measurements. These measurements are briefly summarized as follows.
Similarity or Distance metrics
Many pattern recognition techniques require distance or similarity measurements to quantitatively measure the distance or similarity of two objects (in our case, the objects are small molecules). Euclidean distance, Mahalanobis distance and correlation coefficients are commonly used for distance measurement,
where n is the number of descriptors, D represents the absolute distance between A and B, R represents the angle of vectors A and B in multidimensional space and, is interpreted as the quantity of the linear correlation of A and B. The value range of R is between –1 to +1 that is, from 100% dissimilar to 100% similar. The Euclidian distance assumes that variables are uncorrelated. When variables are correlated, the simple Euclidean distance is not an appropriate measure, however, the Mahalanobis distance (2) will adequately account such correlations. The Tanimoto coefficient is commonly employed for similarity measurements of bit-strings of structural fingerprints (Boolean logic). The simplified form is (4).
where α is the count of substructures in structure A, β the count of substructures in structure B, and γ is the count of substructures in both A and B. Many different similarity calculations have been reported. Holliday, Hu and Willett have published a comparison of 22 similarity coefficients for the calculation of inter-molecular similarity and dissimilarity, using 2D fragment bit-strings [51].
With proper structure descriptors and similarity or distance measurements, we are ready to classify (group) compounds. There are many classification approaches. They can be categorized into clustering and partitioning.
Clustering
The term cluster analysis (CA) was first used by Tryon, in 1939. Actually CA encompasses a number of different classification algorithms. A general question in many areas of an inquiry is how to organize the observed data into meaningful structures, that is, how to develop taxonomies [52]. Conceptually, the approach used by CA in order to address this problem, can well be described by the saying “birds of a feather flock together”. Since its initial introduction, many CA algorithms have been invented. They belong to two categories: hierarchical clustering [54] and partitional (non-hierarchical) clustering [53,55]. Hierarchical clustering rearranges objects in a tree-structure (see Table 1). Javis-Patrick (also known as nearest neighbor cluster algorithm) is commonly used to cluster chemical structures [56].
Correct clustering results rely on: (1) proper structure representation (bioactivity related descriptors), (2) suitable data normalization, and (3) carefully selected cluster algorithms and proper parameter settings. Data normalization is the basis for comparing experiments within large series when experimental conditions may not be identical. Normalization ensures that the experimental quality of the data is comparable and, sound mathematical algorithms have been employed. Normalization includes various options to standardize data and to adjust background levels and correct gradients. The commonly used normalization functions are as follows:
Generally, linear normalization is recommended (if X’max = 1 and X’min = 0, x’i is normalized in percentage by formula (5)). Z-score assumes xi obeys Gaussian distribution. If xi has a different distribution, then the normalization will twist the pattern (variance will be far away from the standard deviation) and leads to incorrect pattern recognition. One of the puzzling problems of cluster algorithms is that they require a user in some ways to guess the number of clusters before carrying out the clustering computation. Also, clustering cannot tolerate the heterogeneity of the data. This makes one turn to partitioning approaches.
Partitioning
Partitioning algorithms, such as, decision trees, are non-parametric approaches. It is difficult for regression or parametric classification approaches to work on heterogeneous types of data. The excessively large number of descriptors can make clustering computation infeasible. Decision trees are introduced to solve these problems. One of the most popular decision tree techniques is recursive partitioning (RP). It has been reported that RP algorithms can partition on data sets with over 100,000 compounds and 2,000,000 descriptors, in less than an hour [57,58]. RP algorithms can also be used to build multivariable regression models. One of the disadvantages of the decision tree approach is similar to a problem with the clustering algorithm approach, namely: it suggests too many solutions.
Applications in drug discovery
In the past decade, many cheminformatics approaches have been applied in the drug discovery process. It is impossible to enumerate all the applications, but the major applications can be outlined as follows.
Compound selection
For many pharmaceutical organizations, HTS capacity is allocated on two levels: the number of targets screened and the number of samples screened per target. Screening all available compounds against all available targets is beyond the HTS capacity of pharmaceutical organizations [59]. On the other hand, for a given parallel synthesis protocol and for available reactants, combinatorial chemistry can make huge numbers of compounds which are, as well, beyond the HTS capacity of pharmaceutical organizations. Therefore, one must apply some method to select a smaller set of compounds from a large compound pool. The main tasks for compound selection are: (1) to select and acquire compounds from external sources that will provide complementary diversity to existing libraries, (2) to select for screening, from a corporate compound pool, a subset that provides diversity representation, (3) to select reagents to make a combinatorial library which will maximize diversity, and (4) to select compounds, from available compound collections, that are similar to known ligands yet, with different and novel scaffolds. Diversity-based compound selection has been done using many classification approaches.
As early as 1995, Gasteiger and his co-workers reported an approach to assess similarity and diversity of combinatorial libraries by spatial autocorrelation functions and neural networks [60]. Sheridan and Kearsley at Merck used a genetic algorithm to suggest combinatorial libraries [61]. In 1996, Brown and Martin at Abbott Laboratories evaluated a variety of structure-based clustering methods for use in compound selections [62]. They used MACCS search keys (MDL), Unity (Tripos) and Daylight 2D descriptors, Unity 3D rigid and flexible descriptors and two Abbott in-house 3D descriptors based on potential pharmacophore points. Further, they have compared Ward's and group-average hierarchical agglomerative, Guénoche hierarchical divisive and Jarvis-Patrick non-hierarchical clustering methods. The results suggested that 2D descriptors and hierarchical clustering methods are best used for separating biologically active molecules from inactives. In particular, the combination of MACCS descriptors and Ward’s clustering was optimal. Gillet, Willett, and Bradshaw reported a dissimilarity-based compound selection (DBCS) algorithm for generating structurally diverse combinatorial libraries [63]. They applied a DBCS approach at the product level, but it is synthetically inefficient since it does not result in a combinatorial library. Then they applied a genetic algorithm for selecting combinatorial libraries from the fully enumerated products and demonstrate that these libraries are significantly more diverse than those generated using reactant-based selection. Agrafiotis and the co-works at 3D Pharmaceuticals developed a number of algorithms for compound library diversity analysis, for examples: stochastic algorithms for maximizing diversity and distance-based diversity measurements based upon k-d trees [64,65]. Clark at Tripos implemented the OptiSim® program based on a stochastic selection algorithm that includes maximum and minimum dissimilarity-based selection. Clark indicated that OptiSim® could mimic the representativeness of selections based on hierarchical clustering [66,67].
Later, Pötter at Bayer AG compared a library design based upon random selection against the maximum and minimum dissimilarity-based selection. They found that using maximum dissimilarity methods lead to more stable quantitative structure-activity relationship (QSAR) models with higher predictive power compared to randomly chosen compounds. This predictive power is especially high when there is no compound in the test dataset with a similarity coefficient less than 0.7 to its nearest neighbor in the training set [68]. Pearlman and Smith developed cell-based diversity algorithms [69]. They proposed a simple algorithm for reducing dimensionality by identifying which axes (metrics) convey information related to affinity for a given receptor and which axes can be safely discarded as being irrelevant to that given receptor. This algorithm often reveals a three- or two-dimensional subspace of a (typically six-dimensional) BCUT chemistry-space and, thus, enables computer graphic visualization of the actual coordinates of active compounds and combinatorial libraries. Pearlman and Smith illustrated the importance of using receptor-relevant distances for identifying near neighbors of lead compounds, comparing libraries, and other diversity-related tasks.
In 1999, Denis M. Bayada, Hans Hamersma, and Vincent J. van Geerestein [70] explored the differences between diversity and representatively, validated different diversity selection methods (such as the MaxMin function), compared several representativity techniques (selection of compounds closest to centroids of clusters, Kohonen neural networks, nonlinear scaling of descriptor values), and compared various types of descriptors (topological and 3D fingerprints, including some validated whole-molecule numerical descriptors that were chosen for their correlation with biological activities). They found that only clustering based on fingerprints or on whole-molecule descriptors can give results consistently superior to random selection when extracting a diverse set of activities from a file with potential drug molecules. The results further indicated that clustering selection from fingerprints is biased toward small molecules, a behavior that might partly explain its success over other types of methods. Using numerical descriptors instead of fingerprints, removes this bias without penalizing performance too much. New diversity analysis approaches are still periodically being introduced coming [71,72,73,74,75,76,77,78,79], although there is now more emphasis on focused library design and focused screening. Bajorath in 2001 published a perspective in this field [80].
Virtual library generation
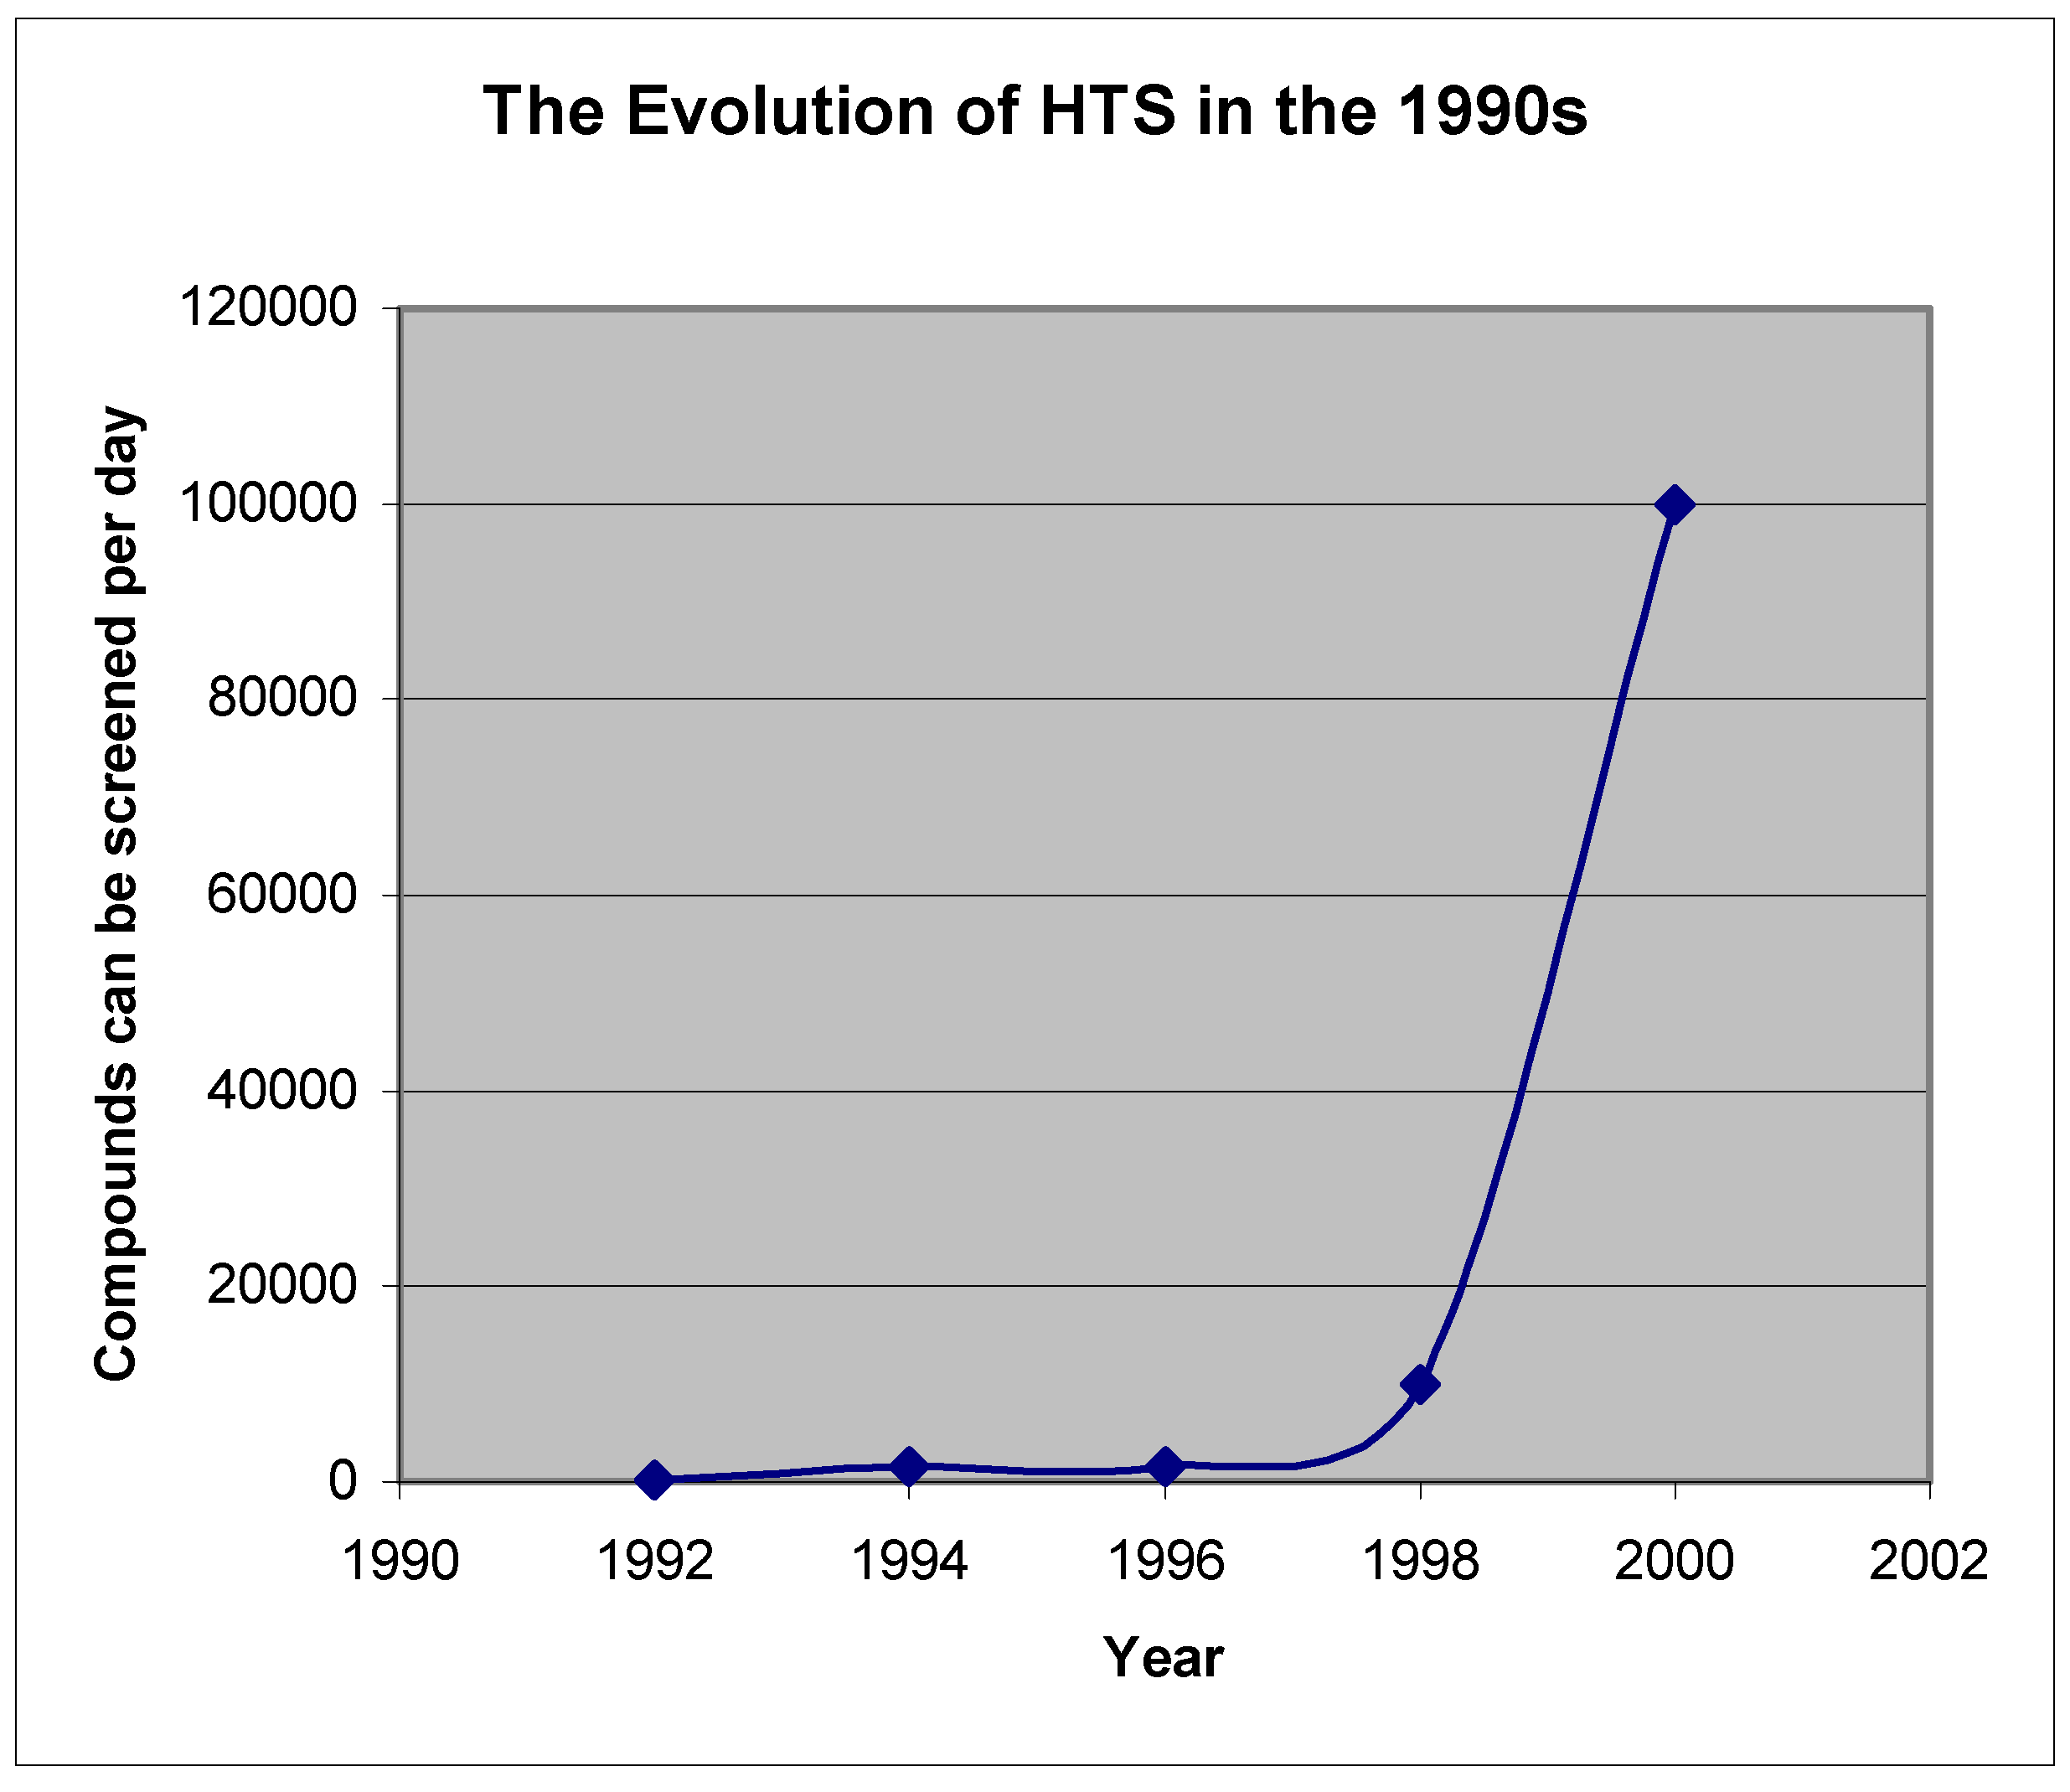
As equipment is being automated and miniaturized, HTS capacity keeps expanding [81] (Figure 2). But, increased HTS efforts have not significantly increased drug discovery successes [82]. Instead, other bottlenecks are being encountered such as: hit-to-lead processes, lead optimization, and target validation.
Figure 2.
The increase of HTS capacity

Considering total lead-like molecular space, the total percentage of compounds that current technologies have made and screened, is still small. This has made way for the birth of in silico or virtual screening (VS) technology [83,84,85]. Now, the compounds to be virtually screened are not limited to those that exist within the corporate inventory. A virtual library can be generated using a computational approach. The criteria for generating a general (not focused) virtual library are: (1) diversity, (2) ADMET properties, and (3) synthetic accessibility. There are a number of ways to generate a diverse virtual library. However, it is challenging to make a virtual library that meets the criteria set forth above in (2) and (3). Although work on this aspect has been reported [86,87], more investigation is required.
Virtual screening
In conjunction with high-throughput screening technology, virtual screening has become a main tool for identifying leads [83]. Virtual screening is actually one of the computational tools used to filter out unwanted compounds from physical libraries or in silico libraries. In order to reduce drug discovery costs, one needs to remove undesired compounds as early as possible. Filters have been built based upon oral bioavailability, aqueous solubility, metabolic clearance and, chemically reactivity or toxic chemical groups [88,89,90]. A virtual screening method for identification of “frequent hitters” in compound libraries has been reported [91]. If the target structure is known, one of the structure-based virtual screening methods that can be used is high throughput docking [92,93]. If the target structure is unknown, but the ligands from the literature or, competitors are known, then, similarity approaches can be applied [94,95,96]. If neither target structure nor ligand structure is known, then SAR patterns can be derived from experimental screening data by statistical approaches [97,98,99]. Also, virtual screening is a great tool for the design of a combinatorial library with a given target. For example, Hopfinger and co-works have constructed a combinatorial library of glucose inhibitors of glycogen phosphorylase b using virtual screening technology and 4D-QSAR analyses [100]. Using the 4D-QSAR model developed for a training set of 47 glucose analogue inhibitors of glycogen phosphorylase, the investigators have developed a virtual approach to screen a focused combinatorial virtual library of 225 inhibitors. Analysis of the binding predictions across the virtual library, reveals patterns of structure-activity information. The patterns are then used to design new focused libraries. A recent review has indicated that HTS and VS are moving toward integration [101]. It is expected that such integration will make HTS more powerful for use in new lead discovery.
SAR on HTS data and sequential screening
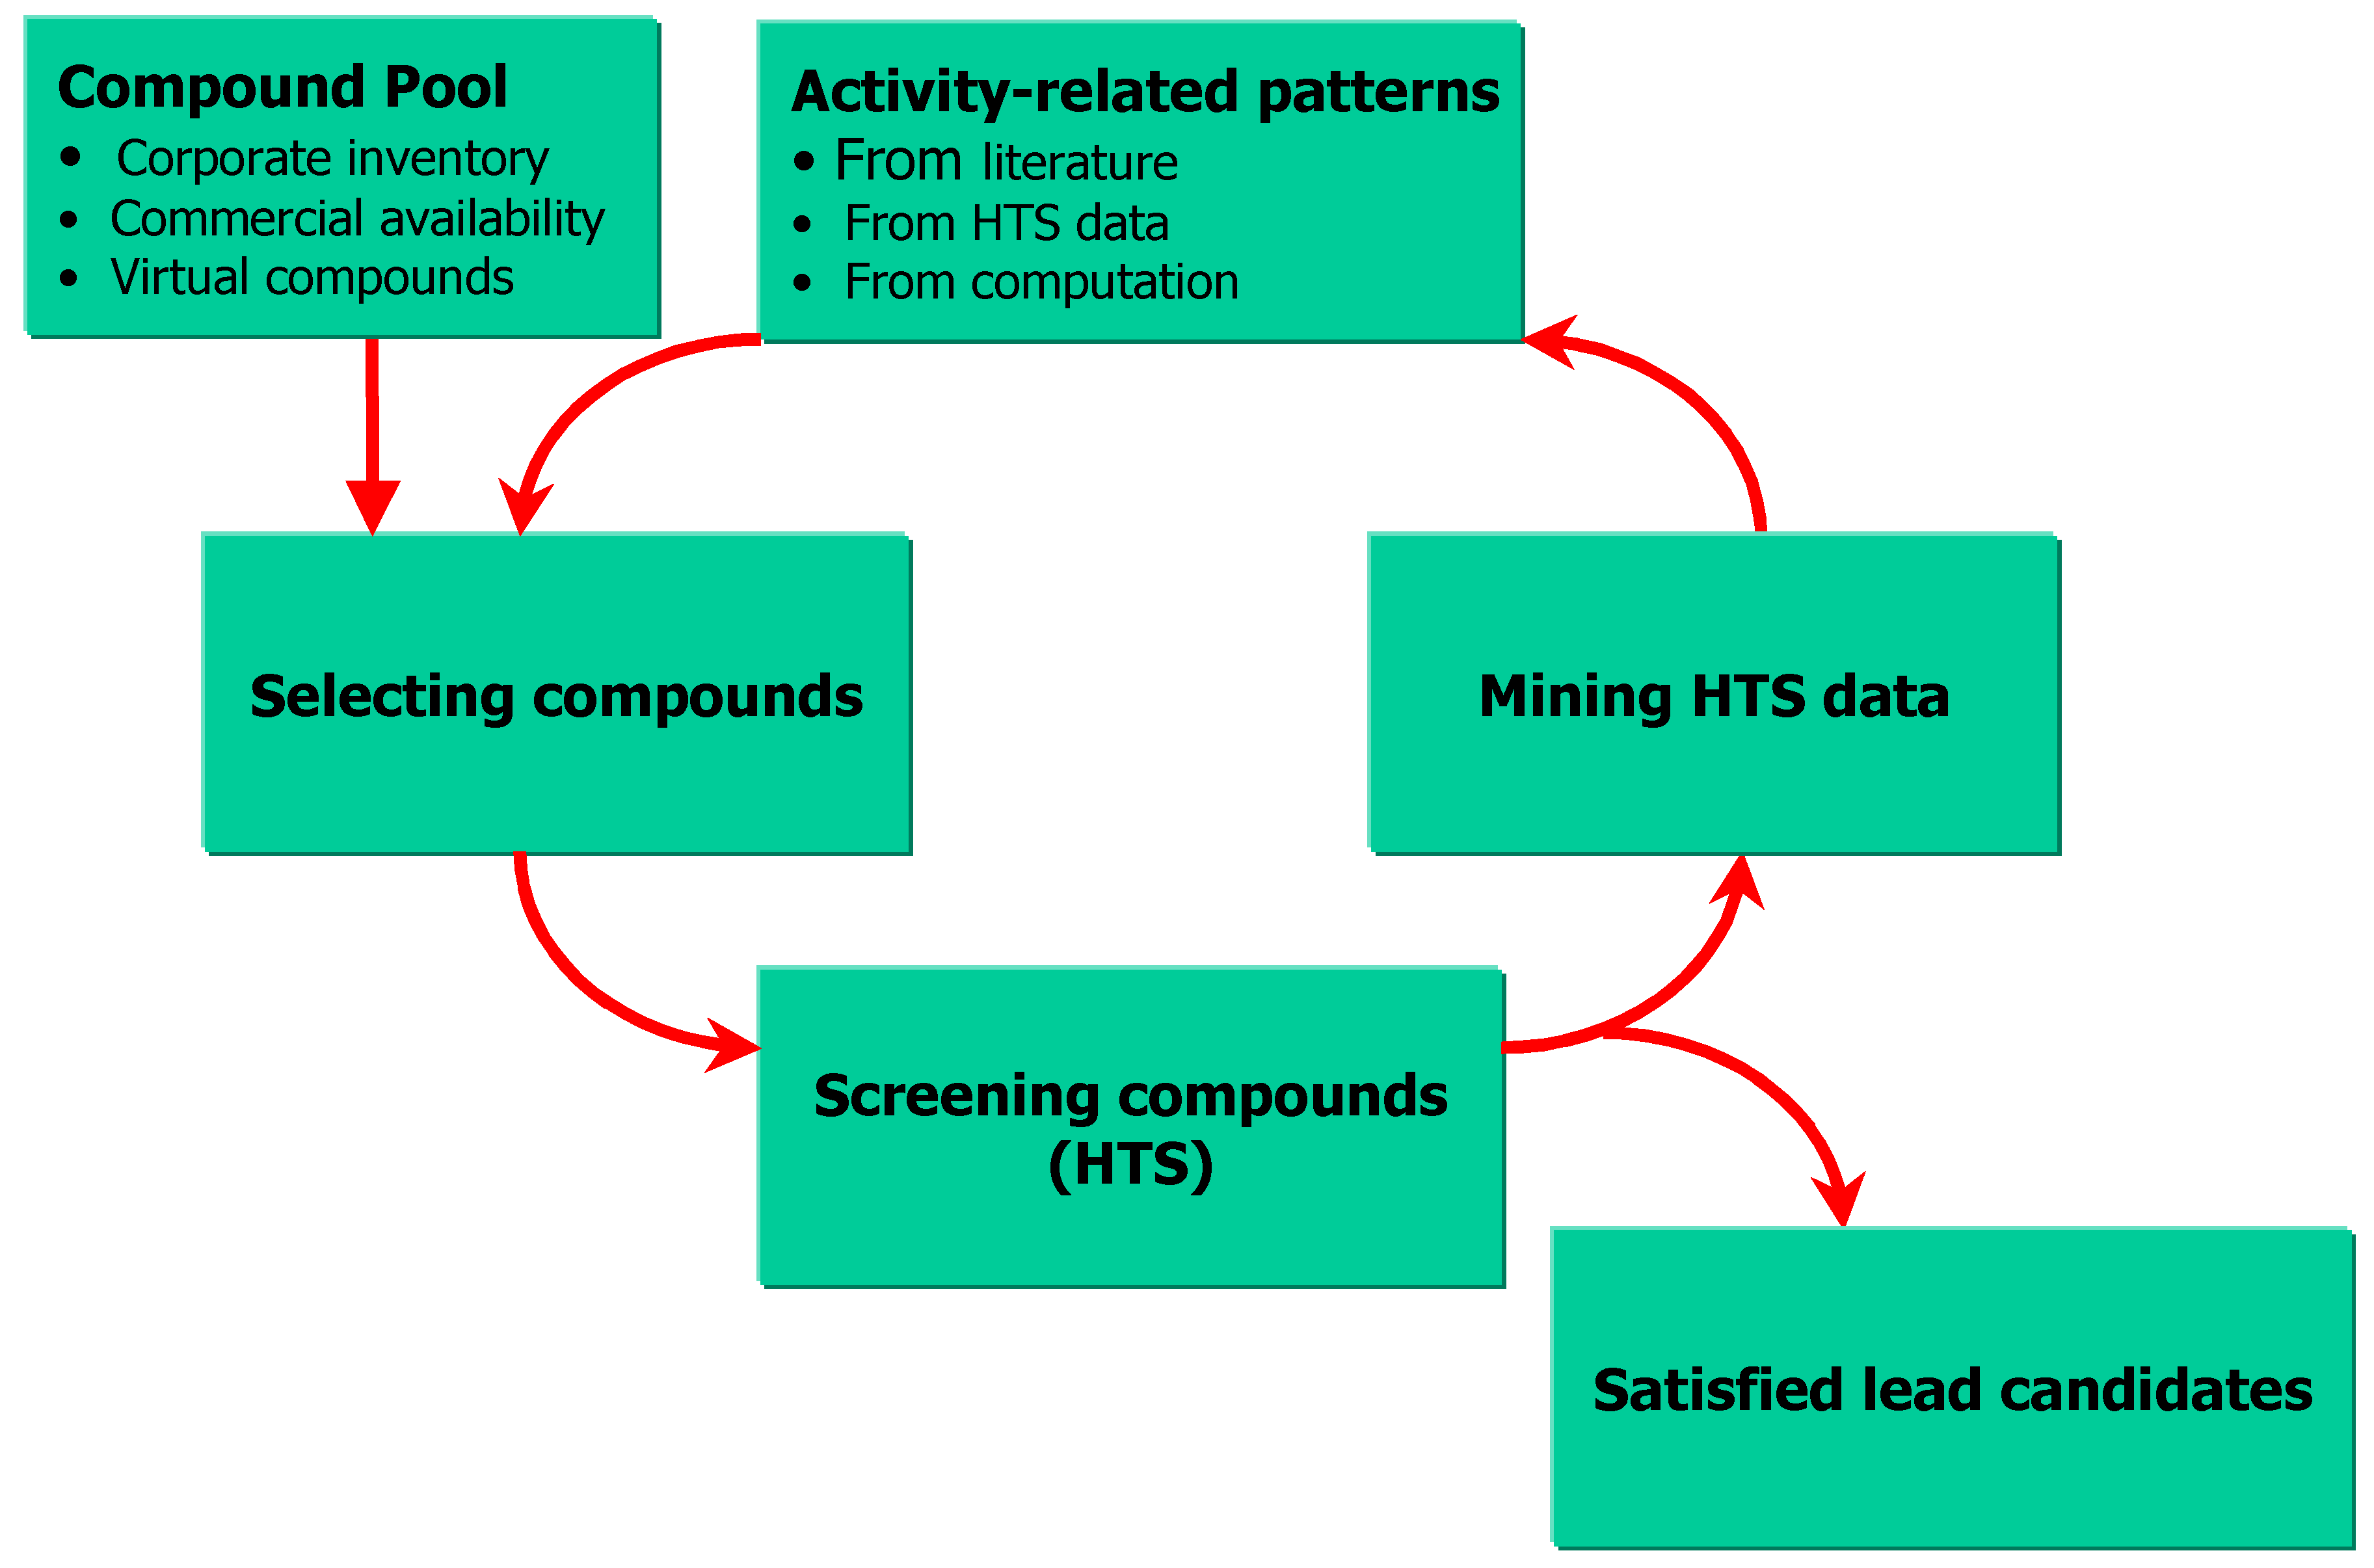
Sequential HTS is illustrated in Figure 3. The purpose of this process is to maximize receptor-ligand interaction information by using HTS and CC technologies, discover novel leads as soon as possible and, minimize HTS and library production costs. Hawkins, Young, Rusinko and co-workers at GlaxoSmithKline recently published a number of papers on sequential HTS [102,103]. Sequential HTS screens compounds iteratively for activity, analyzes the results and, selects a new set of compounds for next screening, based on what has been learned from the previous screens. The iteration ends when the desired, nano-molar, novel leads are identified. Compound selection is driven by rapid SAR analyses using recursive-partitioning techniques [104]. Although there are not many publications on the subject, sequential HTS has been studied in many pharmaceutical companies under different terminologies, such as: recursive screening, and progressive screening.
Figure 3.
Scheme for sequential HTS

In silico ADMET
Historically, drug absorption, distribution, metabolism, excretion, and toxicity (ADMET) studies in animal models were performed after a lead compound was identified. Now, pharmaceutical companies are employing higher-throughput, in vitro assays to evaluate the ADMET characteristics of potential leads at earlier stages of development. This is done in order to eliminate candidates as early as possible, thus avoiding costs, which would have been expended on chemical synthesis and biological testing. Scientists are developing computational methods to select only compounds with reasonable ADMET properties for screening. Molecules from these computationally screened virtual libraries can then be synthesized for high-throughput biological activity screening. As the predictive ability of ADME/Tox software improves, and as pharmaceutical companies incorporate computational prediction methods into their R&D programs, the drug discovery process will move from a screening-based to a knowledge-based paradigm. Under multi-parametric optimization drug discovery strategies, there is no excuse for failing to know the relative solubility and permeability rankings of collections of chemical compounds for lead identification [105].
- Absorption. Passive intestinal absorption (PIA) models have been studied by many groups, for years. The fluid mosaic model holds that the structure of a cell membrane is an interrupted phospholipid bilayer capable of both hydrophilic and hydrophobic interactions [106]. Trans-cellular passage through the membrane lipid/aqueous environment is the predominant pathway for passive absorption of lipophilic compounds, while low-molecular-weight (<200), hydrophilic compounds make use of the water-filled channels of the tight junctions between membrane cells (paracellular transport) [107]. Therefore, lipophilicity is considered a key property for activity in drug design and is a common property used to estimate the membrane permeability of a molecule. Lipophilicity is measured as the log of the partition coefficient between n-octanol and water (logP). LogP prediction programs are available and results are reasonably good [108a-e]. But, the relationship between logP and permeability is not linear. Permeability drops at both low and high logP. It is theorized that These non-linearities due to: (1) the inability of weakly lipophilic compounds to penetrate the lipid portion of the membrane and (2) the excessive partitioning of strongly lipophilic compounds into the lipid portion of the membrane and their subsequent inability to pass through the aqueous portion of the membrane [108f]. A strong relationship between PIA and polar surface area (PSA) has been discovered by several groups [109,110,111,112,113]. However, the models usually do not take the effects of other descriptors into account. In addition, the datasets used to build the PSA models are small. Even though a wide range of PSA was covered, it is not necessarily true the models cover the entire chemical space. Therefore, linear and non-linear multivariate models have been introduced to model PIA based upon: logP, molecular weight, H-bonding, free energy, H-bond donor, H-bond acceptor, polarizability, numbers and strengths of H-bond acceptor nitrogen and oxygen atoms, number of H-bond donor atoms, and lipophilicity (log D at pH 7.4) on the Caco-2 cell permeability. To select the best descriptors for predictive models, a genetic algorithm has been used
- Distribution. CNS-active drugs (CNS, central nervous system) must cross the blood-brain barrier (BBB). The experimental determination of the brain-blood partition ratio is difficult and time-consuming to compute since it involves the direct measurement of the drug concentration in the brain and blood of laboratory animals. This obviously requires the synthesis of the compounds, often in radiolabeled form [120]. In vitro techniques to predict brain penetration are available [121], but they are experimentally cumbersome. The earlier work involved in correlating log(Cbrain/Cblood) or logBB and logP (octanol-cyclohexane), Pcyclohexane, or logPoct was based upon smaller (about 20 compounds) data sets [122,123,124]. More descriptors have been correlated with logBB [125,126,127], such as: excess molar refraction, solute polarizability, hydrogen bond acidity and basicity, and molecular volume. More recently a regression study on logBB and free energy G has been reported [122]. Descriptors derived from 3D molecular fields to estimate the BBB permeation on a larger set of compounds and to produce a simple mathematical model have been studied. The method used (VolSurf) transforms 3D fields into descriptors and correlates them to the experimental permeation by a discriminant partial least squares procedure [128]. Human serum albumin (HSA) protein is the major transporter of non-esterified fatty acids, as well as of different drugs and metabolites, to different tissues. HSA allows solubilization of hydrophobic compounds, contributes to a more homogeneous distribution of drugs in the body, and increases their biological lifetime. The binding strength of any drug to serum albumin is the main factor for availability of that drug to diffuse from the circulatory system to target tissues. All these factors cause the pharmacokinetics of almost any drug to be influenced and controlled by its binding to serum albumin [129]. Therefore, QSAR study on binding of drugs and metabolites to HSA is extremely important for the drug distribution. Biosensor analysis for prediction of HSA has been reported 130. In order to build an in silico predictive model for binding affinities to HSA, Colmenarejo and co-workers at GlaxoSmithKline used a genetic algorithm to exhaustively search and select for multivariate and non-linear equations, starting from a large pool of molecular descriptors. They found that hydrophobicity (as measured by the ClogP) is the most important variable for determining the binding extent to HSA. Binding to HSA turns out to be determined by a combination of hydrophobic forces together with some modulating shape factors [131]. This agrees with X-ray structures of HSA alone or, bound to ligands, where the binding pockets of both sites I and II are composed mainly of hydrophobic residues [132].
- Metabolism. Drug metabolism is another barrier to overcome. Metabolism is studied, by in vitro, in vivo and in silico approaches. HTS has been used for metabolism and pharmacokinetics [133,134]. In vitro approaches determine metabolic stability, screening for inhibitors of specific cytochrome P450 isozymes and, identifying the most important metabolites. In vivo approaches measure hepatic metabolic clearance, volume of distribution, bioavailability, and, identify major metabolites. In silico approaches are categorized into three classes [135]: QSAR and pharmacophore models, protein models, and expert systems. QSAR and pharmacophore models predict substrates and inhibitors of a specific cytochrome P450 isozyme [136,137]. Protein models rationalize metabolite formations and identify possible substrates, potential metabolites or, inhibitors by means of docking algorithms [138,139]. Stereoelectronic factors involved in metabolic transformations can be taken into account using quantum chemical calculations. Expert systems are predictive databases that attempt to identify potential metabolites of a compound as determined by knowledge based rules defining the most likely products [140,141]. Testa advised that in structure-metabolism relationship (SMR) studies, the greater the chemical diversity of the investigated compounds, the smaller the chance that SMRs exist and can be uncovered. On the other hand, the information content of an SMR (if it exists) will increase as the boundaries of the chemical space increases and as the diversity of the compounds under investigation increases [142]. This paradox may limit the capacity of SMR, no matter which approach is used. Keseru and Molnar [135] think efficient PK optimization requires metabolic diversity within the focused library that cannot be achieved by the application of a simple SMR with limited information content. The high degree of structural similarity (especially in combinatorial libraries with a common core) prevents the application in metabolic diversity analysis. Therefore, they introduced a metabolic fingerprint concept, METAPRINT, for the assessment of metabolic similarity and diversity in combinatorial chemical libraries. Their metabolic fingerprint was developed by predicting metabolic pathways and corresponding potential metabolites.
- Excretion/Elimination. Drugs such as the non-steroidal anti-inflammatory drugs (NSAIDs), are used in long term treatment. The accumulation of these drugs in the body may lead to serious side effects. Therefore, the prediction of half-life, which determines the length of time a drug will persist in the body, is important in order to reduce subsequent drug failures. Prediction of half-life is difficult, due to the multi-faceted nature of drug elimination. Distribution of drug in fat and major organs, excretion by kidneys and metabolism by liver all contribute to the rate at which a drug is eliminated from the body. On the other hand, it may be possible to make use of qualitative predictions of half-life. Such information can be used, for example, to predict whether a drug is likely to accumulate to a significant extent when used for prolonged treatment [143].
- Toxicity. Many drugs are withdrawn for safety reasons and there are many reasons, including metabolism and excretion/elimination that cause toxicity. Current toxicity prediction approaches use either mechanistic or correlative methods. Correlative systems take molecular descriptors, biological data, and chemical structures and, by use of statistical analysis of data sets, represent them in mathematical models. The models describe the relationships between structure and activity and can be used to predict toxicity. The mechanistic approach involves human experts who make a considered assessment of the mechanism of interaction with a biological system, taking the molecular properties, biological data, and chemical structures into account [144]. The correlative approach uses an unbiased assessment of the data to generate relationships and predict toxicity. It is capable of discovering potentially new SARs [145] and, can lead to new ideas in the human assessment of mechanisms by which chemicals interact with biological systems. It is most useful for congeneric data sets or when one has a large amount of good data but little mechanistic knowledge. However, it can also generate relationships that have little chemical or biological plausibility. Results obtained are heavily dependent upon the quality of the data used to build the model. For these reasons careful validation is required for effective use of the correlative approach. The mechanistic method is based upon an understanding or hypothesis of the mechanisms of molecular interactions that determine the activity, i.e., there is some human input into the system of SAR generation. However, systems using this approach are restricted to human knowledge, being incapable of discovering new relationships automatically. As a consequence, they also have a tendency to be biased toward current ideas about mechanisms of action [144]. The early toxicity models were based on QSAR models and were used to predict LD50 [144], based upon various descriptors [146,147,148]. It was also reported that QSAR models (partial least-squares (PLS), Bayesian regularized neural network) correlating IGC50 [149] with the hydrophobicity, the logarithm of the 1-octanol/water partition coefficient, the molecular orbital properties, the lowest unoccupied molecular orbital energy (Elumo) and, maximum acceptor super-delocalizability (Amax) [150,151]. More QSAR models are still coming forth [152,153]. A representative mechanistic toxicity prediction approach was reported by Sanderson and co-workers [144,154,155,156]. The program is now commercially available [157]. Artificial neural networks (ANN) have recently been applied in toxicity predictions [158,159,160]; these include: back-propagation neural network, Bayesian-Regularized Neural Networks, and self-organization map (SOM). The organizations providing ADMET solutions are listed in reference [161].
3. Future Directions
Parallel optimization.
Cheminformatics has attained many achievements in diversity analysis, SAR, and virtual screening during the past decade. The new challenge is the parallel optimization of potency, selectivity and ADMET properties via predictive computational models [17]. Currently, there is no integrated system for this parallel optimization. In silico ADMET models are not broadly accepted and utilized because these models are not sufficiently robust and do not cover the diversity of medicinal chemists’ concerns. Good performance has, however, been attained in drug-likeness, solubility, and lipophilicity (logP).
The paradox of predictivity versus diversity
Many ADMET models are based upon small sets of chemical compounds (from tens to hundreds). These models are frequently cited as non-significance by potential users. Paradoxically, one of the reasons that these sets are so small is that many of the pharmaceutical companies in which these same potential users are working, do not share their in-house experimental data [19]. However, a more general problem for SAR study provides even a greater paradox, that of: predictivity versus diversity. This problem evolves from the fact that the greater the chemical diversity of the investigated compounds, the smaller the chance that SAR models exist and can be uncovered. On the other hand, the information content of an SAR model (if it exists) will increase as the boundaries of the chemical space and the diversity of the compounds under investigation increases. This phenomenon was revealed by Testa in his structure-metabolism relationship (SMR) studies [142]. We believe it is also true in other in silico ADMET studies. It results from the condition that each bioactivity has its own mechanism. For example, there are many mechanisms to explain toxicity. In order to solve this paradox problem, one might consider combining the mechanism-based approaches (for example, a rule-based expert system) with other data mining approaches (such as classifications, regressions, and neural networks).
From data mining to knowledge discovery
HTS, CC, and other new technologies produce great amounts of data. The total amount of data is still expanding exponentially. Current drug discovery is driven by data. However, the more important goal is to discover knowledge from the raw data. Knowledge discovery is defined as “the non-trivial extraction of implicit, unknown, and potentially useful information from data” [162]. It is true that HTS data studies discover knowledge (structural patterns, which are responsible for the concerned bioactivities). However, at the start of one’s data mining efforts, it is not know if such knowledge is present in the database or if it can be effectively used and even if patterns can be reasonably extricated. The knowledge discovery process takes the raw, experimental results from data mining (the process of extracting trends or patterns from data), and then transforms it into useful and understandable information. This information is not typically retrievable by standard techniques [163]. Knowledge discovery should include the following stages:
Exploratory Data Analysis. The purposes of this stage is to derive features (descriptors), to select relevant features (bioactivities related descriptors), and to systematically identify the relations among the features.
Pattern Discovery. This stage uses various multivariable classification technologies, linear or non-linear regression technologies, expert system approaches and machine learning technologies to discover the patterns, which can explain the data in great detail.
Pattern Explanation. Any result should be explainable to chemists or biologists. Some data mining results can be straight forward for chemists, such as, topological patterns. However, the results from statistical approaches or machine learning methods may appear difficult for chemists to understand. Therefore, de-convolution or data visualization technologies are required to translate the abstract pattern such as, neural network patterns so that chemists can take chemical actions.
New Technologies. New technologies, such as support vector machines (SVM) are appearing in recent scientific applications [164]. SVM is one of the discriminant approaches. This method eliminates many problems (such as: local minima, un-robust results, and too many parameter settings) experienced with other inference methodologies like neural networks and decision trees. However, more investigations are required for applying SVM in cheminformatics.
Acknowledgments
We would like to thank Mr. Richard Shaps for his comments and advice.
References and Notes
- Augen, J. The evolving role of information technology in the drug discovery process. Drug Discov. Today 2002, 7, 315–323. [Google Scholar]
- Gallop, M. A.; Barrett, R. W.; Dower, W. J.; Fodor, S. P. A.; Gordon, E. M. Applications of Combinatorial Technologies to Drug Discovery. 1. Background and Peptide Combinatorial Libraries. J. Med. Chem. 1994, 37, 1233–1251. [Google Scholar]
- Hecht, P. High-throughput screening: beating the odds with informatics-driven chemistry. Curr. Drug Discov. 2002, 21–24. [Google Scholar]
- Hall, D. G.; Manku, S.; Wang, F. Solution- and Solid-Phase Strategies for the Design, Synthesis, and Screening of Libraries Based on Natural Product Templates: A Comprehensive Survey. J. Comb. Chem. 2001, 3, 125–150. [Google Scholar]
- Bemis, G. W.; Murcko, M. A. The properties of known drugs. 1. Molecular Frameworks. J. Med. Chem. 1996, 39, 2887–2893. [Google Scholar] [CrossRef] Bemis, G. W.; Murcko, M. A. The properties of known drugs. 2. Side Chains. J. Med. Chem. 1999, 42, 5095–5099. [Google Scholar] [CrossRef]
- Ajay; Walters, W. P.; Murcko, M. A. Can we learn to distinguish between “drug-like” and “non-drug-like” molecules? J. Med. Chem. 1998, 41, 3314–3324. [Google Scholar]
- Sadowski, J.; Kubinyi, H. A scoring scheme for discriminating between drugs and non-drugs. J. Med. Chem. 1998, 41, 3325–3329. [Google Scholar] [CrossRef]
- Xu, J.; Stevenson, J. Drug-like Index: A New Approach To Measure Drug-like Compounds and Their Diversity. J. Chem. Inf. Comput. Sci. 2000, 40, 1177–1187. [Google Scholar] [CrossRef]
- Lipinski, C.A.; Lombardo, F.; Dominy, B.W.; Feeney, P.J. Experimental and computational approaches to estimate solubility and permeability in drug discovery and development settings. Adv. Drug Deliv. Rev. 1997, 23, 3–25. [Google Scholar] [CrossRef]
- Clark, D. E.; Pickett, S. D. Computational methods for the prediction of ‘drug-likeness’. Drug Discov. Today 2000, 5, 49–58. [Google Scholar]
- Matter, H.; Baringhaus, K.-H.; Naumann, T.; Klabunde, T.; Pirard, B. Computational approaches towards the rational design of drug-like compound libraries. Comb. Chem. High T. Scr. 2001, 4, 453–475. [Google Scholar]
- Oprea, T. I.; Davis, A. M.; Teague, S. J.; Leeson, P. D. Is There a Difference between Leads and Drugs? A Historical Perspective. J. Chem. Inf. Comput. Sci. 2001, 41, 1308–1315. [Google Scholar]
- Proudfoot, J. R. Drugs, Leads, and Drug-Likeness: An Analysis of Some Recently Launched Drugs. Bioorg. Med. Chem. Lett. 2002, (in press). [Google Scholar]
- Stewart, L.; Clark, R.; Behnke, C. High-throughput crystallization and structure determination in drug discovery. Drug Discov. Today 2002, 7, 187–196. [Google Scholar]
- Luft, J. R.; Wolfley, J.; Collins, R.; Bianc, M.; Weeks, D.; Jurisica, I.; Rogers, P.; Glasgow, J.; Fortier, S.; DeTitta, G. T. High Throughput Protein Crystallization: Keeping up with the Genomics. 2002. www.imca.aps.anl.gov/~ahoward/luft_ab.html.
- Kennedy, T. Drug Discov. Today 1997, 2, 436–444. Start-Up: Windhover’s Review of Emerging Medical Ventures. July 2000, p. page 34. www.windhoverinfo.com/contents/monthly/exex/e_2000900126.htm.
- Manly, C. J.; Louise-May, S.; Hammer, J. D. The impact of informatics and computational chemistry on synthesis and screening. Drug Discov. Today 2001, 6, 1101–1110. [Google Scholar]
- Baxter, A. D.; Lockey, P. ‘Hit’ to ‘lead’ and ‘lead’ to ‘candidate’ optimization using multi-parametric principles. Drug Discov. World 2001, 2, 9–15. [Google Scholar]
- Wilson, E. K. Picking the winners. Chem. Eng. News 2002, 35–39. [Google Scholar]
- http://pubs.acs.org/archives/percent.html.
- Xu, J. GMA: A Generic Match Algorithm for structural Homomorphism, Isomorphism, Maximal Common Substructure Match and Its Applications. J. Chem. Inf. Comput. Sci. 1996, 36, 25–34. [Google Scholar] [CrossRef]
- http://www.asis.org/Features/Pioneers/wiswess.htm.
- Weininger, D. SMILES, a chemical language and information system. 1. Introduction to methodology and encoding rules. J. Chem. Inf. Comput. Sci. 1988, 28, 31–6. [Google Scholar] [CrossRef]
- http://esc.syrres.com/interkow/docsmile.htm.
- Wiener, H. Structural Determination of Paraffin Boiling Points. J. Am. Chem. Soc. 1947, 69, 17–20. [Google Scholar] [CrossRef]
- Hu, C.; Xu, L. On Highly Discriminating Molecular Topological Index. J. Chem. Inf. Comput. Sci. 1996, 36, 82–90. [Google Scholar]
- The definitions of MDL’s 166 MACCS search keys can be found from ISIS/Base Help file under “Remote QB in a Molecule Database: Searching Concepts/Examples” at the section 49.2.4: Specifying Searchable Keys as a Query.
- http://www.daylight.com/about/f_search.html.
- Rhodes, N.; Willett, P. Bit-String Methods for Selective Compound Acquisition. J. Chem. Inf. Comput. Sci. 2000, 40, 210–214. [Google Scholar]
- Kier, L. B.; Hall, L. H. Molecular Connectivity in Structure-Activity Analysis. Research Studies Press: Lectchworth, Hertfordshire, England, 1986. [Google Scholar]
- http://www.disat.unimib.it/chm/.
- Chemical Computing Group, Inc., 1010 Sherbrooke Street West, Suite 910, Montreal, Quebec, Canada, H3A 2R7, Tel: (514) 393-1055 Fax: (514) 874-9538.
- Hall, L. H. Computational Aspects of Molecular Connectivity and its Role in Structure-Property Modeling. In Computational Chemical Graph Theory; Rouvray, D. H., Ed.; Nova Press: New York, 1990; Chap. 8; pp. 202–233. [Google Scholar]
- Chemical Computing Group, Inc., 1010 Sherbrooke Street West, Suite 910, Montreal, Quebec, Canada, H3A 2R7, Tel:(514) 393-1055 Fax: (514) 874-9538.
- Accelrys Inc. a subsidiary of Pharmacopeia Inc.
- Cox, T.F.; Cox, M. A. A. Multidimensional Scaling. 2000. [Google Scholar]
- http://www.statsoft.com/textbook/stmulsca.html#general.
- Kohonen, T.; Kangas, J.; Laaksonen, J. SOM_PAK, The Self-Organizing Map Program Package available for anonymous ftp user at Internet site cochlea.hut.fi, version 1.2, November 1992.
- Zupan, J.; Gasteiger, J. Neural Networks for Chemists. VCH: Weinheim, 1993. [Google Scholar]
- Bernard, P.; Golbraikh, A.; Kireev, D.; Chrétien, J. R.; Rozhkova, N. Comparison of chemical databases: Analysis of molecular diversity with Self Organising Maps (SOM). Analusis 1998, 26, 333–346. [Google Scholar]
- http://www.statsoft.com/textbook/stfacan.html.
- Joliffe, I.T. Principal Component Analysis; Springer-Verlag: New York, 1986. [Google Scholar]
- Malinowski, E.H.; Howery, D.G. Factor Analysis in Chemistry; John Wiley & Sons: New York, 1980. [Google Scholar]
- http://www.spotfire.com/.
- Xu, J. SCA: New Cluster Algorithm for Structural Diversity Analysis and Applications. The First Spotfire Users Conference. Philadelphia, May 30, 2001.
- Brown, R. D.; Martin, Y. C. Use of Structure-Activity Data To Compare Structure-Based Clustering Methods and Descriptors for Use in Compound Selection. J. Chem. Inf. Comput. Sci. 1996, 36, 572–584. [Google Scholar]
- Matter, H.; Pötter, T. Comparing 3D Pharmacophore Triplets and 2D Fingerprints for Selecting Diverse Compound Subsets. J. Chem. Inf. Comput. Sci. 1999, 39, 1211–1225. [Google Scholar] [CrossRef]
- Estrada, E.; Molina, E.; Perdomo-Lopez, I. Can 3D Structural Parameters Be Predicted from 2D (Topological) Molecular Descriptors? J. Chem. Inf. Comput. Sci. 2001, 41, 1015–1021. [Google Scholar]
- Xue, L.; Stahura, F. L.; Godden, J. W.; Bajorath, J. Mini-fingerprints Detect Similar Activity of Receptor Ligands Previously Recognized Only by Three-Dimensional Pharmacophore-Based Methods. J. Chem. Inf. Comput. Sci. 2001, 41, 394–401. [Google Scholar]
- 2002. http://spheroid.ncifcrf.gov/scripts/mapviewer.cfm.
- 2001. http://www.daylight.com/about/f_search.html.
- Tryon, R. C. J. Chronic Dis. 1939, 20, 511–524. http://www.statsoftinc.com/textbook/stcluan.html.
- Jarvis, R.A.; Patrick, E.A. Clustering Using a Similarity Measure Based on Shared Near Neighbors. 1973, C22, 1025–1034. [Google Scholar]
- Hierarchical cluster methods are implemented in agglomerative (bottom-up) or divisive (top-down) procedure. The hierarchical clustering approach finds a hierarchy of objects represented by a number of descriptors. There are three methods to merge objects into clusters: the centroid method, Ward's method and average linkage. For an agglomerative procedure, each object begins in a cluster by itself. The two closest clusters are merged to form a new cluster replacing the two old clusters. Merging of the two closest clusters is repeated until only one cluster remains. The different hierarchical clustering methods differ in how the distance between two clusters is computed. In the centroid method, the distance between two clusters is defined as the distance between their centroids or means. The centroid method is more robust than most other hierarchical methods but, in many other respects, does not perform as well as Ward's method or, average linkage. In Ward's method, the distance between two clusters is the sum of squares between the two clusters added up over all of the variables. At each generation, the within-cluster sum of squares is minimized over all partitions obtainable by merging two clusters from the previous generation. This method tends to join clusters with a small number of objects and, is biased toward producing clusters with roughly the same number of objects. The average linkage distance between two clusters is defined as the average distance (squared Euclidean) between pairs of objects, one in each cluster. Average linkage tends to join clusters with small variances and, is biased toward producing clusters with roughly the same variance. Studies suggest that Ward's method and average linkage method are among the better hierarchical clustering algorithms. Intrinsically, hierarchical clustering approaches ignore the fact that scientific data may have many outliers. They average all objects eventually to one cluster. However, the outliers should statistically be left alone.
- Most popular partitional cluster algorithms are K-mean algorithms and Javis-Patrick (K-nearest neighbor, Knn) algorithms. K-mean clustering algorithms use an interchange (or switching) method to divide n data points into K groups (clusters) so that the sum of distances/dissimilarities among the objects within the same cluster is minimized. The K-mean approach requires that K (the number of clusters) is known before clustering. In the most of cases, however, the number of clusters may be not known. The K-mean clustering result depends on the order of the rows in the input data, the options of K-bins initialization, and number of iterations for minimizing distances. Even if there is a best guess for K, the K-mean approach involves a NP problem (combinatorial explosion). The number of combinations of partitioning N objects into K groups is an astronomical high figure. It will force a program to abort after a given number of iterations in order to produce result in a feasible period of time. Javis-Patrick requires the user specifies the number of nearest neighbors, and the number of neighbors in common to merge to objects. Javis-Patrick is a deterministic algorithm, it doesn’t require number of iterations for computations. Both K-mean and Javis-Patrick algorithms do not directly give the answer for the number of clusters.
- Willett, P. Similarity and Clustering in Chemical Information Systems. Research Studies Press, Wiley: New York, 1987. [Google Scholar]
- Rusinko, A., III; Farmen, M. W.; Lambert, C. G.; Brown, P. L.; Young, S. S. Analysis of a Large Structure/Biological Activity Data Set Using Recursive Partitioning. J. Chem. Inf. Comput. Sci. 1999, 39, 1017–1026. [Google Scholar]
- Rusinko, A., III; Young, S. S.; Drewry, D. H.; Gerritz, S. W. Optimization of Focused Chemical Libraries Using Recursive Partitioning. Comb. Chem. High T. Scr. 2002, 5, 125–133. [Google Scholar]
- Wikel, J. H.; Higgs, R. E. Applications of molecular diversity analysis in high throughput screening. J. Biomol. Screen. 1997, 2, 65–67. [Google Scholar] [CrossRef]
- Sadowski, J.; Wagener, M.; Gasteiger, J. Assessing similarity and diversity of combinatorial libraries by spatial autocorrelation functions and neural networks. Angew. Chem. Int. Ed. Engl. 1995, 34, 2674–2677. [Google Scholar] [CrossRef]
- Sheridan, R. P.; Kearsley, S. K. Using a genetic algorithm to suggest combinatorial libraries. J. Chem. Inf. Comput. Sci. 1995, 35, 310–320. [Google Scholar] [CrossRef]
- Brown, R. D.; Martin, Y. C. Use of Structure-Activity Data To Compare Structure-Based Clustering Methods and Descriptors for Use in Compound Selection. J. Chem. Inf. Comput. Sci. 1996, 36, 572–584. [Google Scholar]
- Gillet, V. J.; Willett, P.; Bradshaw, J. The Effectiveness of Reactant Pools for Generating Structurally-Diverse Combinatorial Libraries. J. Chem. Inf. Comput. Sci. 1997, 37, 731–740. [Google Scholar]
- Agrafiotis, D. K. Stochastic Algorithms for Maximizing Molecular Diversity. J. Chem. Inf. Comput. Sci. 1997, 37, 841–851. [Google Scholar]
- Agrafiotis, D. K.; Lobanov, V. S. An Efficient Implementation of Distance-Based Diversity Measures Based on k-d Trees. J. Chem. Inf. Comput. Sci. 1999, 39, 51–58. [Google Scholar]
- Clark, R. D. OptiSim: An Extended Dissimilarity Selection Method for Finding Diverse Representative Subsets. J. Chem. Inf. Comput. Sci. 1997, 37, 1181–1188. [Google Scholar]
- Clark, R. D.; Langton, W. J. Balancing Representativeness Against Diversity using Optimizable K-Dissimilarity and Hierarchical Clustering. J. Chem. Inf. Comput. Sci. 1998, 38, 1079–1086. [Google Scholar]
- Pötter, T.; Matter, H. Random or Rational Design? Evaluation of Diverse Compound Subsets from Chemical Structure Databases. J. Med. Chem. 1998, 41, 478–488. [Google Scholar] [CrossRef]
- Pearlman, R. S.; Smith, K. M. Metric Validation and the Receptor-Relevant Subspace Concept. J. Chem. Inf. Comput. Sci. 1999, 39, 28–35. [Google Scholar]
- Bayada, D. M.; Hamersma, H.; van Geerestein, V. J. Molecular Diversity and Representativity in Chemical Databases. J. Inf. Comput. Sci. 1999, 39, 1–10. [Google Scholar]
- Xue, L.; Godden, J.; Gao, H.; Bajorath, J. Identification of a Preferred Set of Molecular Descriptors for Compound Classification Based on Principal Component Analysis. J. Info. Comput. Sci. 1999, 39, 699–704. [Google Scholar]
- Munk Jörgensen, A. M.; Pedersen, J. T. Structural Diversity of Small Molecule Libraries. J. Chem. Inf. Comput. Sci. 2001, 41, 338–445, This paper reported a method for assessing structural diversity based upon maximum common sub-graph identity as the measure of similarity between two chemical structures. A conditional probability treatment of similarity distributions for libraries of chemical structures is used to define diversity. [Google Scholar]
- Mount, J.; Ruppert, J.; Welch, W.; Jain, A. N. IcePick: a flexible suface-based system for molecular diversity. J. Med. Chem. 1999, 42, 60–66. [Google Scholar] [CrossRef]
- Zheng, W.; Cho, S. J.; Waller, C. L.; Tropsha, A. J. J. Chem. Inf. Comput. Sci. 1999, 39, 738–746.
- Reynolds, C. H.; Druker, R.; Pfahler, L. B. Lead Discovery Using Stochastic Cluster Analysis (SCA): A New Method for Clustering Structurally Similar Compounds. J. Chem. Inf. Comput. Sci. 1998, 38, 305–312. [Google Scholar] [CrossRef]
- Reynolds, C. H.; Tropsha, A.; Pfahler, L. B.; Druker, R.; Chakravorty, S.; Ethiraj, G.; Zheng, W. Diversity and Coverage of Structural Sublibraries Selected Using the SAGE and SCA Algorithms. J. Chem. Inf. Comput. Sci. 2001, 41, 1470–1477, This paper discussed rational approaches to selecting representative subsets of virtual libraries that help direct experimental synthetic efforts for diverse library design. The authors compared the performance of two stochastic sampling algorithms, Simulating Annealing Guided Evaluation (SAGE) and Stochastic Cluster Analysis (SCA) for their ability to select both diverse and representative subsets of the entire chemical library space. Tests were carried out using simulated two-dimensional data sets and a 27,000 compound proprietary structural library as represented by computed Molconn-Z descriptors. The algorithmically simple SCA method is capable of selecting subsets that are comparable to the more computationally intensive SAGE method. [Google Scholar] [CrossRef]
- Agrafiotis, D. K.; Rassokhin, D. N. A Fractal Approach for Selecting an Appropriate Bin Size for Cell-Based Diversity Estimation. J. Chem. Inf. Comput. Sci. 2002, 42, 117–122, This paper reported an approach for selecting an appropriate bin size for cell-based diversity assessment. The method measures the sensitivity of the diversity index as a function of grid resolution, using a box-counting algorithm that is reminiscent of those used in fractal analysis. It is shown that the relative variance of the diversity score (sum of squared cell occupancies) of several commonly used molecular descriptor sets exhibits a bell-shaped distribution, whose exact characteristics depend on the distribution of the data set, the number of points considered, and the dimensionality of the feature space. The peak of this distribution represents the optimal bin size for a given data set and sample size. Although box counting can be performed in an algorithmically efficient manner, the ability of cell-based methods to distinguish between subsets of different spread falls sharply with dimensionality, and the method becomes useless beyond a few dimensions. [Google Scholar]
- Trepalin, S. V.; Gerasimenko, V. A.; Kozyukov, A.V; Savchuk, N. Ph.; Ivaschenko, A. A. New Diversity Calculations Algorithms Used for Compound Selection. J. Chem. Inf. Comput. Sci. 2002, 42, 249–258. [Google Scholar]
- Hamprecht, F. A.; Thiel, W.; van Gunsteren, W. F. Chemical Library Subset Selection Algorithms: A Unified Derivation Using Spatial Statistics. J. Chem. Inf. Comput. Sci. 2002, 42, 414–428, The authors modeled activity in a bioassay as realization of a stochastic process and use the best linear unbiased estimator to construct spatial sampling designs that optimize the integrated mean square prediction error, the maximum mean square prediction error, or the entropy. Author’s approach constitutes a unifying framework encompassing most proposed techniques as limiting cases and sheds light on their underlying assumptions. In particular, vector quantization is obtained, in dimensions up to eight, in the limiting case of very smooth response surfaces for the integrated mean square error criterion. Closest packing is obtained for very rough surfaces under the integrated mean square error and entropy criteria. The paper suggested using either the integrated mean square prediction error or the entropy as optimization criteria rather than approximations thereof and proposing a scheme for direct iterative minimization of the integrated mean square prediction error.. [Google Scholar]
- Bajorath, J. Selected Concepts and Investigations in Compound Classification, Molecular Descriptor Analysis, and Virtual Screening. J. Chem. Inf. Comput. Sci. 2001, 41, 233–245. [Google Scholar]
- Mander, T. Beyond uHTS: ridiculously HTS? Drug Discov. Today 2000, 5, 223–225. [Google Scholar]
- Valler, M. J.; Green, D. Diversity screening versus focused screening in drug discovery. Drug Discov. Today 2000, 5, 286–293. [Google Scholar]
- Walters, W. P.; Stahl, M. T.; Murcko, M. A. Virtual screening – an overview. Drug Discov. Today 1998, 3, 160–178. [Google Scholar]
- Joseph-McCarthy, D. An overview of in silico design and screening: Toward efficient drug discovery. Curr. Drug Discov. 2002, 20–23. [Google Scholar]
- Bajorath, J. Virtual screening in drug discovery: Methods, expectations and reality. Curr. Drug Discov. 2002, 24–27. [Google Scholar]
- Downs, G. M.; Barnard, J. M. Techniques for Generating Descriptive Fingerprints in Combinatorial Libraries. J. Chem. Inf. Comput. Sci. 1997, 37, 59–61. [Google Scholar] [CrossRef]
- Lobanov, V. S.; Agrafiotis, D. K. Scalable Methods for the Construction and Analysis of Virtual Combinatorial Libraries. Comb. Chem. High T. Scr. 2002, 5, 167–178. [Google Scholar]
- Lipinski, C. A.; Lombardo, F.; Dominy, B. W.; Feeney, P. J. Experimental and computational approaches to estimate solubility and permeability in drug discovery and development settings. Adv. Drug Deliver. Rev. 1997, 23, 3–25. [Google Scholar] [CrossRef]
- Huuskonen, J.; Rantanen, J.; Livingstone, D. Prediction of aqueous solubility for a diverse set of organic compounds based on atom-type electrotopological state indices. Eur. J. Med. Chem. 2000, 35, 1081–1088. [Google Scholar] [CrossRef]
- Zuegge, J.; Schneider, G.; Coassolo, P.; Lave, T. Prediction of hepatic metabolic clearance-comparison and assessment of prediction models. Clin. Pharmacokinet. 2001, 40, 553–563. [Google Scholar] [CrossRef]
- Roche, O.; Schneider, P.; Zuegge, J.; Guba, W.; Kansy, M.; Alanine, A.; Bleicher, K.; Danel, F.; Gutknecht, E. M.; Rogers-Evans, M.; Neidhart, W.; Stalder, H.; Dillon, M.; Sjogren, E.; Fotouhi, N.; Gillespie, P.; Goodnow, R.; Harris, W.; Jones, P.; Taniguchi, M.; Tsujii, S.; von der Saal, W.; Zimmermann, G.; Schneider, G. Development of a Virtual Screening Method for Identification of ‘Frequent Hitters’ in Compound Libraries. J. Med. Chem. 2002, 45, 137–142. [Google Scholar] [CrossRef]
- Abagyan, R.; Totrov, M. High-throughput docking for lead generation. Curr. Opin. Chem. Biol. 2001, 5, 375–382. [Google Scholar] [CrossRef]
- Diller, D. J.; Merz, K. M., Jr. High throughput docking for library design and library prioritization. Proteins 2001, 43, 113–124. [Google Scholar]
- Willett, P. Chemoinformatics – similarity and diversity in chemical libraries. Curr. Opin. Biotech. 2000, 11, 85–88. [Google Scholar] [CrossRef]
- Hopfinger, A. J.; Duca, J. S. Estimation of molecular similarity based on 4D-QSAR analysis: formalism and validation. J. Chem. Inf. Comput. Sci. 2001, 41, 1367–1387. [Google Scholar] [CrossRef]
- Makara, G. M. Measuring molecular similarity and diversity: total pharmacophore diversity. J. Med. Chem. 2001, 44, 3563–3571. [Google Scholar] [CrossRef]
- Hopfinger, A. J.; Duca, J. Extraction of pharmacophore information from high-throughput screens. Curr. Opin. Biotech. 2000, 11, 97–103. [Google Scholar] [CrossRef]
- Roberts, G.; Myatt, G. J.; Johnson, W. P.; Cross, K. P.; Blower, P. E., Jr. LeadScope: Software for Exploring Large Sets of Screening Data. J. Chem. Inf. Comput. Sci. 2000, 40, 1302–1314. [Google Scholar]
- Willet, P.; Gedeck, P. Visual and computational analysis of structure-activity relationships in high-throughput screening data. Curr. Opin. Chem. Biol 2001, 5, 389–395. [Google Scholar] [CrossRef]
- Hopfinger, A. J.; Reaka, A.; Venkatarangan, P.; Duca, J. S.; Wang, S. Construction of a Virtual High Throughput Screen by 4D-QSAR Analysis: Application to a Combinatorial Library of Glucose Inhibitors of Glycogen Phosphorylase b. J. Chem. Inf. Comput. Sci. 1999, 39, 1151–1160. [Google Scholar]
- Good, A. C.; Krystek, S. R.; Mason, J. S. High-througput and virtual screening: core lead discovery technologies move towards integration. Drug Discov. Today 2001, 5 (suppl.). [Google Scholar]
- Hawkins, D.M.; Young, S.S.; Rusinko, A., III. Analysis of a large structure-activity data set using recursive partitioning. Quant. Struct.-Act. Relat. 1997, 16, 296–302. [Google Scholar]
- Young, S. S. Sequential Screening. ScreenTech 2002 2002. [Google Scholar]
- Tropsha, A.; Zheng, W. Rational Principles of Focused Chemical Libraries Using Recursive Partitioning. Comb. Chem. High T. Scr. 2002, 5, 111–123. [Google Scholar]
- Lipinski, C. A. Poor aqueous solubility – an industry wide problem in ADME screening. 2002. Spotfire Users Europe Conference. http://www.spotfire.com/images/pdf/presentations2002/Chris_Lipinski_Lead_Identification_Europe.pdf.
- Singer, S. J.; Nicolson, G. L. The Fluid Mosaic Model of the Structure of Cell Membranes. Science 1972, 175, 720–731. [Google Scholar]
- Conradi, R. A.; Burton, P. S.; Borchardt, R. T. Physicochemical and Biological Factors that Influence a Drug's Cellular Permeability by Passive Diffusion. Methods. Princ. Med. Chem. 1996, 4, 233–252. [Google Scholar]
- (a) CLogP program was developed BioByte Corp., Claremont, CA.Viswanadhan, V. N.; Reddy, M. R.; Bacquet, R. J.; Erion, D. M. Assessment of Methods Used for Predicting Lipophilicity: Application to Nucleosides and Nucleoside Bases. J. Comput. Chem. 1993, 9, 1019–1026. [Google Scholar] [CrossRef] Klopman, G.; Li, J.-Y.; Wang, S.; Dimayuga, M. Computer Automated logP Calculations Based on an Extended Group Contribution Approach. J. Chem. Inf. Comput. Sci. 1994, 34, 752–781. [Google Scholar] [CrossRef] Wang, R.; Fu, Y.; Lai, L. A New Atom-Additive Method for Calculating Partition Coefficients. J. Chem. Inf. Comput. Sci. 1997, 37, 615–621. [Google Scholar] [CrossRef] Beck, B.; Breindl, A.; Clark, T. QM/NN QSPR Models with Error Estimation: Vapor Pressure and LogP. Chem. Inf. Comput. Sci. 2000, 40, 1046–1051. [Google Scholar] Egan, W. J.; Merz, K. M., Jr.; Baldwin, J. J. Prediction of Drug Absorption Using Multivariate Statistics. J. Med. Chem. 2000, 43, 3867–3877. [Google Scholar]
- Palm, K.; Stenberg, P.; Luthman, K.; Artursson, P. Polar Molecular Surface Properties Predict the Intestinal Absorption of Drugs in Humans. Pharm. Res. 1997, 14, 568–571. [Google Scholar]
- Palm, K.; Luthman, K.; Ungell, A.; Strandlund, G.; Beigi, F.; Lundahl, P.; Artursson, P. Evaluation of Dynamic Polar Molecular Surface Area as Predictor of Drug Absorption: Comparison with Other Computational and Experimental Predictors. J. Med. Chem. 1998, 41, 5382–5392. [Google Scholar] [CrossRef]
- Clark, D. E. Rapid Calculation of Polar Molecular Surface Area and Its Application to the Prediction of Transport Phenomena. 1. Prediction of Intestinal Absorption. J. Pharm. Sci. 1999, 88, 807–814. [Google Scholar]
- Kelder, J.; Grootenhuis, P. D. J.; Bayada, D. M.; Delbressine, L. P. C.; Ploemen, J. Polar Molecular Surface as a Dominating Determinant for Oral Absorption and Brain Penetration of Drugs. Pharm. Res. 1999, 16, 1514–1519. [Google Scholar]
- Stenberg, P.; Luthman, K.; Artursson, P. Prediction of Membrane Permeability to Peptides from Calculated Dynamic Molecular Surface Properties. Pharm. Res. 1999, 16, 205–212. [Google Scholar]
- Camenisch, G.; Alsenz, J.; van de Waterbeemd, H.; Folkers, G. Estimation of Permeability by Passive Diffusion through Caco-2 Cell Monolayers Using Drugs' Lipophilicity and Molecular Weight. Eur. J. Pharm. Sci. 1998, 6, 313–319. [Google Scholar]
- Camenisch, G.; Folkers, G.; van de Waterbeemd, H. Shape of Membrane Permeability-Lipophilicity Curves: Extension of Theoretical Models with an Aqueous Pore Pathway. Eur. J. Pharm. Sci. 1998, 6, 321–329. [Google Scholar]
- van de Waterbeemd, H.; Camenisch, G.; Folkers, G.; Raevsky, O. A. Estimation of Caco-2 Cell Permeability Using Calculated Molecular Descriptors. Quant. Struct.-Act. Relat. 1996, 15, 480–490. [Google Scholar] [CrossRef]
- Norinder, U.; Osterberg, T.; Artursson, P. Theoretical Calculation and Prediction of Caco-2 Cell Permeability Using MolSurf Parametrization and PLS Statistics. Pharm. Res. 1997, 14, 1786–1791. [Google Scholar]
- Norinder, U.; Osterberg, T.; Artursson, P. Theoretical Calculation and Prediction of Intestinal Absorption of Drugs in Humans Using MolSurf Parametrization and PLS Statistics. Eur. J. Pharm. Sci. 1999, 8, 49–56. [Google Scholar]
- Wessel, M. D.; Jurs, P. C.; Tolan, J. W.; Muskal, S. M. Prediction of Human Intestinal Absorption of Drug Compounds from Molecular Structure. J. Chem. Inf. Comput. Sci. 1998, 38, 726–735. [Google Scholar] [CrossRef]
- Lombardo, F.; Blake, J. F.; Curatolo, W. J. Computation of Brain-Blood Partitioning of Organic Solutes via Free Energy Calculations. J. Med. Chem. 1996, 39, 4750–4755. [Google Scholar] [CrossRef]
- Chikhale, E. G.; Ng, K.-Y.; Burton, P. S.; Borchardt, R. T. Hydrogen Bonding Potential as a Determinant of the in Vitro and in Situ Blood-Brain Barrier Permeability of Peptides. Pharm. Res. 1994, 11, 412–419. [Google Scholar]
- Young, R. C.; Mitchell, R. C.; Brown, T. H.; Ganellin, C. R.; Griffith, R.; Jones, M.; Rana, K. K.; Saunders, D.; Smith, I. R.; Sore, N. E.; Wilks, T. J. Development of a New Physicochemical Model for Brain Penetration and Its Application to the Design of Centrally acting H2 Receptor Histamine Antagonists. J. Med. Chem. 1988, 31, 656–671. [Google Scholar] [CrossRef]
- Seiler, P. Interconversion of Lipophilicities from Hydrocarbon/Water Systems into the Octanol/Water System. Eur. J. Med. Chem. 1974, 9, 473–479. [Google Scholar]
- van de Waterbeemd, H.; Kansy, M. Hydrogen-bonding Capacity and Brain Penetration. Chimia 1992, 46, 299–303. [Google Scholar]
- Abraham, M. H.; Chadha, H. S.; Mitchell, R. C. Hydrogen Bonding Factors that Influence the Distribution of Solutes between Blood and Brain. J. Pharm. Sci. 1994, 83, 1257–1268. [Google Scholar]
- Chadha, H. S.; Abraham, M. H.; Mitchell, R. C. Physicochemical analysis of the factors Governing Distribution of Solutes Between Blood and Brain. Bioorg. Med. Chem. Lett. 1994, 4, 2511–2516. [Google Scholar] [CrossRef]
- Abraham, M. H. Scales of Solutes Hydrogen-Bonding: Their Construction and Application to Physicochemical and Biochemical Processes. Chem. Soc. Rev. 1993, 22, 73–83. [Google Scholar] [CrossRef]
- Crivori, P.; Cruciani, G.; Carrupt, P. -A.; Testa, B. Predicting Blood-Brain Barrier Permeation from Three-Dimensional Molecular Structure. J. Med. Chem. 2000, 43, 11, 2204 -2216. [Google Scholar]
- Herve, F.; Urien, S.; Albengres, E.; Duche, J.-C.; Tillement, J. Drug Binding in Plasma. A Summary of Recent Trends in the Study of Drug and Hormone Binding. Clin. Pharmacokinet. 1994, 26, 44–58. [Google Scholar]
- Frostell-Karlsson, Å.; Remaeus, A.; Roos, H.; Andersson, K.; Borg, P.; Hamalainen, M.; Karlsson, R. Biosensor Analysis of the Interaction between Immobilized Human Serum Albumin and Drug Compounds for Prediction of Human Serum Albumin Binding Levels. J. Med. Chem. 2000, 43, 1986–1992. [Google Scholar]
- Colmenarejo, G.; Alvarez-Pedraglio, A.; Lavandera, J. –L. Cheminformatic Models To Predict Binding Affinities to Human Serum Albumin. J. Med. Chem. 2001, 44, 4370–4378. [Google Scholar]
- Carter, D. C.; He, X.-M. Structure of Human Serum Albumin. Science 1990, 249, 302–303. [Google Scholar]
- Roberts, S. A. High-throughput screening approaches for investigating drug metabolism and pharmacokinetics. Xenobiotica 2001, 31, 557–589. [Google Scholar]
- Watt, A. P.; Morrison, D.; Evans, D. C. Approaches to higher-throughput pharmacokinetics (HTPK) in drug discovery. Drug Discov. Today 2001, 5, 17–24. [Google Scholar]
- Keseruu, G. M.; Molnar, L. METAPRINT: A Metabolic Fingerprint. Application to Cassette Design for High-Throughput ADME Screening. J. Chem. Inf. Comput. Sci. 2002, 42, 437–444. [Google Scholar]
- Ekins, S.; Bravi, G.; Blinkley, S.; Gillespie, J. S.; Ring, B. J.; Wikel, J. H.; Wrighton, S. A. Three- and four-dimensional quantitative structure activity relationship analyses of cytochrome P-450 3A4 inhibitors. J. Pharm. Exp. Ther. 1999, 290, 429–438. [Google Scholar]
- Ekins, S.; Bravi, G.; Blinkley, S.; Gillespie, J. S.; Ring, B. J.; Wikel, J. H.; Wrighton, S. A. Three and four dimensional-quantitative structure activity relationship (3D/4D-QSAR) analyses of CYP2D6 inhibitors. Pharmacogenetics 1999, 9, 477–489. [Google Scholar]
- De Groot, M. J.; Vermeulen, N. P. Modeling the active sites of cytochrome P450s and glutathione S-transferases, two of the most important biotransformation enzymes. Drug Metab. Rev. 1997, 29, 747–799. [Google Scholar]
- Keseru, G. M. A. Virtual high throughput screen for high affinity cytochrome P450cam substrates. Implication for in silico prediction of drug metabolism. J. Comput.-Aided Mol. Des. 2001, 15, 649–657. [Google Scholar] [CrossRef]
- Darvas, F.; Marokhazi, S.; Kormos, P.; Kulkarni, P.; Kalasz, H.; Papp, Á. Drug Metabolism, Databases and High Throughput Testing During Drug Design and Development; Erhardt, P. W., Ed.; Blackwell Science: Cambridge, MA, 1999; pp. 237–270. [Google Scholar]
- Klopman, G.; Tu, M. Drug Metabolism, Databases and High Throughput Testing During Drug Design and Development; Erhardt, P. W., Ed.; Blackwell Science: Cambridge, MA, 1999; pp. 271–276. [Google Scholar]
- Testa, B.; Cruciani, G. Pharmacokinetic Optimization in Drug Research: Biological, Physicochemical and Computational Strategies; Testa, B., van de Waterbeemd, H., Folkers, G., Eds.; Verlag Helvetica Chimica Acta (VHCA); Wiley-VCH: Zurich; Weinheim, Germany, 2001; pp. 65–84. [Google Scholar]
- Duffy, J. C.; Cronin, M. T. D. Prediction of Half-Life of Non Steroidal Anti-Inflammatory Drugs. School of Pharmacy & Chemistry, Liverpool John Moores University, Byrom Street, Liverpool, L3 3AF, UK. http://www.pharm.uni-duesseldorf.de/QSAR/068.htm.
- Greene, N. Computer Software for Risk Assessment. J. Chem. Inf. Comput. Sci. 1997, 37, 148–150. [Google Scholar]
- Richard, A. M. Application of SAR methods to non-congeneric databases associated with carcinogenicity and mutagenicity: issues and approaches. Mutation Res. 1994, 305, 73–97. [Google Scholar]
- The Lethal Dose 50 (LD50) test involves the administration of a substance to a group of animals at increasing doses in order to determine the dose that kills 50 percent of the test subjects within a set time frame.
- Hall, L.; Kier, L.; Phipps, G. Structure-Activity Relationship Studies on the Toxicities of Benzene Derivatives I an Additivity Model. Environ. Toxicol. Chem. 1984, 3, 355–365. [Google Scholar] [CrossRef]
- Gute, B.; Basak, S. Predicting Acute Toxicity (LC50) of Benzene Derivatives Using Theoretical Molecular Descriptors: A Hierarchical QSAR Approach. SAR QSAR Environ. Res. 1997, 7, 117–131. [Google Scholar]
- IGC50 is the fifty percent growth inhibitory concentration against Tetrahymena pyriformis
- Cronin, M. T. D.; Gregory, B. W.; Schultz, T. W. Quantitative Structure-Activity Analyses of Nitrobenzene Toxicity to Tetrahymena pyriformis. Chem. Res. Toxicol. 1998, 11, 902–908. [Google Scholar] [CrossRef]
- Cronin, M. T. D.; Schultz, T. W. Development of Quantitative Structure-Activity Relationships for the Toxicity of Aromatic Compounds to Tetrahymena pyriformis: Comparative Assessment of the Methodologies. Chem. Res. Toxicol. 2001, 14, 1284–1295. [Google Scholar]
- Schultz, T. W.; Cronin, M. T. D. Response-Surface Analyses for Toxicity to Tetrahymena pyriformis: Reactive Carbonyl-Containing Aliphatic Chemicals. J. Chem. Inf. Comput. Sci. 1999, 39, 304–309. [Google Scholar] [CrossRef]
- Katritzky, A. R.; Tatham, D. B. Theoretical Descriptors for the Correlation of Aquatic Toxicity of Environmental Pollutants by Quantitative Structure-Toxicity Relationships. J. Chem. Inf. Comput. Sci. 2001, 41, 1162–1176. [Google Scholar]
- Sanderson, D. M.; Earnshaw, C. G.; Judson, P. N. Computer prediction of possible toxic action from chemical structure; the DEREK system. Human Experim. Toxicol. 1991, 10, 261–273. [Google Scholar]
- Ridings, J. E.; Barratt, M. D.; Cary, R.; Earnshaw, C. G.; Eggington, C. E.; Ellis, M. K.; Judson, P. N.; Langowski, J. J.; Marchant, C. A.; Payne, M. P.; Watson, W. P.; Yih, T. D. Computer prediction of possible toxic action from chemical structure: an update on the DEREK system. Toxicology 1996, 106, 267–279. [Google Scholar]
- Tonnelier, C. A. G.; Fox, J.; Judson, P.; Krause, P.; Pappas, N.; Patel, M. Representation of Chemical Structures in Knowledge-Based Systems: The StAR System. J. Chem. Inf. Comput. Sci. 1997, 37, 117–123. [Google Scholar] [CrossRef]
- http://www.chem.leeds.ac.uk/luk/derek/index.html.
- Benfenati, E.; Grasso, P.; Bruschi, M. Predictive Carcinogenicity: A Model for Aromatic Compounds, with Nitrogen-Containing Substituents, Based on Molecular Descriptors Using an Artificial Neural Network. J. Chem. Inf. Comput. Sci. 1999, 39, 1076–1080. [Google Scholar]
- Arenas, G. E.A.; Giralt, F. An Integrated SOM-Fuzzy ARTMAP Neural System for the Evaluation of Toxicity. J. Chem. Inf. Comput. Sci. 2002, 42, 343–359. [Google Scholar]
- Burden, F. R.; Winkler, D. A. A Quantitative Structure-Activity Relationships Model for the Acute Toxicity of Substituted Benzenes to Tetrahymena pyriformis Using Bayesian-Regularized Neural Networks. Chem. Res. Toxicol. 2000, 13, 436–440. [Google Scholar] [CrossRef]
- The companies providing in silico ADMET programs are: Advanced Chemistry Development ; Amedis Pharmaceuticals ; Accelrys ; ArQule ; Bioreason ; Chemical Computing Group ; Lhasa;Leadscope; Lion Bioscience ; Multicase ; Simulations Plus ; Tripos;
- Frawley, W.J.; Piatetsky-Shapiro, G.; Matheus, C. Knowledge Discovery. In Databases: An Overview. In Knowledge Discovery In Databases; Piatetsky-Shapiro, G., Frawley, W. J., Eds.; AAAI Press/MIT Press: Cambridge, MA, 1991; pp. 1–30. [Google Scholar]
- Wright, P. Knowledge Discovery In Databases: Tools and Techniques. http://www.acm.org/crossroads/xrds5-2/kdd.html.
- Brown, M. P. S.; Grundy, W. N.; Lin, D.; Cristianini, N.; Sugnet, C. W.; Furey, T. S.; Ares, M. J.; Haussler, D. Knowledge-based analysis of microarray gene expression data by using support vector machines. Proc. Nat. Acad. Sci. U.S.A. 2000, 97, 262–267. [Google Scholar] [CrossRef]
© 2002 by MDPI (http://www.mdpi.org). Reproduction is permitted for noncommercial purposes.
Share and Cite
MDPI and ACS Style
Xu, J.; Hagler, A. Chemoinformatics and Drug Discovery. Molecules 2002, 7, 566-600. https://doi.org/10.3390/70800566
AMA Style
Xu J, Hagler A. Chemoinformatics and Drug Discovery. Molecules. 2002; 7(8):566-600. https://doi.org/10.3390/70800566
Chicago/Turabian StyleXu, Jun, and Arnold Hagler. 2002. "Chemoinformatics and Drug Discovery" Molecules 7, no. 8: 566-600. https://doi.org/10.3390/70800566