Probing the Structure of DNA Aptamers with a Classic Heterocycle.

Department of Chemistry and Biochemistry, Mississippi College, 200 South Capitol St., Clinton, MS 39058. USA
*
Author to whom correspondence should be addressed.
Molecules 2004, 9(3), 67-85; https://doi.org/10.3390/90300067
Submission received: 5 February 2004
/
Revised: 9 February 2004
/
Accepted: 15 February 2004
/
Published: 28 February 2004
(This article belongs to the Special Issue Biologically Relevant Heterocyclic Compounds)
Abstract
:DNA aptamers are synthetic, single-stranded DNA oligonucleotides selected by SELEX methods for their binding with specific ligands. Here we present ethidium binding results for three related DNA aptamers (PDB code: 1OLD, 1DB6, and 2ARG) that bind L-argininamide (L-Arm). The ligand bound form of each aptamer's structure has been reported and each are found to be composed primarily of two domains consisting of a stem helical region and a loop domain that forms a binding pocket for the cognate ligand. Previous thermodynamic experiments demonstrated that the DNA aptamer 1OLD undergoes a large conformational ordering upon binding to L-Arm. Here we extend those linkage binding studies by examining the binding of the heterocyclic intercalator ethidium to each of the three aptamers by fluorescence and absorption spectrophotometric titrations. Our results reveal that ethidium binds to each aptamer with ΔGo's in the range of -8.7 to -9.4 kcal/mol. The stoichiometry of binding is 2:1 for each aptamer and is quantitatively diminished in the presence of L-Arm as is the overall fluorescence intensity of ethidium. Together, these results demonstrate that a portion of the bound ethidium is excluded from the aptamer in the presence of a saturating amount of L-Arm. These results demonstrate the utility of ethidium and related compounds for the probing of non-conventional DNA structures and reveal an interesting fundamental thermodynamic linkage in DNA aptamers. Results are discussed in the context of the thermodynamic stability and structure of each of the aptamers examined.
Keywords:
Ethidium; intercalator; DNA; aptamer; thermodynamics; linkage; fluorescence; free energy; Job plotIntroduction
Naturally occurring RNA molecules, including transfer and messenger RNAs, ubiquitously contain hairpins and loops in their three-dimensional structures [1]. Hairpins are also found in natural DNAs especially in the regulatory palindromic regions of genes. These have been implicated in forming binding sites for replicational and transcriptional machinery [2]. Since hairpins and loops have potentially important biological functions they are interesting and obvious drug targets. The majority of our understanding of ligand binding studies to DNA hairpins is from studies involving model systems including short self-complementary oligonucleotides [3,4,5,6,7]. Marky and co-workers have investigated the binding of the intercalating heterocyclic DNA stains, ethidium and propidium, to single-stranded oligonucleotides containing variable length helical regions and loops containing from three to seven thymine residues [8,9]. Such model studies provide keen insight into the general energetics and molecular basis for the selectivity of biologically active heterocyclic drugs and toxins for specific nucleic acid structures.
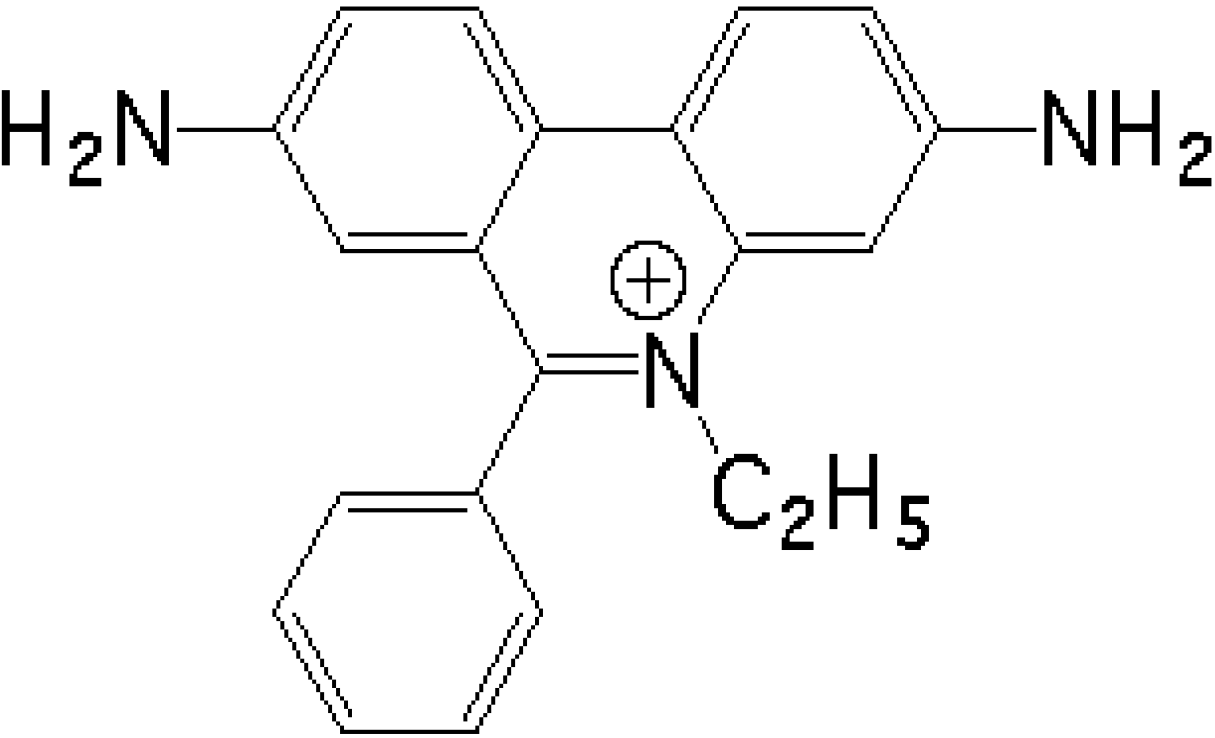
Figure 1.
Structure of ethidium

We report, herein, thermodynamic and stoichiometric binding results from fluorescence spectroscopic experiments designed to investigate the nature and extent of binding of the heterocycle ethidium (Figure 1) to each of three related stem-loop DNA's for which three-dimensional structures are available. The three structures investigated are DNA aptamers [10,11] that were selected by the SELEX [10] method for their binding to the ligand L-argininamide (L-Arm) [12,13,14,15,16,17,18]. DNA and RNA aptamers are interesting molecules for two main reasons. First, they comprise model systems for investigating the thermodynamic linkage between ligand binding and nucleic acid folding into bound complexes. Second, aptamers serve as potential novel therapeutics, catalysts, and biosensors based on their ability to bind a variety of ligands with affinities and selectivities rivaling monoclonal antibodies [11,17,18,19]. Table 1 presents the sequence, Protein Data Bank (PDB) accession code, and length of the three aptamers studied here. They are 1OLD [12,14], 1DB6 [13], and 2ARG [15].

| Aptamer (PDB ID) | Length (Bases) | Sequenceb,c (5’ to 3’) | Tmcalca (oC) | ΔHcalca (kcal/mol) |
|---|---|---|---|---|
| 1DB6 | 22 | CGACCAACGTGTCGCCTGGTCG | 58.6 | 44.6 |
aPredicted values obtained from the Mfold algorithm with 60 mM ionic strength.bBases in bold are predicted to form intramolecular base pairs between the 5’ and 3’ end of the aptamer. The prediction is based on the Mfold algorithm with 60 mM ionic strength.cUnderlined bases are the predicted preferred binding sites for ethidium based on its relative selectivity for 5’-Pyr-Pur-3’ steps. The 5' and 3' ends of 2ARG are not predicted to form a TA base pair according to Mfold.
The purpose of these studies is three-fold: (i) to investigate the general mode of binding of intercalators, such as ethidium, to both the helical and loop domains of self-complementary regions of DNA, (ii) to probe the structure of the ligand bound and unbound forms of the related L-Arm binding DNA aptamers, and (iii) to explore the heterotropic thermodynamic linkage which exists between the binding of two distinct ligands to different sites on the same DNA aptamer structure. Point (iii) is of considerable interest given that non-quadruplex containing DNA aptamers have previously been suggested to lack a discernable folded structure in the absence of their cognate ligand according to limited NMR structural studies [19]. Recently, collaborative experiments with the Chaires laboratory have demonstrated that the Patel aptamer designated as 1OLD actually contains a significant right-handed helical structure as demonstrated by its characteristic CD spectrum and DSC and optically determined monomolecular melting profile (unpublished results). Those studies also demonstrated that binding of L-Arm to 1OLD is described by an entropically unfavorable conformational ordering of the aptamer. The results presented here extend those studies by demonstrating that 2-3 ethidium molecules bind per aptamer in the absence of L-Arm with an affinity (ΔGo) of between -8.68 and -9.43 kcal/mol. In the presence of the ligand L-Arm, the aptamer undergoes a conformational change that apparently excludes up to one ethidium per aptamer depending upon the length of the aptamer. These observations are consistent with a model in which each of the studied DNA aptamers contain well defined helical regions. The loop structure subsequently undergoes a conformational change in the presence of saturating amounts of the cognate ligand L-Arm to form the folded bound structure which has been determined by Patel and co-workers in the case of 1OLD and 2ARG [12,14,15] and Wemmer et al. in the case of the aptamer 1DB6 [13].
Results and Discussion
Thermal Denaturation of DNA Aptamers
The thermal denaturation of each aptamer (1.0 μM) was examined by optical melting studies. Figure 2 presents results from spectroscopic data obtained at 260 nm. The leftmost curve is that for 1OLD alone. The right most curve is for 1OLD in the presence of a near saturating concentration of ethidium. Each curve is presented as the fraction of total that is folded. The line drawn through each set of raw data is a fit for a single transition model with a correction for a sloping pre- and post-melt baseline (Equation 1).
Figure 2.
Optically detected fractional thermal denaturation of the DNA aptamer 1OLD.

The melting data are cast in the form of fraction folded versus temperature for the DNA aptamer 1OLD. Melts were performed in the absence and presence of 10.0 μM ethidium. Similar experiments were performed using 1DB6 and 2ARG (data not shown). Table 2 presents tabulated results from the Tm’s and denaturation enthalpies (ΔH) for each DNA aptamer. In the absence of any ligands, the measured Tm and enthalpy describing the thermal transition both closely agree with predicted values (Table 1) [20,21,22]. In each of the aptamers, the melting transition in the absence and presence of ethidium is monophasic but does contain a sloping pre- and post-transition baseline which can be corrected (Figure 2) [20]. 1DB6 has the highest predicted and measured Tm (Table 1 and Table 2). A trend is observed in which the Tm decreases and ΔH increases with increasing aptamer length (Table 1 and Table 2).
Ethidium binding shifts the Tm of each aptamer to a higher temperature (Table 2). The most pronounced Tm shift was for 1OLD. In that case a ΔTm of 10.6 oC was observed (Table 2: Figure 2). In 1DB6 and 2ARG the ΔTm’s were 5.2 and 5.3 respectively. Ethidium increased the enthalpic stability of 1DB6 and 1OLD by 2.6 and 2.8 kcal/mole respectively. In contrast ethidium binding to 2ARG decreased the enthalpy by nearly 4 kcal/mole. When melting studies are performed on each aptamer (1.0 μM) in the presence of 10.0 μM ethidium and with added 10.0 mM L-arginiamide, the apparent Tm’s are not appreciably shifted from those values presented in Table 2 (data not shown) in the presence of ethidium. The ΔH’s for 1DB6, 1OLD and 2ARG were found to be decreased to 47.4 + 0.3, 49.8 + 0.8, and 44.4 + 1.2 kcal/mol respectively.
Table 2.
Effect of ethidium binding on the fitted thermal denaturation parameters for L-argininamide binding DNA aptamers.
| Aptamer Minus Ethidiuma | Aptamer Plus Ethidiumb | |||
|---|---|---|---|---|
| Tmc,d (oC) | ΔHc,d (kcal/mol) | Tmc,d (oC) | ΔHc,d (kcal/mol) | |
| 1DB6 | 59.4 + 0.2 | 46.2 + 1.5 | 64.6 + 0.3 | 48.8 + 0.2 |
| 1OLD | 47.9 + 0.1 | 48.9 + 1.2 | 58.5 + 0.1 | 51.7 + 0.5 |
| 2ARG | 47.3 + 0.4 | 64.1 + 1.7 | 52.6 + 0.1 | 60.0 + 0.7 |
a1 μM aptamer with no added ethidium.b1μM aptamer in the presence of 10 μM ethidiumcParameters are from fits of the raw melting curve obtained at 260 nm from 15-85 oC.dParameters are listed as the mean + standard deviation obtained from 1000 Monte Carlo simulations.
Fluorescence Detected Binding of Ethidium to 1DB6, 1OLD, and 2ARG.
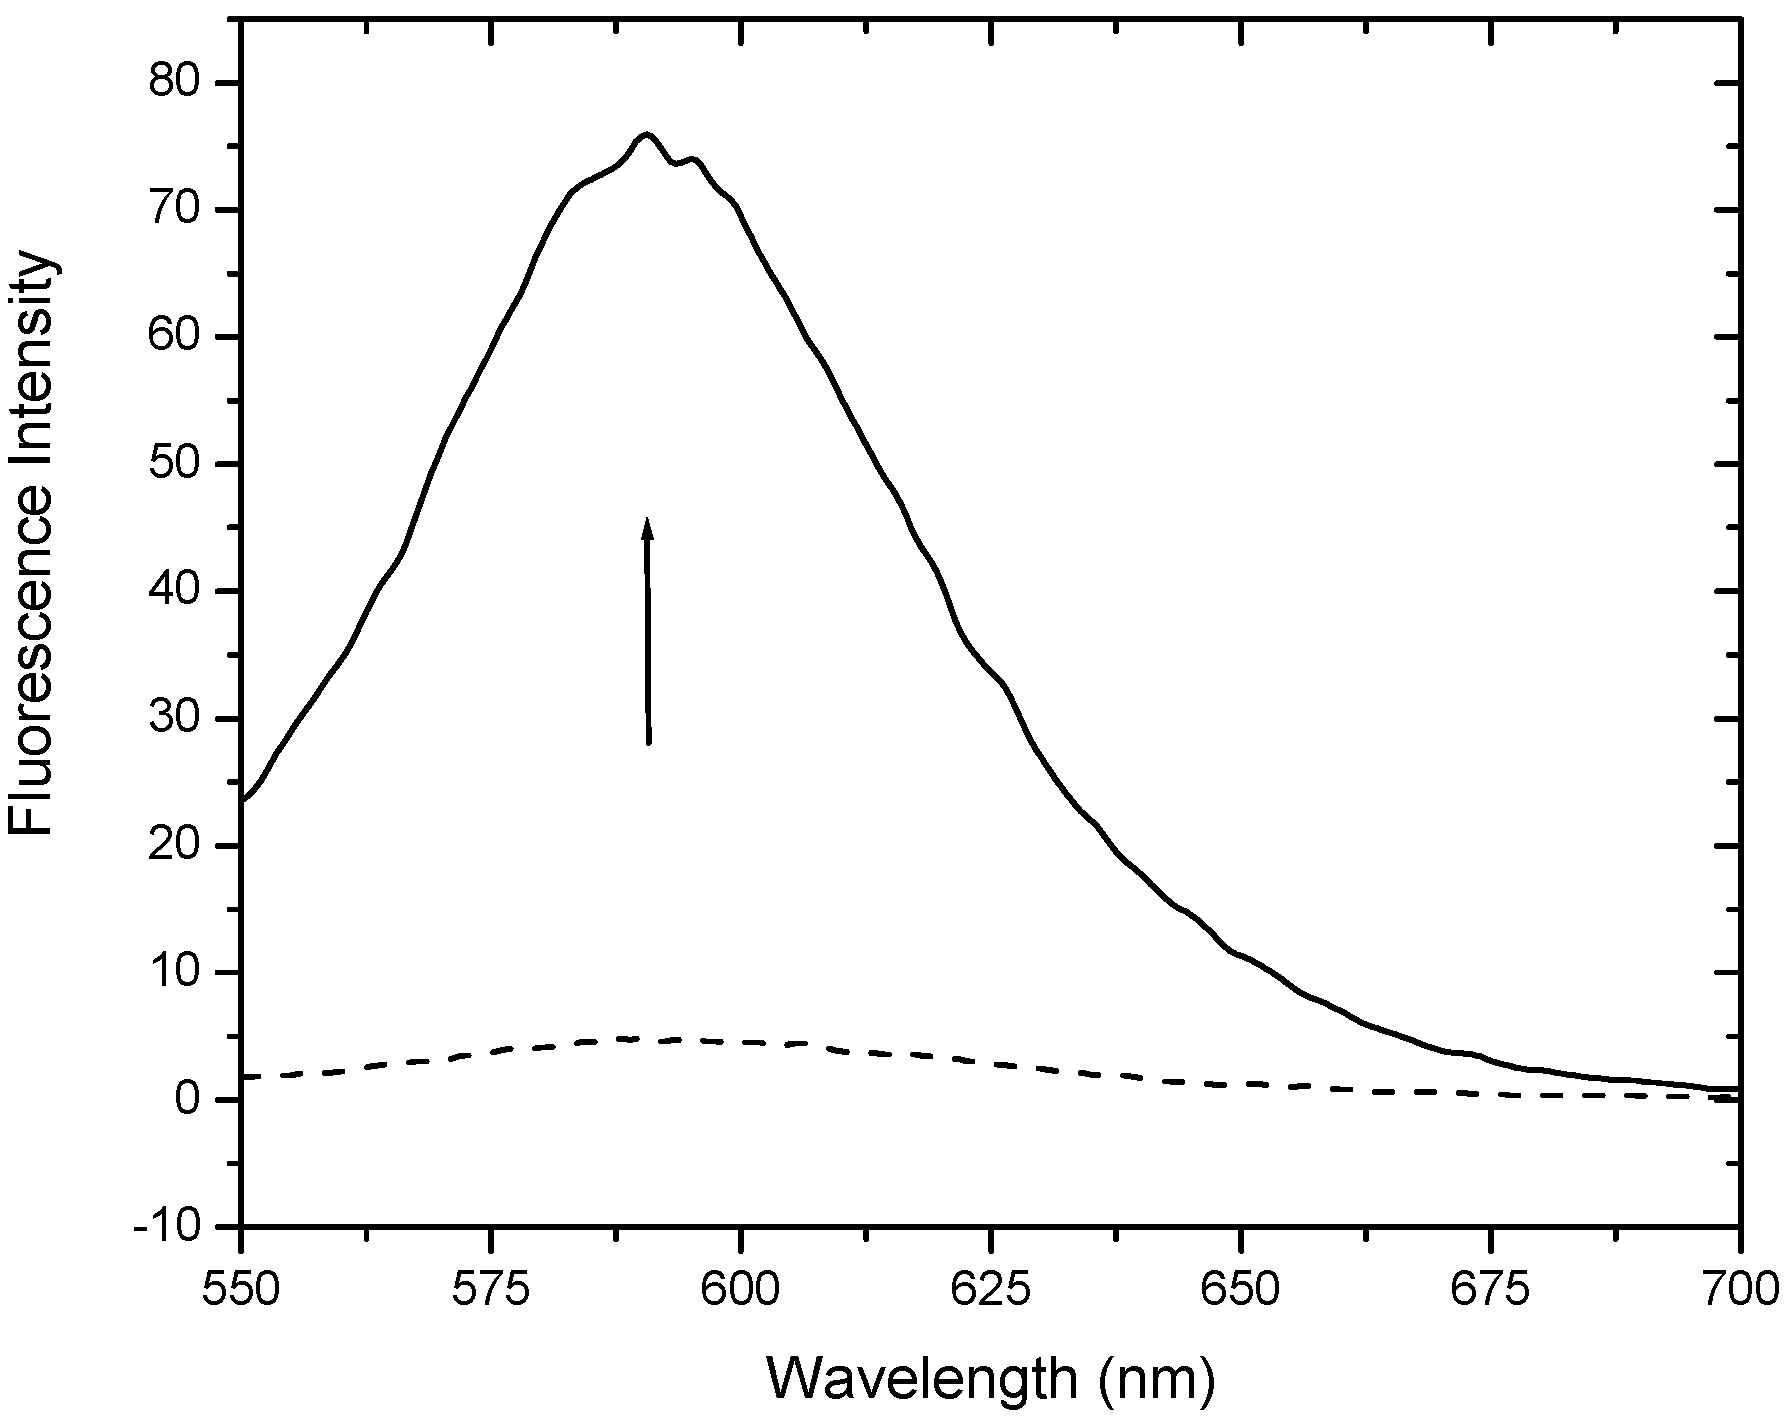
Figure 3 presents the fluorescence emission spectrum of ethidium in the absence (dashed line) and presence (solid line) of a saturating concentration of the DNA aptamer. The emission spectrum of ethidium in the presence of 1DB6 and 2ARG are very similar (data not shown). Ethidium emission intensity increases with increasing aptamer concentration. In Figure 4 are shown the binding isotherms and Monte Carlo results of fits obtained by plotting the fluorescence intensity at 590 nm extracted from the raw spectral data (e.g. Figure 3) as a function of the logarithm of the aptamer concentration.
Figure 3.
Fluorescence emission spectra of ethidium in the absence (dashed line) and presence (solid line) of a saturating concentration of the DNA aptamer 1OLD.
Figure 3.
Fluorescence emission spectra of ethidium in the absence (dashed line) and presence (solid line) of a saturating concentration of the DNA aptamer 1OLD.

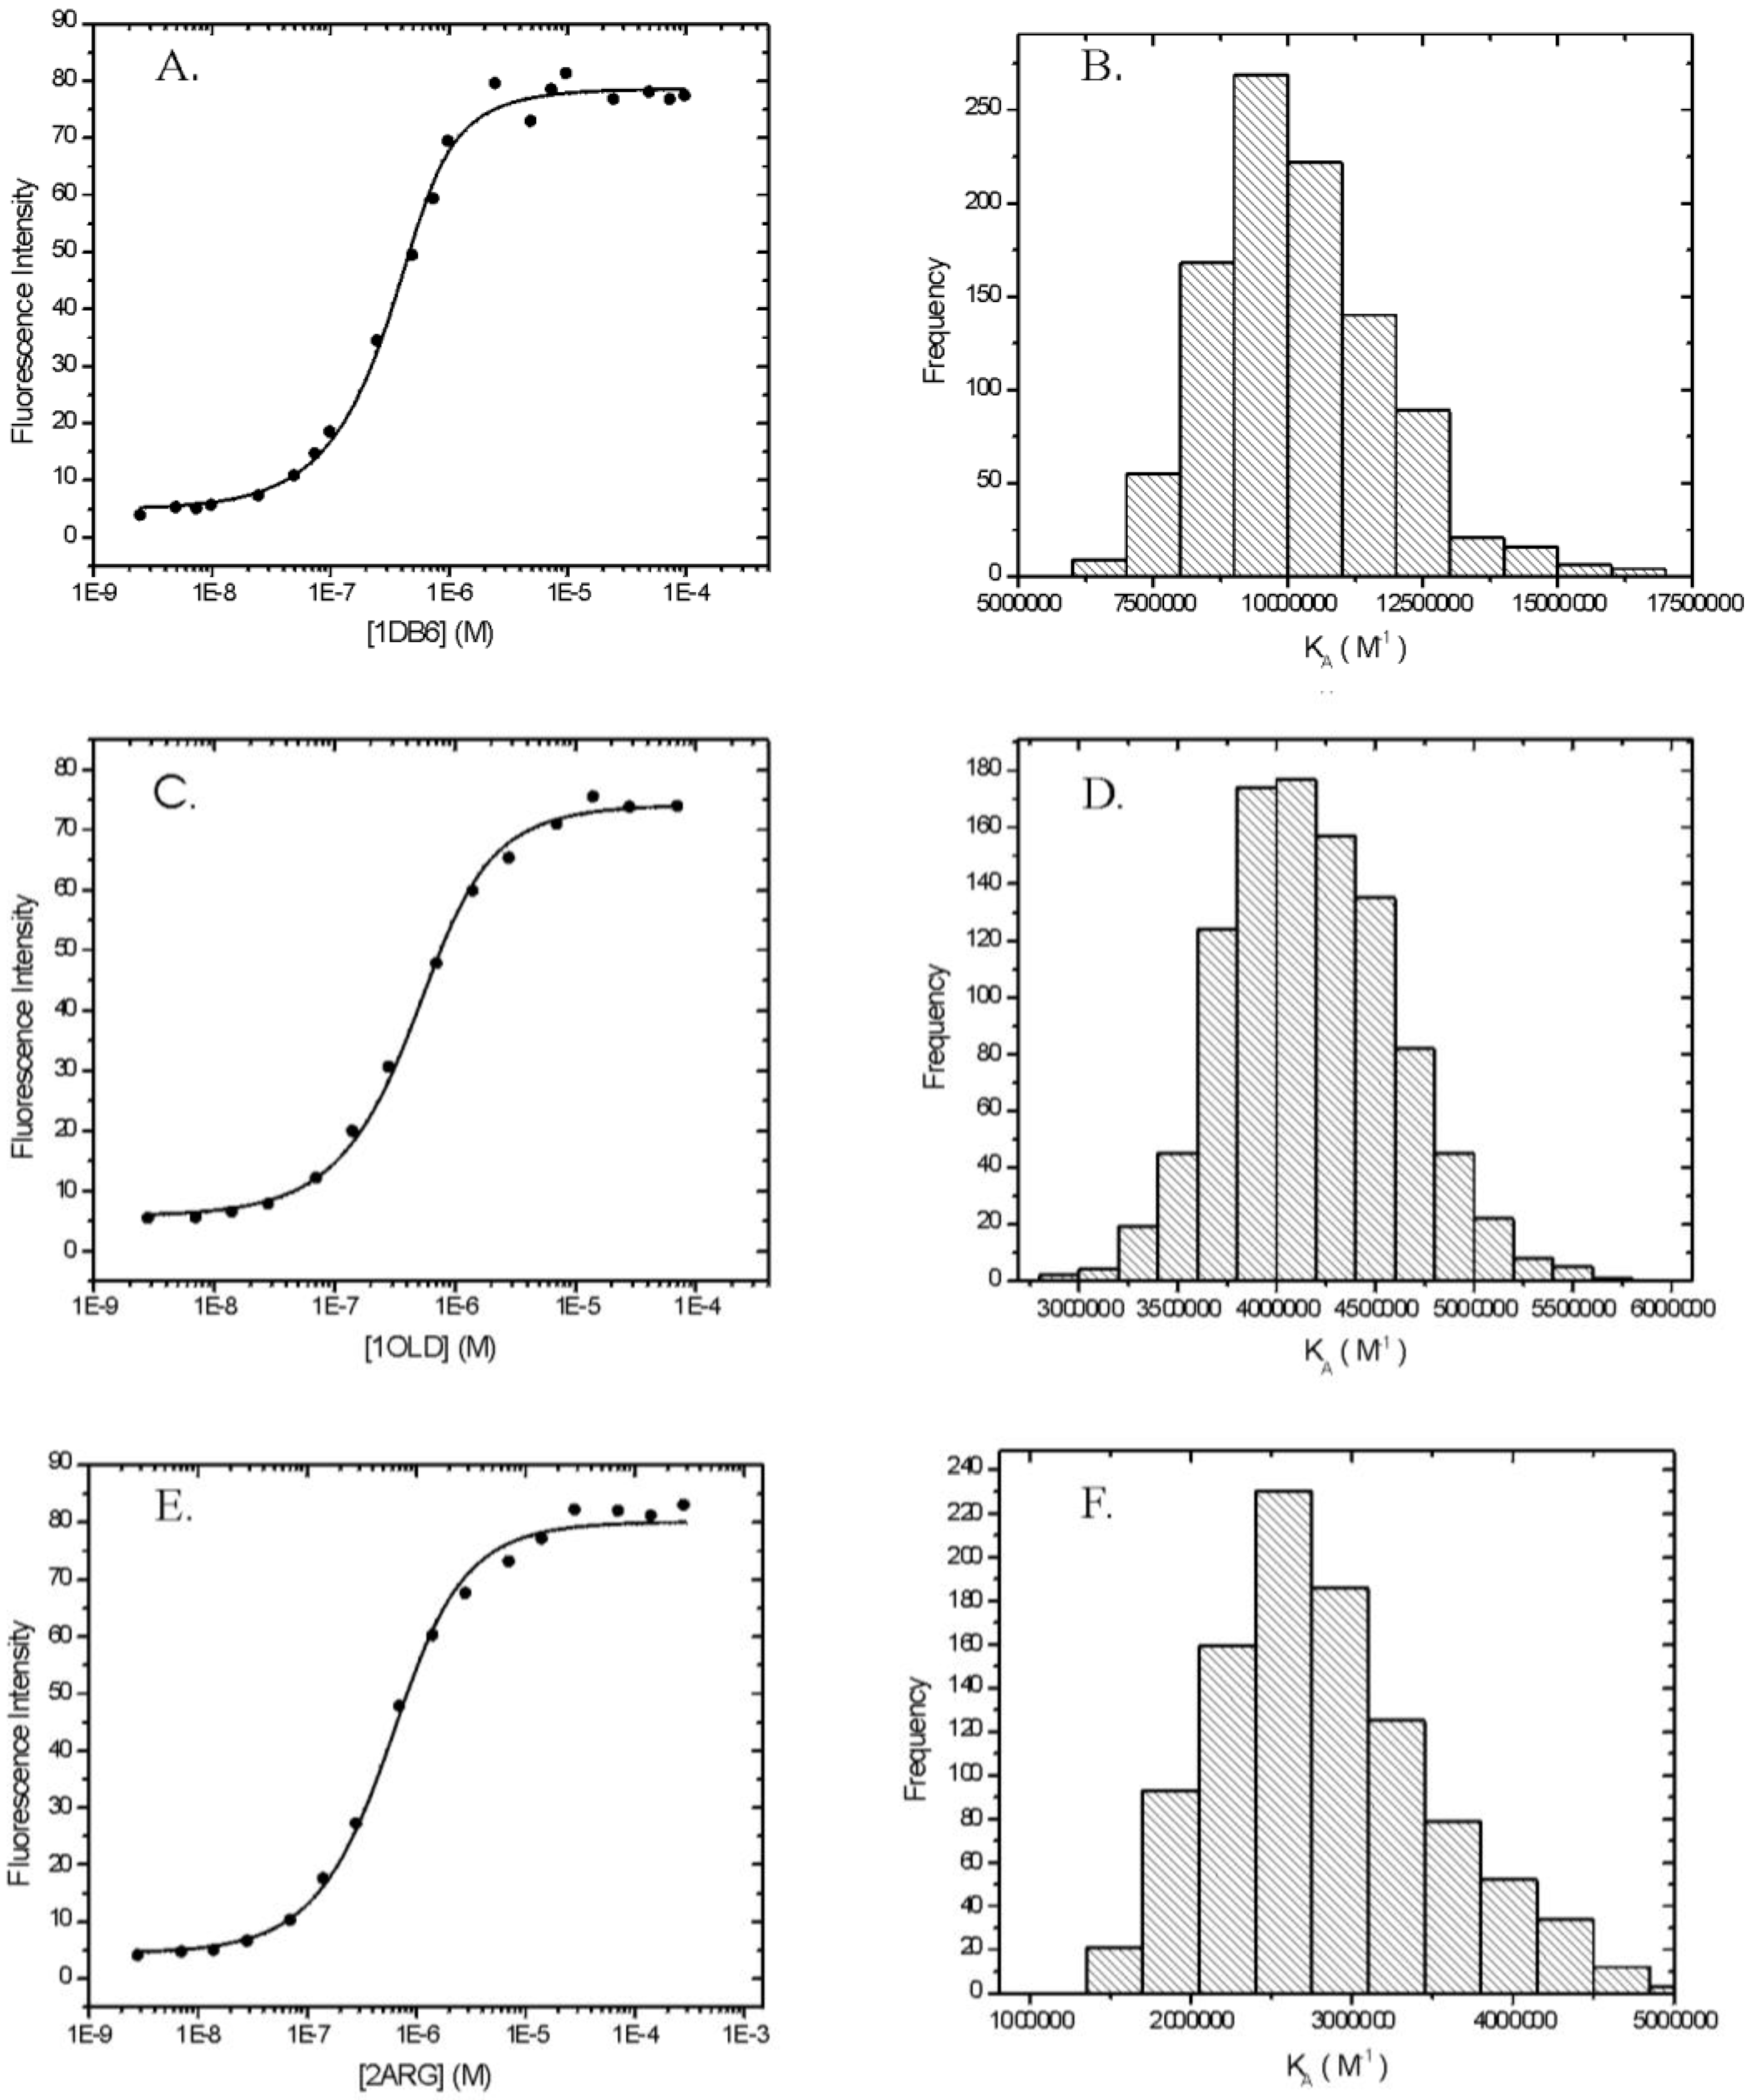
The binding isotherms for the interaction between ethidium and the DNA aptamers 1DB6, 1OLD, and 2ARG are presented in Panels A, C, and E of Figure 4, respectively. For each aptamer, the raw fluorescence data are well described by the model for a single-site binding model (Equation 2). When fits are scrutinized by Monte Carlo analysis a rigorous determination of the means and standard deviations of the fitted parameters is possible. The results of these Monte Carlo simulations are shown in Table 3.
| Ffreea,b,c | Fbounda,b,c | KAa,c (M-1) | ΔGo d (kcal/mol) | |
|---|---|---|---|---|
| 1DB6 | 4.91 + 0.86 | 78.53 + 0.85 | 10,200,800 + 1,665,410 | -9.43 + 1.54 |
| 1OLD | 5.86 + 0.64 | 74.17 + 0.76 | 4,180,480 + 430,510 | -8.91 + 0.92 |
| 2ARG | 4.55 + 1.83 | 81.05 + 2.00 | 2,850,480 + 710,776 | -8.68 + 2.16 |
aParameters obtained from fits of raw fluorescence intensities of 0.5 μM ethidium in the presence of increasing concentrations of each DNA aptamer. Data were fit by Equation 2. Emission intensities were measured at 590 nm with excitation at 518 nm by and 15 nm slitwidth. Here KA=Keq.bFfree (F0) is the fitted fluorescence intensity of 0.5 mM ethidium with excitation at 518 nm, emission at 590 nm and 15 nm slits. Fbound (Fb) is the fitted fluorescence of the same concentration of ethidium in the presence of a saturating concentration of each aptamer.cParameters are listed as the mean + standard deviation obtained from 1000 Monte Carlo simulations.dStandard state free energy calculated from KA at 21 oC according to ΔG0=-RTlnKA. The equilibrium constants obtained for the binding of ethidium to each of the aptamers are also presented in the form of standard state free energies (ΔGo) (Table 3). 1DB6 has the highest affinity for ethidium and 2ARG the lowest. The trend is that as the length of the aptamer decreases the binding free energy becomes more favorable. The enhancement of the ethidium spectrum is very similar for each aptamer indicating that the mode of binding of a single ethidium to the high affinity site on each aptamer is similar. It is important to note that in these experiments only the high affinity ethidium sites are populated since the concentration of aptamer is in excess of the ethidium.
Panels B, D, and F of Figure 4 are the resulting histograms showing the distribution of possible fitted values of Keq obtained from Monte Carlo analyses for 1DB6, 1OLD, and 2ARG, respectively. The histograms for the parameters F0 and Fb are not shown. In all cases the fitted parameters are nearly Gaussianly distributed and the residuals are randomly distributed indicative of a good fit. The only possible exception is 2ARG which shows some skew in the histogram (Panel F, Figure 4). When similar data were collected in a different set of experiments, the resulting histogram was normally distributed (data not shown).
Figure 4.
Fluorescence detected binding of ethidium to three L-argininamide recognizing DNA aptamers
Figure 4.
Fluorescence detected binding of ethidium to three L-argininamide recognizing DNA aptamers

Effect of L-Argininamide on the Binding Stoichiometry of Ethidium to 1DB6, 1OLD, and 2ARG
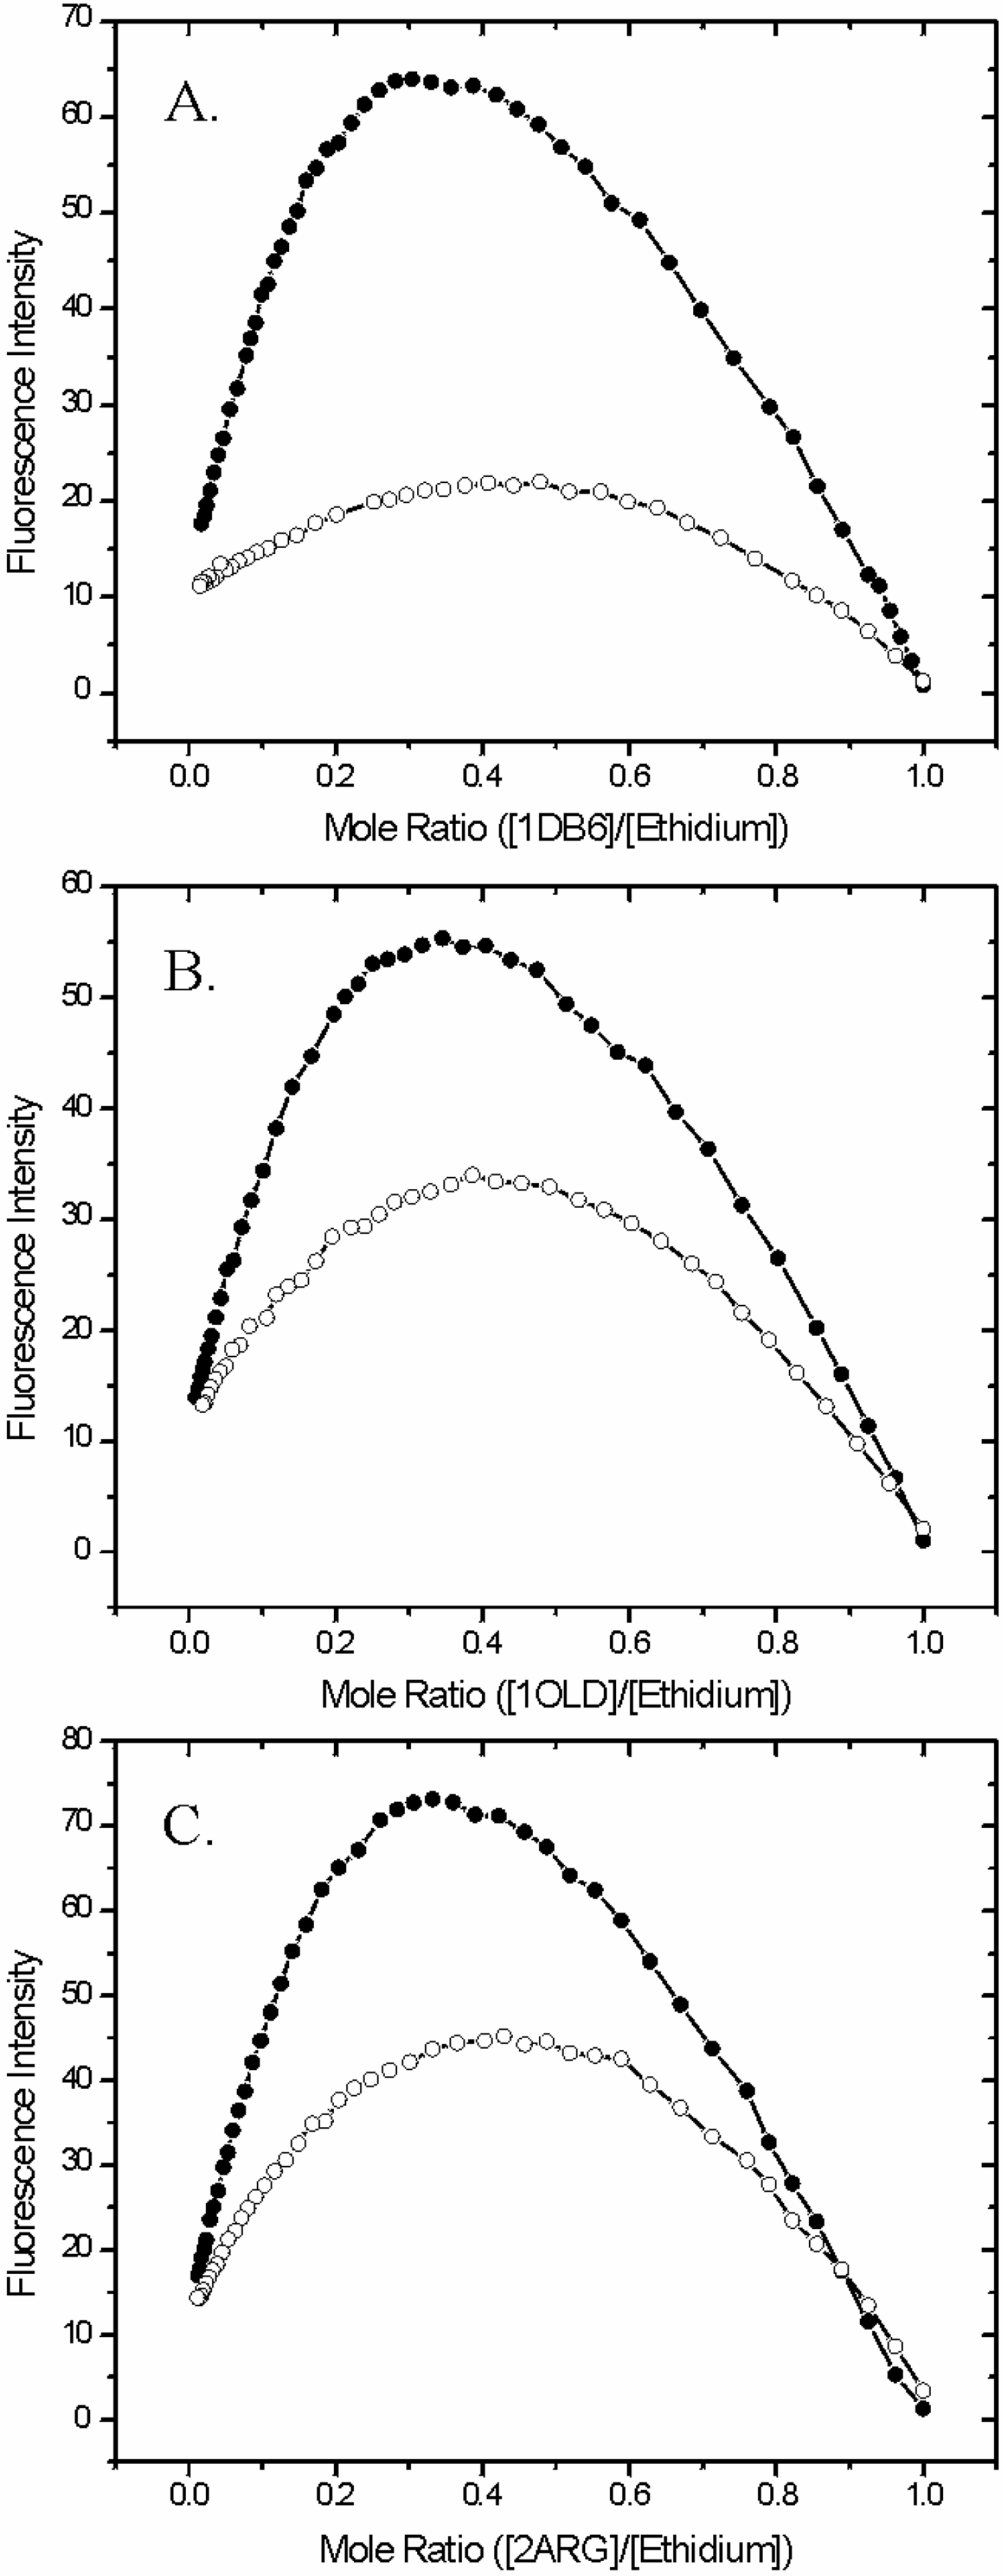
The method of continuous variations was used to assess the quantitative extent of the binding of L-Arm in the loop region of the aptamer and how this influences the binding of ethidium molecules bound in the helical stem region of the same aptamer. Figure 5 and Table 4 present results from Job analyses for each of the aptamers under investigation in the absence and presence of L-Arm. In each case the Job plot is shifted to the right which is indicative of fewer ethidiums bound per aptamer unit (Figure 5). For example, the apex of the curve for 1DB6 in the absence of L-Arm (Panel A of Figure 5) is 0.30 compared to 0.48 in the presence of a saturating amount of L-Arm. These values equate to binding stoichiometries of ethidium:1DB6 of 2.3:1 and 1.1:1 respectively. In addition, the overall fluorescence intensity taken from the apex of the curve obtained in presence of L-Arm is diminished by a factor of 2.9 of that observed in the absence of the ligand. Taken together, these data are highly suggestive that the binding of the cognate ligand L-Arm is capable of excluding a portion of the ethidium bound to the aptamer. Specifically it is found that approximately 1.2 ethidiums are released from 1DB6 in the presence of L-Arm. Similarily but not as dramatically, the stoichiometry of the ethidium:1OLD complex is found to be 1.9:1 in the absence of L-Arm and 1.6:1 in the presence of the L-Arm ligand. The overall fluorescence intensity observed at the apex of the curve in the presence of L-Arm is, once again, diminished. In this case, however, it is only by a factor of 1.6 compared to that observed in the absence of L-Arm. Thus, the same pattern of ethidium exclusion is observed, albeit less dramatic than that observed for 1DB6. The ethidium:2ARG stoichiometry is similarly found to be 2.0:1 in the absence of L-Arm and 1.3:1 in the presence of the ligand. The fluorescence intensity of the system in the presence of L-Arm is diminished by a factor of 1.6.
Table 4.
Results from the method of continuous variations for the binding of ethidium to the L-argininamide binding DNA aptamers 1DB6, 1OLD, and 2ARG.
| 1DB6 | 1DB6 + L-Arm | 1OLD | 1OLD + L-Arm | 2ARG | 2ARG + L-Arm | |
|---|---|---|---|---|---|---|
| Fluorescence Intensity (Height) | 63.94 | 22.00 | 55.35 | 33.99 | 73.15 | 45.17 |
| Peak Ratio | 2.91 | 1.63 | 1.62 | |||
| Relative Fluorescence Area | 42.47 | 16.01 | 37.39 | 23.81 | 47.94 | 32.26 |
| Total Fluorescence Area Ratio | 2.65 | 1.57 | 1.49 | |||
| Width | 0.68 | 0.81 | 0.70 | 0.74 | 0.69 | 0.76 |
| Width Ratio | 0.84 | 0.94 | 0.91 | |||
| Mole Ratio at Peak | 0.30 | 0.478 | 0.345 | 0.386 | 0.33 | 0.43 |
| Stoichiometry | 2.33 | 1.09 | 1.90 | 1.60 | 2.00 | 1.33 |
| Ethidiums Released | 1.24 | 0.30 | 0.67 | |||
The original goal of the work presented herein was to probe the structure of DNA aptamers with a known intercalator (ethidium) to determine the helical content present in each aptamer in the absence of any bound ligands. Three main features of the three L-argininamide binding DNA aptamers were identified from the current work. First, the intramolecular folded structures of each aptamer contain a discernable but variable helical stem structure in the absence of any bound ligands. Secondly, this helical region is capable of binding the heterocycle ethidium in a stoichiometry of approximately 2:1 in each of the aptamers studied. Of further note is the finding that the affinity of ethidium for each aptamer is between 3-4 kcal/mol more favorable than the affinity of the cognate ligand L-argininamide for the aptamer 1OLD [23]. Thirdly, a linkage exists between the binding of ethidium in the helical region and the binding of L-Arm in the disordered loop. Binding of L-argininamide is capable of displacing between 0.3-1.2 ethidiums from the relevant aptamer.
Thermal denaturation results (Table 2 and Figure 2) demonstrate several features regarding the stability of each DNA aptamer studied. First each aptamer exhibits a Tm that is consistent with that predicted by the Mfold algorithm. The measured Tm’s decrease as aptamer length increases (Table 2). Of interest is the increase in the ΔH term with increasing aptamer length which is opposed to that predicted for each sequence by Mfold (Table 1). This is likely due to contributions from the apparently disordered L-argininamide binding site positioned in the loop region of the aptamer. The correlation of the ΔH with the L-argininamide binding site is consistent with other results collected in our laboratory which demonstrate that L-argininamide binding has little effect on the Tm of the optically observed melting transition of each aptamer but does decrease the ΔH of the thermal transition [23].
Figure 5.
Effect of L-argininamide on the binding stoichiometry between ethidium and the L-argininamide binding DNA aptamers. Panels A, B, and C are job plots for 1DB6, 1OLD, and 2ARG respectively. In each case, Job plots were determined in the absence (solid circles) and presence (open circles) of 6.0 mM L-argininamide.

When melted in the presence of a 10 fold excess of ethidium, the apparent Tm of each aptamer (1DB6, 1OLD, and 2ARG) increases by approximately 5-10 oC (Table 2). The largest ethidium dependent stabilization is in 1OLD. The other aptamers have more subtle increases in Tm, and this is likely due to the possibility that we may not have saturated all of the ethidium binding sites. This is very likely given the positioning of the 5’-Pyrimidine-Purine-3’ steps in the helical region of each aptamer (underlined in Table 1). Clearly 1OLD has a high affinity binding site positioned in the middle of the complementary region. In contrast both 1DB6 and 2ARG exhibit each of their predicted higher affinity binding sites near the end and in (or near) the stem-loop junction.
Previously, we have demonstrated that the optically determined transition observable near 50 oC is attributable to the helical stem structure and not the ligand binding loop region in each of the three aptamers analyzed [23]. These results along with the lack of additional melting transitions in the presence of ethidium suggest that the heterocycle is, in fact, binding to and stabilizing, the helical stem region of the aptamer. These results do not necessarily exclude the possibility of ethidium binding to the loop region [8,9], but it does suggest that ethidium binding to the loop region is a minor binding component. The Marky lab has reported binding constants for the interaction of ethidium with DNA hairpins containing variable amounts of successive poly(dT) in the hairpin region. No such sequence exits in any of the aptamers examined here [8,9]. In their experiments, binding free energies (ΔGo) in the range of -8.6 kcal/mol for binding of ethidium to the stem region of a hairpin were observed. Our results are consistent with their findings (Table 3).Together, these binding free energies (~ -8.6 kcal/mol) are more favorable by nearly 2 kcal/mol than that observed for the interaction of ethidium with calf thymus DNA (-6.7 kcal/mol) [24]. It is not readily obvious why the binding of ethidium to oligonucleotides containing hairpins and stem-loop structures is so much more favorable than for natural duplex DNA. One certain difference is that the calf thymus DNA experiments were performed in the presence of 200 mM NaCl compared to 50 mM NaCl in our experiments [24]. Ionic interactions make favorable contributions (i.e., approximately -5 kcal/mol) to the overall free energy for the binding of ethidium to duplex DNA [24]. Also it is likely that distortions of the helical structure required to accommodate the intercalating ethidium are more unfavorable in duplex polymers. Such distortions contribute unfavorably to the overall binding free energy [24]. On a related note, since the Tm of 1OLD does not change with total strand concentration, this indicates that the observed Tm is that of the intramolecular helix and is not, therefore, attributable to an intermolecular complex between complementary regions of separate strands (data not shown).
Investigation of the sequences in Table 1 suggests that there are different potential ethidium binding sites in each aptamer studied. Results from fluorescence titrations and Monte Carlo simulations of fits (Table 3, Figure 3 and Figure 4) demonstrate that ethidium binds rather tightly to each DNA aptamer studied. However, in contrast to our hypothesis that 1OLD would exhibit the tightest binding, it is clear from Table 3 that 1DB6 exhibits the highest affinity for ethidium. Of considerable interest is the observation that in each aptamer, the affinity for ethidium is larger than the aptamer’s affinity for the ligand L-Arm to which it was selected to bind. In the case of L-Arm binding to 1OLD, the affinity was found to be approximately 5400 M-1 with a ΔG0 of -5.0 kcal/mol [23]. That is 4 kcal/mol less favorable than that observed for the binding of ethidium to 1OLD.
In addition to the above affinity experiments, the stoichiometry of ethidium binding to each DNA aptamer was determined by the method of continuous variations (Table 4 and Figure 5) which demonstrated that in each case, approximately 2 ethidiums were bound per aptamer. In those experiments it was observed that the resulting Job plots were very broad for each aptamer studied. This observation holds over a range of total aptamer+ethidium concentrations ranging from 0.5 μM to 20 μM (data not shown). This broadening may be due to binding heterogeneities that are not observable in the binding experiments shown in Figure 4 where the ethidium concentration is limiting and only high affinity binding sites are populated on the aptamer. As a result of the breadth of the Job plots, it is difficult to determine the top of the curve (i.e., the apex) which is typically determined graphically in Job plots. We tried multiple methods including curve fitting to approximate the top of each curve but found that fits of the data by higher order polynomials had the effect of returning skewed information which tended to either underestimate or overestimate the mole fraction where the top is observed. In the end, we opted to analyze the data by integrating the curve to find its total area height, width, and center (Table 4). From these we extracted the molar ratio and the stoichiometry for the complex from the center of the curve for each aptamer.
When similar Job plots are generated in the presence of 4-10 mM L-Arm, the maximum overall fluorescence of each plot is significantly diminished and the curve is quantitatively shifted to higher molar ratio of aptamer:ethidium. Combined these data demonstrate that a linkage exists between the binding of ethidium and the binding of L-Arm. It is of some interest that ethidium can be displaced at all by L-Arm given the weak affinity of L-Arm compared to ethidium. However, it may not be suprising when one considers that the binding of L-Arm to 1OLD is accompanied by a large exothermic enthalpy which pays the cost of an unfavorable conformational change that is characterized as a negative entropy [23]. Thus, in the case of linkage the whole thermodynamic signature must be considered and not just the overall standard state binding free energies (ΔGo).
Of the three aptamers investigated, 1DB6 shows the largest extent of linkage between ethidium and L-Arm binding with approximately one ethidium being released from the aptamer receptor. This is in contrast to both 2ARG and 1OLD where the number of ethidiums released is fractional. 1OLD shows the smallest number of ethidiums released. This may be explainable since the high affinity ethidium binding site is positioned further away from the stem-loop junction (Table 1).
In the case of DNA containing hairpins occurring in chromatin, the formation of a hairpin in a single strand of duplex DNA must occur in the presence of its complementary strand. The exact nature of the thermodynamics that link the competitive formation of such intra- and intermolecular complexes is a topic of on-going research [1,2,3,4,5]. Recent work by both the Chaires [25,26] and Hud [27] laboratories have separately demonstrated the importance of ligand-induced non-cannonical conformations and structures in model duplex and triplex DNA structures, respectively. Since hairpins have potentially important biological functions, they are interesting and obvious drug targets.
Conclusions
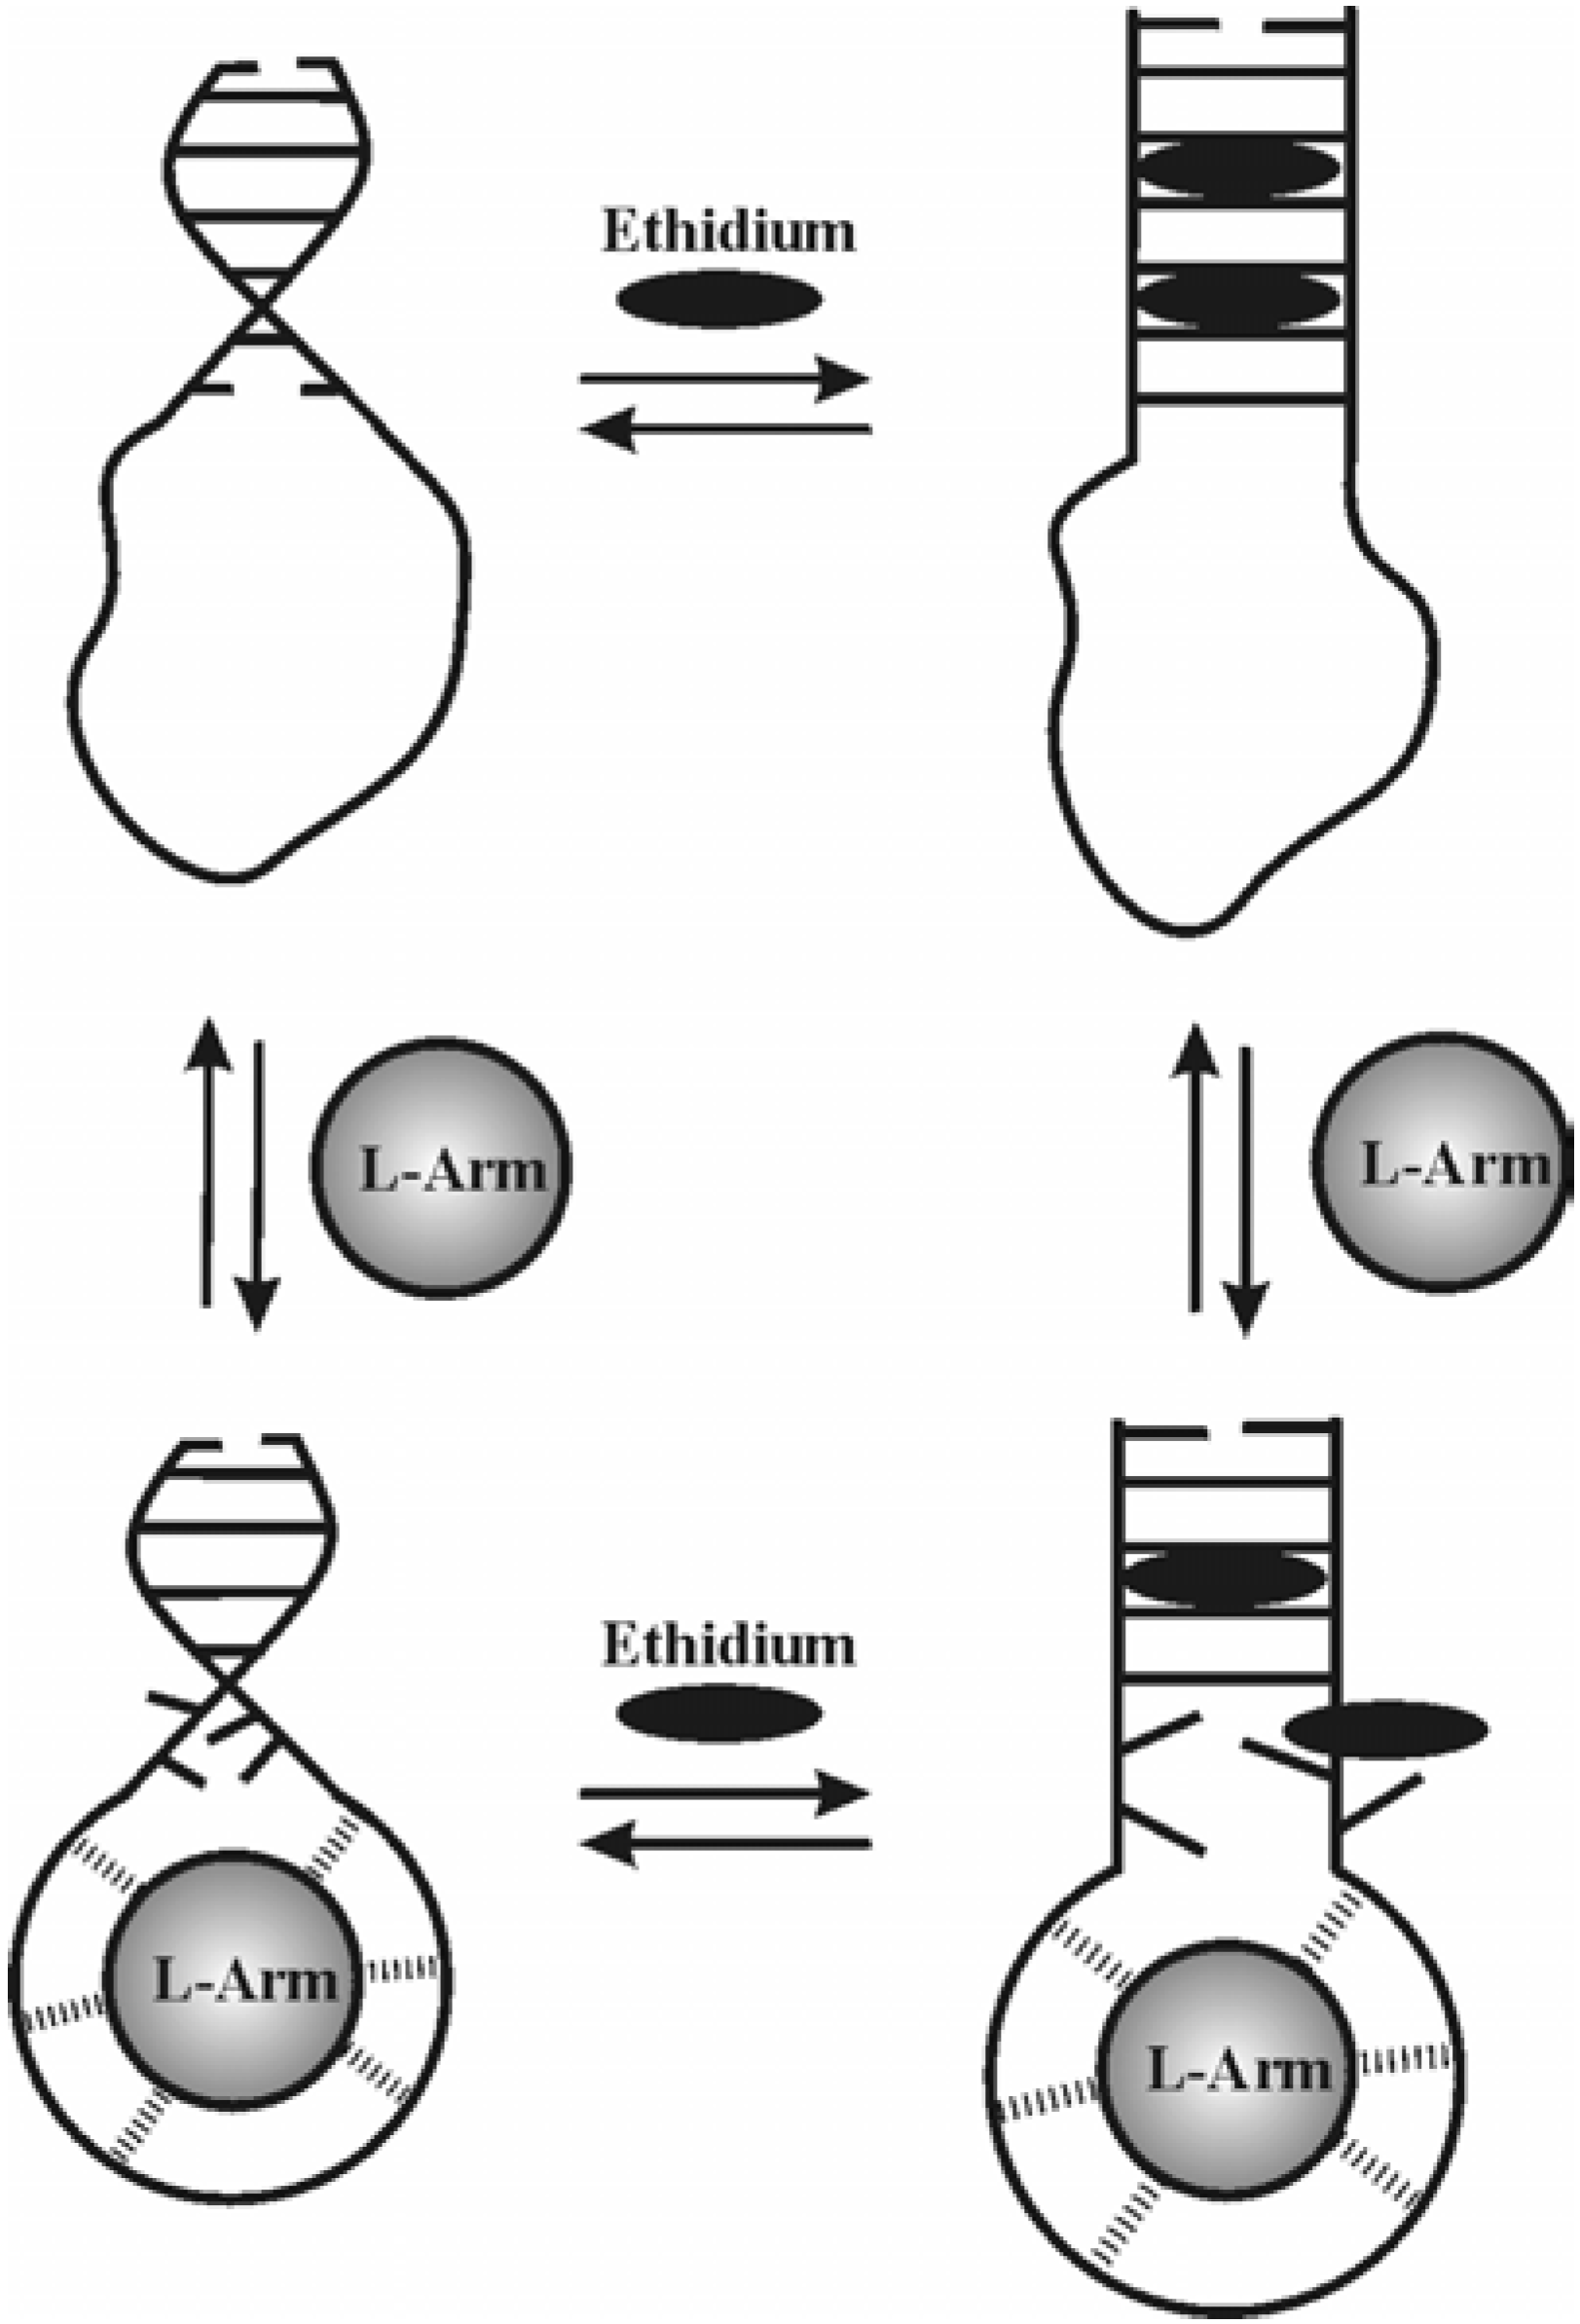
Figure 6 presents a schematic representation of the linkage. Initially, the aptamer in its ligand unbound form has an appreciable amount of helix in the stem but the loop is disordered.
Figure 6.
Schematic diagram showing the thermodynamic linkage between ethidium and L-argininamide binding to a representative DNA aptamer structure. The aptamer in its native folded form is shown in the upper left-hand corner. L-Arm is the ligand L-argininamide and is represented as a shaded circle. Ethidium molecules are represented as black ovals. The helical region is shown unwound in the presence of ethidium. The L-Arm induces a conformational change on the loop region which mimics its shape. Dashed lines between the loop and L-Arm ligand indicate specific bonding interactions.

In the presence of ethidium alone, the helix is expanded to accommodate at least two ethidiums in the stem. When L-Arm is added to this complex a conformational change in the loop occurs which places a thermodynamic strain on the base pairs stabilizing the stem structure and releases an ethidium bound near that junction. In the presence of L-Arm alone, the conformation of the loop region orders about the ligand and places a thermodynamic strain on the stem-loop junction.We are currently extending this work by investigating the relationships existing between DNA aptamer conformation and stability and ligand binding thermodynamics. Work is currently in progress that specifically addresses the influence of L-Arm binding on the thermal stability of 1DB6, 1OLD and 2ARG. Isothermal titration calorimetry studies are also underway to determine the enthalpic and entropic components of ethidium and L-Arm binding to each of the aptamers.
Finally, in 2000, Wadkins published an excellent article reviewing the targeting of DNA secondary structures with small molecules [32]. In that article he discussed DNA aptamers (specifically 1OLD) as interesting targets for small molecules. He also suggested that actinomycin D would be more selective for the helical region of stem-loop structures in DNA hairpins based on the work by Marky and co-workers [8,9]. In the immediate future, we intend to explore the binding of actinomycin to each of the L-Arm binding DNA aptamers.
Acknowledgements
The authors would like to thank past and present student members of the Mississippi College Molecular Biophysics Research Group who have provided insights into aspects of the current work. These students include Jalin Wood, Benjamin Jeanfreau, Claire Nettles, James Crane, and Michael Michel. In addition we thank Professors Edward J. Valente and David H. Magers for helpful discussions and technical advice. Dr. Bishop extends special thanks to Professor Jonathan B. Chaires for his continued mentorship in all things related to DNA and binding. This work was supported by a CCSA grant (#CC5939) funded by Research Corporation as well as by BRIN and SIDER grants awarded by the National Institutes of Health in conjunction with the Mississippi Functional Genomics Network (MFGN). Finally we acknowledge the Mississippi College Catalysts for their continued support of undergraduate research.
Experimental
General
Reagents and DNA Aptamers
Ethidium bromide, buffer components and L-Arm were all purchased as ACS grade reagents from Sigma Chemical Company. DNA aptamers 1OLD, 1DB6 and 2ARG (Table 1) were purchased purified as lyophilized powders from 1 μmole preparations from MWG Biotech. The purity of each aptamer was assessed by MALDI-TOF. Aptamers were dissolved in 1 mL of Buffer A (10 mM sodium phosphate buffer with added 50 mM NaCl, pH 7.0) and prepared for binding studies by incubating them at 90 oC for 5 minutes followed by rapid quenching on ice. This method insured that all aptamers were in their self-annealed form and were not intermolecular complexes. All buffered solutions were prepared from 18.7 megaohm nanopure water using Class A volumetric glassware. Concentrations of DNA aptamer solutions were targeted using the MALDI-TOF determined molecular weight of the parent ion and then adjusted using the molar extinction coefficient at 260 nm predicted from the oligonucleotide sequence. All concentration determinations were made at temperatures above the Tm of the aptamer. Absorbance measurements were made using a masked 1 cm pathlength suprasil quality quartz cuvette in a Hewlett Packard (HP) 8453 diode array spectrophotometer equipped with a programmable Peltier temperature controller. All aptamer concentrations are reported herein as concentrations of total monomeric aptamer units and not in units of bases or base pairs.
Methods
Thermal Denaturation of DNA Aptamers
Thermal denaturation studies of DNA aptamers were performed using the aforementioned HP8453 diode array spectrophotometer. All samples were degassed under a reduced pressure for at least 15 minutes prior to analysis. DNA aptamer samples (0.5 mL, 1.0 μM) were melted in a 1 cm masked and stoppered semi-micro cuvette from 20-90 oC. Spectra were collected every 0.5 oC. To examine the effects of ethidium binding on the thermal stability of each aptamer, melts were performed in a 10-fold excess of ethidium (i.e., 10.0 μM). In addition, melts were also performed in the presence of both 10.0 μM ethidium and 10.0 mM L-argininamide.
Single-wavelength melts were extracted at 260 nm from whole spectra and fit by the equation describing a single-transition melting process [20]. Script 1, which includes Equations 1-6, is used in GraphPad Prism for fitting of thermal denaturation data.
| Script 1. | |
| AU=bU+mU*x | (1) |
| AL=bL+ mL*x | (2) |
| dT=(1/(273.15+Tm))-(1/(273.15+x)) | (3) |
| Q=dH/1.98 | (4) |
| r=1/(1+exp(Q*dT)) | (5) |
| Y=(1-r)*AU+(r*AL) | (6) |
In Equation 6 of Script 1, Y=measured absorbance at each temperature (x). In Equations 1, 2 and 6, AU and AL are linear equations describing the upper and lower baselines respectively where bU and bL are fitted values for the intercepts for the upper and lower baseline respectively and mU and mL are the slopes of the same baselines. The value of Tm is taken to be the temperature at which the fraction folded is 50% and dH is the enthalpy of denaturation in calories per mole. Note that in Script 1, several variables including AU, AL, dT, Q, and r are used in successive equations as placeholders for the mathematical relationships that they represent. Equation 6 is the actual fitting fuction.
Graphical representations of each melt were generated by casting the resulting fit and raw data in the form of the total fraction of aptamer folded (α) at temperature (T) according to the classic relationship α=(AU-A(T))/(AU-AL) where AU is the straight line for the upper baseline and equals mU*T+bU where mU, T, and bU are the slope, temperature and intercept of that line, respectively. AL is the straight line for the lower baseline and equals mL*T+bL where mL, T, and bL are the slope, temperature and intercept of that line, respectively. A(T) is the raw absorbance obtained at temperature T. Values for each baseline were obtained from Equation 1. The enthalpy and Tm for each melt was obtained by fitting of the corrected data by the equation for a single transition melt [20]. Predicted Tm’s and enthalpies were determined for each aptamer using the Mfold algorithm [21,22].
Fluorescence Spectroscopy
All fluorescence measurements were performed on a Perkin Elmer LS-50B luminescence spectrophotometer. Fluorescence excitation and emission spectra of bound and unbound ethidium were collected with a scan rate of 1500 nm per minute and a slit width of 15 nm. Excitation of ethidium was optimal at 518 nm and emission spectra were collected from 550-650 nm. Intensities at 590 nm were recorded and used for the determination of association binding constants (KA). Upon binding to DNA, ethidium exhibits a nearly 10-fold enhancement in its emission intensity with excitation near 518 nm.
Affinity Binding Studies
Binding assays were performed in Buffer A with constant ethidium concentrations of 0.5 μM over a range of aptamer concentrations spaced out logarithmically over a range of 1 nM to 200 μM. Separate solutions were prepared for each aptamer concentration examined. Fluorescence intensities obtained at 590 nm were plotted as a function of the log of the aptamer concentration (log[aptamer]) and fit by a quadratic equation derived from a single binding site model which is valid in the presence of excess sites thus eliminating the need to include neighbor exclusion [28,29].
All fits were performed using the non-linear least squares methods in the software package GraphPad Prism. The equation used to fit the data allows the direct fitting of spectral data and returns fitted estimates of the association equilibrium constant (Keq=KA) as well as a fitted estimate of the fluorescence of the free ligand (unbound) and the fluorescence intensity of the bound ligand. The general fitting function, as input into the program GraphPad Prism is shown in Script 2 and is composed of Equations 7-10. Equation 10 is the actual fitting function.
| Script 2. | |
| B=(-(Ke)*(DR)+(Keq*X)+1)) | (7) |
| C=(Keq*DR*X) | (8) |
| C1=(((-B)-((B*B)-(4*(Keq)*C))^0.5))/(2*(Keq)) | (9) |
| Y=(((C1/(DR))*(Fb-F0))+F0) | (10) |
Where Keq is the equilibrium constant describing the binding of ethidium to each aptamer in units of M-1, DR is a constant and is equal to the molar concentration of ethidium (M), F0 is the fitted value of the fluorescence of the free ethidium and Fb is the fitted value of the fluorescence of bound ethidium. Y is the fluorescence intensity or absolute absorbance measured as a function of X where X is the total DNA concentration in units of M. This equation is basically a quadratic that takes the form of a sigmoid when plotted as the log of the DNA concentration. The concentrations of DNA aptamer were chosen to space them out evenly over several orders of magnitude. Note that in Script 2, several variables including B, C, and C1 are used in successive equations and are placeholders for the mathematical relationships that they represent.
Error Analysis
All fits were subjected to Monte Carlo analysis [29,30] for the rigorous determination of parameter errors. The Monte Carlo simulations were performed using the scripting routines included in GraphPad Prism. For each fit, 1000 simulations were performed using the fitted error returned from the original fit of the fluorescence data as the standard deviation of the gaussianly distributed noise to be randomly added to each simulated curve whose x values were taken from the original concentrations used for the fit. Each of the 1000 simulated data sets were then fit automatically in Prism and the mean and standard deviation for each parameter calculated. The returned parameters were also plotted as histograms to examine their distribution.
Binding Stoichiometry Determinations
Binding stoichiometries were determined by the method of continuous variations [28,31] by monitoring of the fluorescence emission intensity of ethidium at 590 nm with excitation at 518 nm. The total molar concentrations were 10 μM which is at least 3-times the reciprocal of the KA for ethidium binding to each DNA aptamer. Stoichiometry determinations were made by starting with 500 μL of a solution with a mole fraction of ethidium of 1.0. The mole fraction of ethidium was subsequently decreased and the mole fraction of each aptamer increased by removing between 10-50 μL of the 10 μM ethidium solution followed by addition of the same volume of a 10 μM solution of the appropriate DNA aptamer. Fluorescence data were then plotted as a function of the molar ratio of aptamer:ethidium. The mole ratio giving the maximum emission in the plot was used to calculate the complex stoichiometry.
References and Notes
- Tinoco, I., Jr. From RNA hairpins to kisses to pseudoknots. Nucleic Acids Symp Ser. 1997, 36, 49. [Google Scholar]
- Darlow, J.M.; Leach, D.R. Evidence for two preferred hairpin folding patterns in d(CGG).d(CCG) repeat tracts in vivo. J. Mol. Biol. 1998, 275, 17. [Google Scholar]
- Moody, E.M.; Bevilacqua, P.C. Folding of a stable DNA motif involves a highly cooperative network of interactions. J. Am. Chem. Soc. 2003, 125, 16285. [Google Scholar]
- Kaushik, M.; Kukreti, R.; Grover, D.; Brahmachari, S.K.; Kukreti, S. Hairpin-duplex equilibrium reflected in the A-->B transition in an undecamer quasi-palindrome present in the locus control region of the human beta-globin gene cluster. Nucleic Acids Res. 2003, 31, 6904. [Google Scholar]
- Armitage, B.A. The impact of nucleic acid secondary structure on PNA hybridization. Drug Discov Today. 2003, 8, 222. [Google Scholar]
- Moody, E.M.; Bevilacqua, P.C. Thermodynamic coupling of the loop and stem in unusually stable DNA hairpins closed by CG base pairs. J. Am. Chem. Soc. 2003, 125, 2032. [Google Scholar]
- Smirnov, I.; Shafer, R.H. “Effect of loop sequence and size on DNA aptamer stability.”. Biochemistry 2000, 39, 1462. [Google Scholar]
- Rentzeperis, D.; Medero, M.; Marky, L.A. Thermodynamic investigation of the association of ethidium, propidium and bis-ethidium to DNA hairpins. Bioorgan. & Med. Chem. 1995, 3, 751. [Google Scholar]
- Marky, L.A.; Alessi, K.; Rentzeperis, D. Calorimetric studies of drug-DNA interactions. Adv. DNA. Seq. Spec. Agents. 1996, 2, 3. [Google Scholar]
- Tuerk, C.; Gold, L. Systematic evolution of ligands by exponential enrichment:RNA ligands to bacteriophage T4 DNA polymerase. Science 1990, 249, 505. [Google Scholar]
- Brody, E.N.; Gold, L. Aptamers as therapeutic and diagnostic agents. J. Biotechnol. 2000, 74, 5. [Google Scholar]
- Harada, K.; Frankel, A.D. Identification of two novel arginine binding DNAs. 1995, 14, 5798. [Google Scholar]
- Lin, C.H.; Patel, D.J. Encapsulating an amino acid in a DNA fold. Nat. Struct. Biol. 1995, 3, 1046. [Google Scholar]
- Robertson, S.A.; Harada, K.; Frankel, A.D.; Wemmer, D.E. Structure determination and binding kinetics of a DNA aptamer-argininamide complex. Biochemistry 2000, 39, 946. [Google Scholar]
- Lin, C.H.; Wang, W.; Jones, R.A.; Patel, D.J. Formation of an amino-acid-binding pocket through the adaptive zippering-up of a large DNA hairpin loop. Chem. Biol. 1998, 5, 555. [Google Scholar]
- Hermann, T.; Patel, D.J. Adaptive recognition by nucleic acid aptamers. Science 2000, 287, 820. [Google Scholar]
- Cerchia, L.; Hamm, J.; Libri, D.; Tavitian, B.; de Franciscis, V. Nucleic acid aptamers in cancer medicine. FEBS Lett. 2002, 528, 12. [Google Scholar]
- Clark, S.L.; Remcho, V.T. “Aptamers as analytical reagents.”. Electrophoresis 2002, 23, 1335. [Google Scholar]
- Feigon, J.; Dieckmann, T.; Smith, F.W. Aptamer structures from A to ζ. Chem. Biol. 1996, 3, 611. [Google Scholar]
- Marky, L.A.; Breslauer, K.J. Calculating thermodynamic data from transitions of any molecularity from equilibrium melting curves. Biopolymers 1987, 26, 1601. [Google Scholar]
- Zuker, M. Mfold web server for nucleic acid folding and hybridization prediction. Nucleic Acids Res. 2003, 31, 3406. [Google Scholar]
- SantaLucia, J., Jr. A unified view of polymer, dumbbell, and oligonucleotide DNA nearest-neighbor thermodynamics. Proc. Natl. Acad. Sci. USA. 1998, 95, 1460. [Google Scholar]
- Ren, J.; Chaires, J.B.; Jeanfreau, B.; Bishop, G.R. Energetics of molecular recognition for the L-argininamide-aptamer interaction. (in preparation for submission to Biochemistry).
- Chaires, J.B. Energetics of drug-DNA interactions. Biopoly 1997, 44, 201. [Google Scholar]
- Chaires, J.B. Allosteric conversion of Z DNA to an intercalated right-handed conformation by daunomycin. J. Biol. Chem. 1986, 261, 8899. [Google Scholar]
- Satyanarayana, S.; Dabrowiak, J.C.; Chaires, J.B. Tris(phenanthroline)ruthenium(II) enantiomer interactions with DNA: mode and specificity of binding. Biochemistry 1993, 32, 2573. [Google Scholar]
- Jain, S.S; Polak, M.; Hud, N.V. Controlling nucleic acid secondary structure by intercalation: effects of DNA strand length on coralyne-driven duplex disproportionation. Nucleic Acids Res. 2003, 31, 4608. [Google Scholar]
- Chaires, J.B. Analysis and interpretation of ligand-DNA binding isotherms. Methods Enzymol. 2001, 340, 3. [Google Scholar]
- Qu, X.; Chaires, J.B. Analysis of drug DNA binding data. Methods Enzymol. 2000, 321, 353. [Google Scholar]
- Correia, J.J.; Chaires, J.B. Analysis of drug-DNA binding isotherms: a Monte Carlo approach. Methods Enzymol. 1994, 240, 593. [Google Scholar]
- Harris, D.C. Quantitative Chemical Analysis, 6th Edition ed; W.H. Freeman and Company: New York, NY, 2002; p. 440. [Google Scholar]
- Wadkins, R.M. Targeting DNA secondary structures. Curr. Med. Chem. 2000, 7, 1. [Google Scholar]
- Sample Availability: Commercially available.
© 2004 by MDPI (http:www.mdpi.org). Reproduction is permitted for noncommercial purposes.
Share and Cite
MDPI and ACS Style
Wood IV, A.E.; Bishop, G.R. Probing the Structure of DNA Aptamers with a Classic Heterocycle. Molecules 2004, 9, 67-85. https://doi.org/10.3390/90300067
AMA Style
Wood IV AE, Bishop GR. Probing the Structure of DNA Aptamers with a Classic Heterocycle. Molecules. 2004; 9(3):67-85. https://doi.org/10.3390/90300067
Chicago/Turabian StyleWood IV, Arthur E., and G. Reid Bishop. 2004. "Probing the Structure of DNA Aptamers with a Classic Heterocycle." Molecules 9, no. 3: 67-85. https://doi.org/10.3390/90300067