Article

High Throughput Screening and QSAR-3D/CoMFA: Useful Tools to Design Predictive Models of Substrate Specificity for Biocatalysts†

by
J. D. Carballeira
1,
M. A. Quezada
1,
E. Álvarez
2 and
J. V. Sinisterra
1,*
1
Biotransformations Group, Department of Organic and Pharmaceutical Chemistry, Faculty of Pharmacy, Universidad Complutense de Madrid, 28040 Madrid, Spain
2
Centro de Investigación Básica, GlaxoSmithKline, Tres Cantos, Madrid, Spain
*
Author to whom correspondence should be addressed.
Molecules 2004, 9(8), 673-693; https://doi.org/10.3390/90800673
Submission received: 17 March 2004 / Accepted: 10 July 2004 / Published: 31 July 2004

Abstract

:
After a hierarchical microbial screening process, new microorganisms have been discovered that act as biocatalysts for the stereoselective oxidation of secondary alcohols or for ketone reduction. Oxidation activity is more widespread in yeasts and bacteria, while actinomycetes, filamentous fungi and yeasts present the highest reduction activities. QSAR-3D/CoMFA is an adequate technique to design predictive models of the biocatalysts’ activity. In this paper CoMFA models are designed to compare the activities of the biocatalysts selected for the oxidation of alcohols and for the reduction of ketones, starting from the results obtained during the screening process. These models are useful for learning about the activity of these microorganisms and to compare the substrate specificity requirements between alcohol oxidation and ketone reduction biocatalysts.

Introduction

Red-ox biotransformations catalyzed by microorganisms have been in the focus of organic chemists working in Biotransformations because the use of isolated enzymes is limited by their requirements for cofactors. The use of whole cells presents the advantage that the cofactors are produced and recycled by the cell’s metabolic pathways [1]. Nevertheless, traditional biocatalysts such as the well known baker’s yeast give poor enantiomeric excesses, low yields or large biomass production, especially when large or medium ketones or alcohols are used as the substrates.
The oxidation of alcohols leading to aldehyde formation is an interesting reaction in Organic Chemistry. It has been previously developed using a Gluconobacter oxidans strain as a whole cell biocatalyst [2,3,4,5]. The use of biocatalysts is very interesting for the stereoselective reduction of ketones and the stereospecific oxidation of secondary alcohols, reactions that sometimes cannot be performed using conventional chemistry procedures [6]. Consecutive red-ox biotransformations can also be used to achieve desymmetrization and asymmetryzation processes, in order to increase the low enantiomeric excesses obtained using certain biocatalysts [6].
The oxidation of alcohols and the reduction of ketones are commonly carried out by alcohol dehydrogenases (ADHs). These intracellular enzymes are ubiquitous, being present in microorganisms, plants and animals. ADHs are NAD+ or NADP+ dependent enzymes [7,8]. The formal enzymatic mechanism for the oxidation of alcohols is well established since 1951 [
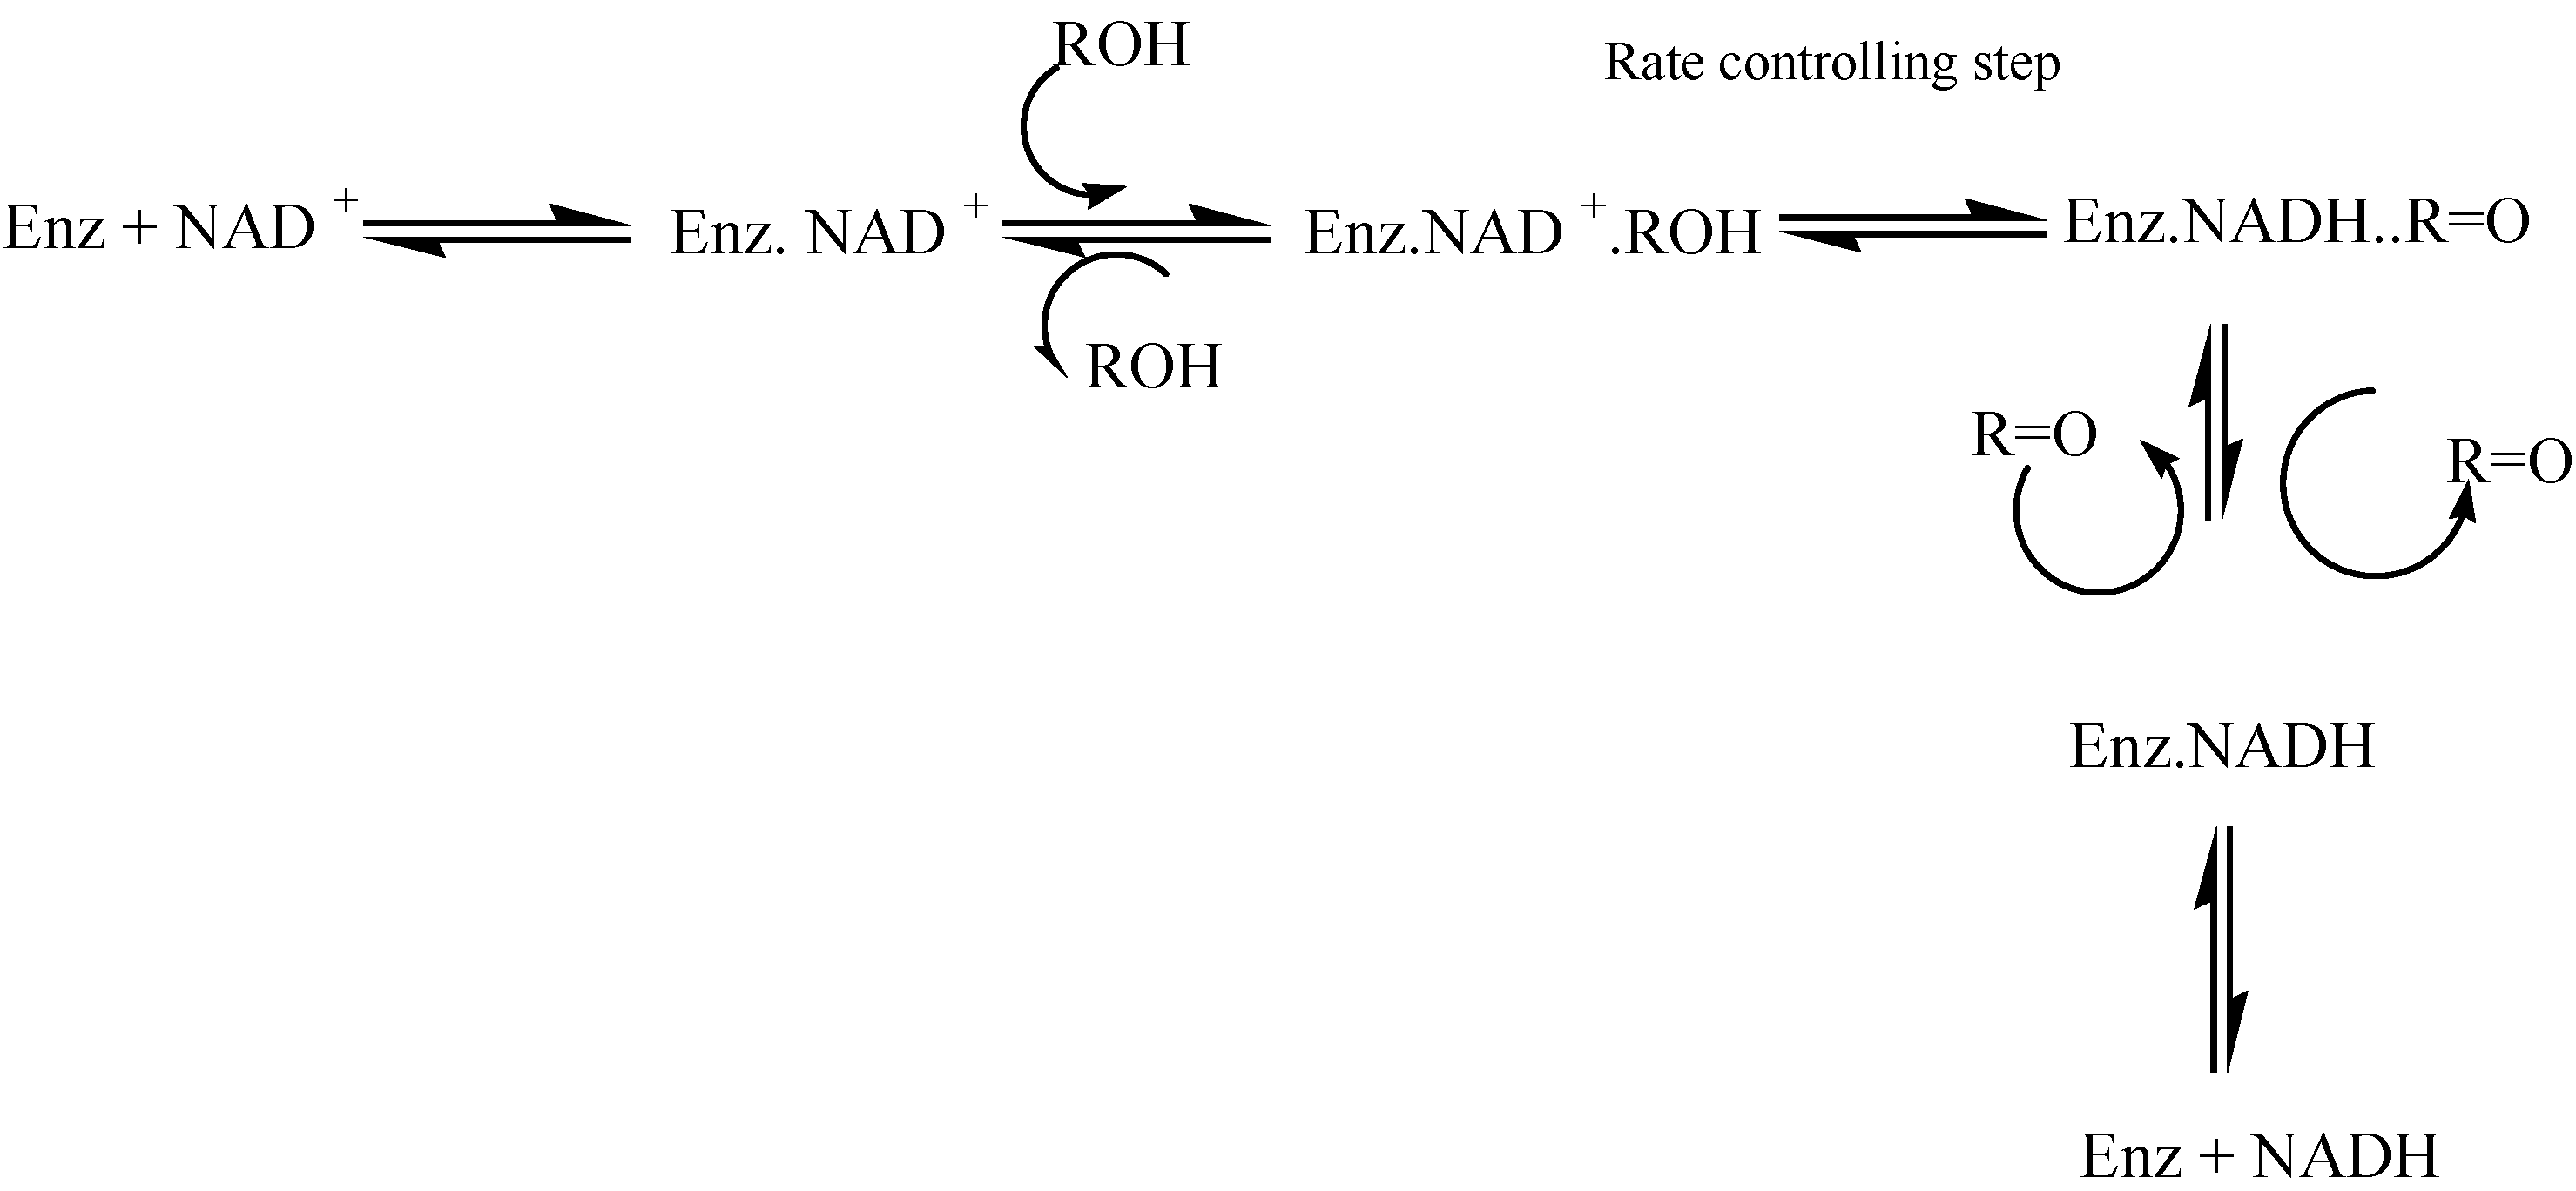
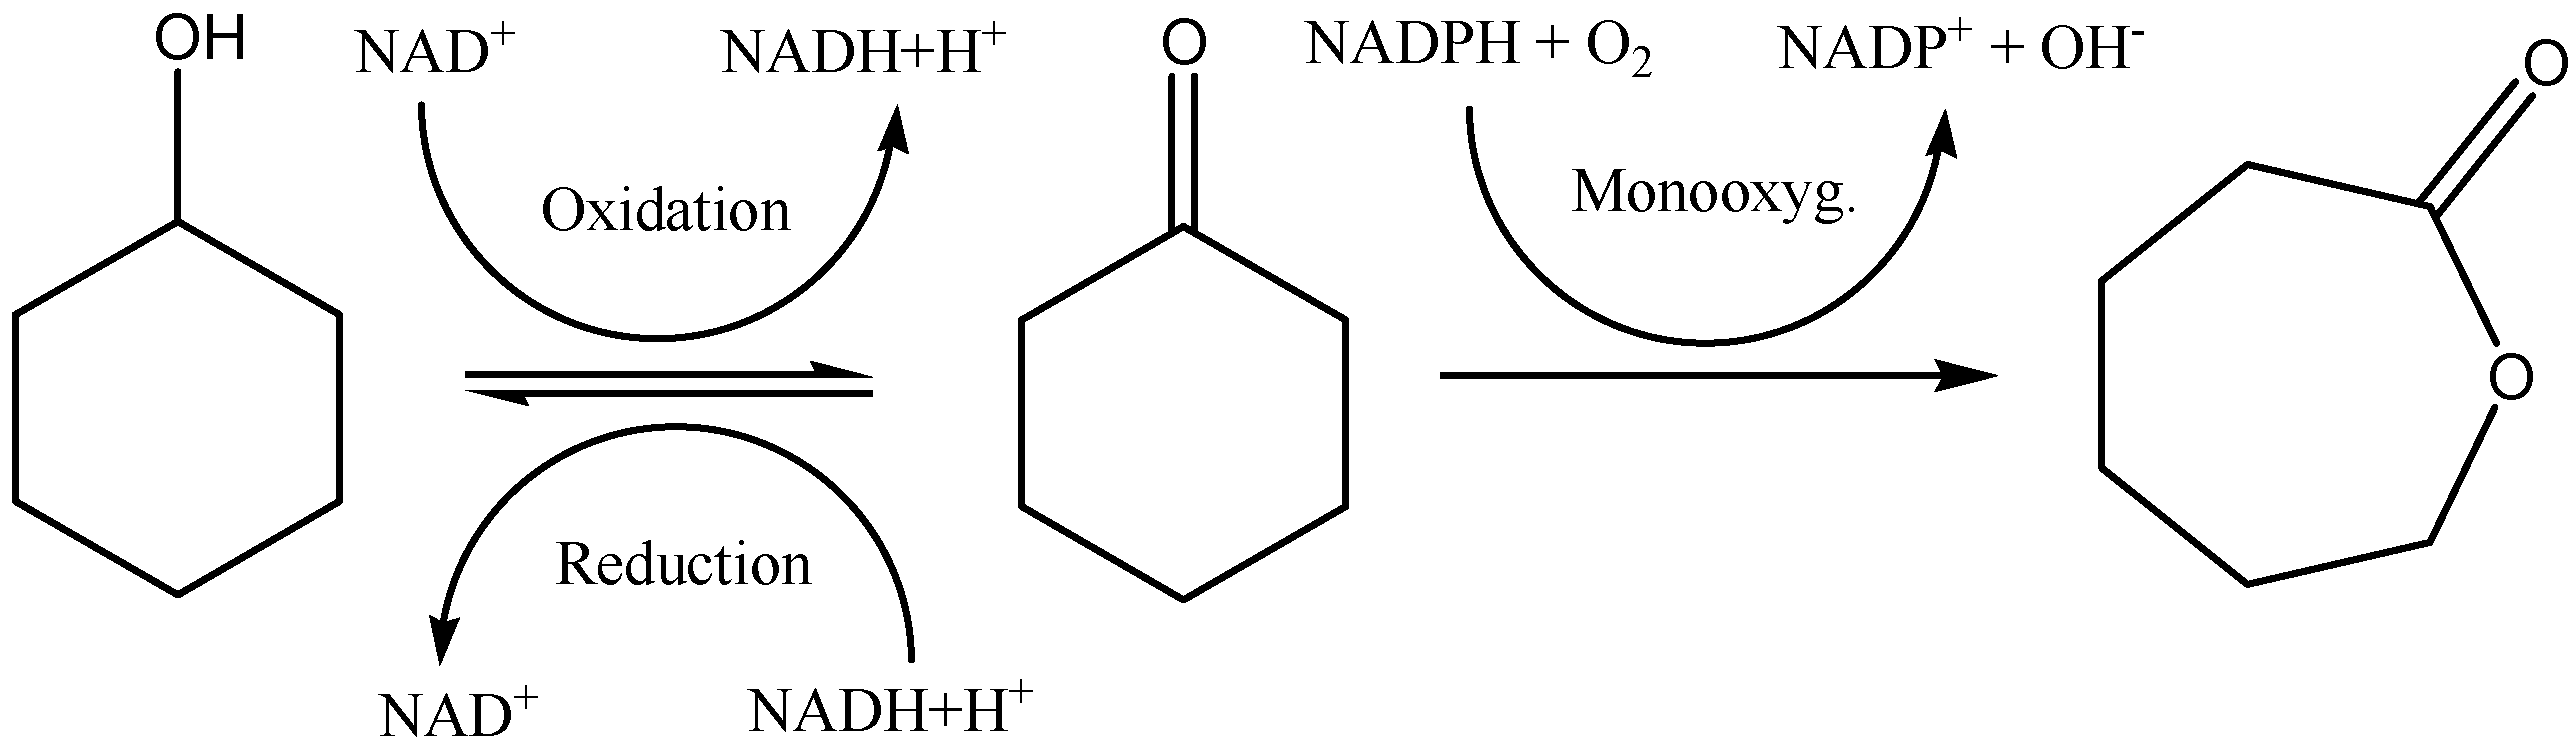
9]. The process consist of a series of equilibria where the rate controlling step is the hydride transfer from the alcohol to NAD(P)+ in the ternary “enzyme + NAD+ + alcohol” complex.
Scheme 1. Alcohol dehydrogenase mechanism.
Molecules 09 00673 g008
As a result of all this the discovery of new biocatalysts to increase the screening libraries is always of interest in Organic Chemistry [10]. Nowadays, this is possible by the application of the newest screening and selection technologies that allow the rapid identification of enzyme activities from different sources.
Comparative Molecular field analysis (CoMFA) is a method for three dimensional (3D) quantitative structure-activity relationships (3D-QSAR) developed at Tripos1. Although the concept of the approach has been known as DYLOMMS (dynamic lattice-oriented molecular modelling system) [11] for over a decade, it was not until the 90s that the method became widely used after it was reborn as CoMFA in 1988 [12,13]. The methodology has been patented and the program is available as a QSAR package in SYBYL1.
Comparative Molecular Field Analysis (CoMFA) applied to enzyme catalyzed biotransformations, as a QSAR-3D methodology, may produce a semiquantitative active site structure picture. CoMFA has proven its ability to predict biological properties of systems not amenable to direct analysis. The fundaments of this methodology are well described in the literature [12,13,14,15,16,17,18,19,20] but CoMFA has only been applied a few times in Biocatalysis, to the best of our knowledge [
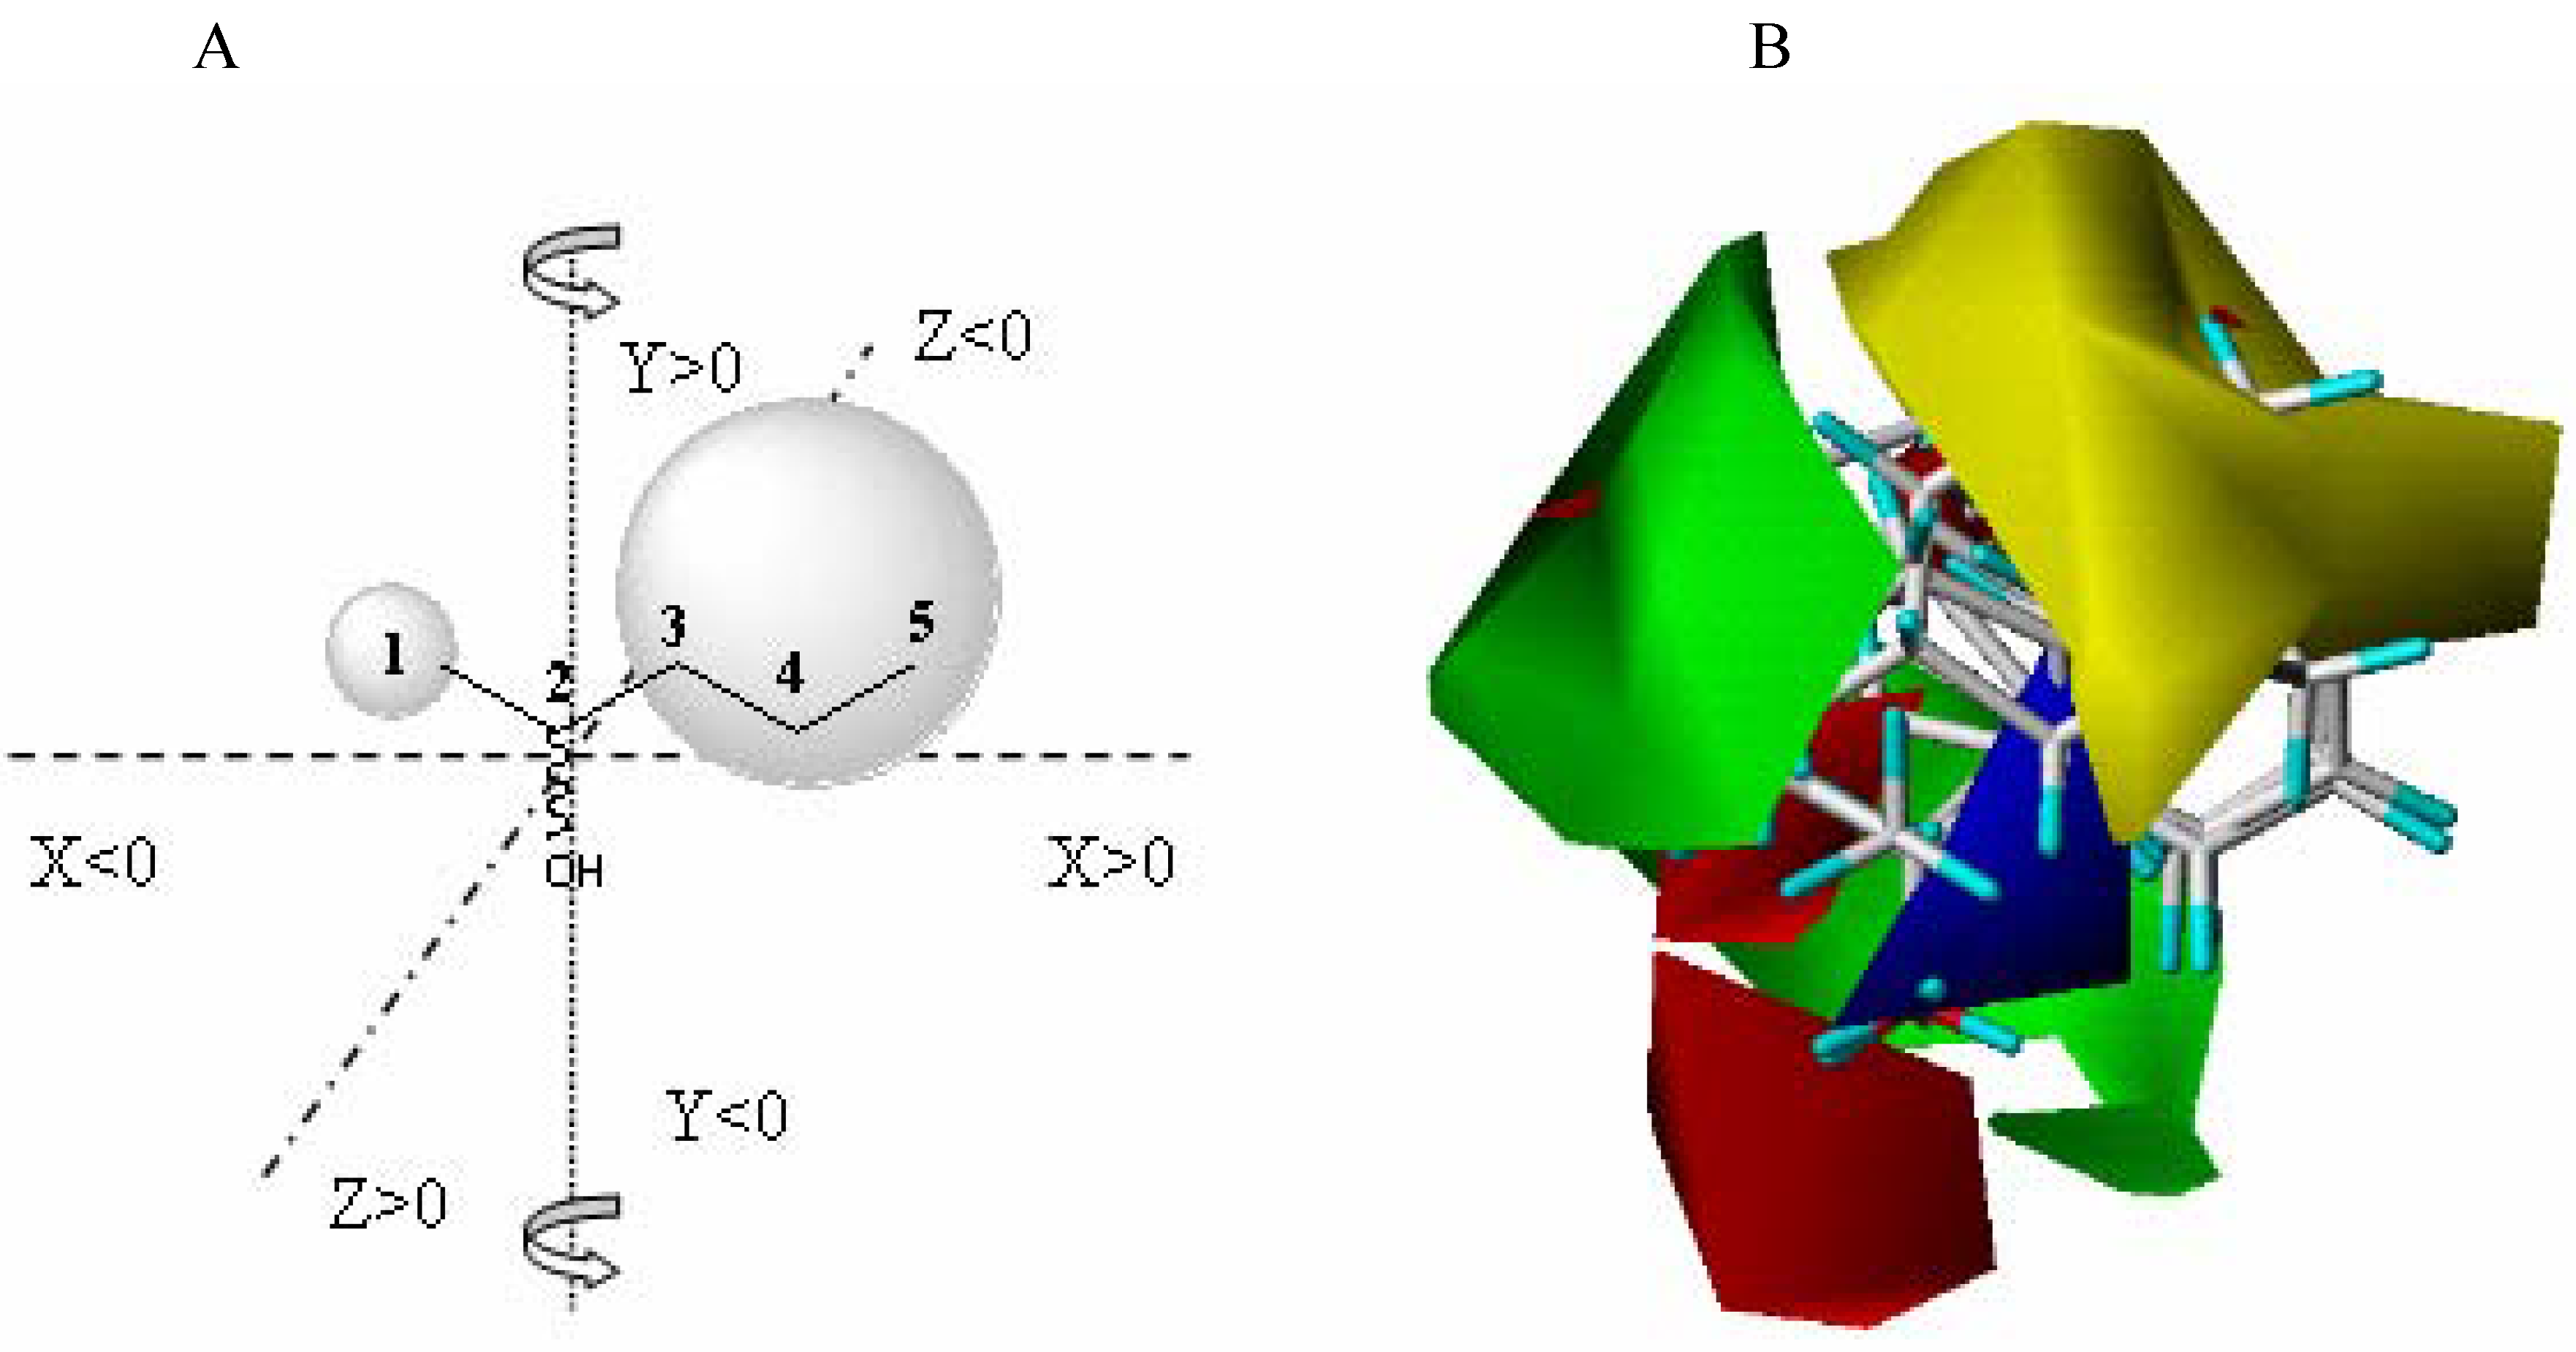
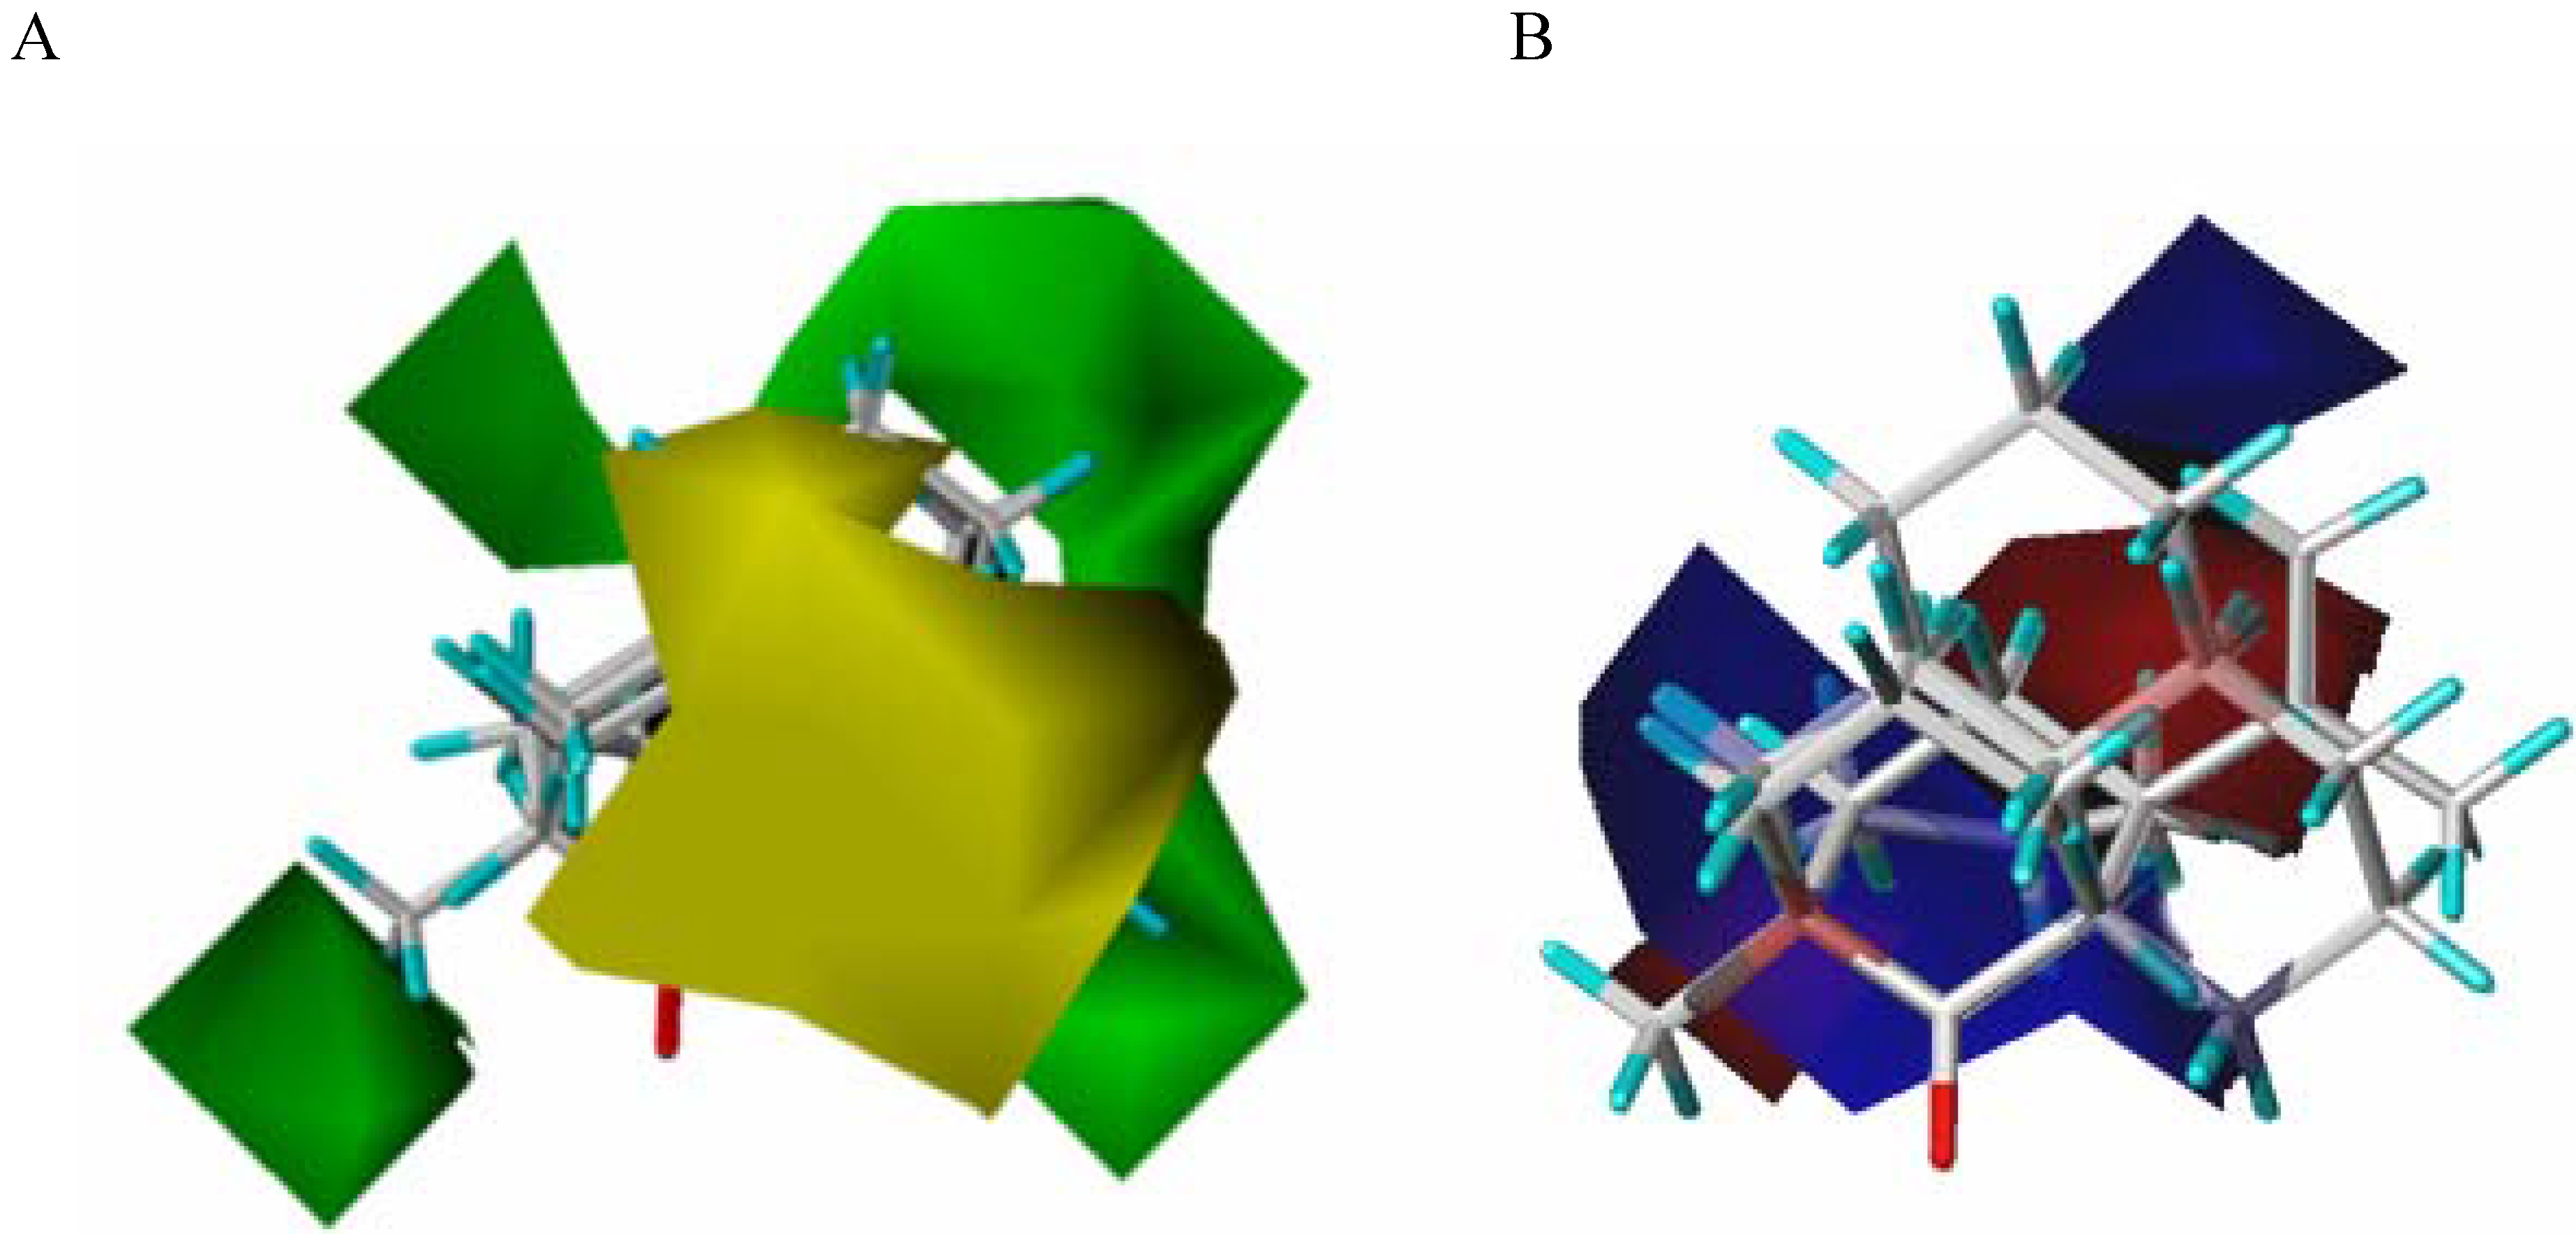
21]. The CoMFA model is a 3D representation of the steric and electrostatic zones of the active-site, directly related to amino acid composition. In Biocatalysis, the model is built starting from the experimental data obtained from the enzyme-substrate interaction (represented as a percentage conversion).
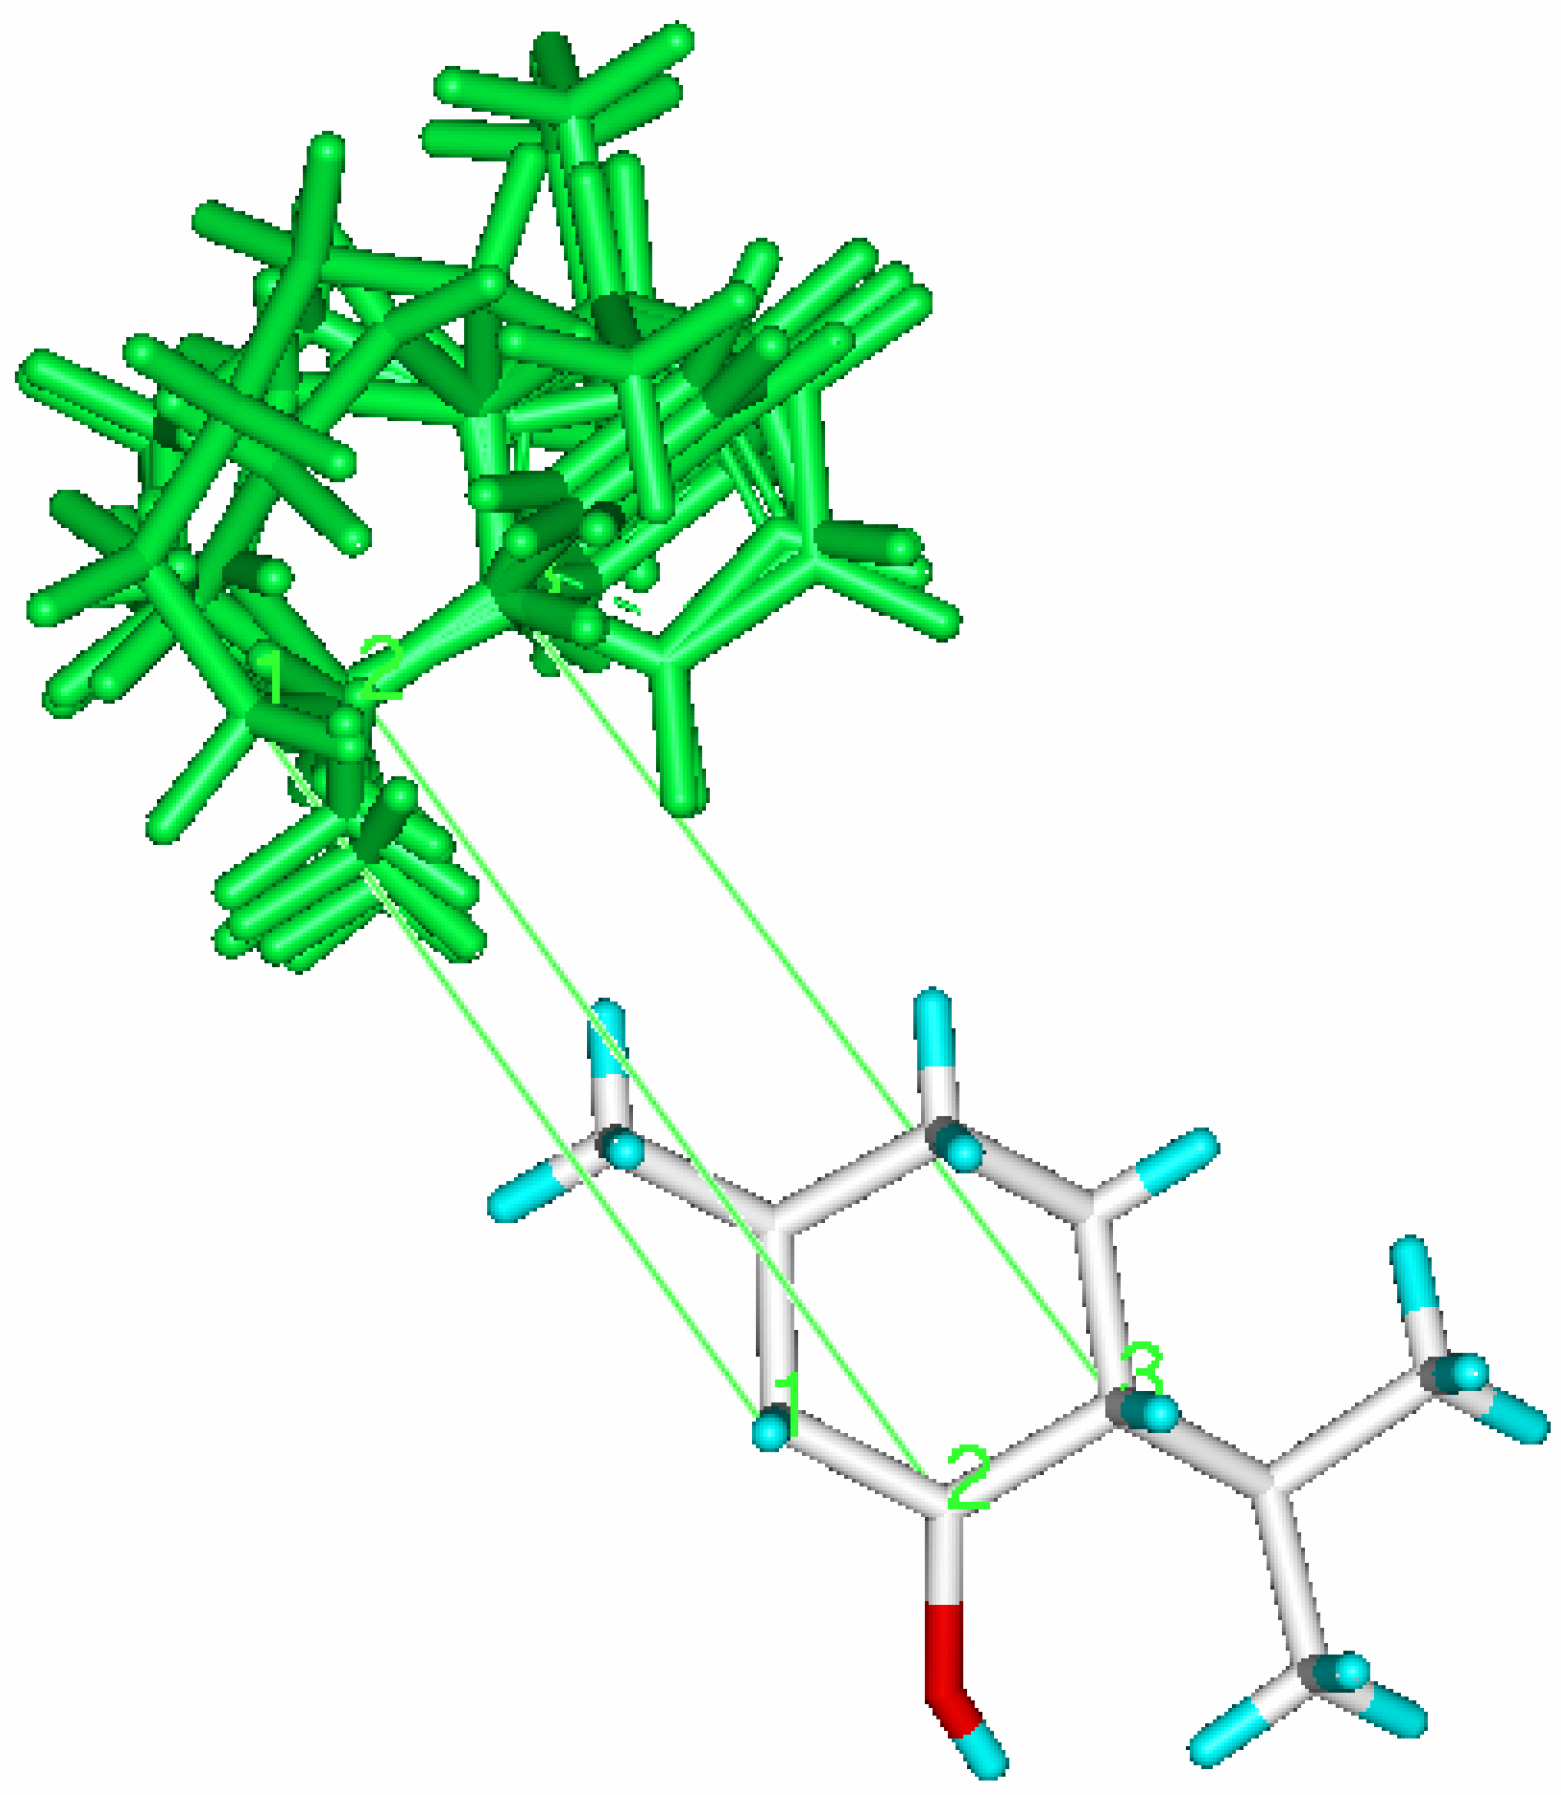
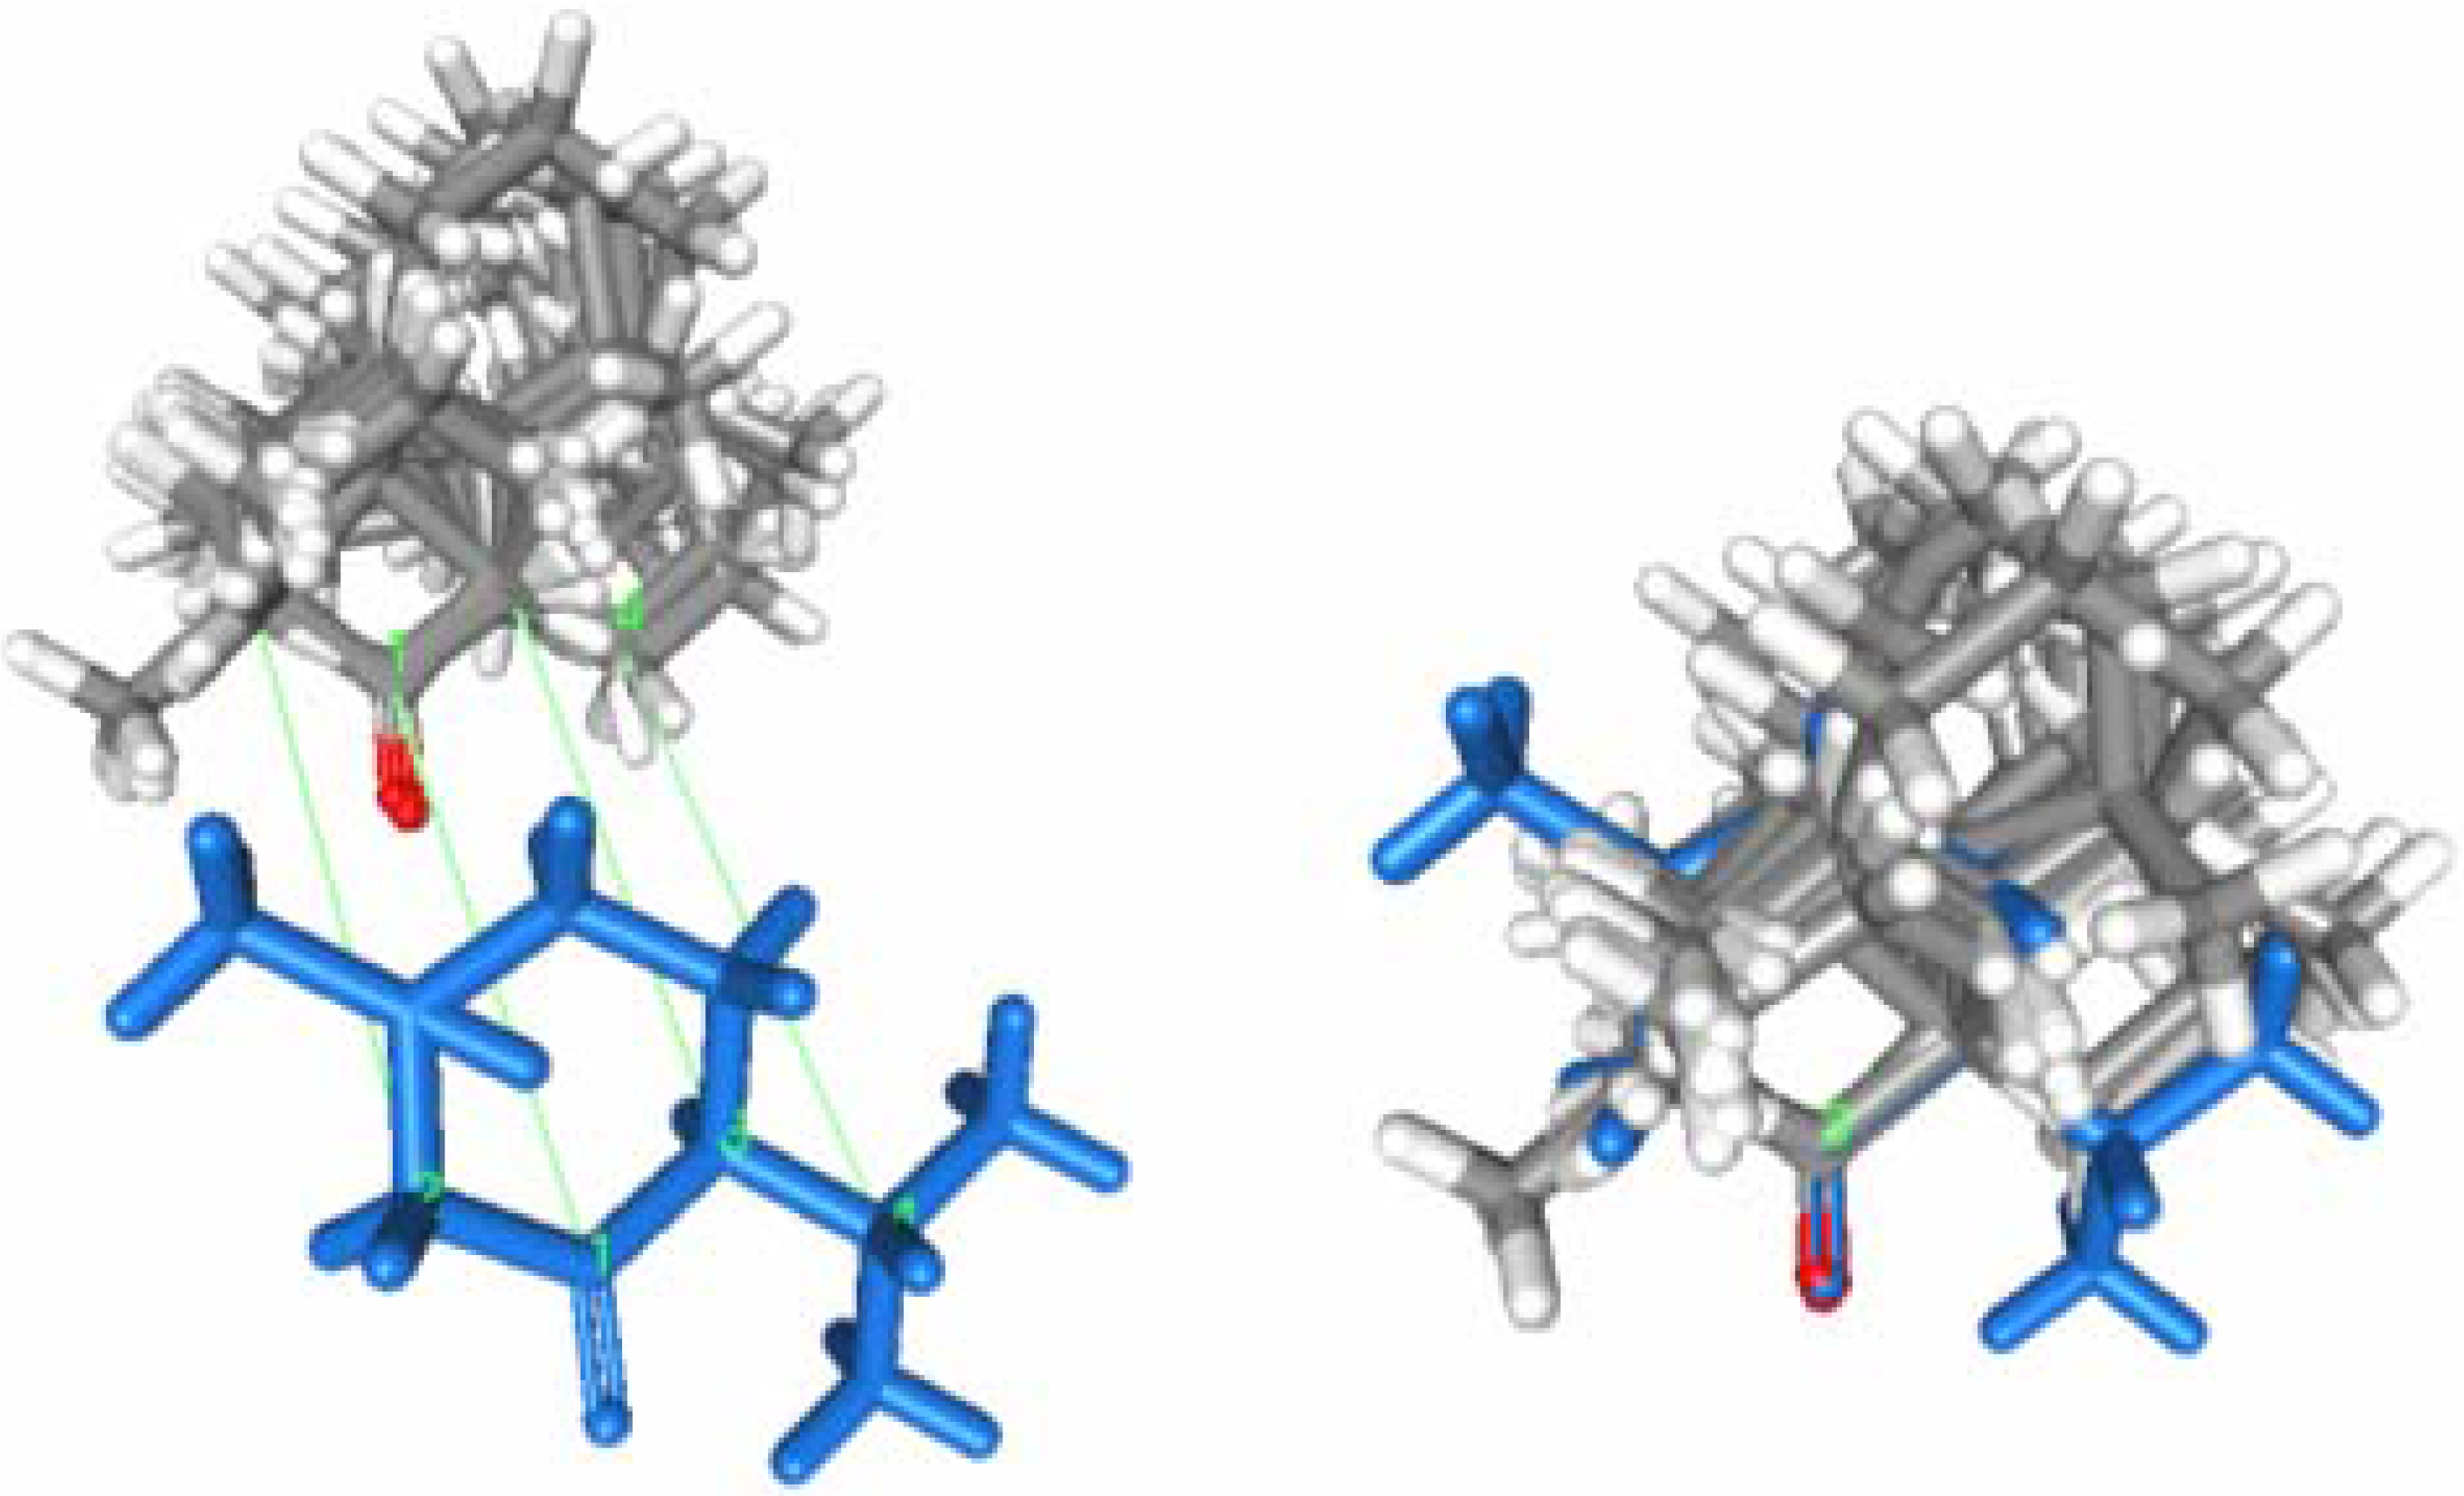
The CoMFA model is obtained starting from the fitting model of the substrates aligned according to a rational established criteria, and is complementary to the fitting model of the substrates (bioactive conformers) taking into account the yield (percentage conversion - experimental data) obtained against each substrate characterized by its steric and electrostatic properties.
QSAR-3D/CoMFA methodology could be a good way to obtain a predictive model of the activity and substrate specificity of a biocatalyst. Using these models we can select a priori the appropriate biocatalyst for each substrate, saving time and reagents. In this paper, a hierarchical screening process looking for new alcohol oxidation and ketone reduction biocatalysts has been performed starting from a collection of 416 microorganisms from public libraries, selected trying to acheive the maximum biodiversity. We describe, comparatively, the results of both ketone-reduction and alcohol-oxidation microbial screenings. Afterwards the combinatorial screening of the alcohol oxidation biocatalysts and the design steps of the CoMFA model are also explained.

Results and Discussion

Screening of microorganisms

The selected reactions for the screening were the reduction of cyclohexanone and the oxidation of cyclohexanol. The aim of the selection process was to obtain good biocatalysts for one of the reactions that did not show activity in the reverse reaction. The microorganisms that lead to secondary metabolites of cyclohexanol or of cyclohexanone were rejected. In this way microorganisms that lead to ε-caprolactone by Baeyer-Villiger monooxygenation [22] were not selected. Both reactions are dependent on coenzymes. The enzymes responsible of these reactions are alcohol dehydrogenases [E.C. 1.1.1.245] that could catalyze both reactions according to Scheme 2.
Scheme 2.
Scheme 2.
Molecules 09 00673 g009
Table 1. Microorganisms giving yields higher than 20% in the oxidation of cyclohexanol. [Cyclohexanol] =10 mM. Reaction time = 72 h. T = 28 ºC, Stirring speed = 250 rpm. [23]
EntryPhylumMicroorganismsReferenceOxidationYield (%)
1YeastWilliopsis californicaCBS 215894
2YeastWilliopsis saturnusNCYC 231378
3BacteriumRhodococcus rhodochrousDSMZ 1109768
4YeastFellomyces spCBS 861661
5YeastPachysolen tannophilusNCYC 159760
6YeastKluyveromyces lactisCBS 289656
7YeastArthroascus fermentansCBS 783056
8YeastSporidiobolus johnsoniiNCYC 42151
9BacteriumRhodococcus erythropolisDSMZ 842446
10YeastChelatococcus asaccharovoransATCC 5153145
11YeastPichia fermentansNCYC 165740
12Filamentous FungusPhialemonium curvatumCBS 505.8238
13YeastSporopachyderma cereanaNCYC 85637
14YeastStephanoascus ciferiiNCYC 230532
15BacteriumRalstonia eurotrophaDSMZ 283932
16Filamentous FungusCorynascus novoguineensisIMI 29195531
17Marine FungusCeriosporopsis tubuliferaATCC 6428327
18BasidiomyceteIrpex vellereusCBS 515.9227
19YeastTrichosporon equatileNCYC 263525
20BacteriumCytophaga lyticaDSMZ 203924
21Filamentous FungusConiochaeta velutinaCBS 981.6823
22Filamentous FungusTetracladium setigerumIMI 9406123
23BacteriumPseudomonas spDSMZ 732221
The reaction was carried out using batch fermenting cells under the optimum culture conditions selected for each strain type. The microorganisms giving high yields (>20 %) in the oxidation of cyclohexanol to cyclohexanone are shown in Table 1. The yields of the secondary reactions – reduction and monooxygenation of cyclohexanone – were lower than 10% for all selected microorganisms. Only the fungi Coniochaeta velutina and Tetracladium setigerum display considerable activity without side-reactions.
In Table 2 we present the results of the microorganisms selected as active biocatalysts for the reduction of cyclohexanone. These strains do not shown activity in the oxidation of the cyclohexanol produced in the reaction. In this reaction, many more microorganisms were active compared to the oxidation reaction. Therefore, we selected microorganisms that do not give secondary reactions and that gave more than a 50% yield of cyclohexanol.
Table 2. Reduction of cyclohexanone. Microorganisms that afford cyclohexanol yields greater than 50%. [Cyclohexanone] = 10 mM. Reaction time = 72 h. T = 28 ºC. Stirring speed = 250 rpm. [24]
EntryPhylumMicroorganismsReferencesReduction Yield (%)
1Filamentous FungusGongronella butleriCBS 157.2597
2Marine FungusZopfiella latipesATCC 2618396
3BasidiomyceteCoriolus azureusCBS 410.6696
4Filamentous FungusMonascus kaoliangCBS 302.7889
5Marine FungusBuergenerula spartinaeATCC 6254588
6YeastSchizosaccharomyces octosporusNCYC 42787
7Filamentous FungusDiplogelasinospora grovesiiIMI 17101885
8YeastIssatchenkia scutulataCBS 667081
9Filamentous FungusAbsidia glaucaCBS 100.4881
10Marine FungusDactylospora haliotrephaATCC 6695078
11Filamentous FungusRhizomucor variabilisCBS 384.9578
12Filamentous FungusNeosartorya hiratsukaeCBS 294.9371
13YeastSirobasidium magnumCBS 680369
14Filamentous FungiPyrenochaeta oryzaeIMI 19567967
15YeastSchwanniomyces occidentalisNCYC 13366
16Filamentous FungusActinomucor elegansCBS 100.0966
17Filamentous FungusNeosartorya aureolaCBS 105.5565
18Yeast]Filobasidium capsuligenum]NCYC 60665
19YeastTrichosporon aquatileNCYC 263564
20Filamentous FungusMarssonina brunnea .IMI 20255263
21YeastSchizoblastosporion starkeyi-henriciiCBS 764761
22Filamentous FungusSphaerostilbella luteaCBS 224.8561
23Filamentous FungusTalaromyces wortmanniiCBS 384.6759
24BasidiomyceteHypholoma radicosumCBS 792.8558
25Filamentous FungusEchinosporangium transversaleCBS 357.6758
26Filamentous FungusAbsidia pseudocylindrosporaCBS 480.6657
27YeastSporidiobolus johnsoniiNCYC 42155
28YeastBotryoascus synnaedendrusCBS 618655
29ActinomyceteActinoplanes sp.DSMZ 4303152
30Filamentous FungusMonascus ruberCBS 254.6550
31Filamentous FungusRhizomucor pusillusCBS 245.5850
After the screening process we decided to compare the results obtained for each taxonomic group, to evaluate how these activities are distributed between the different phyla (actinomycetes, bacteria, basidiomycetes, filamentous fungi, marine fungi and yeasts) under the set conditions. In Table 3, we show the percentage of each phylum showing interesting activity for: i) the oxidation of cyclohexanol or ii) for the reduction of cyclohexanone. It is remarkable that cyclohexanone reduction activities are common in actinomycetes (51% positive strains among those tested), yeasts (47 % positive) and filamentous fungi (41 % positive), while the cyclohexanol oxidation activities are more widespread in yeasts (24 % positive) and in bacteria (19 % positive). Moreover, the percentage of filamentous fungi capable of oxidizing cyclohexanol is very low 3% (5 of 148 screened) According to this data, yeasts are the most versatile phylum in red-ox reactions.
Table 3. Percentage of microorganisms of each taxonomic group that present activity in the reduction or in the oxidation reactions studied.
ReactionActinomycetesFilamentousFungiBacteriaBasidiomycetesMarine FungiYeasts
Reduction51%41 %4 %13 %33 %47 %
Oxidation11 %3 %19 %2 %12 %24 %
The next step was to explore the resistance of the best strains towards the intrinsic toxicity of the substrates. In Figure 1 we show the results for the oxidation of cyclohexanol (Figure 1A) and for reduction of cyclohexanone (Figure 1B). This study is fundamental in order to get true information from the synthetic process, avoiding any toxicity problems.
Figure 1. Comparison between the toxicity of cyclohexanol (Figure A) and of cyclohexanone (Figure B) at different concentrations for the selected strains (batch fermenting cells). T = 28 ºC.Reaction time = 72 h. Stirring speed = 250 rpm
Molecules 09 00673 g001
As may be observed in Figure 1, higher concentrations of cyclohexanone than of cyclohexanol are tolerated by the selected microorganisms. This result could be related to the lower hydrophobic parameter (logP) value of cyclohexanol (log P= 1.32) compared to that of cyclohexanone (log P= 1.53), in accordance of the theory of Brick and Tramper [25]. These authors state that hydrophilic solvents with low partition coefficients (log P) are more toxic towards free whole cells than hydrophobic solvents [26]. Indeed, in the case of cyclohexanone we can achieve good reduction yields even at 100 mM concentrations. In the case of cyclohexanol oxidation, the concentrations of substrate tolerated by the strains are noticeably lower. Only residual activity is reported over 50 mM.
The kinetic profiles (Figure 2) indicate the existence of a latency period in the oxidation reaction (Figure 2B) that is not detected in the case of the reduction reactions (Figure 2A). This fact makes the reduction biocatalysts achieve the maximum conversion rates faster than in the case of the strains selected for cyclohexanol.
Figure 2. Kinetic profiles of the reduction of cyclohexanone (Figure A)and of the oxidation of cyclohexanol (Figure B) using the selected microorganisms as batch fermenting cells. T=28ºC. [Substrate] 10 mM . Stirring speed =250 rpm.
Molecules 09 00673 g002

Comparative Molecular Field Analysis (CoMFA): CoMFA oxidation model

After the first screening step three yeasts: Williopsis californica, Williopsis saturnus and Pachysolen tannophilus, were chosen and thoroughly studied by testing their activity in the oxidation of a collection of substrates selected in order to analyze the molecular structures that could be recognized by these biocatalysts. The results of the oxidation reactions using the selected strains under batch fermenting conditions are shown in Table 4. The yeasts display activity in the oxidation of different alcohols, their stereoselectivity in the oxidation of S-enantiomer of secondary alcohols being noteworthy. In the case of tetrahydronaphtol enantiomers the yeasts are S-stereospecific.
Table 4. Results obtained using the alcohol oxidation biocatalysts as batch fermenting cells. T = 28 ºC. [Substrate] 2.5 mM. Reaction time = 48 h. Stirring speed = 250 rpm. The substrates listed in the table are those towards which the three microorganisms display a similar behaviour.
CompoundW. californicaW. saturnusP. tannophilus
1Cyclobutanol969981
2Cyclopentanol909896
3Cyclohexanol947860
4Cycloheptanol792599
5Cyclooctanol741265
6Cyclododecanol93161
72-Adamantanol0035
8Benzyl alcohol000
9R-Myrtenol000
10S-Myrtenol2460
11(1R)-(2-Furyl)-ethanol505620
12(1S)-(2-Furyl)-ethanol998284
13(1R)-Phenyl-ethanol9713
14(1S)-Phenyl-ethanol436851
151-Decalol000
16(1R)-Tetralol000
17(1S)-Tetralol986655
The fundaments of CoMFA methodology are well described in the literature [11,12,13,14,15,16,17,18,19,20] but to the best of our knowledge CoMFA has only been applied a few times in Biocatalysis [21]. Several fittings were used but the best results were achieved when the carbon of C-OH was in the coordinate origin, the largest group was fitted to C3 and C4 and the small one over C1. The fitting criterion used for alignment of the conformers of the molecules in CoMFA analysis is shown in Figure 3. The optimization of the geometry of the molecules and the conformational analysis are described in the Experimental. The CoMFA statistical parameters are shown in Table 5. The q2 value (>0.5) 0.614 indicates that the model obtained is predictive.
Table 5. Statistical parameters of the CoMFA model for the oxidation microorganisms.
ParameterAnalysis
q2Leave one out LOO0.614
Number of componentsLeave one out LOO3
R 2No validation0.945
F values (n1 = 2, n2 = 11)No validation40.08
R2 Prob = 0 (n1 = 2, n2 = 11)No validation0.000
The CoMFA model displays the steric and electrostatic properties of the active site of the biocatalyst providing important information about what kind of molecular structures could be accepted as substrates by the selected strains. These models could be used to hypothesize “a priori” if a certain type of substrates are or not susceptible to be transformed by the described catalyst.
Figure 3. (Figure A):Fitting criterion used for alignment of the conformers of the molecules in CoMFA analysis and the alcohol oxidation biocatalysts CoMFA model. In the CoMFA model (Figure B)the steric hindrance zones (yellow and green) and electrostatic zones (red and blue) are shown. The color code used in the figure is as follows: Steric hindrance zones: Green areas depict zones of space where occupancy by the substrates increases affinity, whereas yellow areas depict zones where occupancy decreases affinity. Electrostatic zones: areas where a high electron density provided by the ligand increases (red) or decreases (blue) the activity.
Molecules 09 00673 g003
Using the CoMFA model we can consider if a new substrate could be biotransformed well and, in the case of enantiomers, the stereopreference of the biocatalyst. For that purpose, as a first step the minimum energy conformer (considered as the bioactive conformer) of the new substrate must be aligned to the fitting model following the set alignment rules. In Figure 4 we show the fitting of a new substrate, menthol, to the CoMFA fitting model for oxidation of alcohols.
Figure 4. Alignment of menthol to the fitting model of all the substrates oxidized by the yeasts. Example of alignment designed using Accelrys WebLab® Viewer
Molecules 09 00673 g004
Afterwards the presence of representative zones (steric or electrostatic) in the space occupied by that substrate must be analysed. This method has been used to predict if menthol enantiomers would be oxidized by a particular strain and the expected enantiopreference of that oxidation. Taking into account the CoMFA model information we can predict that 1-tetralol, 1S-1-phenyl ethanol, 1S-1-(2-furyl) ethanol, menthol and neo-menthol must be oxidized but not iso-menthol, as we show in Table 6.
Molecules 09 00673 i002
Table 6. Oxidation of menthol and neo-mentholusing the selected strains for oxidation of alcohols.
SubstrateWilliopsis californicaWilliopsis saturnusPachysolen tannophilus
18(-)-neo-Menthol (1R,2R,5S)37449
19(+)-Menthol (1S,2R,5S)446414

CoMFA reduction model

In the case of microorganisms selected for the stereoselective reduction of ketones: Diplogelasinospora grovesii, Gongronella butleri and Schizosaccharomyces octosporus a similar study was performed. The yields obtained in the reduction of different ketones are shown in Table 7.
Table 7. Yields obtained in the reduction of ketones using batch fermenting conditions. T = 28ºC. [Substrate] = 2.5 mM. Reaction time = 72 h, except in the case of S. octosporus (48 h). Stirring speed =250 rpm.
D.grovesiiG. butleriS.octosporusSubstrate
7470222-Adamantanone
9099852-Furaldehyde
539537Bicyclo[3.3.1]none-9-one
000cis-Bicyclo[3.3.0]-octan-3,7-dione
000(R)–fenchone
889598(1R,4R)-dihydrocarvone
000Verbenone
0002-Azetidinone
0004-Acetoxyazetidin-2-one
968683(4aS, 8aR)-trans-1-Decalone
967150(4aR, 8aS)-trans-1-Decalone
434535(4aR, 8aR)-cis-1-Decalone
808571(4aS, 8aS)-cis-1-Decalone
822899(4aR,8aR)-trans-2-Decalone)
859687Cyclohexanone
320(4aR)- (-)-4a-Methyldeca-1(8 a)en-1-one
310(4R,S)-4-Methyldeca-2-en- 1-one
The substrates were aligned in the fitting model using the alignment rule in Figure 5, in the same way used for the alcohols in the oxidation screening assay.
Figure 5. Alignment rule of the ketones for CoMFA study
Molecules 09 00673 g005
The 3D-CoMFA model obtained to depict the substrate requirements common to D. grovesii, G. butleri and S. octosporus is shown in Figure 6.
Figure 6. Steric hindrance (green-yellow, Figure A)and electrostatic (red-blue, Figure B) zones.CoMFA models of the reduction biocatalyst. Steric hindrance zones: Green areas depict zones of space where occupancy by the substrates increases affinity, whereas yellow areas depict zones where occupancy decreases affinity. Electrostatic zones: areas where a high electron density provided by the ligand increases (red) or decreases (blue) the activity.
Molecules 09 00673 g006
Table 8. Statistical parameters of the CoMFA model of ketone reduction by the selected microorganisms.
ParametersAnalysis
q2Leave one out LOO0.798
Number of componentsLeave one out LOO2
R 2No validation0.95
F values (n1 = 2, n2 = 11)No validation97.618
R2 Prob =0 (n1 = 2, n2 = 11)No validation0.000
The q2 value is almost 0.8 (Table 8), indicating that the model could be considered highly predictive. In order to test this predictiveness of the model, we tried to hypothesize the activity of the biocatalysts towards two new cyclic substrates: pulegone and menthone.
Molecules 09 00673 i001
The substrates must be aligned to the fitting model to observe the CoMFA zones occupied by these substrates (Figure 7).
Figure 7. Alignment of menthone to the fitting model of the substrates selected for the CoMFA model.
Molecules 09 00673 g007
According to the model, pulegone would not be reduced by the strains, due to the presence of the double bond in an electrostatic zone where the presence of negative charge is not allowed (Figure 6B). This fact correlates with the experimental data, because none of the biocatalysts reduces pulegone. In the case of menthone, the structural properties of the substrate are accepted by the model (Figure 6) and this ketone would be reduced to give menthol, showing S-stereoselectivity (95%) and yield of 52%.

Conclusions

Under our working conditions, the observed oxidation activity is expressed mainly in yeast and bacteria, while ketone reducing ability is more widespread in actinomycetes, filamentous fungi and yeasts (Table 3). Using the data obtained from the screening process a QSAR-3D/CoMFA model was obtained to display the substrate specificity of alcohol oxidation and ketone biocatalysts. These CoMFA analyses can be used as a predictive model for future biotransformations. QSAR-3D/CoMFA is a useful technique to depict the screening results in a 3D figure in order to simplify its comprehension and to hypothesize if a new substrate could be biotransformed or not by this kind of biocatalysts.

Experimental

General

Chemicals

All the substrates for the oxidation reactions were obtained from Sigma-Aldrich. All the culture media components were from Difco Laboratories and from Merck.

Microbial collection

The microorganisms used in this study were obtained from different public collections: American Type Culture Collection, U.S. (ATCC); Fungal Biodiversity Center, Utrecht, The Netherlands (CBS); International Mycological Institute, U.K. (IMI); German collection of cell cultures, Germany (DSMZ) and National Collection of Yeast Cultures, U.K. (NCYC).

Conservation of microorganisms

Bacteria, actinomycetes, yeasts, filamentous and marine fungi, were conserved as suspensions in a 30% glycerol solution. All these strains were stored at -80 ºC in Nunc cryotubes. Basidiomycetes were also conserved as cell suspensions in 30% glycerol and stored at -150 ºC in a liquid nitrogen tank.

Culture media

A preliminary screening was performed in order to select the most appropriate culture media for each type of microorganisms. After that, the following culture media were selected for the different microbial groups: Bacteria: LB Medium [26]: Tryptone (Difco), 10 g/L; Yeast extract (Difco), 5 g/L; NaCl (Merck), 5 g/L; KH2PO4 buffer, pH 6.5. Actinomycetes: ABME [27] Medium: CaCO3 (Merck), 10 g/L, FeSO4.7H2O (Merck), 0.003 g/L, KCl (Merck), 0.5 g/L, MgSO4.7H2O (Merck), 0.5 g/L, Meat Extract (Oxoid), 5 g/L, Malt extract (Difco), 40 g/L. Yeasts: Yeast Extract (Difco), 3 g/L; Malt Extract (Difco), 3 g/L; Bactopeptone (Difco), 5 g/L; Bactodextrose (Merck), 10 g/L. Basidiomycetes: Lyophilized potato, 22 g/L; Dextrose (Merck), 20 g/L. Filamentous Fungi: HAGGS Medium [28] (Adjust to pH 6.6): Glycine, 2 g/L; Tryptic soy broth, 6 g/L; Starch, 20 g/L; Mineral solution, 10 ml/L. Mineral solution: FeSO4.7H2O, 1 g/L; MnSO4.4H2O, 1 g/L; CuCl2, 0.025 g/L; CaCl2, 0.10 g/L; H3B03, 0.056 g/L; ZnSO4.7H2O, 0.2 g/L; (NH4)6Mo7O24.4H2O, 0.019 g/L. Marine Fungi: Lyophilized potatoes, 22 g/L; Dextrose (Merck), 20 g/L, NaCl (Merck), 5 g/L.

Screening method: growing cells

Bacteria and Yeasts

Conical 100 mL flasks containing 20 mL of the selected culture media were inoculated with 50 μL of the microbial cells suspension in glycerol (previously thawed). Cultures were performed in an orbital shaker at 28 ºC and 250 rpm [29,
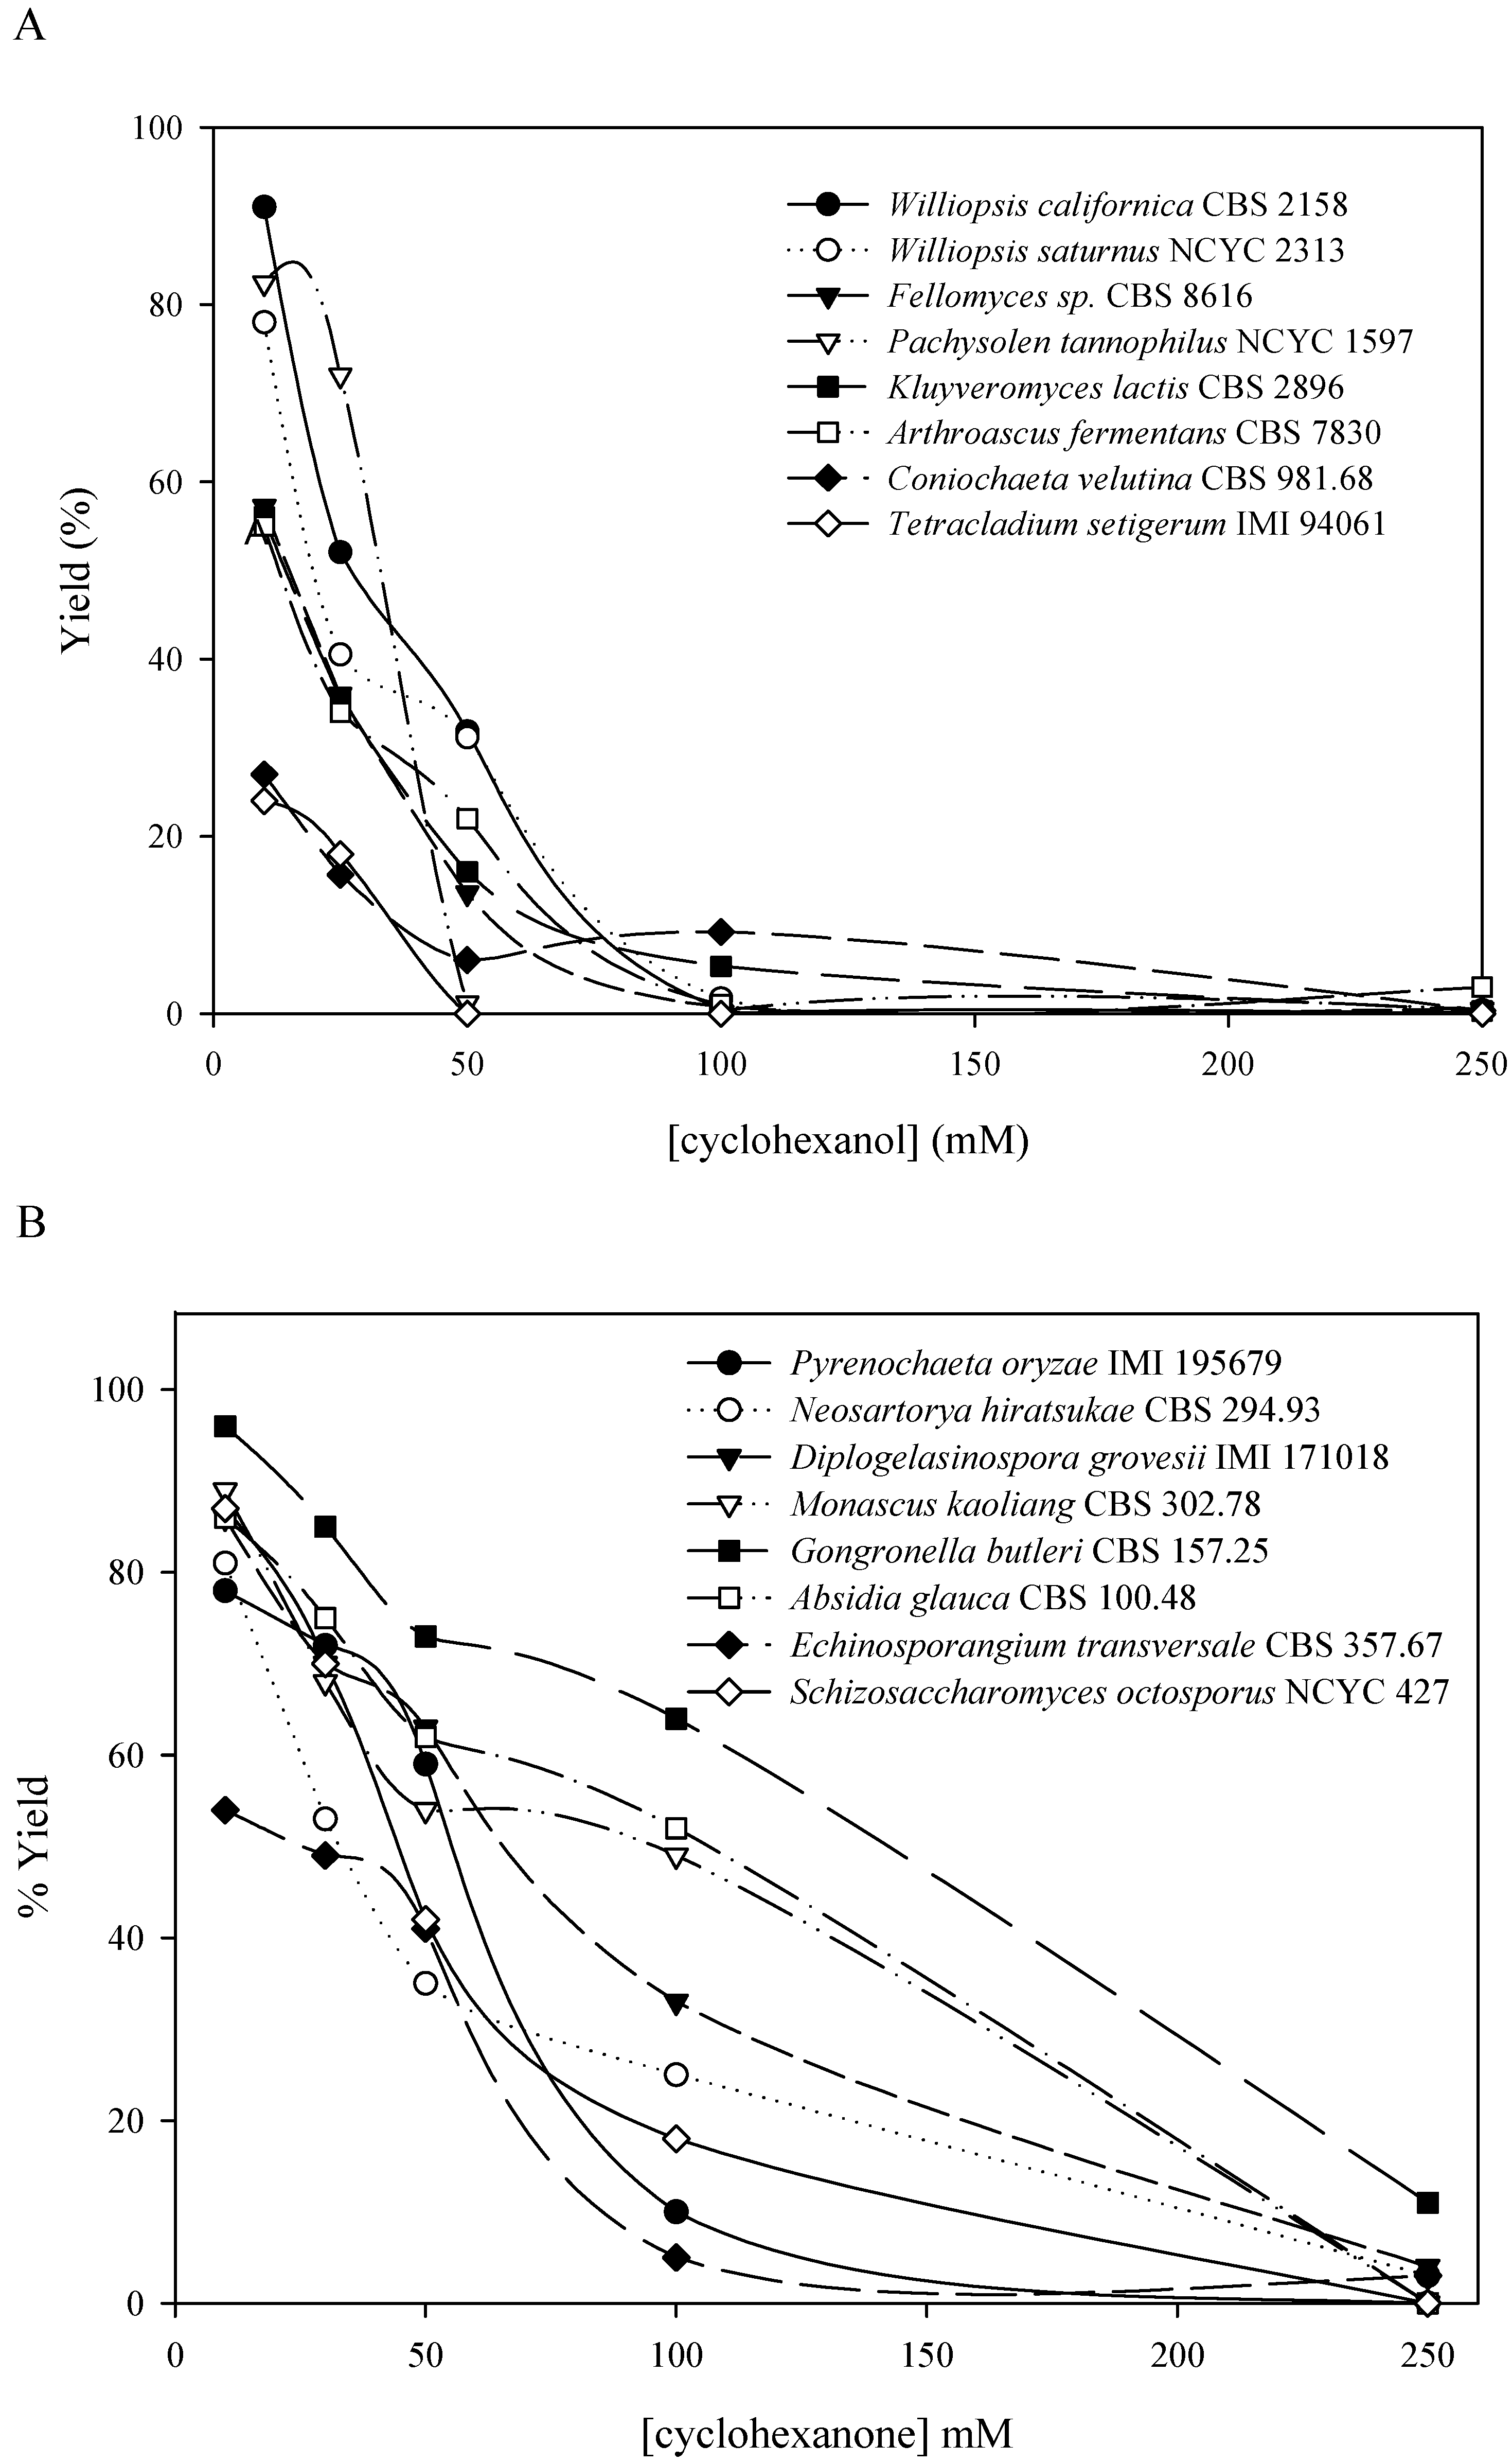
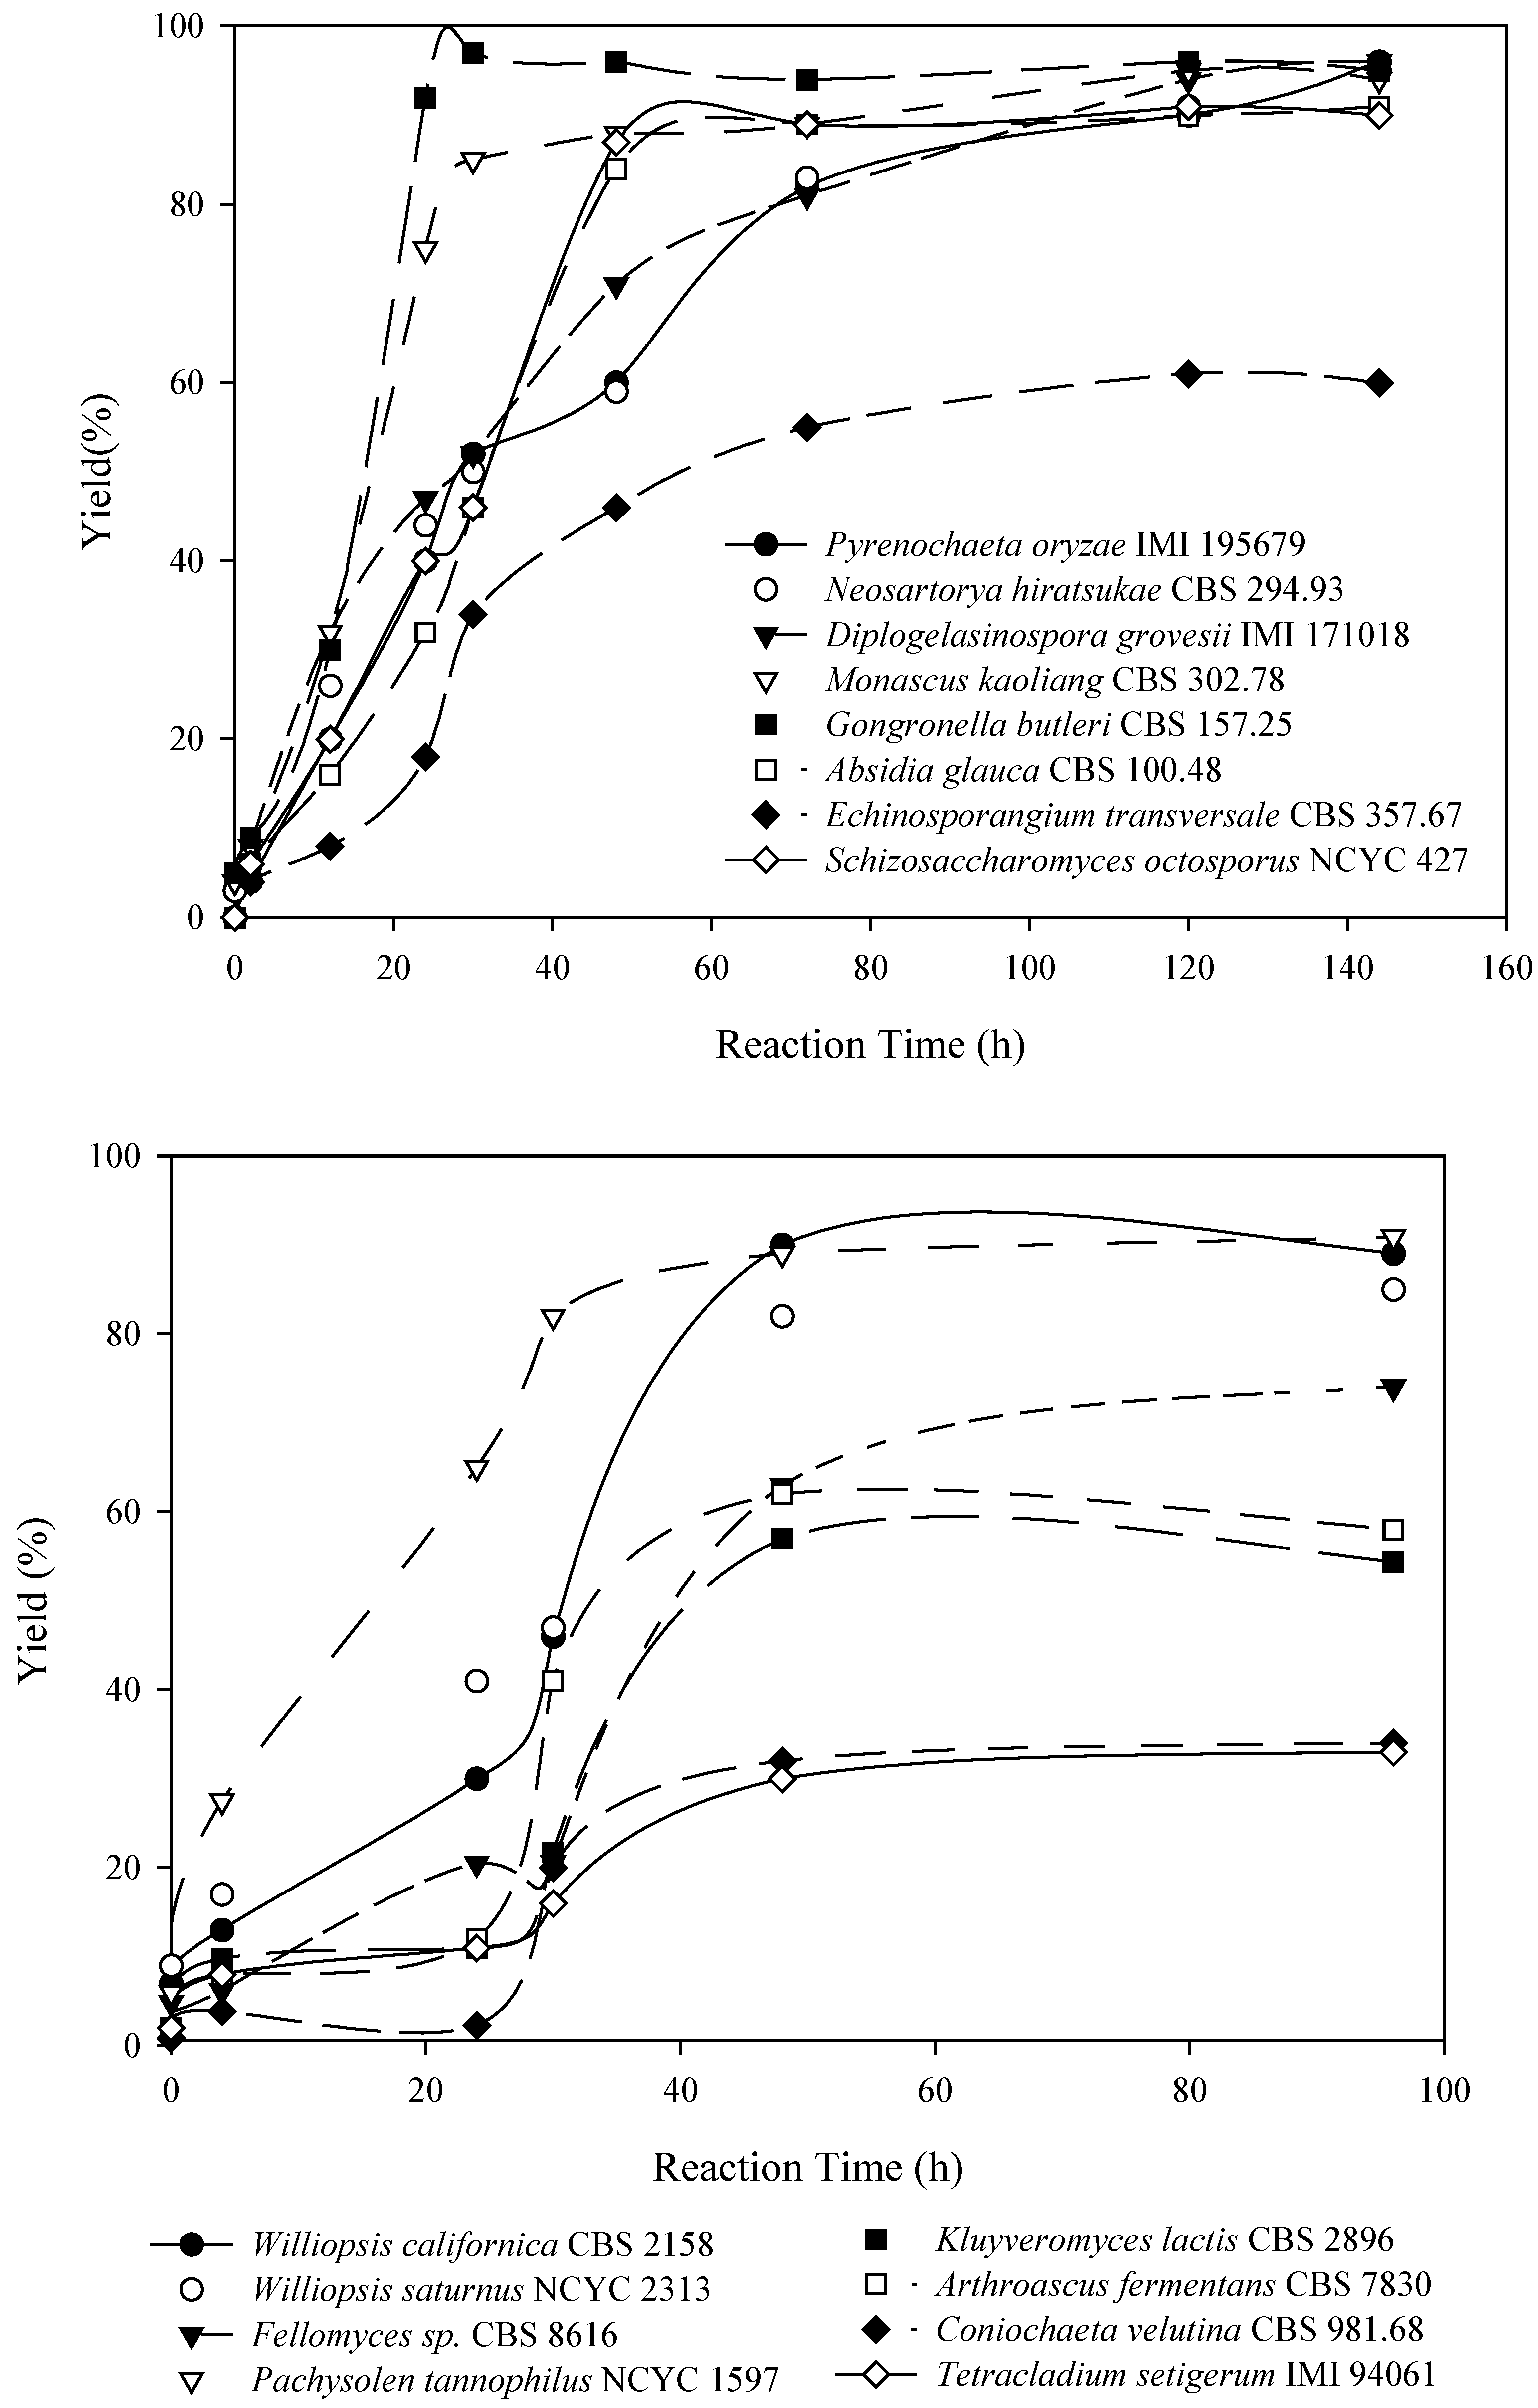
30]. After 48 h of incubation, the substrate was added to the flasks at a 10 mM final concentration (in the case of the final screening reactions, the substrate concentration was set to 2.5 mM) [29,31]. The reaction time was 72 h. When the reaction was finished, the content of the conical flask was transferred into a Falcon tube and 5 mL of ethyl acetate (containing 1 mg/mL of hexadecane as internal standard) were added. After vortexing for 10 s, the organic phase was transferred to a 2 mL Hewlett-Packard vial. All the reactions were repeated three times and the results displayed are the arithmetic mean values.

Other microorganisms

For the other microbial groups the screening process was essentially the same as described above. Culture and reaction times were 72 h for actinomycetes and filamentous fungi. For basidiomycetes and marine fungi the culture time was set to 120 h and the reaction time was 72 h.

Analysis: Gas chromatography

The analysis of the samples from the reactions was performed with a Hewlett Packard 5890 Series II gas chromatograph provided with an automated sampler (Agilent Technologies) and an electrolytic hydrogen generator UHP-601 (Domnick Hunter). The capillary column was a Carbowax SGL-1000 (60m, 0.25mm, 0.25 μm) from Sugelabor (Spain). We defined the following analytical parameters. Ti 155 ºC; ti: = 1 min; Tf = 175 ºC; Tf = 10 min; Heating rate = 4 ºC/min ; Carrier flow (He) = 40 psi; Split ratio = 100 mL/min. Injector and Detector Temperatures = 250 ºC.
The analysis of the oxidation of chiral alcohols and the reduction of prochiral ketones were performed using a Varian 3400cx gas chromatograph equipped with an automated sampler. A CP 7502 Carbowax capillary column (25 m, 0.39 mm) from Sugelabor (Spain) was employed under the following conditions: Ti = 90 ºC; ti = 5 min; heating rate = 5 ºC/min; Tf: = 175 ºC; tf: = 7 min. Carrier flow (He) = 25 psi, and split ratio = 100 mL/min. Injector and detector temperatures = 250 ºC.
The yield calculation was performed by dividing the peak area of the product by that corresponding to the standard extraction value of the substrate in the same conditions. The standard extraction value was established using the data from 10 conical flasks with the same volume of culture medium, stirring speed, temperature and reaction time. The substrate was extracted using ethyl acetate and analyzed by gas chromatography. No significant variation in the value of the area was detected between flasks. The arithmetic mean of these areas was used for the yield determination. The standard extraction value is a reference value that serves to avoid potential problems owing to the physico-chemical properties of the organic substrates tested.

CoMFA analysis

The SYBYL/CoMFA® analysis was performed on a Silicon Graphics Octane-2 workstation at the Computer Service of the Universidad Autónoma of Barcelona. The optimization of the geometry of the database molecules in the postulated active conformation was performed using a 6-31G* basis set. The charges of each atom were calculated from the molecular electrostatic potential [13] using a 6-31G* basis set. The solvating energies of the substrates were calculated with a continuous polarized model [12,13] using a 6-31G* basis set. The QSAR table for CoMFA included the steric and electronic field values, the stabilization energy of enzyme substrate complex, the solvating energy and the yield in alcohol obtained for each carbonylic group. The electrostatic and steric fields were calculated at each lattice intersection grid of 2 Å.
Partial Least Squares (PLS) analysis [18,19] was used to obtain straight lines from the matrix. The Leave One Out (LOO) cross validation method was used to select the number of main components of QSAR-3D analysis and to calculate the statistical parameters (q2). The CoMFA model was generated using a no-cross-validation method and the number of components indicated by the LOO validation. QSAR 3D/CoMFA analysis was performed with the QSAR module of the SYBYL 6.5 program and the calculus was performed using GAUSSIAN-98 [20].

Acknowledgments

This paper has been supported by the grants BIO2000- 0747-C05-01 from Ministerio de Ciencia y Tecnología of Spain. The authors gratefully acknowledge the collaboration of Dr. Valmaseda in the selection and settlement of the microorganisms and the cooperation of Dr. Pardo and Dr. Campillo in the design of the CoMFA model.

References

  1. Roberts, S. M.; Turner, N. J.; Willets, A. J.; Turner, M. K. Introduction to Biocatalysis using Enzymes and Micro-organisms, Cambridge University Press: Cambridge (U.K.), 1995; vol. 2, 34–79.
  2. Gandolfi, R.; Ferrara, N.; Molinari, F. An easy and efficient method for the production ofcarboxylic acids and aldehydes by microbial oxidation of primary alcohols. Tetrahedron Lett. 2001, 42, 513–514. [Google Scholar]
  3. Villa, R.; Romano, A.; Gandolfi, R.; Sinisterra, J. V.; Molinari, F. Chemoselective oxidation of primary alcohols to aldehydes with Gluconobacter oxydans. Tetrahedron Lett. 2002, 43, 6059–6061. [Google Scholar]
  4. Molinari, F.; Villa, R.; Manzoni, M.; Aragozzini, F. Aldehyde production by alcohol oxidation with Gluconobacter oxydans. Appl. Microbiol. Biotechnol. 1995, 43, 989–994. [Google Scholar]
  5. Molinari, F.; Villa, R.; Aragozzini, F.; Leon, R.; Prazeres, D. M. F. Enantioselective oxidation of (RS)-2-phenyl-1-propanol to (S)-2-phenylpropanoic acid with Gluconobacter oxydans: simplex optimization of the Biotransformation. Tetrahedron: Asymmetry. 1999, 10, 3003–3009. [Google Scholar]
  6. Faber, K. Biotransformation in Organic Chemistry; Springer-Verlag: Heidelberg(Germany), 2000; pp. 177–217. [Google Scholar]
  7. Jörnvall, H. The primary structure of yeast alcohol dehydrogenase. Eur. J. Biochem. 1977, 72, 425–442. [Google Scholar]
  8. Duester, G.; Farres, J.; Felder, M. R.; Holmes, R. S.; Höög, J. O.; Parés, X.; Plapp, B. V.; Yin, S. J.; Jörnvall, H. Recommended nomenclature for the vertebrate alcohol dehydrogenases gene family. Biochem. Pharmacol. 1999, 58, 389–395. [Google Scholar]
  9. Theorell, H.; Chanwe, B. Studies on liver alcohol dehydrogenase II. The kinetics of the compound of horse liver alcohol dehydrogenase and reduced diphosphopyridine nucleotide. Acta Chem. Scand. 1951, 5, 1127–1144. [Google Scholar]
  10. Demirjian, D. C.; Shah, P. C.; Morís-Varas, F. Screening for novel enzymes. In Biocatalysis, from discovery to application; Fessner, W.D., Ed.; Springer: Berlin (Germany), 2000. [Google Scholar]
  11. Wise, M.; Cramer, R. D.; Smith, D.; Exman, I. Progress in three-dimensional drug design: The use of real-time colour graphics and computer postulation of bioactive molecules in DYLOMMS. In Quantitative Approaches to Drug Design; Deardon, J. C., Ed.; Elsevier: Amsterdam (The Netherlands), 1983; pp. 145–146. [Google Scholar]
  12. Cramer, R. D.; Bunce, J. D.; Patterson, D. E. Cross-validation, bootstrapping and partial least squares compared with multiple regression in conventional QSAR studies. Quant. Struct.-Act. Relat. 1988, 7, 18–25. [Google Scholar]
  13. Cramer, R. D.; DePriest III, S. A.; Patterson, D.E.; Hecht, P. The Developing Practice of Comparative Molecular Field Analysis. In 3D QSAR in Drug Design; Kubinyi, H., Ed.; ESCOM: Leiden (The Netherlands), 1993; pp. 443–485. [Google Scholar]
  14. Klebe, G.; Abraham, U. On the prediction of binding properties of drug molecules by comparative molecular field analysis. J. Med. Chem. 1993, 36, 70–80. [Google Scholar]
  15. Cornell, W. D.; Cieplak, P.; Bayly, C.; Gould, I. R.; Merz, K. M.; Ferguson, D. M.; Spellmeyer, D. C.; Fox, T.; Caldwell, J. W.; Kollman, P. A. A second generation force field for the simulation of proteins, nucleic acids, and organic molecules. J. Am. Chem. Soc. 1995, 117, 5179–5197. [Google Scholar]
  16. Miertus, S.; Scrocco, E.; Tomasi, J. Electrostatic interaction of a solute with a continuum. A direct utilization of ab initio molecular potentials for the prevision of solvent effects. Chem. Phys. 1981, 55, 117–129. [Google Scholar]
  17. Dunn, W. J.; Wold, S.; Edlund, U.; Hellberg, S.; Gasteiger, J. Multivariate structure-activity relationships between data from a battery of biological tests and an ensemble of structure descriptors: the PLS method. Quant. Struct.-Act. Relat. 1984, 3, 131–137. [Google Scholar]
  18. Wold, S.; Ruhe, A.; Wold, H.; Dunn, W. J. I. The covariance problem in linear regression. The partial least squares (PLS) approach to generalized inverses. SIAM J. Sci. Stat. Comput. 1984, 5, 735–743. [Google Scholar]
  19. Wold, S.; Albano, C.; Dunn, W. J. I.; Edlund, U.; Esbensen, W.; Geladi, P.; Hellberg, S.; Johansson, E.; Lindberg, W.; Sjöström, M. Multivariate data analysis in chemistry. In Chemometrics: mathematics and statistics in chemistry; Kowwalsky, B.R., Ed.; Reidel: Dorrdrecht (The Netherlands), 1984; pp. 17–95. [Google Scholar]
  20. Frisch, M. J.; Trucks, G. W.; Schlegel, H. B.; Scuseria, G. E.; Robb, M. A.; Cheeseman, J. R.; Zakrzewski, V. G.; Montgomery, J. A.; Keith, T. A.; Petersson, G. A.; Raghavachari, K.; Al-Laham, A.; Stratmann, R. E.; Burant, J. C.; Dapprich, S.; Millam, J. M.; Daniels, A. D.; Kudin, K. N.; Strain, M. C.; Farkas, O.; Tomasi, J.; Barone, V.; Cossi, M.; Cammi, R.; Menucci, B.; Pomelli, C.; Adamo, C.; Clifford, S.; Ochterski, J.; Petersson, G. A.; Ayala, P. Y.; Cui, Q.; Morokuma, K.; Malick, D. K.; Rabuck, A. D.; Raghavachari, K.; Foresman, J. B.; Cioslowski, J.; Ortiz, J. V.; Stefanov, B. B.; Liu, G.; Liashenko, A.; Piskorz, P.; Komaromi, I.; Gomperts, R.; Martin, R. L.; Fox, D. J.; Keith, T.; Al-Laham, M. A.; Peng, C. Y.; Nanayakkara, A.; González, C.; Challacombe, M.; Gill, P. M. W.; Johnson, B. G.; Chen, W.; Wong, W.; Andres, J. L.; Head-Gordon, M.; Replogle, E. S.; Pople, J. A. Gaussian 98, Revision A.3, Gaussian, Inc., Pittsburgh, PA. 1998.
  21. Faber, K.; Griengl, H.; Hönig, H.; Zuegg, J. On the prediction of the enantioselectivity of Candida rugosa lipase by comparative molecular field analysis. Biocatalysis 1994, 9, 227–239. [Google Scholar]
  22. Wang, S.; Kayser, M.; Iwaki, H.; Peter, C. K.; Lau, J. Monooxygenase-Catalyzed Baeyer-Villiger Oxidations: CHMO vs CPMO. J. Mol. Cat. B: Enzymatic 2003, 22, 211–218. [Google Scholar]
  23. Carballeira, J.D.; García-Burgos, C.; Quezada, M. A.; Álvarez, E.; Sinisterra, J. V. Williopsis californica, Williopsis saturnus and Pachysolen tannophilus: novel microorganisms for the stereoselective oxidation of secondary alcohols. Biotechnol. Bioeng. 2004. In Press. [Google Scholar]
  24. Carballeira, J. D.; Valmaseda, M.; Alvarez, E.; Sinisterra, J.V. Gongronella butleri, Schizosaccharomyces octosporus and Diplogelasinospora grovesii,: Novel microorganisms useful for the stereoselective reduction of carbonylic compounds. Enzyme Microb. Technol. 2004, 34, 611–623. [Google Scholar]
  25. Brink, L. E.; Tramper, J. Optimization of organic solvent in multiphase Biocatalysis. Biotechnol. Bioeng. 1989, 27, 1258–1269. [Google Scholar]
  26. Sinisterra, J. V.; Dalton, H. Influence of the immobilization methodology in the stability and activity of P. putida UV4 immobilized whole cells. In Immobilized cells: Basic & Applications; Wijffels, R.H., Buitelarr, R.M., Bucke, C., Tramper, J., Eds.; Elsevier Science B.V: Amsterdam,(The Netherlands), 1996; pp. 416–423. [Google Scholar]
  27. Frenken, L. G. J.; Egmond, M. R.; Batenburg, A. M.; Wil Bos, J.; Visser, C.; Verrips, C. T. Cloning of the Pseudomonas glumae lipase gene and determination of the active site residues. Appl. Environ. Microbiol. 1992, 58, 3787–3791. [Google Scholar]
  28. Carballeira, J. D.; Alvarez, E.; Campillo, M.; Pardo, L.; Sinisterra, J. V. Diplogalasinospora grovesii IMI 171018, a new biocatalyst for the stereoselective reduction of ketones. Tetrahedron Asymmetry. 2004, 15, 951–962. [Google Scholar]
  29. Vazquez, M. J.; Roa, A. M.; Reyes, F.; Vega, A.; Rivera-Sagredo, A.; Thomas, D. R.; Diez, E.; Hueso-Rodriguez, J.A. A novel ergot alkaloid as a 5-HT(1A) inhibitor produced by Dicyma sp. J. Med. Chem. 2003, 46, 5117–5120. [Google Scholar]
  30. Sandey, H.; Willets, A. J. Biotransformations of cycloalkanones by microorganisms. Biotechnol. Lett. 1989, 9, 615–620. [Google Scholar]
  31. Alphand, V.; Archelas, A.; Furstoss, R. Microbiological transformations. 13. Direct synthesis of both S and R enantiomers of 5-hexadecanolide via an enantioselective microbiological Baeyer-Villiger reaction. J. Org Chem. 1990, 55, 47–350. [Google Scholar]
  • Sample availability: Not applicable.

