Article

Effective Population Size, Gene Flow, and Species Status in a Narrow Endemic Sunflower, Helianthus neglectus, Compared to Its Widespread Sister Species, H. petiolaris

1
Department of Biology, Indiana University, Bloomington, IN 47405, USA
2
Department of Botany, University of British Columbia, Vancouver, B.C. V6T 1Z4, Canada
*
Author to whom correspondence should be addressed.
Current address: Department of Biological Sciences, University of Illinois at Chicago, Chicago, IL 60607, USA
Int. J. Mol. Sci. 2010, 11(2), 492-506; https://doi.org/10.3390/ijms11020492
Submission received: 25 November 2009 / Revised: 17 January 2010 / Accepted: 21 January 2010 / Published: 2 February 2010
(This article belongs to the Special Issue Cladistic Analysis and Molecular Evolution)

Abstract

:
Species delimitation has long been a difficult and controversial process, and different operational criteria often lead to different results. In particular, investigators using phenotypic vs. molecular data to delineate species may recognize different boundaries, especially if morphologically or ecologically differentiated populations have only recently diverged. Here we examine the genetic relationship between the widespread sunflower species Helianthus petiolaris and its narrowly distributed sand dune endemic sister species H. neglectus using sequence data from nine nuclear loci. The two species were initially described as distinct based on a number of minor morphological differences, somewhat different ecological tolerances, and at least one chromosomal rearrangement distinguishing them; but detailed molecular data has not been available until now. We find that, consistent with previous work, H. petiolaris is exceptionally genetically diverse. Surprisingly, H. neglectus harbors very similar levels of genetic diversity (average diversity across loci is actually slightly higher in H. neglectus). It is extremely unlikely that such a geographically restricted species could maintain these levels of genetic variation in isolation. In addition, the two species show very little evidence of any genetic divergence, and estimates of interspecific gene flow are comparable to gene flow estimates among regions within H. petiolaris. These results indicate that H. petiolaris and H. neglectus likely do not represent two distinct, isolated gene pools; H. neglectus is probably more accurately thought of as a geographically restricted, morphologically and ecologically distinct subspecies of H. petiolaris rather than a separate species.

Graphical Abstract

1. Introduction

Species are one of the fundamental units of biological organization, and species delimitation is a major goal in evolutionary biology [1]. A wide range of different data types and methodological approaches has been used to delimit species, and often different data or approaches lead to dramatically different outcomes [2,3]. In the absence of genetic and molecular data, many species were initially described based on morphological, ecological, or life history criteria. When such traditionally delimited species are examined using molecular data, in some cases deeply divergent lineages have been identified within species showing little or no phenotypic variation [4]; in other cases the reverse is true – phenotypically divergent populations appear to form a single gene pool [5]. In plant systems in particular, different individuals or populations may appear phenotypically diverged due to phenotypic plasticity or local adaptation, while still experiencing high levels of gene flow and little genetic differentiation throughout most of the genome [68].
The annual sunflower Helianthus neglectus has a restricted distribution on sand dunes in southwestern Texas and southeastern New Mexico. Helianthus neglectus is phenotypically very similar to its much more widespread sister species, the prairie sunflower, H. petiolaris, which is found throughout much of the Great Plains and western United States. There are limited morphological differences, including some differentiation in head size as well as leaf size and structure. The two species also display edaphic differences, with H. neglectus limited to deep sand dunes, while H. petiolaris is most commonly found in sandy soils, but not exclusively so [9]. While H. neglectus has a much more restricted range and generally occurs in less stable, more sandy soils, the species’ habitats can often be found adjacent to each other without a clear geographic barrier separating the ranges. Natural hybrids between the two species are not uncommon where their ranges overlap [9,10], although the degree to which introgression occurs between them remains unexamined.
Previous cytological and molecular research has confirmed a close relationship between the two species. Allozyme and restriction fragment analysis suggests that the H. neglectus gene pool consists largely of a subset of H. petiolaris alleles [11]. The two species differ by one or two reciprocal translocations that create a chromosomal sterility barrier to some degree [12,13]. However, they display F1 pollen viability levels of 75–80%–substantially higher than almost all other annual sunflower interspecies crosses [12,13], and not much lower than some intraspecific crosses [14]. Although classified as distinct species, in his initial description of H. neglectus, Heiser [13] described the decision of whether or not H. neglectus should be considered a distinct species or a subspecies of H. petiolaris as “somewhat arbitrary”.
Relationships between H. neglectus and H. petiolaris have not been addressed in detail for two decades [15], during which time the increased availability of multi-locus sequence datasets and methodological advances have made much more precise demographic inferences possible. In this study, we examine the patterns of genetic diversity and divergence in these two species using sequence data from nine loci derived from an expressed sequence tag (EST) database for various Helianthus species. We find that the two species harbor comparable levels of genetic diversity—far more diversity in H. neglectus than is generally realistic for an isolated species of its limited geographic distribution and population size—and display virtually no genetic divergence. In addition, estimates of gene flow between the two species are similar to estimates among geographic regions within H. petiolaris, and the overall geographic distribution of genetic variation in both species together reflects a pattern of isolation by distance in a single large gene pool, rather than one of two distinct gene pools. We consider these results in the context of distributional differences between these two species as well as their species status.

2. Results and Discussion

2.1. Genetic Diversity and Differentiation

Sequence data from nine nuclear loci was obtained through direct sequencing and molecular cloning techniques. Overall aligned sequence length ranged from 454 to 1,326 bp, with an average size of 725 bp (6,525 bp total). Basic summary statistics are given in Table 1. Average per-bp silent π and θ values, respectively, were 0.036 and 0.051 for H. petiolaris, and 0.041 and 0.048 for H. neglectus. The large majority of the genetic variation is distributed within species with very little divergence between species, as indicated by the average net divergence across loci, which was 0.14% (range 0–0.46%). A summary of the four types of substitutions described in Wakeley and Hey [16] are given in Table 2. These substitutions are the number of sites polymorphic in each species, in both species, and the number of differences that are fixed between species. The degree of variation within each species is again showcased using these statistics, with an average of 45 and 23 polymorphisms unique to H. petiolaris and H. neglectus, respectively (based on pairwise sequence diversity levels within each species, the difference between species in the number of unique polymorphisms reflects sample size differences rather than overall genetic diversity differences). Surprisingly, none of the 847 polymorphisms in the overall dataset is distributed as a fixed difference between H. petiolaris and H. neglectus.
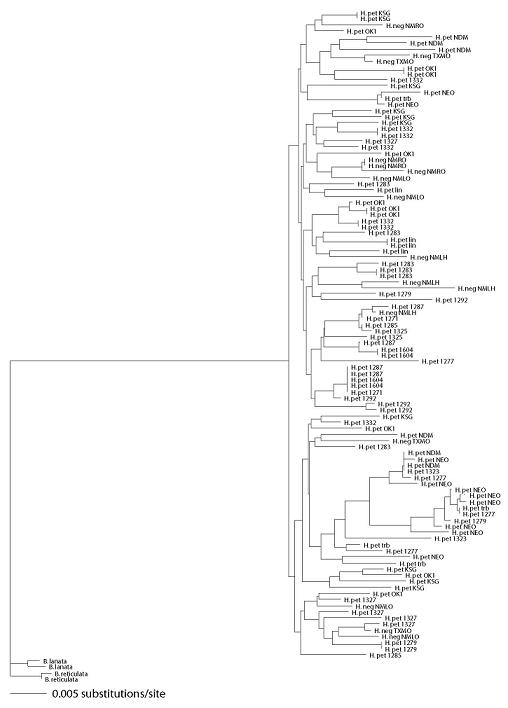
In AMOVAs, an average of 70.7% of variation was found within regions (P values for all nine loci <0.0001), compared to 25.9% variation found among regions (P values across loci range from <0.0001 to 0.0031) within species and 3.4% variation found between species (P values range across loci from 0.001 to 0.504; three of nine loci significant at the 0.05 level). In neighbor joining trees using Bahiopsis lanata and B. reticulata as outgroups, H. petiolaris and H. neglectus haplotypes had a polyphyletic relationship at all nine loci. Neighbor joining trees and 50% majority-rule bootstrap consensus neighbor joining trees for all nine loci are given in Supplementary File S1.
Results for Tajima’s D and Fu’s Fs tests are given in Table 3. In H. petiolaris, two loci were significantly negative using Tajima’s test, and all nine loci were significant using Fu’s test. The number of significant results for Tajima and Fu’s tests decreased to zero and eight, respectively, after Bonferroni correction. For H. neglectus, no loci were significant for Tajima’s test, but seven loci were significant for Fu’s test (four after Bonferroni correction). Fs is considered more sensitive to population size change, with negative values indicating population growth, while D is considered more sensitive to selection [17]. Given that, our results are most consistent with selective neutrality at all loci and population growth in both species. HKA tests were not significant across all loci, also indicating selective neutrality.
Mantel tests were performed on H. petiolaris populations and on all populations of both species together. Correlations between geographic and genetic distance averaged across loci are very low and non-significant both for H. petiolaris individually and for both species together (0.004 and 0.028, respectively). No individual locus shows a significant positive correlation for H. petiolaris individually, and a single locus, JLS2899, is significant for both species together.

2.2. Effective Population Sizes and Gene Flow Rates

Estimates of effective population sizes and long-term gene flow rates made using MIGRATE are given in Tables 4 and 5, respectively. Modal population size estimates for the three H. petiolaris regions range from 240,000 to 640,000. In contrast, the modal population size estimate for H. neglectus is roughly 2.3 million; the low end of the 95% confidence interval is close to one million. This estimate is somewhat smaller than a previous estimate of the H. petiolaris species-wide effective size [18], but it is still far larger than would be expected for an isolated species with the geographic range and census size of H. neglectus.
Likewise, gene flow estimates are not consistent with increased isolation between H. neglectus and H. petiolaris relative to isolation among regions within H. petiolaris. Modal gene flow estimates are Nem = 0.01 (the smallest value possible based on bin size), although confidence intervals are quite wide, with a lower bound of zero in all cases and upper bounds ranging from 3.8 to 5.5. Posterior distributions of gene flow estimates between H. neglectus and various H. petiolaris groups are broadly overlapping with posteriors for gene flow within H. petiolaris. When the six gene flow estimates involving H. neglectus are compared to the six estimates within H. petiolaris, the former have slightly higher average confidence interval upper bounds (4.57 vs. 4.29), median values (1.55 vs. 1.49) and mean values (0.96 vs. 0.78). In addition, although the confidence intervals are broadly overlapping, confidence interval upper bounds, median values, and mean values are slightly higher for interspecific comparisons involving the sympatric H. petiolaris region vs. interspecific comparisons involving the allopatric (eastern and western) H. petiolaris regions. This pattern is expected if the two species are exchanging genes in sympatry.

2.3. Species Status of H. neglectus

Defining distinct species has long been a goal of evolutionary biologists as well as natural historians. Although a modern consensus definition of a species is still a topic of debate [19,20], operational methods of identifying species have historically utilized morphological or ecological traits in addition to crossing data. Investigators have incorporated cytological and molecular data as it has become available, and the value of examining multiple sources of data is generally recognized [1,21,22]. On occasion, the addition of molecular data has led to substantial reevaluation of species boundaries and relationships [e.g., 23,24].
Population genetic theory predicts that species with restricted ranges (and presumably concomitant small population sizes) should have less genetic variation than their widespread counterparts. This is expected mainly due to the increased importance of genetic drift in small populations [25]. When comparing the narrowly distributed sunflower species H. neglectus with its widespread sister species H. petiolaris, we do not observe this pattern at any of the nine loci examined here. Because of the vast differences in species’ ranges and census population sizes, we expected far more genetic variation in H. petiolaris. However, levels of genetic variation in H. neglectus were comparable to (and in some cases higher than) those in H. petiolaris. In addition we found very little genetic divergence between the two species, as well as comparable levels of interspecific and intraspecific gene flow.
Three possible scenarios may explain the surprisingly high levels of genetic variation in H. neglectus. If H. neglectus is the product of a recent split from the more widespread H. petiolaris and H. neglectus populations are currently still undergoing lineage sorting, polyphyletic relationships among species may be expected. However given the restricted range of H. neglectus it is unlikely that the species would be able to sustain such high levels of variation that are observed for a significant length of time. Similarly, if H. neglectus was much more widespread than it is at present, high levels of variation may still be found in the much smaller species range. However, there is no evidence that this is the case. The values of Fu’s Fs and Tajima’s D presented here are more consistent with recent H. neglectus population growth rather than decline, making this scenario unlikely as well.
A more plausible explanation for the observed pattern is high levels of ongoing gene flow between the two nominal species. In his initial description of H. neglectus, Heiser [13] reported artificial hybrids with varying degrees of fertility (measured by pollen staining viability of 9–80%). In addition, apparent hybrids are not uncommon in areas of range overlap [9,10]. A previous study examining pollen viability in hybrids between H. annuus and H. petiolaris show drastically lower levels of viability [average 4.8%–26]. Despite these low F1 pollen viability levels, recent studies have shown evidence of long-term, ongoing introgression between H. annuus and H. petiolaris in both directions [18,27]. Given the relatively higher F1 pollen viabilities between H. neglectus and H. petiolaris, pollen sterility is unlikely to prevent significant introgression in sympatry.
Our modal gene flow estimates from MIGRATE among all regions in both species are surprisingly low, although confidence intervals are very broad and encompass very high gene flow levels as well (Table 5). These results are inconsistent with higher estimates of gene flow within H. petiolaris (Nem ∼ 1) previously reported [2830]. The Bayesian implementation of MIGRATE can have a downward bias in gene flow estimates for a wide range of θ values, including the range of values estimated here [31]; this may explain the discrepancy we see between estimates made using the different methods. However, we see no obvious reason why intraspecific estimates would be more strongly biased than interspecific estimates, so we do not expect the relative levels of interspecific vs. intraspecific gene flow to be affected. The Bayesian implementation of MIGRATE estimates effective sizes well [substantially better than the maximum likelihood implementation–31], suggesting that our estimate of H. neglectus’ effective size is reliable; as mentioned above this estimate is not consistent with an isolated species with a very small geographic range and census size, except under very unrealistic demographic conditions.
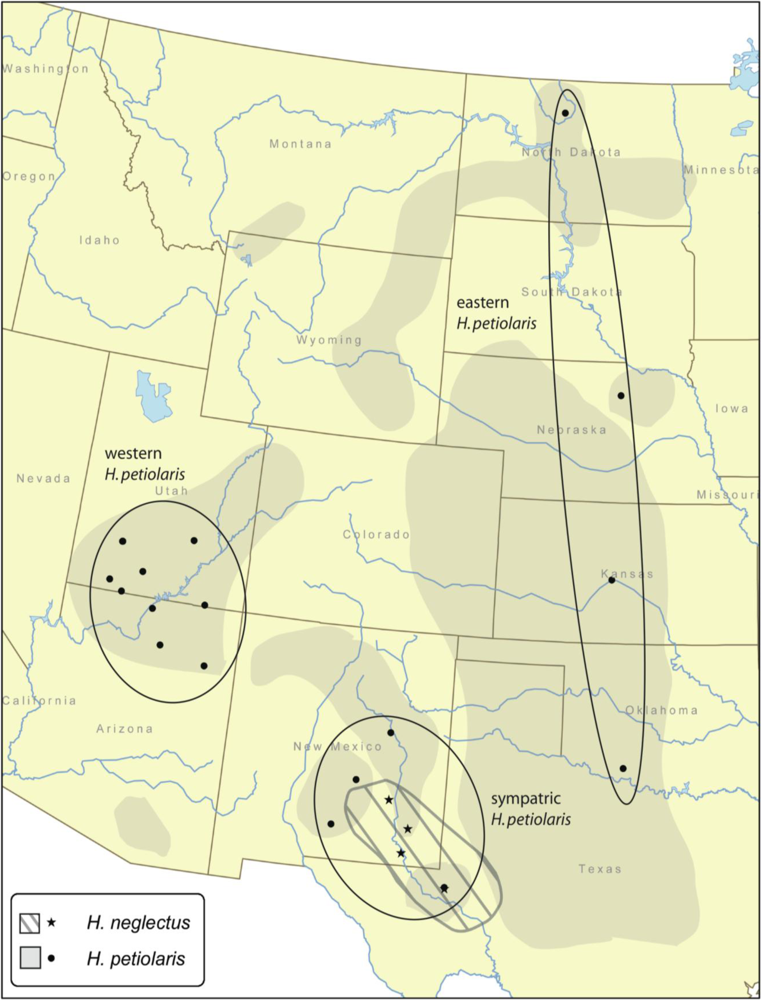
Within H. petiolaris there are two recognized subspecies, ssp. petiolaris and ssp. fallax [13], distinguished by some minor phenotypic differences as well as at least one chromosomal rearrangement; in addition, there is some cytological variation within ssp. petiolaris [32]. Generally, ssp. petiolaris is found throughout the Great Plains up to the Rocky Mountains, while ssp. fallax is found in the southwestern United States [9]; the range of H. neglectus overlaps or nearly overlaps with each H. petiolaris subspecies. Crosses between cytological races of H. petiolaris show varying degrees of fertility loss relative to crosses within races [32]; interestingly, hybrids between H. neglectus and both subspecies of H. petiolaris show pollen viabilities within the range of variation seen in crosses between the H. petiolaris subspecies and cytological races [9,13,32].
Based on the comparable levels of genetic variation in both species and similar inter- and intraspecific gene flow and effective population size estimates from MIGRATE, the validity of H. neglectus’ distinctness as a species should be more closely examined. Both species examined show high levels of genetic variation, which is in accordance with previous studies of Helianthus species [18]. Such high levels of variation in an endemic species may not be surprising only under a restrictive set of demographic assumptions (see above). Evidence for severe population size decline or extraordinarily high levels of gene flow are not borne out in the results presented here. The lack of clear genetic divergence or geographic barriers and similar levels of estimated intra and interspecific gene flow between species suggests that the gene pool of both H. neglectus and H. petiolaris is most appropriately viewed as one large collection of alleles.
A number of studies [27,33,34] have recently shown that the genomes of the more distantly related H. petiolaris and H. annuus are highly permeable to gene flow, with large portions showing very little genetic divergence in the roughly two million years since the species’ initial divergence. Nonetheless, these two species remain morphologically and ecologically divergent through the action of multiple strong reproductive barriers. It is possible that a similar phenomenon is occurring here, although it is unlikely for several reasons. While there is some degree of reproductive isolation between H. neglectus and H. petiolaris due to chromosomal differentiation and possibly some genic factors, isolating barriers between these two species are far lower than barriers between H. petiolaris and H. annuus; in fact they are comparable to barriers between different chromosome races within H. petiolaris. Second, while rates of introgression between H. petiolaris and H. annuus appear to be exceptionally high for two distinct species, they are still considerably lower than levels of gene flow within either species. Third, H. neglectus and H. petiolaris are far more similar to each other morphologically, ecologically, and chromosomally than are H. petiolaris and H. annuus, which differ by a minimum of 11 large-scale rearrangements [35]. And fourth, both H. annuus and H. petiolaris are very widespread and have species-wide population census sizes well into the millions of individuals, consistent with their high levels of genetic diversity and large effective population sizes. In contrast, H. neglectus is limited to a very small range, and while its census size is not known precisely, it is probably under our estimated effective size of 2.3 million. While it is possible under certain conditions for effective size to be larger than census size [36], those conditions are not realistic in this case; the huge amount of genetic variation in H. neglectus is not consistent with any substantial degree of genetic isolation.

3. Experimental Section

3.1. Sampling and Molecular Methods

DNA samples of H. petiolaris were obtained from within the Rieseberg Lab from previous studies. Our sampling includes both subspecies of H. petiolaris, in roughly equal numbers (20 individuals from ssp. petiolaris, and 28 individuals from ssp. fallax). Achenes from H. neglectus were obtained from the United States Department of Agriculture Germplasm Resources Information Network and were germinated and grown in the Indiana University greenhouses. Sampling locality data for both species are given in Table 6 and Figure 1. Species identity of H. neglectus plants was verified morphologically by Charles Heiser (personal communication), who first described the species [13]. DNA was extracted from fresh leaf tissue using a DNeasy Plant Minikit (QIAGEN, Valencia, CA). DNA sequences from two species of the closely related genus Bahiopsis, formerly Viguiera [37], B. lanata and B. reticulata, were used as outgroups. Because most annual sunflowers have large effective population sizes, outgroups that are fairly distant genetically are required to ensure that character state is not confounded by shared ancestral polymorphism.
Nine genetic markers were chosen based on previous amplification success in a wide range of Helianthus species, including H. petiolaris. Primers for all markers were developed based on several Helianthus EST libraries ( http://compgenomics.ucdavis.edu/) and manufactured by Integrated DNA Technologies (USA). Primer sequences and PCR amplification profile conditions are available in Strasburg and Rieseberg [18]. The nine markers are located on seven separate linkage groups, and all nine are unlinked (data not shown). Unincorporated primers and dNTPs were removed from the PCR reaction using 1 μL ExoSAP-IT (USB) per 10 μL reaction. All PCR products were quantified on a 1.5% agarose gel using a low DNA mass ladder (Invitrogen, USA).
Sequencing reactions were resolved using an ABI3730 automated sequencer (Applied Biosystems, Foster City, California, USA). The sequence results were then trimmed and aligned by eye using the computer program Sequencher (Gene Codes). Individuals with multiple sites of length heterozygosity or multiple single nucleotide polymorphisms (SNPs) were resolved using TOPO-TA cloning kits (Invitrogen, USA), otherwise individuals heterozygous for a single indel were resolved by comparing forward and reverse sequences at variable sites. All H. neglectus sequences presented here are new, as are most H. petiolaris sequences at loci JLS1040, JLS1615, and JLS1747; other H. petiolaris sequences and all Bahiopsis sequences come from a previous study [18]. All sequences have been submitted to GenBank, and accession numbers are given in Supplementary File S2.

3.2. Data Analysis

Coding regions and reading frames for each locus were identified by comparing Helianthus genomic and EST sequences with genomic and coding sequences for the closest Arabidopsis BLAST hit. For two loci, coding regions and reading frames could not be identified; these loci were considered to be noncoding.
Nucleotide diversity (π) using the Jukes-Cantor [38] correction and Watterson’s θ [39] were estimated using DnaSP version 4.50.3 [40]. Gross and net sequence divergence between H. petiolaris and H. neglectus were calculated in SITES [41]. Net divergence is equal to gross divergence minus average diversity within each species. The four categories of segregating sites described in Wakeley and Hey [16] were also summarized in SITES. Neighbor joining trees were constructed in PAUP 4.0b10 [42] to estimate relationships among haplotypes. AMOVAs were performed using Arlequin version 3.11 [43]. For these analyses, three regions were defined in H. petiolaris based on geography and breaks in sampling (see Table 6 and Figure 1). Due to the very limited geographic range of H. neglectus, all populations in this species were grouped together. Standard interpretations of AMOVA assume selective neutrality and random mating within populations; neither of these assumptions is likely to be violated in our data, as indicated by the results of Fu’s and Tajima’s tests (see results), and the fact that both species are obligate outcrossers with typically large population census sizes. Mantel tests of correlation between geographic and genetic distance between populations were performed in Arlequin, with 10,000 permutations performed to assess significance. Geographic distance matrices were calculated from latitude/longitude data using the program Passage ( http://www.passagesoftware.net/).
To assess whether selection has affected the loci examined and also to test for past population expansion, Fu’s [17] and Tajima’s [44] tests of neutrality were performed using 1,000 simulations in Arlequin. These tests compare two different measures of genetic variation that are expected to be equal under conditions of selective neutrality and long-term demographic stability; significant differences between these two measures may be attributable to the effects of natural selection or population size changes. Fu’s test has been shown to be much more sensitive in detecting population growth than Tajima’s [17].
In addition to Fu’s and Tajima’s tests, the Hudson-Kreitman-Aguade (HKA) test [45] was used to test for neutrality. The HKA test compares the frequency of polymorphisms within species to differences between species to examine patterns of selection. This test examines the frequency of occurrence of both synonymous and non-synonymous substitutions across loci sampled. If selective constraints are the same across loci, ratios of intraspecific polymorphisms to interspecific differences should be the same across loci; in contrast, variable patterns of selection across loci may result in variation in polymorphism: divergence ratios. This test assumes selective neutrality, independence among loci, no recombination within loci, and constant population size in each species. Our data likely violate the latter two assumptions to some degree; the recombination assumption is a conservative one, but the degree to which the test is robust to population size changes is not well understood [46]. HKA tests were performed using the program HKA (available at http://lifesci.rutgers.edu/~heylab/HeylabSoftware.htm#HKA) with 10,000 coalescent simulations to assess significance.
Estimates of long-term inbreeding effective population sizes and rates of gene flow among regions were made under a Bayesian inference framework using the program MIGRATE [31,47]. Geographic regions were the same as those used in AMOVAs. Uniform priors were used for all parameters, and three independent runs were performed to verify convergence. All runs involved five independent chains, and 2.5 million steps were recorded following a burn-in of 10,000 steps, with a sampling increment of 20 steps. All effective sample sizes were at least 17,000 (most were several hundred thousand or higher). To calculate demographic quantities from MIGRATE parameter estimates, we used a per site, per year silent substitution rate of 1 × 10⁻⁸ (MS Barker and LH Rieseberg, unpublished manuscript), and a one year generation time. The model implemented in MIGRATE assumes no recombination within loci. We used DnaSP version 4.50.3 to infer apparently non-recombining blocks of sequences based on the algorithm of Hudson and Kaplan [48], and the largest non-recombining block was used in the MIGRATE analyses. MIGRATE also assumes independence among loci and selective neutrality, both of which are consistent with our data. We chose MIGRATE rather than another popular program for estimating effective sizes and gene flow rates, IMa [49], because the current implementation of IMa is limited to two populations, and we were interested in measuring gene flow among multiple regions within the two species. Likewise, we did not use the newest version of IMa, IMa2 [50], which allows more than two populations, because it requires that the tree topology for the populations or species being analyzed be known, which is not the case here.

4. Conclusions

In spite of their strong genetic similarity, H. neglectus and H. petiolaris are clearly to some extent phenotypically and ecologically distinct. In describing H. neglectus and comparing it to its nominal sister species, Heiser [13] considered its status as a separate species or subspecies of H. petiolaris to be “rather arbitrary,” because the differences between H. neglectus and H. petiolaris appear to be similar in degree and kind to the differences between different H. petiolaris subspecies. With the additional genetic data we have presented here, H. neglectus’ comparability to currently recognized H. petiolaris subspecies appears even stronger. While more genetic data would certainly be useful in clarifying genomic patterns of introgression and identifying any genic or structural factors that may contribute to local adaptation or reproductive isolation, based on the available data the populations currently recognized as H. neglectus do not appear to warrant recognition as a distinct species.

Acknowledgments

We would like to thank members of the Rieseberg lab for helpful discussions and technical advice. We would also like to thank Alan Templeton for inviting us to contribute to this special issue. This work was supported by a HHMI Capstone Program Award to A.R.R., a NIH Ruth L. Kirschstein Postdoctoral Fellowship (5F32GM072409-02) to J.L.S., and NSERC (327475) and NSF (0820451) grants to L.H.R.

References and Notes

  1. De Queiroz, K. Species concepts and species delimitation. Syst. Biol 2007, 56, 879–886. [Google Scholar]
  2. Wiens, JJ; Penkrot, TA. Delimiting species using DNA and morphological variation and discordant species limits in spiny lizards (Sceloporus). Syst. Biol 2002, 51, 69–91. [Google Scholar]
  3. Young, ND. Pacific Coast Iris species delimitation using three species definitions: Biological, phylogenetic and genealogical. Biol. J. Linn. Soc 1998, 63, 99–120. [Google Scholar]
  4. Highton, R. Speciation in eastern North American salamanders of the genus Plethodon. Annu. Rev. Ecol. Syst 1995, 26, 579–600. [Google Scholar]
  5. Marthinsen, G; Wennerberg, L; Lifjeld, JT. Low support for separate species within the redpoll complex (Carduelis flammea-hornemanni-cabaret) from analyses of mtDNA and microsatellite markers. Mol. Phylogenet. Evol 2008, 47, 1005–1017. [Google Scholar]
  6. Becker, U; Dostal, P; Jorritsma-Wienk, LD; Matthies, D. The spatial scale of adaptive population differentiation in a wide-spread, well-dispersed plant species. Oikos 2008, 117, 1865–1873. [Google Scholar]
  7. Crispo, E. Modifying effects of phenotypic plasticity on interactions among natural selection, adaptation and gene flow. J. Evol. Biol 2008, 21, 1460–1469. [Google Scholar]
  8. Helsen, P; Browne, RA; Anderson, DJ; Verdyck, P; Dongen, S. Galapagos' Opuntia (prickly pear) cacti: extensive morphological diversity, low genetic variability. Biol. J. Linn. Soc 2009, 96, 451–461. [Google Scholar]
  9. Heiser, CB; Smith, DM; Clevenger, S; Martin, WC. The North American sunflowers (Helianthus). Mem. Torrey Bot. Club 1969, 22, 1–218. [Google Scholar]
  10. Rogers, CE; Thompson, TE; Seiler, GJ. Sunflower Species of the United States; National Sunflower Association: Bismarck, ND, USA, 1982; p. 75. [Google Scholar]
  11. Rieseberg, LH; Carter, R; Zona, S. Molecular tests of the hypothesized hybrid origin of two diploid Helianthus species (Asteraceae). Evolution 1990, 44, 1498–1511. [Google Scholar]
  12. Chandler, JM; Jan, C-C; Beard, BH. Chromosomal differentiation among the annual Helianthus species. Syst. Bot 1986, 11, 354–371. [Google Scholar]
  13. Heiser, CB. Three new annual sunflowers (Helianthus) from the southwestern United States. Rhodora 1958, 60, 272–283. [Google Scholar]
  14. Rieseberg, LH. Crossing relationships among ancient and experimental sunflower hybrid lineages. Evolution 2000, 54, 859–865. [Google Scholar]
  15. Rieseberg, LH; Carter, R; Zona, S. Molecular tests of the hypothesized hybrid origin of 2 diploid Helianthus species (Asteraceae). Evolution 1990, 44, 1498–1511. [Google Scholar]
  16. Wakeley, J; Hey, J. Estimating ancestral population parameters. Genetics 1997, 145, 847–855. [Google Scholar]
  17. Fu, YX. Statistical tests of neutrality of mutations against population growth, hitchhiking and background selection. Genetics 1997, 147, 915–925. [Google Scholar]
  18. Strasburg, JL; Rieseberg, LH. Molecular demographic history of the annual sunflowers Helianthus annuus and H. petiolaris – large effective population sizes and rates of long-term gene flow. Evolution 2008, 62, 1936–1950. [Google Scholar]
  19. Howard, DJ; Berlocher, SH. Endless Forms: Species and Speciation; Oxford University Press: New York, NY, USA, 1998; p. 470. [Google Scholar]
  20. Coyne, JA; Orr, HA. Speciation; Sinauer Associates: Sunderland, MA, USA, 2004. [Google Scholar]
  21. Templeton, AR. Using phylogeographic analyses of gene trees to test species status and processes. Mol. Ecol 2001, 10, 779–791. [Google Scholar]
  22. Alstrom, P; Rasmussen, PC; Olsson, U; Sundberg, P. Species delimitation based on multiple criteria: the spotted bush warbler Bradypterus thoracicus complex (Aves: Megaluridae). Zool. J. Linn. Soc 2008, 154, 291–307. [Google Scholar]
  23. Garcia-Paris, M; Buchholz, DR; Parra-Olea, G. Phylogenetic relationships of Pelobatoidea re-examined using mtDNA. Mol. Phylogenet. Evol 2003, 28, 12–23. [Google Scholar]
  24. Pfeil, BE; Brubaker, CL; Craven, LA; Crisp, MD. Phylogeny of Hibiscus and the tribe Hibisceae (Malvaceae) using chloroplast DNA sequences of ndhF and the rpl16 intron. Syst. Bot 2002, 27, 333–350. [Google Scholar]
  25. Cole, CT. Genetic variation in rare and common plants. Annu. Rev. Ecol. Evol. Syst 2003, 34, 213–237. [Google Scholar]
  26. Buerkle, CA; Morris, RJ; Asmussen, MA; Rieseberg, LH. The likelihood of homoploid hybrid speciation. Heredity 2000, 84, 441–451. [Google Scholar]
  27. Kane, NC; King, MG; Barker, MS; Raduski, A; Karrenberg, S; Yatabe, Y; Knapp, SJ; Rieseberg, LH. Comparative genomic and population genetic analyses indicate highly porous genomes and high levels of gene flow between divergent Helianthus species. Evolution 2009, 63, 2061–2075. [Google Scholar]
  28. Schwarzbach, AE; Rieseberg, LH. Likely multiple origins of a diploid hybrid sunflower species. Mol. Ecol 2002, 11, 1703–1715. [Google Scholar]
  29. Gross, BL; Schwarzbach, AE; Rieseberg, LH. Origin(s) of the diploid hybrid species Helianthus deserticola (Asteraceae). Am. J. Bot 2003, 90, 1708–1719. [Google Scholar]
  30. Welch, ME; Rieseberg, LH. Patterns of genetic variation suggest a single, ancient origin for the diploid hybrid species Helianthus paradoxus. Evolution 2002, 56, 2126–2137. [Google Scholar]
  31. Beerli, P. Comparison of Bayesian and maximum-likelihood inference of population genetic parameters. Bioinformatics 2006, 22, 341–345. [Google Scholar]
  32. Heiser, CB. Morphological and cytological variation in Helianthus petiolaris with notes on related species. Evolution 1961, 15, 247–258. [Google Scholar]
  33. Yatabe, Y; Kane, NC; Scotti-Saintagne, C; Rieseberg, LH. Rampant gene exchange across a strong reproductive barrier between the annual sunflowers, Helianthus annuus and H. petiolaris. Genetics 2007, 175, 1883–1893. [Google Scholar]
  34. Strasburg, JL; Scotti-Saintagne, C; Scotti, I; Lai, Z; Rieseberg, LH. Genomic patterns of adaptive divergence between chromosomally differentiated sunflower species. Mol. Biol. Evol 2009, 26, 1341–1355. [Google Scholar]
  35. Burke, JM; Lai, Z; Salmaso, M; Nakazato, T; Tang, SX; Heesacker, A; Knapp, SJ; Rieseberg, LH. Comparative mapping and rapid karyotypic evolution in the genus Helianthus. Genetics 2004, 167, 449–457. [Google Scholar]
  36. Templeton, AR. Population Genetics and Microevolutionary Theory; Wiley-Liss: Hoboken, NJ, USA, 2006. [Google Scholar]
  37. Schilling, EE; Paner, JL. A revised classification of subtribe Helianthinae (Asteraceae: Heliantheae). I. Basal lineages. Bot. J. Linn. Soc 2002, 140, 65–76. [Google Scholar]
  38. Jukes, TH; Cantor, CR. Evolution of protein molecules. In Mammalian Protein Metabolism; Munro, HN, Ed.; Academic Press: New York, NY, USA, 1969; pp. 21–132. [Google Scholar]
  39. Watterson, GA. On the number of segregating sites in genetical models without recombination. Theor. Popul. Biol 1975, 7, 256–276. [Google Scholar]
  40. Rozas, J; Sanchez-DelBarrio, JC; Messeguer, X; Rozas, R. DnaSP, DNA polymorphism analyses by the coalescent and other methods. Bioinformatics 2003, 19, 2496–2497. [Google Scholar]
  41. Hey, J; Wakeley, J. A coalescent estimator of the population recombination rate. Genetics 1997, 145, 833–846. [Google Scholar]
  42. Swofford, DL. PAUP* Phylogenetic Analysis Using Parsimony (*and Other Methods); , Beta Version 40b2; Sinauer: Sunderland, MA, USA, 1999. [Google Scholar]
  43. Excoffier, LGL; Schneider, S. Arlequin ver. 3.0: An Integrated software package for population genetics data analysis. Evol. Bioinf. Online 2005, 1, 47–50. [Google Scholar]
  44. Tajima, F. Statistical method for testing the neutral mutation hypothesis by DNA polymorphism. Genetics 1989, 123, 585–595. [Google Scholar]
  45. Hudson, RR; Kreitman, M; Aguade, M. A test of neutral molecular evolution based on nucleotide data. Genetics 1987, 116, 153–159. [Google Scholar]
  46. Wright, SI; Charlesworth, B. The HKA test revisited: A maximum-likelihood-ratio test of the standard neutral model. Genetics 2004, 168, 1071–1076. [Google Scholar]
  47. Beerli, P. Migrate version 3.0–A Maximum Likelihood and Bayesian Estimator of Gene Flow Using the Coalescent. 2008.
  48. Hudson, RR; Kaplan, NL. Statistical properties of the number of recombination events in the history of a sample of DNA sequences. Genetics 1985, 111, 147–164. [Google Scholar]
  49. Hey, J; Nielsen, R. Integration within the Felsenstein equation for improved Markov chain Monte Carlo methods in population genetics. Proc. Natl. Acad. Sci. USA 2007, 104, 2785–2790. [Google Scholar]
  50. Hey, J. Isolation with migreation models for more than two populations. Mol Biol Evol 2009. [Google Scholar]
Figure 1. Sampling localities for H. petiolaris and H. neglectus individuals used in this study. Respective ranges are denoted with shading. Solid ovals encircle H petiolaris population groups used in AMOVA and MIGRATE analyses. Latitude, longitude and sample sizes are given in Table 6.
Ijms 11 00492f1
Table 1. General information and summary statistics for all nine loci. π and θ values are per base pair.
H. petiolarisH. neglectus

LocusLinkage groupAligned size (bp)Protein homology (based on closest Arabidopsis thaliana BLAST hit)No. of seqs.π (silent)θ (silent)No. of seqs.π (silent)θ (silent)% Gross divergence% Net divergence
(2213)6688Scarecrow transcription factor family protein320.0190.024160.0170.0222.660.46
JLS2449571Proton-dependent oligopeptide transport (POT) family protein300.0240.036160.0300.0371.760.12
JLS720a16687Cellulose synthase-related protein320.0280.03720.0400.0391.930.00
JLS810R1131326Auxin efflux carrier protein family320.0530.039160.0630.0584.430.37
JLS104010659Serine/threonine phosphatase960.0460.063160.0450.0622.430.07
JLS161514575Unknown protein960.0440.082160.0510.0601.140.06
JLS1747R217789Amino acid permease family protein900.0620.093160.0610.0762.470.04
JLS195317454Galacturonosyltransferase 4320.0160.024160.0080.0111.190.05
JLS289914776Unknown protein320.0320.057160.0520.0671.480.04
Average7250.0360.0510.0410.0482.170.14
Table 2. Summary of four types of segregating sites found within or between species (see Wakeley and Hey [16]).
LocusPolymorphic in H. petiolaris onlyPolymorphic in H. neglectus onlyPolymorphic in both speciesFixed differences between species
(2213)3330150
JLS2442422130
JLS720a408100
JLS810R12744390
JLS10407936370
JLS1615478190
JLS1747R29829560
JLS195332590
JLS28993028290
Overall4102102270
Table 3. Results of Tajima’s (D) and Fu’s (Fs) tests of neutrality, with significance assessed based on 1000 simulations using Arlequin. Significant results are presented in bold; tests marked with asterisks are significant after Bonferroni correction. Tajima’s D and Fu’s Fs were not calculated for locus JLS720a in H. neglectus, as only two haplotypes were sampled.
H. petiolarisH. neglectus
Tajima’s DFu’s FsTajima’s DFu’s Fs
LocusDp valueFsp valueDp valueFsp value
(2213)−0.4910.353−14.547<0.001*−0.7380.234−2.9180.052
JLS244−0.8570.214−24.231<0.001*−0.8930.218−9.227<0.001*
JLS720a−1.0080.166−23.772<0.001*N/AN/AN/AN/A
JLS810R11.4230.952−6.959<0.0080.3440.702−5.9050.006
JLS1040−1.2790.070−23.957<0.001*−1.1960.118−3.9410.039
JLS1615−1.7210.017−25.183<0.001*−0.9320.196−11.118<0.001*
JLS1747R2−1.2090.105−23.9900.001*−1.1970.110−3.9220.029
JLS1953−1.3260.074−24.396<0.001*−0.8780.205−6.5120.005*
JLS2899−1.6980.029−24.103<0.001*−1.0140.161−6.5860.005*
Table 4. Effective population size estimates (modes and 95% confidence intervals) made using MIGRATE. Regions within H. petiolaris are shown in Figure 1. These biological quantities were calculated from MIGRATE parameter estimates as described in the methods.
PopulationMode2.5%97.5%
Eastern H. petiolaris2.42 × 10504.87 × 105
Western H. petiolaris2.92 × 1054.74 × 1045.33 × 105
Sympatric H. petiolaris6.42 × 1051.51 × 1051.97 × 106
H. neglectus2.29 × 1068.45 × 1059.20 × 106
Table 5. Gene flow (Nem) estimates made using MIGRATE. Receiving region is listed across the top of the table, and source region is listed down the left side. Values in parentheses are 95% confidence intervals. Regions within H. petiolaris are shown in Figure 1. EP = eastern H. petiolaris populations; WP = western H. petiolaris populations; SP = H. petiolaris populations sympatric with H. neglectus; NE = H. neglectus populations. These biological quantities were calculated from MIGRATE parameter estimates as described in the methods.
Gene Flow (Nem)into EPinto WPinto SPinto NE
from EP-0.01 (0–3.80)0.01 (0–4.98)0.01 (0–5.08)
from WP0.01 (0–3.80)-0.01 (0–5.50)0.01 (0–4.83)
from SP0.01 (0–3.88)0.01 (0–3.78)-0.01 (0–5.13)
from NE0.01 (0–3.90)0.01 (0–3.78)0.01 (0–4.70)-
Table 6. Sampling localities. Geographic sites are shown in Figure 1. Population superscripts refer to AMOVA and MIGRATE groupings (1 = eastern H. petiolaris populations, 2 = western H. petiolaris populations, 3 = H. petiolaris populations sympatric with H. neglectus, 4 = H. neglectus populations).
SpeciesPopulationLocationLatitude (N)Longitude (W)No. of individuals
H. petiolarisKSG1Great Bend, KS38.3698.765
NDM1Minot, ND48.30100.715
NEO1O’Neill, NE42.2998.635
OK11Cotton Co., OK34.3398.405
Pet_12832Coconino Co., AZ36.04111.193
Pet_12872Kane Co., UT37.24112.862
Pet_16042Kane Co., UT37.03112.482
Pet_12772Coconino Co., AZ36.78111.552
Pet_12792Navajo Co., AZ35.75109.912
Pet_12922Hanksville, UT38.35110.692
Pet_12852Kane Co., UT37.52111.981
Pet_13232San Juan Co., UT37.03110.131
Pet_12712Iron Co., UT38.08112.691
Pet_13252Iron Co., UT38.08112.681
Pet_13273Puerto de Luna, NM34.82104.633
Pet_13323Monahans, TX31.62102.904
Pet_lin3Lincoln Co., NM33.95105.412
Pet_trb3Tularosa Basin, NM32.90105.962
H. neglectusNMRO4Roswell, NM33.40104.532
NMLO4Loving, NM32.29104.092
NMLH4Loco Hills, NM32.82103.972
TXMO4Monahans, TX31.60102.892

