Article

A Quantitative Structure-Property Relationship (QSPR) Study of Aliphatic Alcohols by the Method of Dividing the Molecular Structure into Substructure

1
School of Chemistry and Chemical Engineering, Hunan University of Science and Technology, Xiangtan, Hunan 411201, China
2
Key Laboratory of Theoretical Chemistry and Molecular Simulation of Ministry of Education, Hunan University of Science and Technology, Xiangtan, Hunan 411201, China
*
Author to whom correspondence should be addressed.
Int. J. Mol. Sci. 2011, 12(4), 2448-2462; https://doi.org/10.3390/ijms12042448
Submission received: 5 February 2011 / Revised: 24 March 2011 / Accepted: 6 April 2011 / Published: 7 April 2011
(This article belongs to the Section Physical Chemistry, Theoretical and Computational Chemistry)

Abstract

:
A quantitative structure–property relationship (QSPR) analysis of aliphatic alcohols is presented. Four physicochemical properties were studied: boiling point (BP), n-octanol–water partition coefficient (lg POW), water solubility (lg W) and the chromatographic retention indices (RI) on different polar stationary phases. In order to investigate the quantitative structure–property relationship of aliphatic alcohols, the molecular structure ROH is divided into two parts, R and OH to generate structural parameter. It was proposed that the property is affected by three main factors for aliphatic alcohols, alkyl group R, substituted group OH, and interaction between R and OH. On the basis of the polarizability effect index (PEI), previously developed by Cao, the novel molecular polarizability effect index (MPEI) combined with odd-even index (OEI), the sum eigenvalues of bond-connecting matrix (SX1CH) previously developed in our team, were used to predict the property of aliphatic alcohols. The sets of molecular descriptors were derived directly from the structure of the compounds based on graph theory. QSPR models were generated using only calculated descriptors and multiple linear regression techniques. These QSPR models showed high values of multiple correlation coefficient (R > 0.99) and Fisher-ratio statistics. The leave-one-out cross-validation demonstrated the final models to be statistically significant and reliable.

1. Introduction

Quantitative structure–property relationships (QSPR) remain the focus of many studies aimed at the modeling and prediction of physicochemical and biological properties of molecules. A powerful tool to help in this task is chemometrics, which uses statistical and mathematical methods to extract maximum information from a data set.
QSPR uses chemometric methods to describe how a given physicochemical property varies as a function of molecular descriptors describing the chemical structure of the molecule. Thus, it is possible to replace costly biological tests or experiments of a given physicochemical property (especially when involving hazardous and toxically risky materials or unstable compounds) with calculated descriptors, which can in turn be used to predict the responses of interest for new compounds. Chemometrics has provided new insight into the philosophy and theory behind QSPR modeling [1,2]. It has been used to estimate properties such as density, boiling point, solubility, n-octanol–water partition coefficient, Henry’s law constant and vapor pressure of chemicals. QSPR has received significant contributions from various research schools [38]. Various quantitative structure–property relationship (QSPR) models have been proposed for estimating the properties of a series of aliphatic alcohols [912].
The basic strategy of QSPR is to find an optimum quantitative relationship, which can be used for the prediction of the properties of compounds, including those unmeasured. It is obvious that the performance of QSPR model mostly depends on the parameters used to describe the molecular structure. Many efforts have been made to develop alternative molecular descriptors which can be derived using only the information encoded in the chemical structure. Much attention has been concentrated on “topological indices” derived from the connectivity and composition of a molecule which have made significant contributions in QSPR studies. Topological index has advantages of simplicity and quick speed of computation and so attracts the attention of scientists. Topological descriptors can explain most of the property modeled, as shown by some researchers [13].
In order to investigate the quantitative structure–property relationship of aliphatic alcohols, the molecular structure ROH is divided into two parts, R and OH to generate structural parameter. We proposed that the property is affected by three main factors for aliphatic alcohols, alkyl group R, substituted group OH, and interaction between R and OH. Due to the simplicity and efficiency of graph-theoretical approaches, our group recently introduced a set of novel topological indices to establish the quantitative relationships between the physicochemical properties and molecular structure for organic compounds [1417]. On the basis of the polarizability effect index (PEI) previously developed by Cao, the novel molecular polarizability effect index (MPEI) combined with odd-even index (OEI), the sum eigenvalues of bond-connecting matrix (SX1CH) previously developed in our team, were used to predict the property of aliphatic alcohols.
The main goal of the present study was to obtain QSPR models of the boiling point (BP), n-octanol–water partition coefficient (lg POW), water solubility (lg W) and the chromatographic retention indices (RI) for aliphatic alcohols using only calculated descriptors. At first, the generated numerical descriptors that encode structural information for the compounds in the data set were calculated. Then, multiple linear regression statistical analysis was used to build the QSPR models. In these models, no physical property parameter was used so that prediction could be carried out directly from molecular structure.

2. Methodology

The QSPR study of these aliphatic alcohols was performed in four fundamental stages: (1) Selection of data set; (2) generation of molecular descriptors; (3) multiple linear regression statistical analysis; and (4) model validation techniques. The descriptive power of the model was characterized by use of the statistical data multiple correlation coefficient (R), Fisher ratio (F), and standard derivation (s). Model applicability was further examined by plotting predicted data against experimental data for all the compounds.
All calculations were run on a Pentium IV personal computer with XP as operating system. Computation of the descriptors was performed using Matlab 6.5 programs. The Origin program packages were employed for regression analysis [18].

2.1. Data Set

Alcohols are toxic materials and thus represent dangerous environmental pollutants especially in the case when a mishap happens and accidentally large quantities of alcohols pollute the environment. Alcohols are also technologically important materials and are used in the manufacture of a large number of products. In this work, 58 aliphatic alcohols were studied. The corresponding experimental data (boiling points at 1 atm) were obtained from the literature [19]. The water solubility (lg W) and n-octanol/water partition coefficients (lg POW) of the alcohols were taken from the literature [20]. The data sets of the Kovats retention indices were taken from the literature [21]. Kovats retention indices of the molecules were obtained on six different stationary phases of low to medium polarity (SE-30, OV-3, OV-7, OV-11, OV-17 and OV-25). All of these data are in agreement with a standard source.

2.2. Definition of the Topological Indices

Descriptors encoding significant structural information are used to present the physicochemical characteristics of compounds to build the relationship between structure and property in this study. According to the basic factors that influence the property of the aliphatic alcohols, such molecular descriptors: the molecular polarizability effect index (MPEI) connecting to the polarizability of the molecule and the intramolecular action of the solute, the odd–even index (OEI) which reflects the size of the molecule and the connection of each atom, the sum eigenvalues of every H–C bond adjacency matrix(SX1CH) connecting to the property of the chemical bond, have been generated to build the QSPR model. The index OEI and SX1CH reflect the property of apolar R group and represent the R contribution to the physicochemical properties to be predicted. The MPEI index reflects the property of polar OH group and represents the OH contribution, and R/OH interaction contribution. A complete list of the compounds names and the calculated values of the molecular descriptors appearing in the QSPR models are summarized in Tables 3, 5 and 6.

2.2.1. The Odd–Even Index OEI

Odd–even index has been defined for the alkane molecule in our previous paper [14], which reflects the size of the molecule and the connection of each atom. The index is restated briefly as follows:
OEI  = i = 1 N j 1 N [ ( 1 ) D i j 1 S ]
where N is the number of vertices in molecular graph and S is the derivative matrix from distance matrix D. The elements of S are the squares of the reciprocal distances (Dij)−2, i.e., S = [ 1 / D i j 2 ] (when i = j, let 1 / D i j 2 = 0). Taking 3-hexanol as an example to illustrate the calculation of OEI: First, we convert the structure of the molecule into that of the corresponding hexane. Figure 1 shows the hydrogen-suppressed molecular graph of 3-hexanol, where the numbers are the random numberings of each vertex. Then, we use matrices D to represent Dij of the molecule.
According to Equation (1), OEI is computed as follows:
OEI  =  1 × 10 + [ 1 4 ] × 8 + [ 1 9 ] × 6 + [ 1 16 ] × 4 + [ 1 25 ] × 2 = 8.4967

2.2.2. The Molecular Polarizability Effect Index MPEI

In the preceding paper [16], the polarizability effect index (PEI) for alkyl groups of alkane molecules has been developed and calculated. It quantitatively indicates the relative proportion polarizability effect of the alkyl groups. The PEI values of some normal alkyls and the increments ΔPEI are listed in Table 1. As with aliphatic alcohols, the contribution of the property arising from relative proportion polarizability effect of alkyl groups is expressed as:
PEI  = [ ( Δ PEI) ]
where ΔPEI is the polarizability effect index increment of ith essential unit and can be directly taken from Table 1.
For the aliphatic alcohol molecules, the substituent R contains other atoms besides carbon and hydrogen, αi is no longer a constant and Equation (2) will not work well. It needs to be modified. Here, we use Equation (3) to evaluate the stabilizing energy caused by the polarizability effect for a substituent R:
E ( R ) = K m α i [ Δ PEI( R i ) ]
where Km = −q2/(2Dl4), αi is the polarizability (unit 10−24 cm3) of the ith atom in substituent R. Some atomi αi values are listed in Table 2. Because Km is a constant, this work only calculates the term Σαi (ΔPEI) of Equation (3). Take the sum of Σαi (ΔPEI) for all groups in a molecule as the molecular polarizability effect index (MPEI) and MPEI is expressed as [16]:
MPEI  = [ α i ( Δ PEI) ]
The molecule of 2-methyl-1-propanol is taken as an example to illustrate the calculation of the molecular polarizability effect index.
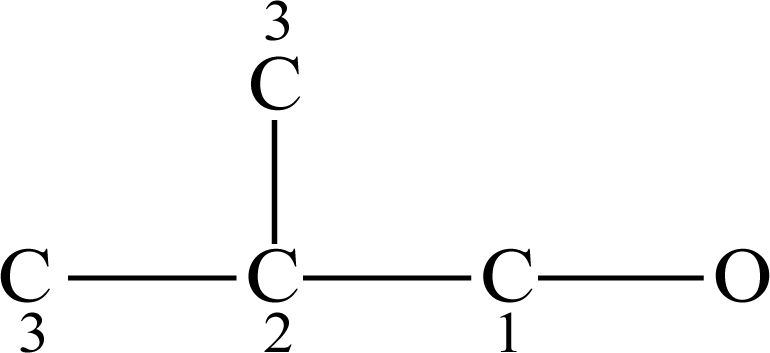
Figure 2 shows its hydrogen-suppressed molecular graph, where the numbers are the numberings of each carbon atom according to its distance to the hydroxide radical. Take the carbon atom connecting the hydroxide radical as the beginning to calculate the MPEI index as below:
MPEI = 1 .76  + (0 .802  +  0 .6668 × 2 +  1 .76) × 0 .140526  +  (0 .6668 × 2 +  1 .76 × 2 ) × 0 .048132 +  0 .6668 × 6 × 0 .023503  =  2 .6351

2.2.3. Eigenvalues of Bond-Connecting Matrix (SX1CH)

Recently, we introduced the X1CH index to evaluate bond dissociation energy for the alkane molecule [15]. Here, we also convert the structure of the aliphatic alcohol molecule to that of the corresponding alkane. Now, we consider the molecule of 2-methyl-1-propanol, the corresponding alkane is 2-methylbutane. If H atom connects with the ith carbon atom (Ci), when the HCi bond is broken, two radicals H and Ri will be formed (Figure 3).
According to the calculation method of PEI of alkyl in paper [16] and values in Table 1, we can calculate the PEI for two radicals above as follows:
  • H: PEIH = 0
  • R1: PEI1 = 1.2122+ 0.0481= 1.2603
Then, PEIH and PEI1 were used as the main diagonal elements to build the bonding adjacency matrix BCH of HC1 bond:
B CH = [ PEI H 1 1 PEI l ] = [ 0 1 1 1.2603 ]
The off-diagonal element “1” in matrix means that H atom and C1 are connected with each other, i.e., they are adjacent. Solving matrix BCH by computer, we got two eigenvalues X1CH = −0.5518 and X2CH = 1.8121 (let X1CH < X2CH). The eigenvalues of every H–C bond adjacency matrix in a molecule are also calculated with the same method. Finally, taking sum of X1CH of all BCH respectively, we got parameters SX1CH, in other words, let SX1CH = ∑X1CH. For 2-methylbutane, there are:
SX 1 CH   =    X 1 CH = 6 × ( 0 .5518)  + ( 0 .5061)  +  2 × ( 0 .5255) +  3 × ( 0 .5576)  = 6 .5407

3. Results and Discussion

Multiple linear regression analysis using the novel MPEI, OEI and SX1CH indices is performed for the development of the final QSPR model.

3.1. Quantitative Structure-Retention Relationship (QSRR) Model for Alcohols on Stationary Phases of Different Polarity

After calculation of the descriptors (Table 3) of alcohols molecule, multiple linear regression analysis using the novel MPEI, OEI, SX1CH indices is performed for the development of the final QSRR model for each stationary phase separately. Specifications of the best models found for describing the RI values of alcohols on the six stationary phases are given in Table 4. It can be seen that the equations represent excellent QSRR models judging from high R and low s values. Also, the F values show a high degree of statistical credibility and are indicative of an excellent fit of the models to the experimental RI values.
In order to validate the models obtained, the leave-one-out test was performed. The results for the models are shown in Table 4. As shown, in all cases, cross-validated correlation coefficient is only slightly less than the corresponding value of the full model.

3.2. Quantitative Structure-Property Relationship (QSPR) Model for BP of the Alcohols

Boiling point is important for the characterization and identification of a compound. It also provides an indication of the volatility of a compound. It is intuitively evident that boiling point is critically influenced by two characteristics of a molecule: first the molecular weight and, second, the intermolecular attractive forces between molecules. Multiple linear regression analysis using the novel MPEI, OEI indices is performed for the development of the final two-parameter QSPR model in the form of Equation (5). Of the two parameters in the model, the OEI index addresses the first, and the MPEI addresses the second.
BP  =  187 .7855 +  12 .8416OEI  53 .8368MPEI
R = 0.9928; s = 4.3; F = 1885.3; n = 58; Rcv = 0.9918; scv = 4.5.
The two parameter QSPR equation reflects quantitatively the well known fact that the boiling point of a compound depends on the mass of its molecules and their tendency to stick together. The calculated BP is shown in Table 5 and plotted against the experimental values in Figure 4.

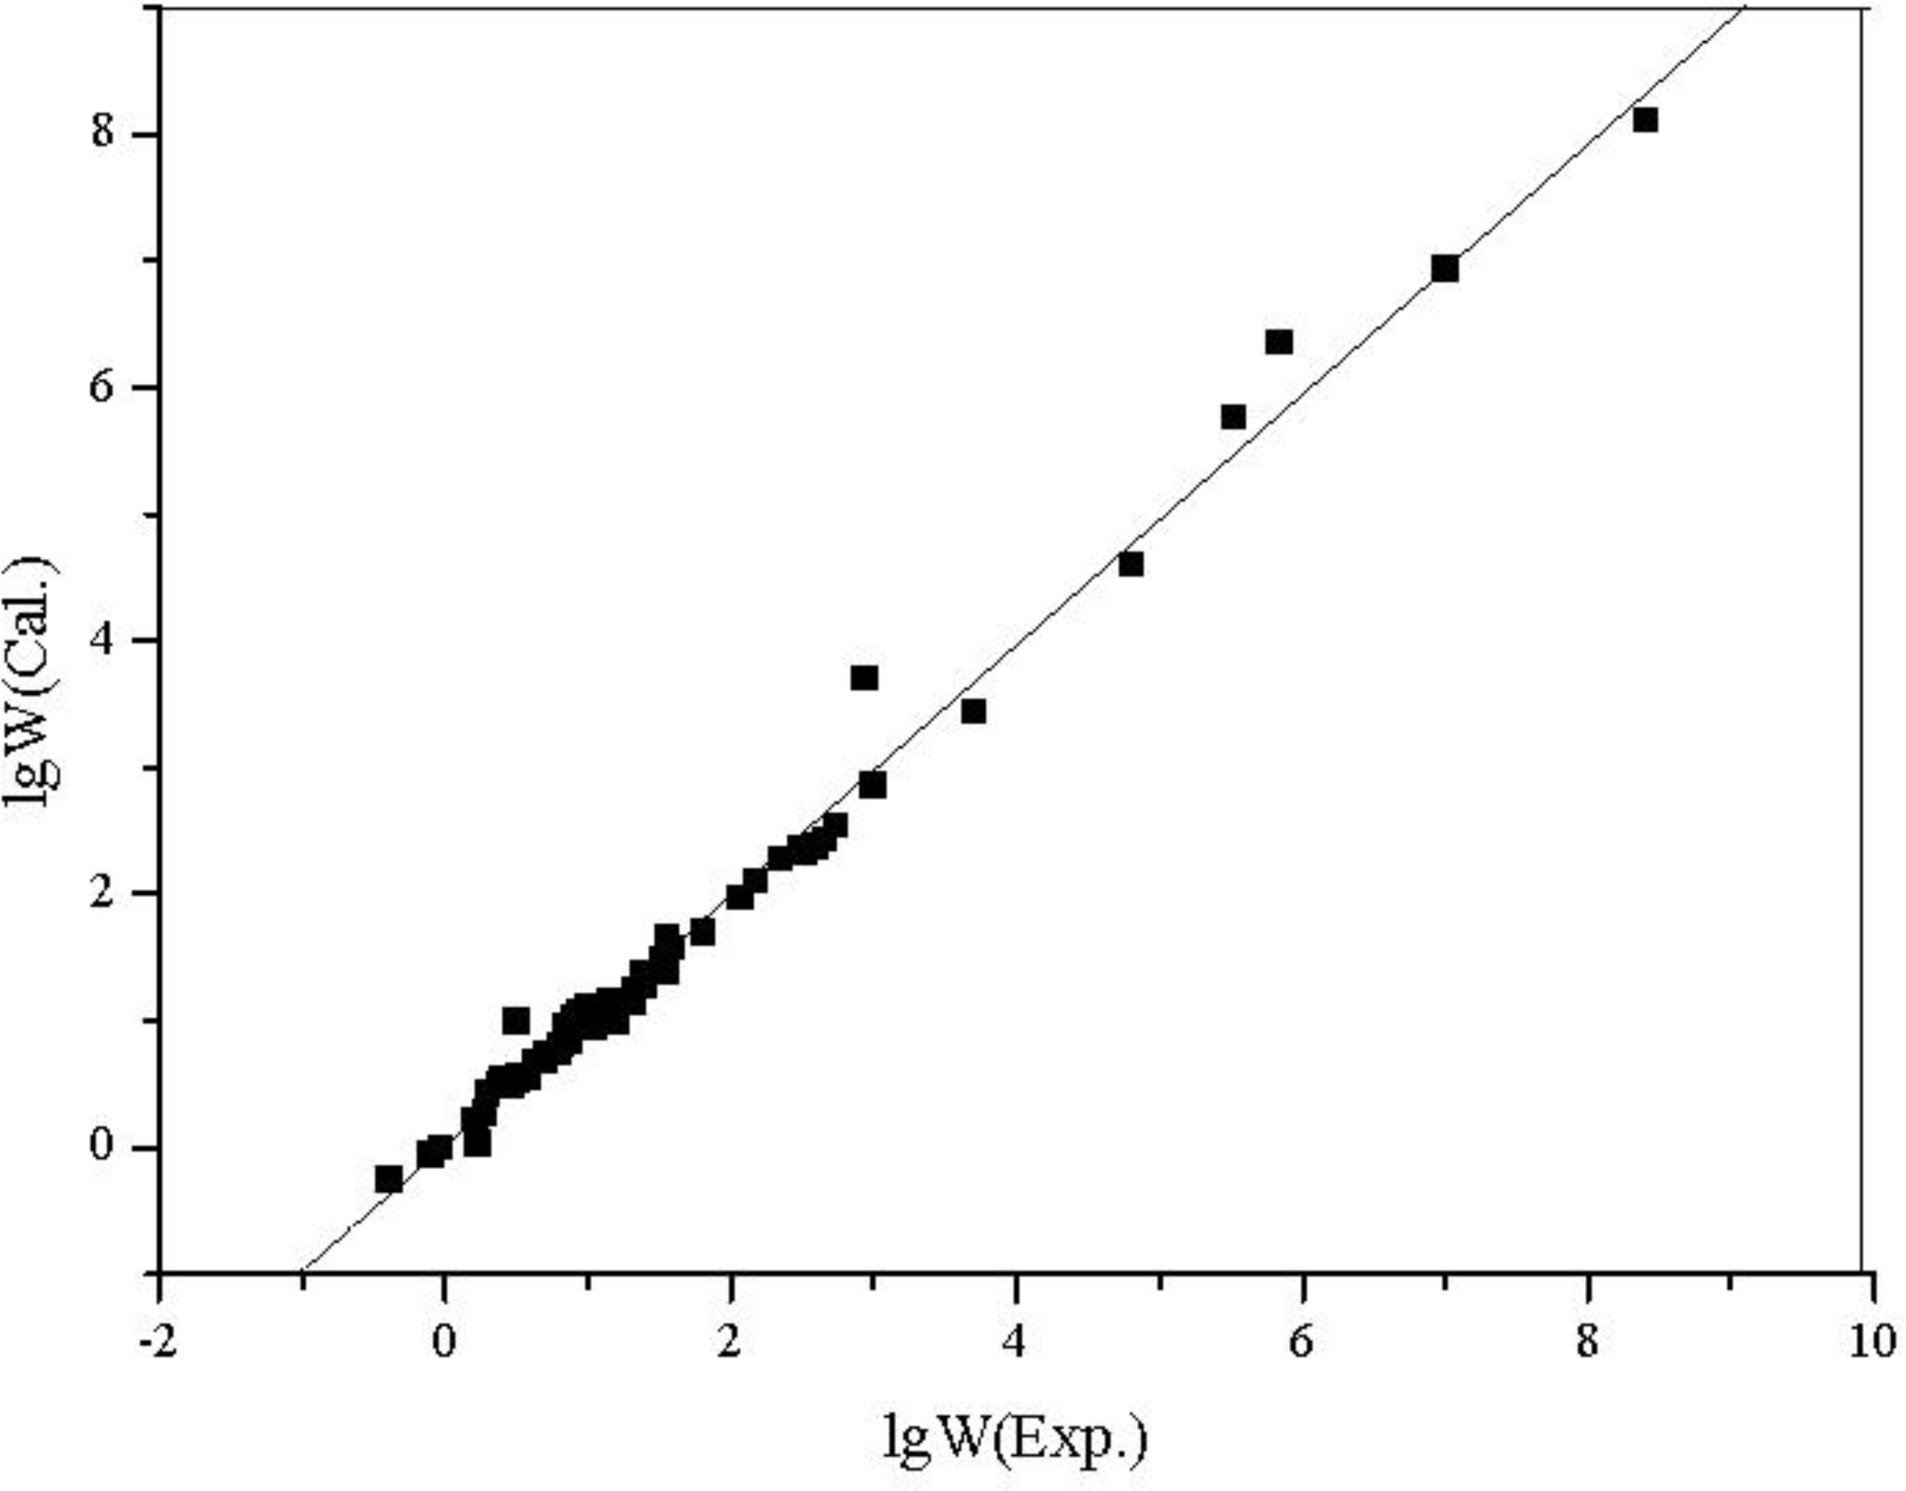
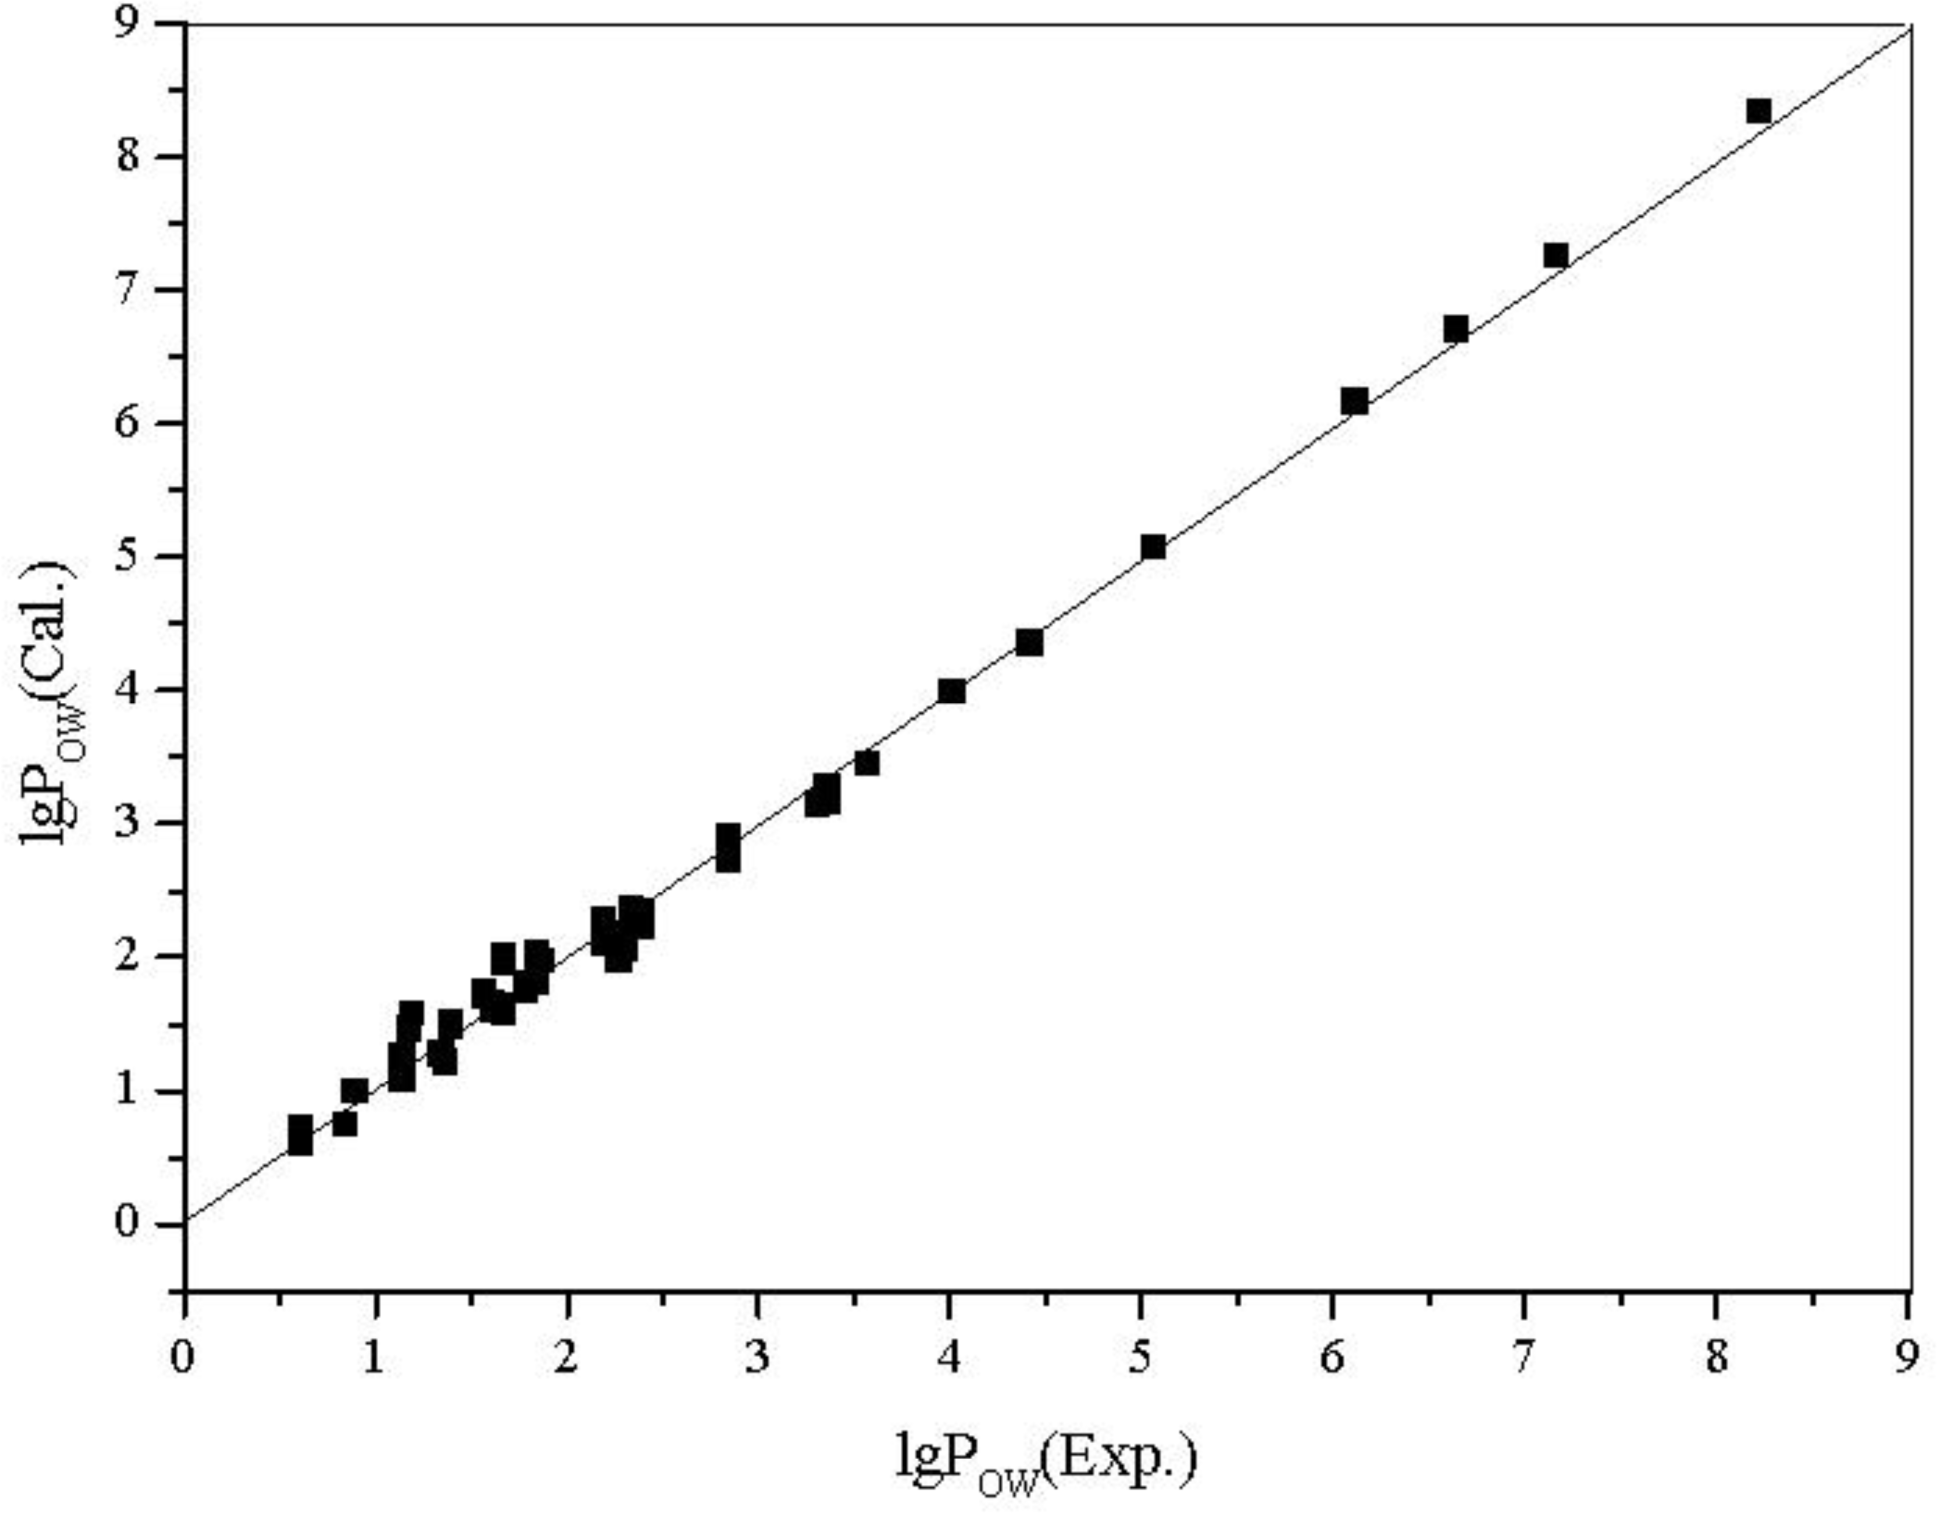
3.3. Quantitative Structure-Property Relationship (QSPR) Models for Water Solubility (lg W), n-Octanol/Water Partition Coefficients (lg POW) of the Alcohols

Physicochemical properties of micropollutants, such as water solubility (lg W) and n-octanol/water partition coefficient (lg POW), play a major role in determining the distribution and fate of organic contaminants in the global environments and have been used for assessing environmental partition and transport of organic substances. The compounds used in this study contain 58 alcohols. With the aid of a computer program, the best model is obtained as follows:
lg  W   =   0 .5370   1.2930MPEI   0 .5950SX 1 CH
R = 0.9942; s = 0.19; F = 2176.9; Rcv = 0.9932; scv = 0.20; n = 58.
lg  P OW   =    1.0271   0.7113MPEI   0 .5531SX 1 CH
R = 0.9959; s = 0.15; F = 3306.4; Rcv = 0.9954; scv = 0.15; n = 58.
Two models are validated to be statistically significant by the leave-one-out cross-validation. The calculated and experimental lg W and lg POW of alcohols along with topological descriptors are listed in Table 6.
The plot of calculated values versus observed values of lg W and lg POW is shown in Figure 5 and Figure 6, respectively.
In the three models, the proposed index OEI and SX1CH were generated on the basis of the aliphatic part of the molecule and represent the R contribution to the physicochemical properties to be predicted. The MPEI index was introduced not only taking into account the presence of OH group, but also the polar OH contribution and apolar R group/polar OH interaction contribution to the predicted physicochemical properties. The property of alcohols is influenced by the intermolecular forces and MPEI index connecting to the polarizability of the molecule and the intramolecular action of the solute. So, in the three different models, MPEI index is significant.
Most of QSPR research only investigates one or a few properties of correlation with some parameters or descriptors. In this paper, we have obtained good correlations between OEI, MPEI, SXICH and the many properties of alcohols.
From the results above, all of the correlation coefficients (R) are greater than 0.99, every regression equation has high F and low s; from the figures, the calculated values are very close to the experimental ones, there is no large deviation in all estimated values, and the statistical validity of the models are verified by the leave-one-out cross validation technique.
It appears that models based on these properties are simpler, but it is important to remember that the experimental data of these properties are not always available. Furthermore, their predicted data could be subject to high variability due to the selected QSPR calculation method.

4. Conclusion

In this study, the novel topological indices: MPEI, OEI and SX1CH based on graph theory by dividing the molecular structure into substructure, were used to correlate with boiling point (BP), octanol–water partition coefficient (lg POW), water solubility (lg W) and the chromatographic retention indices (RI) on different polar stationary phases. Descriptors appeared in these models coding the chemical structure effectively and simply, providing enough information related to the molecular structure and molecular properties. The proposed models have good stability, robustness and the predicted values from MLR method are close to the experimental values, which demonstrates the ability of these descriptors to give prediction. The leave-one-out cross-validation technique used in the study ensures the models performed as stably and reliably as possible. The correlation equations and descriptors are expected to be used for the prediction of physicochemical properties for diverse aliphatic alcohols in cases where the physicochemical indices are not readily available. This paper opens a new insight and may lead to the exploration of a novel way for QSPR study of alcohols.

Acknowledgments

The project is supported by the National Natural Science Foundation of China No. 21072053 (NSFC) and the Scientific Research Fund Hunan University of Science and Technology No. E50857.

References

  1. Katritzky, AR; Petrukhin, R; Tatham, D. Interpretation of quantitative structure-property and activity relationships. J. Chem. Inf. Comput. Sci 2001, 41, 679–685. [Google Scholar]
  2. Katritzky, AR; Dobchev, DA; Slavov, S; Karelson, M. Legitimate utilization of large descriptor pools for QSPR/QSAR models. J. Chem. Inf. Model 2008, 48, 2207–2213. [Google Scholar]
  3. Delgrado, EJ; Alderete, JB; Gonzalo, AJ. A simple QSPR model for predicting soil sorption coefficients of polar and nonpolar organic compounds from molecular formula. J. Chem. Inf. Comput. Sci 2003, 43, 1928–1932. [Google Scholar]
  4. Katritzky, AR; Slavov, S; Dobchev, D; Karelson, M. Rapid QSPR model development technique for prediction of vapor pressure of organic compounds. Comput. Chem. Eng 2007, 31, 1123–1130. [Google Scholar]
  5. Souza, ES; Kuhen, CU; Junkes, BS; Yunes, RS; Heinzen, VEF. Modeling the semi-empirical electrotopological index in QSPR studies for aldehydes and ketones. J. Chemom 2009, 23, 229–235. [Google Scholar]
  6. Katritzky, AR; Fara, D; Karelson, M. QSPR of 3-aryloxazolidin-2-one antibacterials. Bioorg. Med. Chem 2004, 12, 3027–3035. [Google Scholar]
  7. Gramatica, P; Giani, E; Papa, E. Statistical external validation and consensus modeling: A QSPR case study for Koc prediction. J Mol Graph Model 2007, 25, 755–766. [Google Scholar]
  8. Laura, DH; David, SP; Florian, N; John, BO. Why are some properties more difficult to predict than others? A study of QSPR models of solubility, melting point, and Log P. J. Chem. Inf. Model 2008, 48, 220–232. [Google Scholar]
  9. Souza, ES; Kuhnen, CA; Junkes, BS; Yunes, RA; Heinzen, VEF. Development of semi-empirical electrotopological index using the atomic charge in QSPR/QSRR models for alcohols. J. Chemom 2010, 24, 149–157. [Google Scholar]
  10. Junkes, BS; Amboni, RDMC; Yunes, RA; Heinzen, VEF. Prediction of chromatographic retention of saturated alcohols on stationary phases of different polarity applying the novel semi-empirical topological index. Anal. Chim. Acta 2003, 477, 29–39. [Google Scholar]
  11. Beteringhe, A; Radutiu, AC; Culita, DC; Mischie, A; Spafiu, F. Quantitative structure-retention relationship (QSRR) study for predicting gas chromatographic retention times for some stationary phases. QSAR Comb. Sci 2008, 27, 996–1005. [Google Scholar]
  12. Ren, B. Novel atom-type AI indices for QSPR studies of alcohols. Comput. Chem 2002, 26, 223–235. [Google Scholar]
  13. Huuskonen, J. Prediction of soil sorption coefficient of organic pesticides from the atom-type electrotopological state indices. Environ. Toxicol. Chem 2003, 22, 816–820. [Google Scholar]
  14. Cao, CZ; Yuan, H. Topological indices based on vertex, distance, and ring: on the boiling points of paraffins and cycloalkanes. J. Chem. Inf. Comput. Sci 2001, 41, 867–877. [Google Scholar]
  15. Cao, CZ; Yuan, H. A new approach of evaluating bond dissociation energy from eigenvalue of bonding orbital-connection matrix for C–C and C–H bonds in alkane. J. Chem. Inf. Comput. Sci 2003, 43, 600–608. [Google Scholar]
  16. Liu, FP; Liang, YZ; Cao, CZ. QSPR modeling of thermal conductivity detection response factors for diverse organic compound. Chemom. Intell. Lab. Syst 2006, 81, 120–126. [Google Scholar]
  17. Liu, FP; Liang, YZ; Cao, CZ; Zhou, N. QSPR study of GC retention indices for saturated esters on seven stationary phases based on novel topological indices. Talanta 2007, 72, 1307–1315. [Google Scholar]
  18. Kabinyi, H. QSAR: Hansch Analysis and Related Approaches; Mannhold, R, Gaad-Larsen, PK, Timmerman, H, Eds.; VCH: Weinheim, Germany, 1993. [Google Scholar]
  19. Goodarzi, M; Freitas, MP. Predicting boiling points of aliphatic alcohols through multivariate image analysis applied to quantitative structure-property relationships. J. Phys. Chem. A 2008, 112, 11263–11265. [Google Scholar]
  20. Wang, LS; Han, SK. Molecular Structure, Property and Activity; Chemical Industry Press: Beijing, China, 1997; pp. 26–40. [Google Scholar]
  21. Guo, WQ; Lu, Y; Zheng, XM. The predicting study for chromatographic retention index of saturated alcohols by MLR and ANN. Talanta 2000, 51, 479–488. [Google Scholar]
  22. Weast, RC. CRC Handbook of Chemistry and Physics, 70th ed; CRC Press Inc: Boca Raton, FL, USA, 1989/1990. [Google Scholar]
Figure 1. The hydrogen-suppressed molecular graph of 3-hexanol.
Ijms 12 02448f1
Figure 2. The hydrogen-suppressed molecular graph of 2-methyl-1-propanol.
Ijms 12 02448f2
Figure 3. The breaking of the H–C bond of 2-methylbutane molecule.
Ijms 12 02448f3
Figure 4. The plot of the calculated vs. the experimental BP for 58 aliphatic alcohols.
Ijms 12 02448f4
Figure 5. The plot of the calculated vs. the experimental lg W for 58 aliphatic alcohols.
Ijms 12 02448f5
Figure 6. The plot of the calculated vs. the experimental lg POW for 58 aliphatic alcohols.
Ijms 12 02448f6
Table 1. ΔPEI values of the ith essential unit in alkyl substituent.
NiΔPEINiΔPEINiΔPEINiΔPEI
11.0000060.009052110.002375160.001073
20.14052670.006388120.001972170.000945
30.04813280.004748130.001628180.000838
40.02350390.003666140.001421190.000749
50.013800100.002196150.001229200.000673
Table 2. αi values of some atoms [22].
AtomHCSOFClBrI
αi0.66681.762.900.8020.5572.183.055.34
Table 3. Retention indices on different polar stationary phases of saturated alcohols and the topological descriptors values used in the QSRR models.
Retention IndicesDescriptors

No.AlcoholSE-30OV-3OV-7OV-11OV-17OV-25OEIMPEISX1CH
11-butanol6506727027257487925.22222.5887−6.5340
21-hexanol85688190793595910038.49672.6446−8.5424
31-heptanol960985101010381062110410.11832.6611−9.5424
42-butanol5866076336566757115.22222.7854−6.5407
52-pentanol6897117357567778116.81942.8386−7.5453
63-pentanol6897087337567778086.81942.8850−7.5440
73-hexanol7858078308538789048.49672.9383−8.5434
83-heptanol886909929955975100810.11832.9715−9.5414
94-heptanol88090492494696899910.11832.9916−9.5392
102-methyl-2-butanol6286526746927097386.44443.0353−7.5706
112-methyl-2-hexanol8228488628849049309.67393.1217−9.5480
122-methyl-2-heptanol9209449619821001102611.24003.1444−10.5425
132-methyl-3-hexanol8588768979209399699.67393.0379−9.5407
143-methyl-1-butanol7257477717988178556.44442.6420−7.5453
154-methyl-1-pentanol8278498769029239607.91672.6551−8.5469
162-ethyl-1-hexanol10191046106710921116115611.51782.7975−10.5296
173-ethyl-3-pentanol8538768989209399749.95833.2345−9.5358
182,2-dimethyl-3-pentanol8148348558748909198.51393.0843−9.5556
192,2-dimethyl-3-hexanol906926944962977100410.35113.1375−10.5326
201-propanol5445743.50002.5354−5.5244
211-pentanol7517778068569006.81942.6219−7.5404
222-pexanol7878118358789148.49672.8718−8.5469
232-methyl-1-propanol6126416546807404.50002.6351−6.5407
242-methyl-2-pentanol7267487678018277.91673.0886−8.5515
252-ethyl-1-butanol8348579079288.26392.7417−8.5400
Table 4. Statistical results of MLR models for RI based on six stationary phases with topological indices.
Stationary PhaseRegression EquationStatistics
RsFRcvscvn
SE-30RI = 714.1971 – 53.1823SX1CH0.996311.2942.10.994312.825
–231.145MPEI + 34.62949OEI
OV-3RI =756.8884 – 52.1502 SX1CH0.996311.2936.40.994212.825
–236.867MPEI + 35.3456OEI
OV-7RI = 798.1506 – 47.8311SX1CH0.995312.3638.70.992214.322
–238.579MPEI + 37.97237OEI
OV-11RI = 858.8273 – 43.7851SX1CH0.993813.8453.10.989116.421
–249.092MPEI + 41.39177OEI
OV-17RI = 941.0954 – 35.5304SX1CH0.994013.6547.60.989916.124
–263.948MPEI + 47.63748OEI
OV-25RI = 1053.736 – 37.8516 SX1CH0.992215.6402.50.987118.323
–292.817MPEI + 45.8317OEI
Table 5. Experimental and calculated boiling points (BP) of 58 saturated alcohols and the topological descriptors values used in the QSPR model.
No.AlcoholOEIMPEIBP (Exp.)BP (Cal.)ΔBP
1methanol0.00002.185964.770.1−5.4
2ethanol2.00002.435878.382.3−4.0
31-propanol3.50002.535497.296.21.0
41-butanol5.22222.5887117.0115.51.5
51-pentanol6.81942.6219137.8134.23.6
61-hexanol8.49672.6446157.0154.52.5
71-heptanol10.11832.6611176.3174.51.8
81-octanol11.78082.6736195.2195.10.1
91-nonanol13.41202.6835213.1215.5−2.4
101-decanol15.06802.6914230.2236.4−6.2
112-propanol3.50002.685782.388.1−5.8
122-butanol5.22222.785499.6104.9−5.3
132-pentanol6.81942.8386119.0122.5−3.5
142-hexanol8.49672.8718139.9142.3−2.4
152-octanol11.78082.9110179.8182.4−2.6
162-nonanol13.41202.9235198.5202.6−4.1
173-pentanol6.81942.8850115.3120.0−4.7
183-hexanol8.49672.9383135.4138.7−3.3
193-heptanol10.11832.9715156.8157.7−0.9
204-heptanol10.11832.9916155.0156.7−1.7
213-nonanol13.41203.0106194.7197.9−3.2
224-nonanol13.41203.0474193.0196.0−3.0
235-nonanol13.41203.0580195.1195.4−0.3
242-me-1-propanol4.50002.6351107.9103.74.2
252-me-2-propanol4.50002.935682.487.5−5.1
262-me-1-butanol6.44442.6884128.7125.82.9
272-me-2-butanol6.44443.0353102.0107.1−5.1
283-me-1-butanol6.44442.6420131.2128.32.9
293-me-2-butanol6.44442.8850111.5115.2−3.7
302-me-1-pentanol7.91672.7216148.0142.95.1
313-me-1-pentanol8.26392.6752152.4149.92.5
324-me-1-pentanol7.91672.6551151.8146.55.3
332-me-2-pentanol7.91673.0885121.4123.2−1.8
343-me-2-pentanol8.26392.9383134.2135.7−1.5
354-me-2-pentanol7.91672.8919131.7133.8−2.1
362-me-3-pentanol7.91672.9846126.6128.8−2.2
373-me-3-pentanol8.26393.1349122.4125.1−2.7
382-me-2-hexanol9.67393.1217142.5144.0−1.5
393-me-3-hexanol9.81613.1882142.4142.20.2
407-me-1-octanol12.94332.6861206.0209.4−3.4
412-et-1-butanol8.26392.7417146.5146.30.2
423-et-3-pentanol9.95833.2345142.5141.51.0
432-et-1-hexanol11.51782.7975184.6185.1−0.5
442,2-dime-1-propanol5.00002.7347113.1104.88.3
452,2-dime-1-butanol7.16672.7880136.8129.77.1
462,3-dime-1-butanol7.88892.7417149.0141.57.5
473,3-dime-1-butanol7.16672.6953143.0134.78.3
482,3-dime-2-butanol7.88893.1349118.6120.3−1.7
493,3-dime-2-butanol7.16672.9846120.0119.10.9
502,3-dime-2-pentanol9.58333.1882139.7139.20.5
513,3-dime-2-pentanol9.20833.0379133.0142.5−9.5
522,2-dime-3-pentanol8.51393.0843136.0131.14.9
532,4-dime-3-pentanol8.88893.0843138.8135.92.9
542,6-dime-4-heptanol12.30613.0982178.0179.0−1.0
552,3-dime-3-pentanol9.58333.2345139.0136.72.3
563,5-dime-4-heptanol12.79223.1908187.0180.36.7
572,2,3-trime-3-pentanol10.40283.3342152.2141.910.3
583,5,5-trime-1-hexanol11.42062.7433193.0186.86.2
Table 6. Experimental and calculated water solubility (lg W), n-octanol/water partition coefficients (lg POW) of 58 saturated alcohols and the topological descriptors values used in the QSPR models.
No.AlcoholMPEISX1CHlg W (Exp.)lg W (Cal.)lg POW (Exp.)lg POW (Cal.)
11-butanol2.5887−6.5340−0.030.000.840.75
22-butanol2.7854−6.5407−0.39−0.250.610.61
32-methyl-1-propanol2.6348−6.5407−0.10−0.050.610.72
41-pentanol2.6219−7.54040.590.561.341.28
53-methyl-1-butanol2.6420−7.54530.510.541.141.27
62-methyl-1-butanol2.6884−7.54400.460.481.141.23
72-pentanol2.8386−7.54530.280.281.141.13
83-pentanol2.8850−7.54400.210.221.141.09
93-methyl-2-butanol2.8850−7.54960.210.221.141.10
102-methyl-2-butanol3.0353−7.57060.230.040.891.00
112,2-dimethyl-1-propanol2.7347−7.57060.300.431.361.22
121-hexanol2.6446−8.54241.211.131.841.82
132-hexanol2.8718−8.54690.870.841.611.66
143-hexanol2.9383−8.54340.800.751.611.61
153-methyl-3-pentanol3.1028−8.54800.390.541.391.49
162-methyl-2-pentanol3.0886−8.55150.510.561.391.51
172-methyl-3-pentanol2.9846−8.54540.700.691.671.58
183-methyl-2-pentanol2.9383−8.54540.710.751.671.61
192,2-dimethyl-1-butanol2.7880−8.54801.040.941.571.72
202,3-dimethyl-1-butanol2.7417−8.54540.501.001.571.75
212,3-dimethyl-2-butanol3.1349−8.55260.370.501.171.47
223,3-dimethyl-2-butanol2.9846−8.55260.640.691.191.58
232-methyl-1-pentanol2.7216−8.54341.051.031.781.76
244-methyl-1-pentanol2.6551−8.54690.991.121.781.81
254-methyl-2-pentanol2.8919−8.54860.810.811.671.64
262-ethyl-1-butanol2.7417−8.54001.211.001.781.75
271-heptanol2.6611−9.54241.811.702.342.36
282-heptanol2.8945−9.54541.551.402.312.19
293-heptanol2.9715−9.54141.391.302.312.14
304-heptanol2.9916−9.53921.391.272.312.12
312-methyl-2-hexanol3.1217−9.54801.071.111.842.03
325-methyl-2-hexanol2.9050−9.54821.381.392.192.19
333-methyl-2-hexanol3.1882−9.54050.981.021.871.98
342-methyl-3-hexanol3.0058−9.54071.321.252.192.11
352,2-dimethyl-1-pentanol2.8212−9.54051.521.492.392.24
362,4-dimethyl-1-pentanol2.7548−9.54321.601.582.192.29
374,4-dimethyl-1-pentanol2.6883−9.54801.551.672.392.34
382,3-dimethyl-2-pentanol3.1882−9.55560.911.032.271.99
392,4-dimethyl-2-pentanol3.1419−9.54870.931.081.672.02
402,2-dimethyl-3-pentanol3.0843−9.55561.161.162.272.06
412,3-dimethyl-3-pentanol3.2345−9.53990.840.961.671.95
422,4-dimethyl-3-pentanol3.0843−9.54091.321.152.312.06
431-octanol2.6736−10.53902.352.282.842.90
442-octanol2.9110−10.54232.071.972.842.73
452-ethyl-1-hexanol2.7975−10.52962.172.112.842.81
461-nonanol2.6820−11.53483.002.863.573.45
472-nonanol2.9235−11.53722.742.553.363.28
483-nonanol3.0106−11.53152.662.433.363.21
494-nonanol3.0474−11.52802.592.383.363.18
505-nonanol3.0580−11.52682.492.373.363.17
512,6-dimethyl-4-heptanol3.0982−11.52732.512.323.313.15
521-decanol2.6892−12.52963.703.444.013.99
532-undcanol2.9391−13.52202.943.714.424.36
541-dodecanol2.7011−14.51384.804.615.065.08
551-tetradecanol2.7098−16.49485.525.776.116.17
561-pentadecanol2.7132−17.48385.846.366.646.71
571-hexadecanol2.7163−18.47207.006.947.177.26
581-octadecanol2.7214−20.44768.408.118.228.35

