Phenols in Leaves and Bark of Fagus sylvatica as Determinants of Insect Occurrences

Abstract
:1. Introduction
2. Materials and Methods
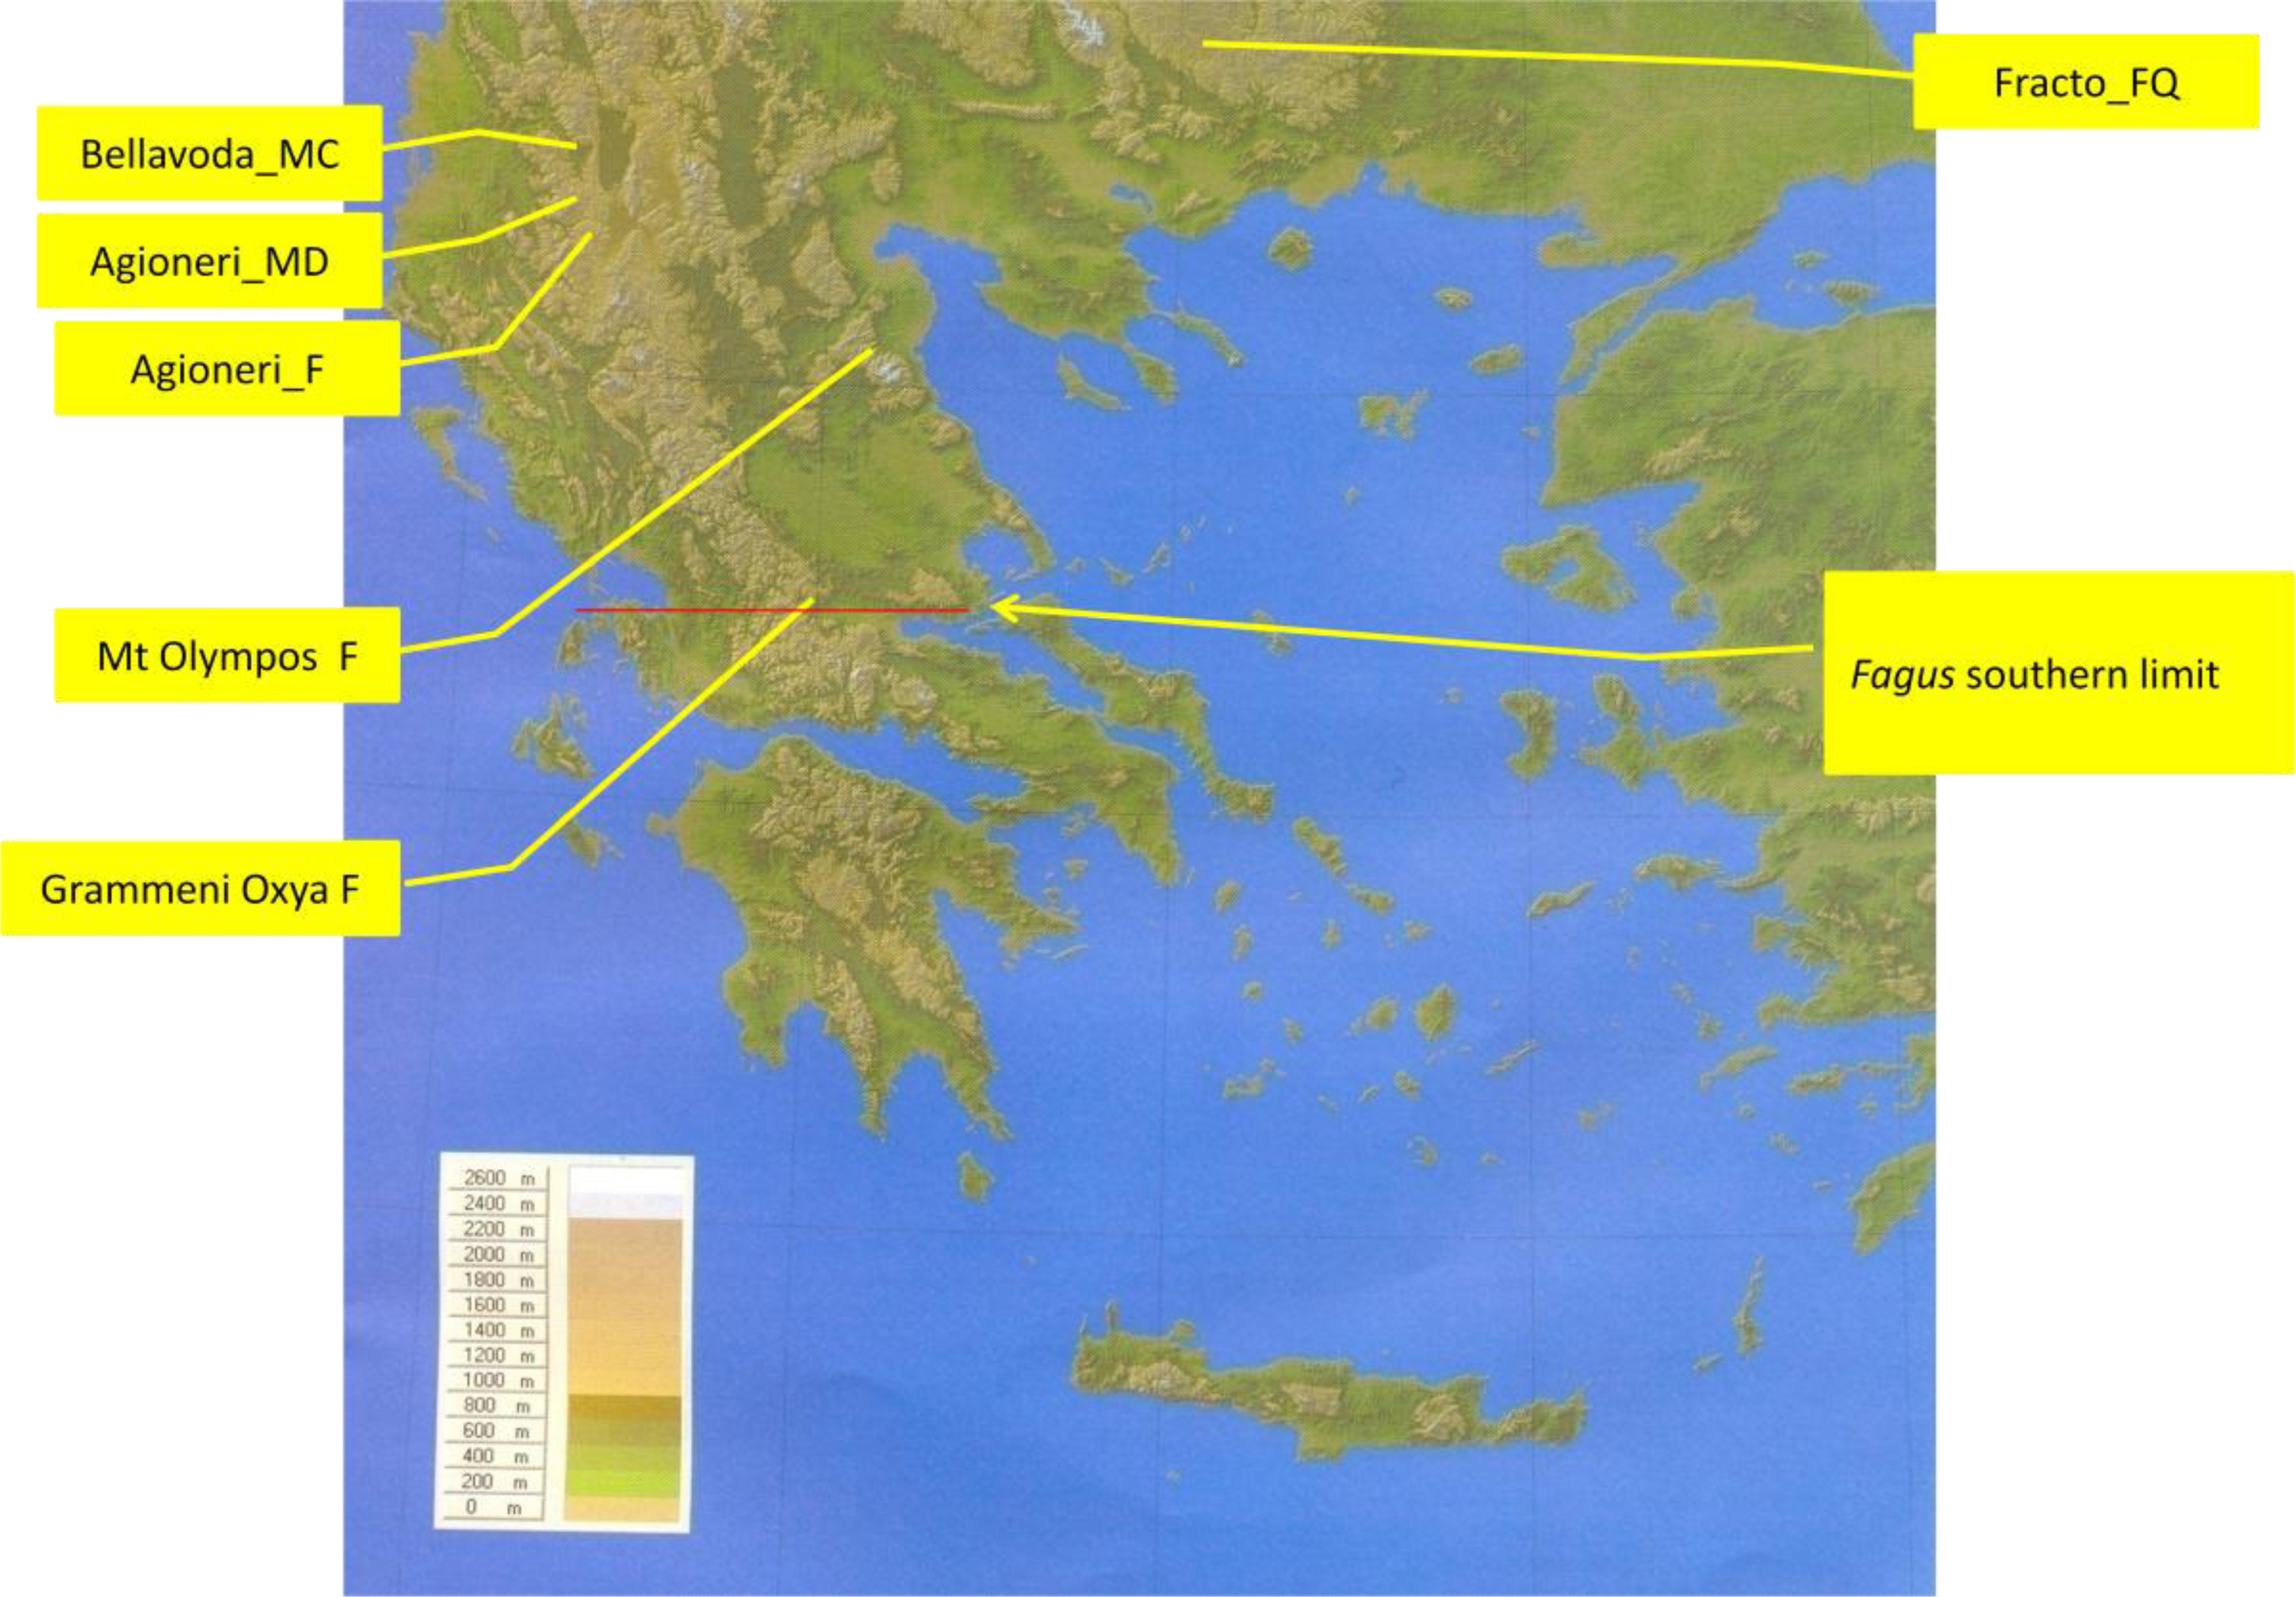
2.1. Sites Studied
2.2. Insect Sampling
2.3. Plant Material Sampling and Phenolic Content Estimation
2.4. Data Analysis
3. Results
4. Discussion
5. Conclusion
Acknowledgments
References
- Bussotti, F; Gravano, E; Grossoni, P; Tani, C. Occurrence of tannins in leaves of beech trees (Fagus sylvatica) along an ecological gradient, detected by histochemical and ultrastructural analyses. New Phytol 1998, 138, 469–479. [Google Scholar]
- Dübeler, A; Voltmer, G; Gora, V; Lunderstädt, J; Zeeck, A. Phenols from Fagus sylvatica and their role in defence against Cryptococcus fagisuga. Phytochemistry 1997, 45, 51–57. [Google Scholar]
- Mämmelä, P. Phenolics in selected European hardwood species by liquid chromatography-electrospray ionisation mass spectrometry. Analyst 2001, 126, 1535–1538. [Google Scholar]
- Weissen, F; Praag, HJ. Root growth inhibition effects of holorganic moder humus layer under spruce (Picea abies Karst.) and beech (Fagus sylvatica L.). Plant Soil 1991, 135, 167–174. [Google Scholar]
- Alfredsen, G; Solheim, H; Slimestad, R. Antifungal effect of bark extracts from the European tree species. Eur. J. For. Res 2008, 127, 387–393. [Google Scholar]
- Wargo, PM. Amino nitrogen and phenolic constituents of bark of American beech, Fagus grandifolia, and infestation by beech scale, Cryptococcus fagisuga. Eur. J. Forest Pathol 1988, 18, 279–290. [Google Scholar]
- Schmidt, I; Leuschner, C; Mölder, A; Schmidt, W. Structure and composition of the seed bank in monospecific and tree species-rich temperate broad-leaved forests. For. Ecol. Manag 2009, 257, 695–702. [Google Scholar]
- Bergmeier, E; Dimopoulos, P. Fagus sylvatica forest vegetation in Greece: Syntaxonomy and gradient analysis. J. Veg. Sci 2001, 12, 109–126. [Google Scholar]
- Aber, JD. A method for estimating foliage-height profiles in broad-leaved forests. J. Ecol 1979, 67, 35–40. [Google Scholar]
- Petrakis, PV. A multivariate approach to the analysis of biotope structure with special reference to their avifauna in Prespa region, northwestern Greece: Database and procedures. Biologia Gallo-hellenica 1989, 16, 67–106. [Google Scholar]
- Southwood, TRE; Henderson, PA. Ecological Methods; Blackwell Science: Oxford, UK, 2000. [Google Scholar]
- Floren, A; Gogala, A. Heteroptera from beech (Fagus sylvatica) and silver fir (Abies alba) trees of the primary forest reserve Rajhenavski Rog, Slovenia. Acta Entomol. Slov 2002, 10, 25–32. [Google Scholar]
- Ozanne, CMP. Techniques and Methods for Sampling Canopy Insects in Insect Sampling in Forest Ecosystems; Simon, L, Ed.; Blackwell publishing: Hoboken, NJ, USA, 2005; pp. 146–167. [Google Scholar]
- Bedgood, DR, Jr; Bishop, AG; Prenzler, PD; Robards, K. Analytical approaches to the determination of simple biophenols in forest trees such as Acer (maple), Betula (birch), Coniferus, Eucalyptus, Juniperus (cedar), Picea (spruce), and Quercus (oak). Analyst 2005, 130, 809–823. [Google Scholar]
- Graca, MAS; Bärlocher, F. Proteolytic gut enzymes in Tipula caloptera-Interaction with phenolics. Aquatic Insects 1998, 21, 11–18. [Google Scholar]
- Bärlocher, F; Graca, MAS. Total Phenolics. In Methods to Study Litter Decomposition: A Practical Guide; Graca, MAS, Bärlocher, F, Gessner, MO, Eds.; Springer: Berlin, Germany, 2005; pp. 97–100. [Google Scholar]
- Johnson, RA; Wichern, DM. Applied Multivariate Statistical Analysis; Prentice Hall: New Jersey, NJ, USA, 1998. [Google Scholar]
- Oksanen, J; Kindt, R; Legendre, P; O’Hara, R; Simpson, GL; Stevens, MHH; Wagner, H vegan. Community Ecology Package. R package version 1.13-2. Available online: http://vegan.r-forge.r-project.org/(accessed on 17 May 2008).
- The R System for Statistical Computing, version 2101; The R Foundation for Statistical Computing: Vienna, Austria, 2009.
- Wilkinson, L (Ed.) SYSTAT: The System for Statistics; SYSTAT Inc.: Chicago, IL, USA, 1990.
- Waterman, PG; Mole, S. Analysis of Phenolic Plant Metabolites; Blackwell Scientific: Boston, MA, USA, 1994. [Google Scholar]
- Humar, M; Fabčiča, B; Zupančiča, M; Pohlevena, F; Ovena, P. Influence of xylem growth ring width and wood density on durability of oak heartwood. Int. Biodeterior. Biodegrad 2008, 62, 368–371. [Google Scholar]
- Schmidt, O. Wood and Tree Fungi Biology, Damage, Protection and Use; Springer: Berlin, Germany, 2000. [Google Scholar]
- Dujesiefken, D; Liese, W; Shortle, W; Minocha, R. Response of beech and oaks to wounds made at different times of the year. Eur. J. Forest Res 2005, 124, 113–117. [Google Scholar]
- Ginzberg, I. Wound-periderm formation. In Induced Plant Resistance to Herbivory; Schaller, A, Ed.; Springer: Berlin, Germany, 2008; pp. 131–146. [Google Scholar]
- Iwashina, T. Flavonoid Function and Activity to Plants and Other Organisms. Biol. Sci. Space 2003, 17, 24–44. [Google Scholar]
- Praag, HJ; van Motte, JC; Monseur, X; Walravens, J; Weissen, F. Root growth inhibition of the holorganic layer of moder humus under spruce (Picae abies KARST.) and beech (Fagus Silvatica L.) II. Biological test and organic analysis of the soil solution. Plant Soil 1991, 135, 175–183. [Google Scholar]
- Schweingruber, FH. Atlas of Woody Plant Stems: Evolution, Structure & Environmental Modifications; Spinger: Berlin, Germany, 2006. [Google Scholar]
- Lang, G. Quartäre Vegetationsgeschichte Europas: Methoden und Ergebnisse; Gustav Fischer: Jena, Germany, 1994. [Google Scholar]
- Paffetti, D; Vettori, C; Caramelli, D; Vernesi, C; Lari, M; Paganelli, A; Paule, L; Giannini, R. Unexpected presence of Fagus orientalis complex in Italy as inferred from 45,000-year-old DNA pollen samples from Venice lagoon. BMC Evol Biol 2007, 2. [Google Scholar] [CrossRef]
- Svenning, JC; Normand, S; Skov, F. Postglacial dispersal limitation of widespread forest plant species in nemoral Europe. Ecography 2008, 31, 316–326. [Google Scholar]
- Weissen, F; Praag, HJ. Root growth inhibition effects of holorganic moder humus layer under spruce (Picea abies Karst.) and beech (Fagus sylvatica L.). Plant Soil 1991, 135, 167–174. [Google Scholar]
- Laposi, R; Veres, S; Meszaros, I. Ecophysiological Investigation of UV-B Tolerance of beech saplings (Fagus sylvatica L.). Acta Silv. Lign. Hung 2008, 4, 7–16. [Google Scholar]
- Mattson, W; Vanhanen, H; Veteli, T; Sivonen, S; Niemela, P. Few immigrant phytophagous insects on woody plants in Europe: legacy of the European crucible? Biol. Invasions 2007, 9, 957–974. [Google Scholar]
- Nickel, H. The Leafhoppers and Planthoppers of Germany (Hemiptera, Auchenorrhyncha): Patterns and Strategies in a Highly Diverse Group of Phytophagous Insects; Pensoft Pub: Sofia, Bulgaria, 2003. [Google Scholar]
- Guckland, A; Brauns, M; Flessa, H; Thomas, FM; Leuschner, C. Acidity, nutrient stocks and organic matter content in soils of a temperate deciduous forest with different abundance of European beech (Fagus sylvatica L.). J. Plant Nutr. Soil Sci 2009, 172, 500–511. [Google Scholar]
- Gossner, M; Engel, H; Blaschke, M. Factors determining the occurrence of Flat Bugs (Aradidae) in beech dominated forests. Waldoekologie Online 2007, 4, 59–89. [Google Scholar]
- Adams, JM; Rehill, B; Zhang, Y; Gower, J. A test of the latitudinal defense hypothesis: Herbivory, tannins and total phenolics in four North American tree species. Ecol. Res 2009, 24, 697–704. [Google Scholar]
- Nicolai, V. The bark of trees: Thermal properties, microclimate and fauna. Oecologia 1986, 69, 148–160. [Google Scholar]


| s/n | Site and Name Codes | Community Type | Co-Dominant and Sub-Dominant-Plant Species |
|---|---|---|---|
| 1 | Aghioneri, Prespa, Mt Triclarion, Greece; Aghioneri_F | Fagus sylvatica monospecific forest | Fagus sylvatica (incl. F. moesiaca) |
| 2 | Aghioneri, Prespa, Mt Triclarion, Greece; Aghioneri_MD | Mixed beech forest with several co-dominant and sub-dominant deciduous tree species | Fagus sylvatica, Quercus frainetto, Q. cerris, Corylus avellana, Acer spp. (pseudoplatanus, campestre, obtusatum, tataricum), Carpinus betulus, C. orientalis, Ostrya carpinifolia; Colutea arborescens, Fraxinus ornus, Juniperus oxydedrus (sparse) |
| 3 | Bellavoda, Prespa, Mt Peristeri, Greece; Bellavoda_mixed beech forest | Mixed beech forest with co-dominance of Abies borisii regis | Fagus sylvatica, Abies borisii regis, Juniperus oxydedrus, Pteridium aquilinum in the openings |
| 4 | Fracto virgin forest, Drama, Greece; Fracto_FQ | Mixed beech forest with oaks | Fagus sylvatica, Quercus frainetto, Q. petraea |
| Plant Tissue Analyzed | Compound or Leaf Type Analyzed* | Bellavoda_MC | Aghioneri_MD | Fracto_FQ | Aghioneri_F |
|---|---|---|---|---|---|
| Bark | catechin | 6.5 (0.5) | 5.5 (0.7) | 5.4 (0.7) | 5.1 (1.4) |
| Bark | cis-coniferin | 45.2 (5.2) | 25.2 (6.0) | 17.1 (2.1) | 18.3 (2.6) |
| Bark | cis-isoconiferin | 61.1 (6.8) | 61.5 (9.6) | 38.1 (7.2) | 36.9 (2.5) |
| Bark | cis-syringin | 62.3 (8.1) | 50.6 (6.0) | 55.3 (15.5) | 33.6 (6.7) |
| Bark | R-glucodistylin | 8.9 (1.8) | 5.4 (0.5) | 4.1 (0.4) | 3.2 (0.3) |
| Bark | S-glucodistylin | 11.1 (1.9) | 5.9 (1.4) | 8.5 (2.1) | 4.9 (0.6) |
| Bark | taxifolin-xylopyranoside | 46.1 (5.4) | 37.0 (4.2) | 20.4 (2.0) | 13.6 (4.4) |
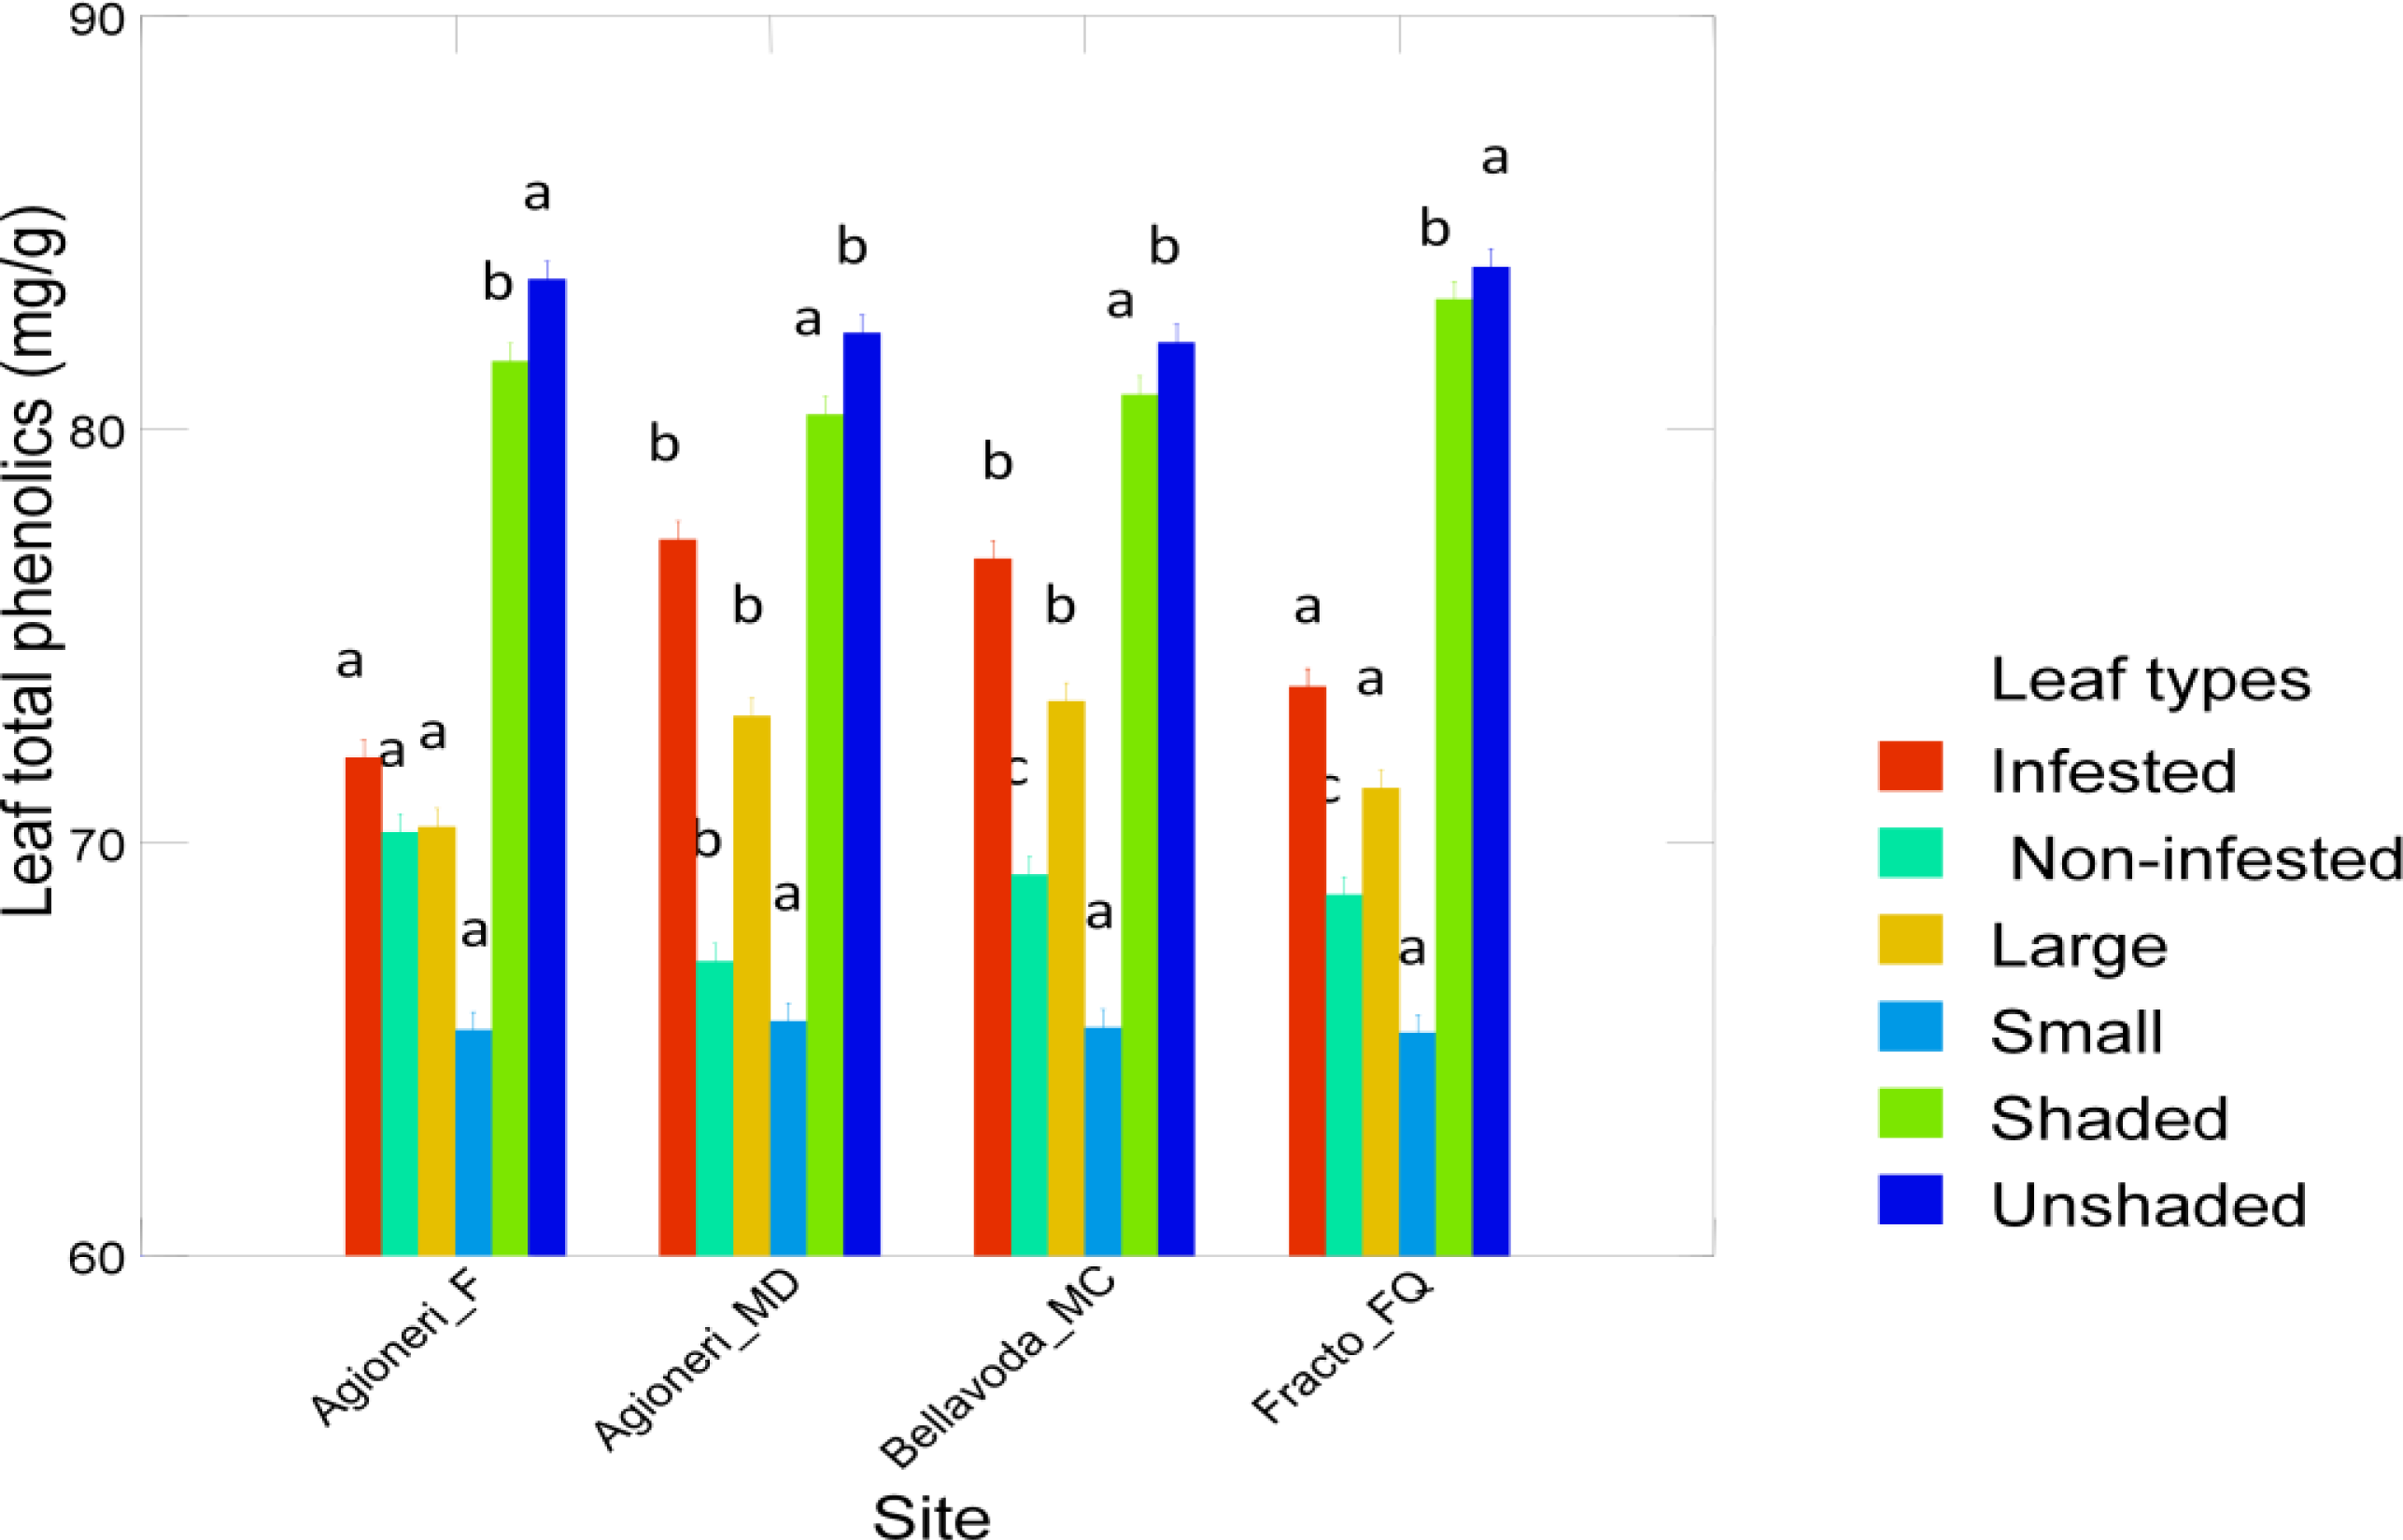
| Leaves | Non infested | 69.2 (1.0) | 67.1 (1.2) | 68.7 (0.5) | 70.3 (0.8) |
| Leaves | Infested | 76.9 (0.7) | 77.3 (1.2) | 73.8 (1.0) | 72.1 (0.9) |
| Leaves | Small | 65.5 (0.9) | 65.7 (0.9) | 65.4 (1.0) | 65.5 (1.2) |
| Leaves | Large | 73.4 (4.0) | 73.1 (5.5) | 71.3 (2.7) | 70.4 (1.7) |
| Leaves | Unshaded | 82.1 (0.8) | 82.3 (0.7) | 83.9 (1.4) | 83.6 (0.6) |
| Leaves | Shaded | 80.8 (0.7) | 80.4 (1.3) | 83.1 (0.6) | 81.6 (1.2) |
| a | Standardized Discriminant Coefficient | |||
|---|---|---|---|---|
| F-statistic* | CDA 1 | CDA 2 | CDA 3 | |
| cis-coniferin | 25.45 | 1.65 | 0.36 | −0.38 |
| catechin | 42.29 | 0.52 | 0.88 | 0.57 |
| cis-isoconiferin | – | – | – | – |
| cis-syringin | 20.44 | 1.64 | 0.27 | −0.46 |
| (2R,3R)-(+)-glucodistylin | 107.85 | −0.30 | −0.96 | 0.71 |
| (2S,3S)-(–)-glucodistylin | – | – | – | – |
| (2R,3R)-taxifolin-3-D-β-xylopyranosid | 30.80 | 0.59 | 0.28 | −0.81 |
| b | Aghioneri_F | Aghioneri_MD | Bellavoda_MC | Fracto_FQ | % Correct |
|---|---|---|---|---|---|
| Aghioneri_F | 5 (4) | 0 | 0 | 0 (1) | 100 (80) |
| Aghioneri_MD | 0 | 5 | 0 | 0 | 100 |
| Bellavoda_MC | 0 | 0 (1) | 5 (4) | 0 | 100 (80) |
| Fracto_FQ | 0 | 0 | 0 | 5 | 100 |
| Total | 5 (4) | 5 (6) | 5 (4) | 5 (6) | 100 (90) |
© 2011 by the authors; licensee MDPI, Basel, Switzerland. This article is an open-access article distributed under the terms and conditions of the Creative Commons Attribution license (http://creativecommons.org/licenses/by/3.0/).
Share and Cite
Petrakis, P.V.; Spanos, K.; Feest, A.; Daskalakou, E. Phenols in Leaves and Bark of Fagus sylvatica as Determinants of Insect Occurrences. Int. J. Mol. Sci. 2011, 12, 2769-2782. https://doi.org/10.3390/ijms12052769
Petrakis PV, Spanos K, Feest A, Daskalakou E. Phenols in Leaves and Bark of Fagus sylvatica as Determinants of Insect Occurrences. International Journal of Molecular Sciences. 2011; 12(5):2769-2782. https://doi.org/10.3390/ijms12052769
Chicago/Turabian StylePetrakis, Panos V., Kostas Spanos, Alan Feest, and Evangelia Daskalakou. 2011. "Phenols in Leaves and Bark of Fagus sylvatica as Determinants of Insect Occurrences" International Journal of Molecular Sciences 12, no. 5: 2769-2782. https://doi.org/10.3390/ijms12052769