Facile Synthesis of Calcium Borate Nanoparticles and the Annealing Effect on Their Structure and Size

 ,
,
Abstract
:1. Introduction
2. Results and Discussion
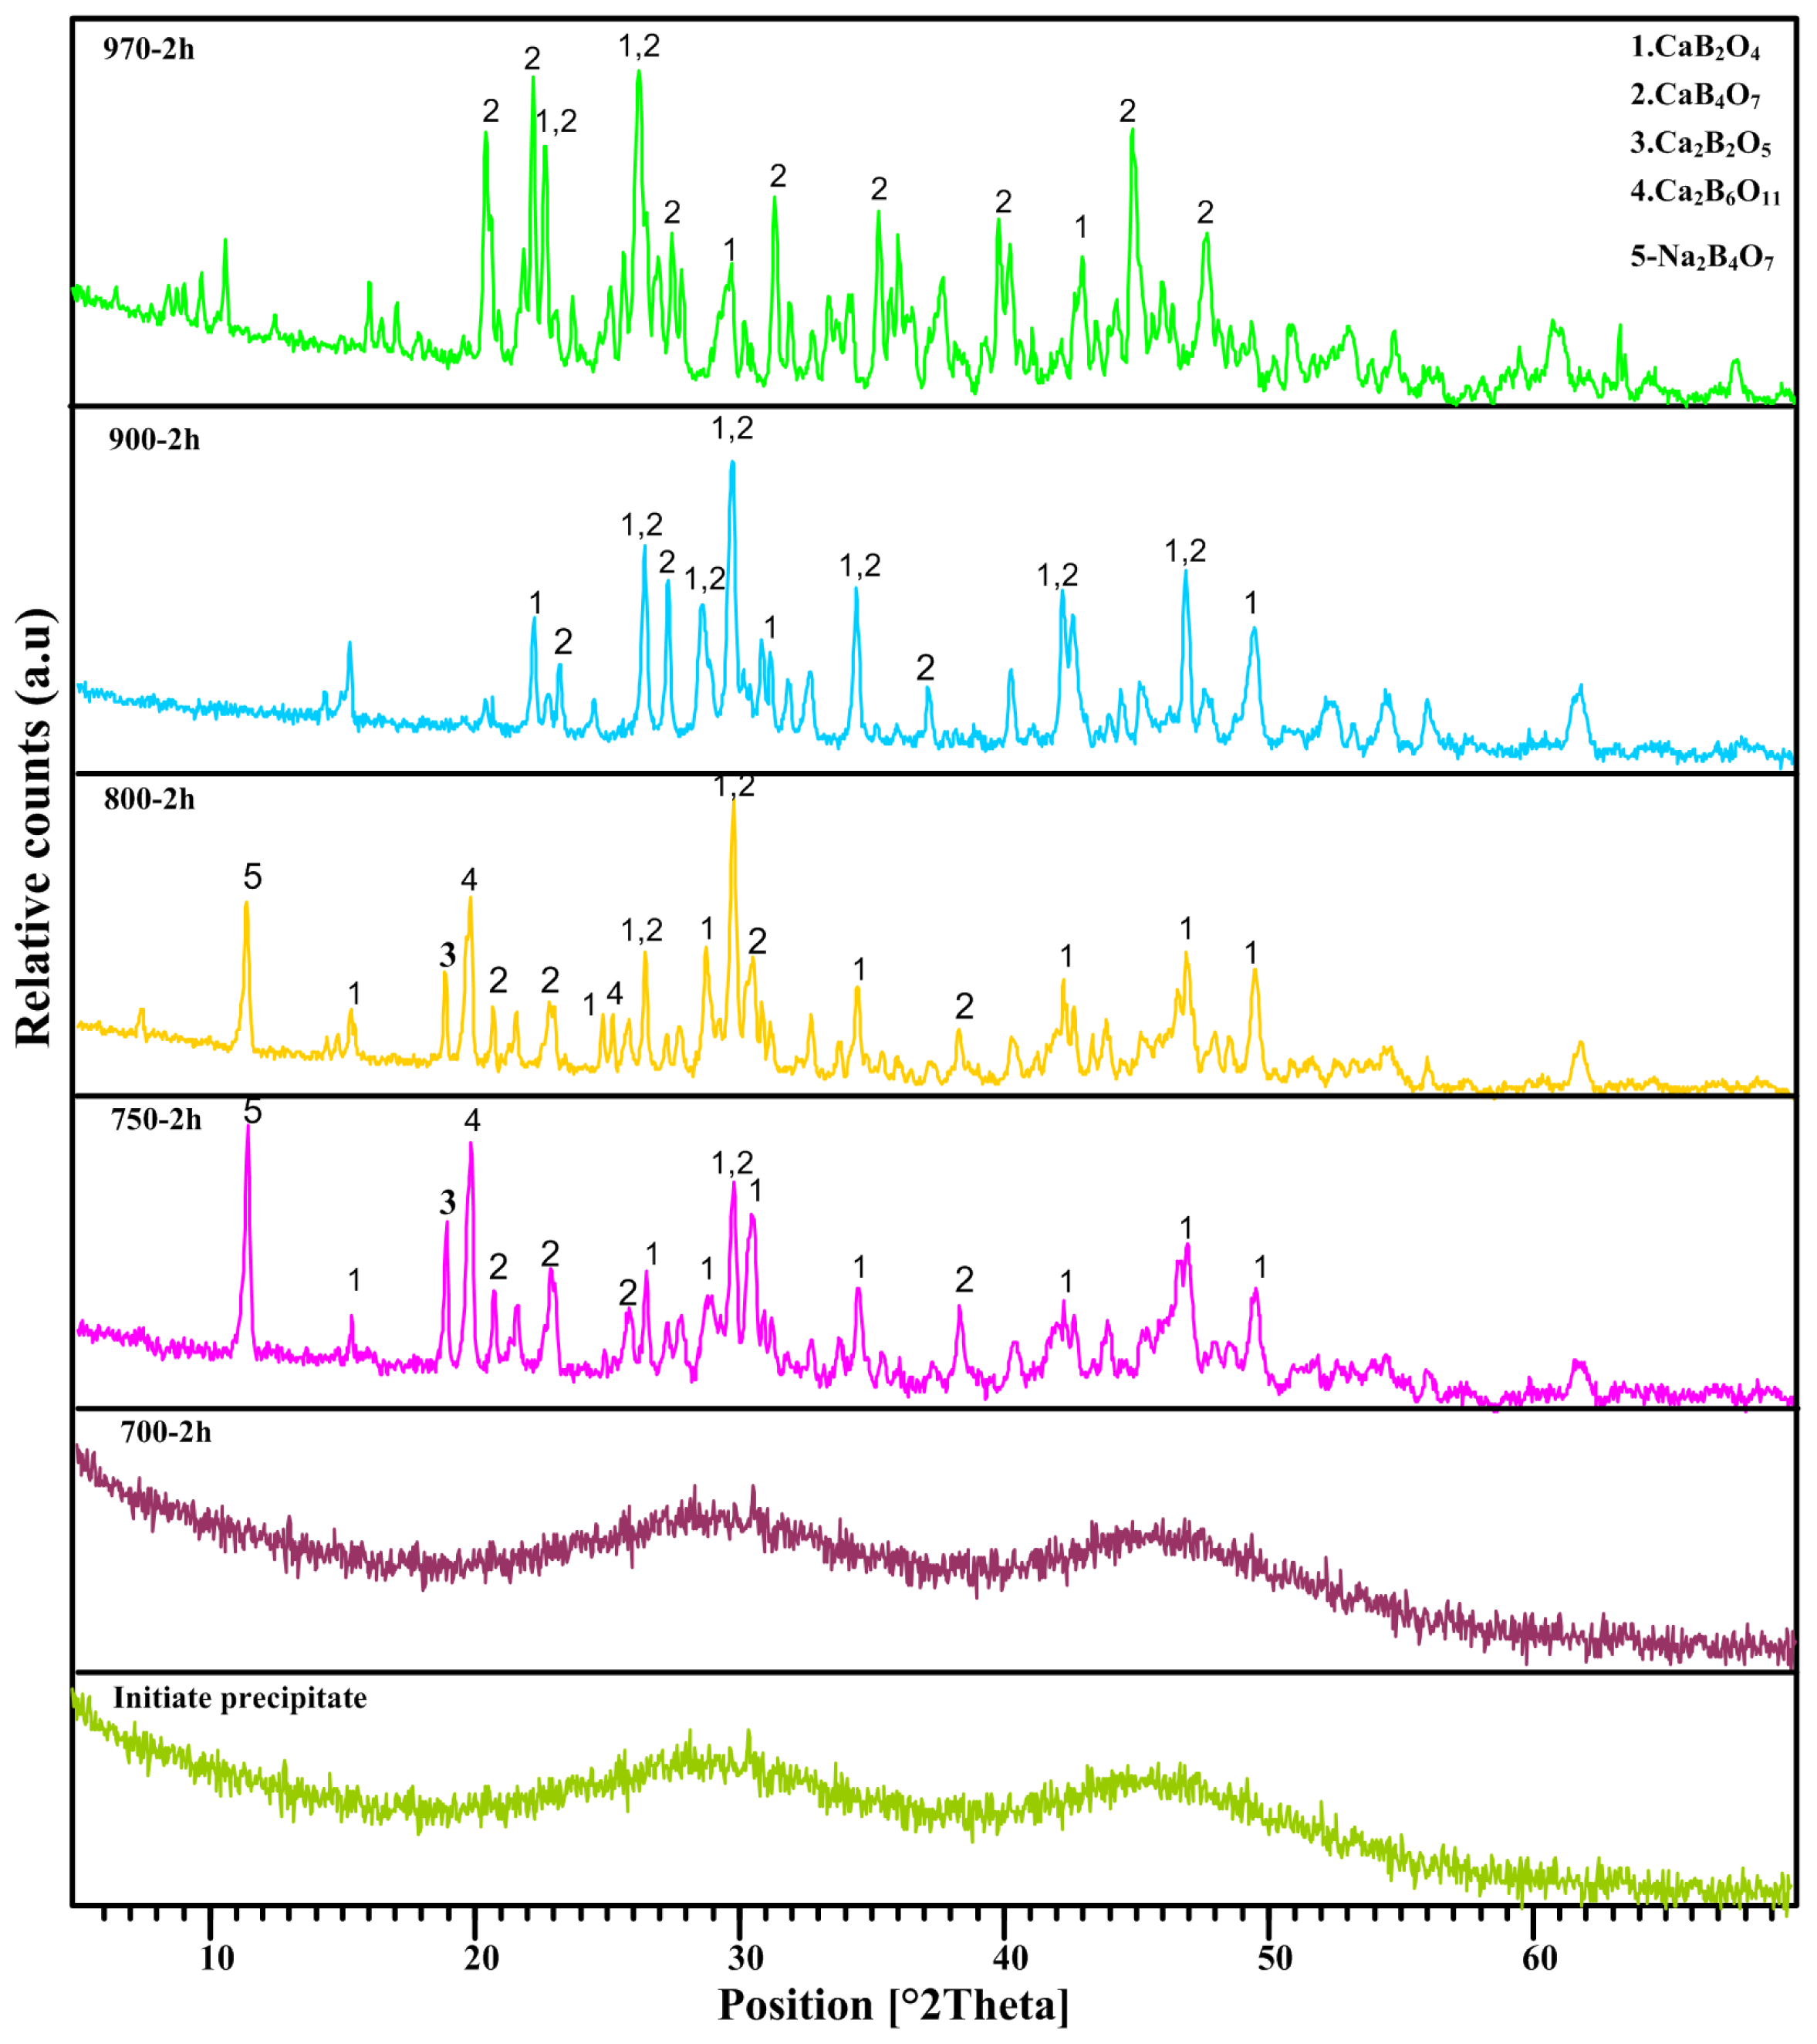
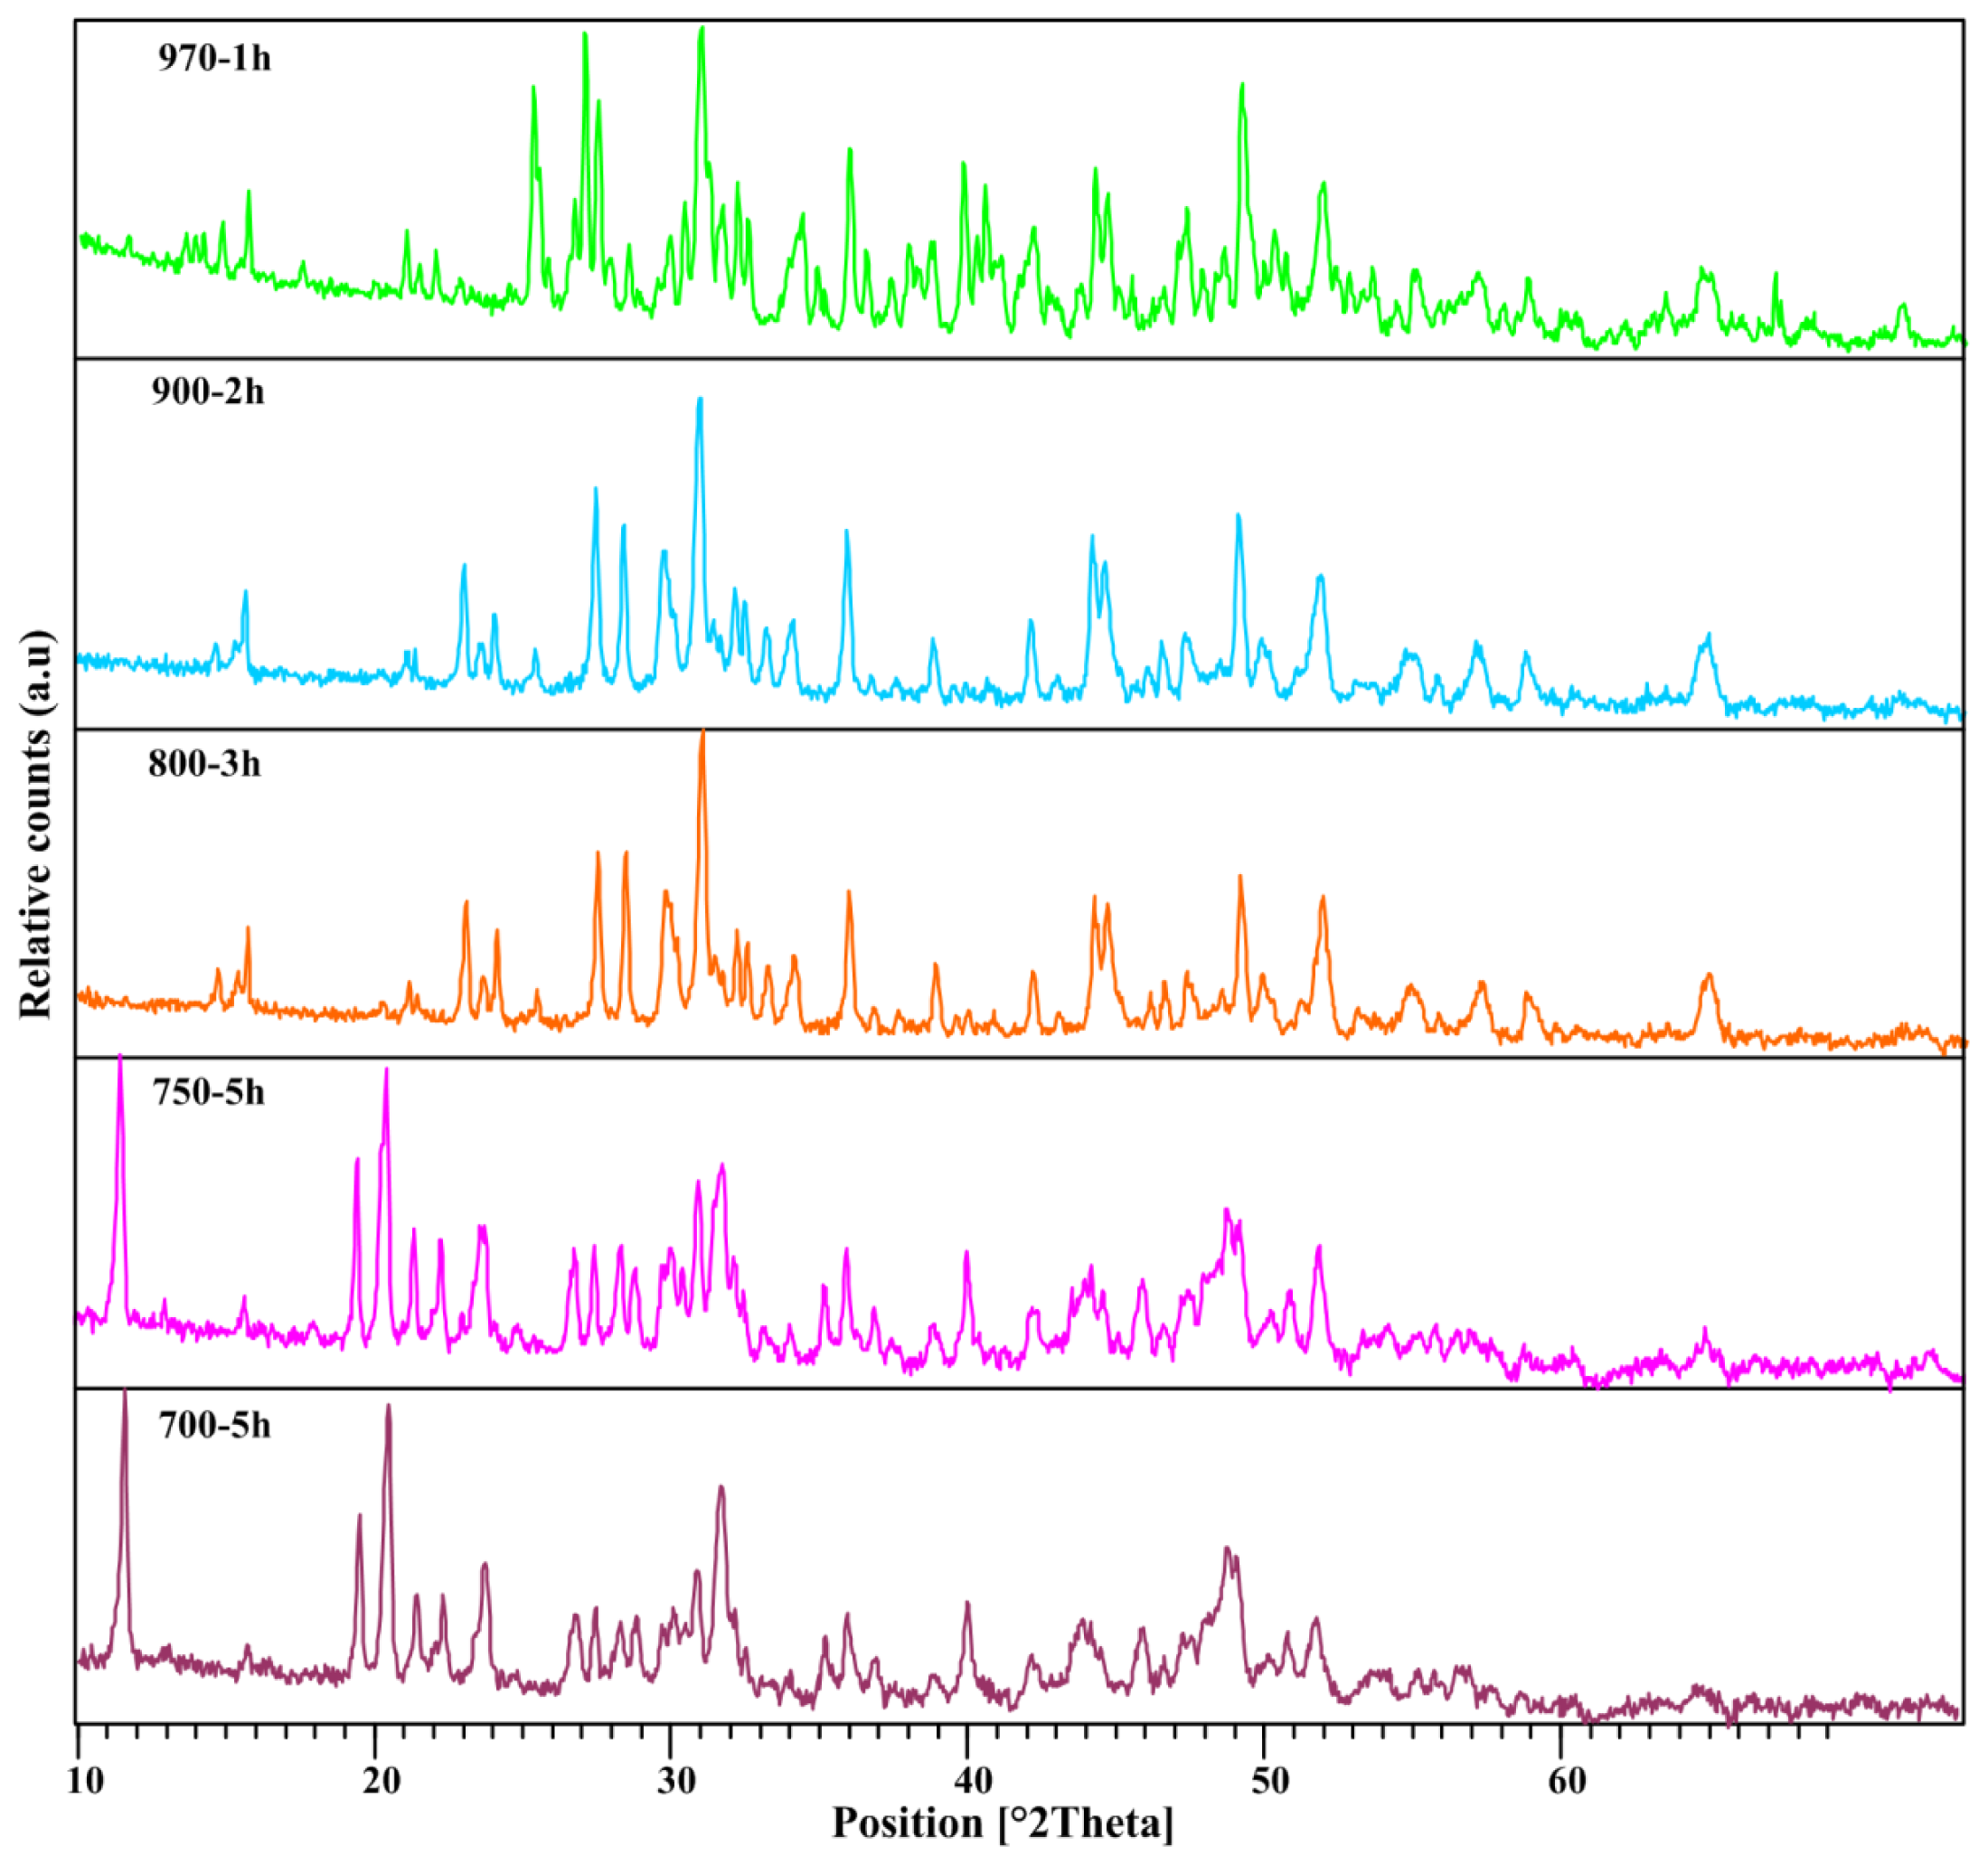
2.1. XRD Analysis
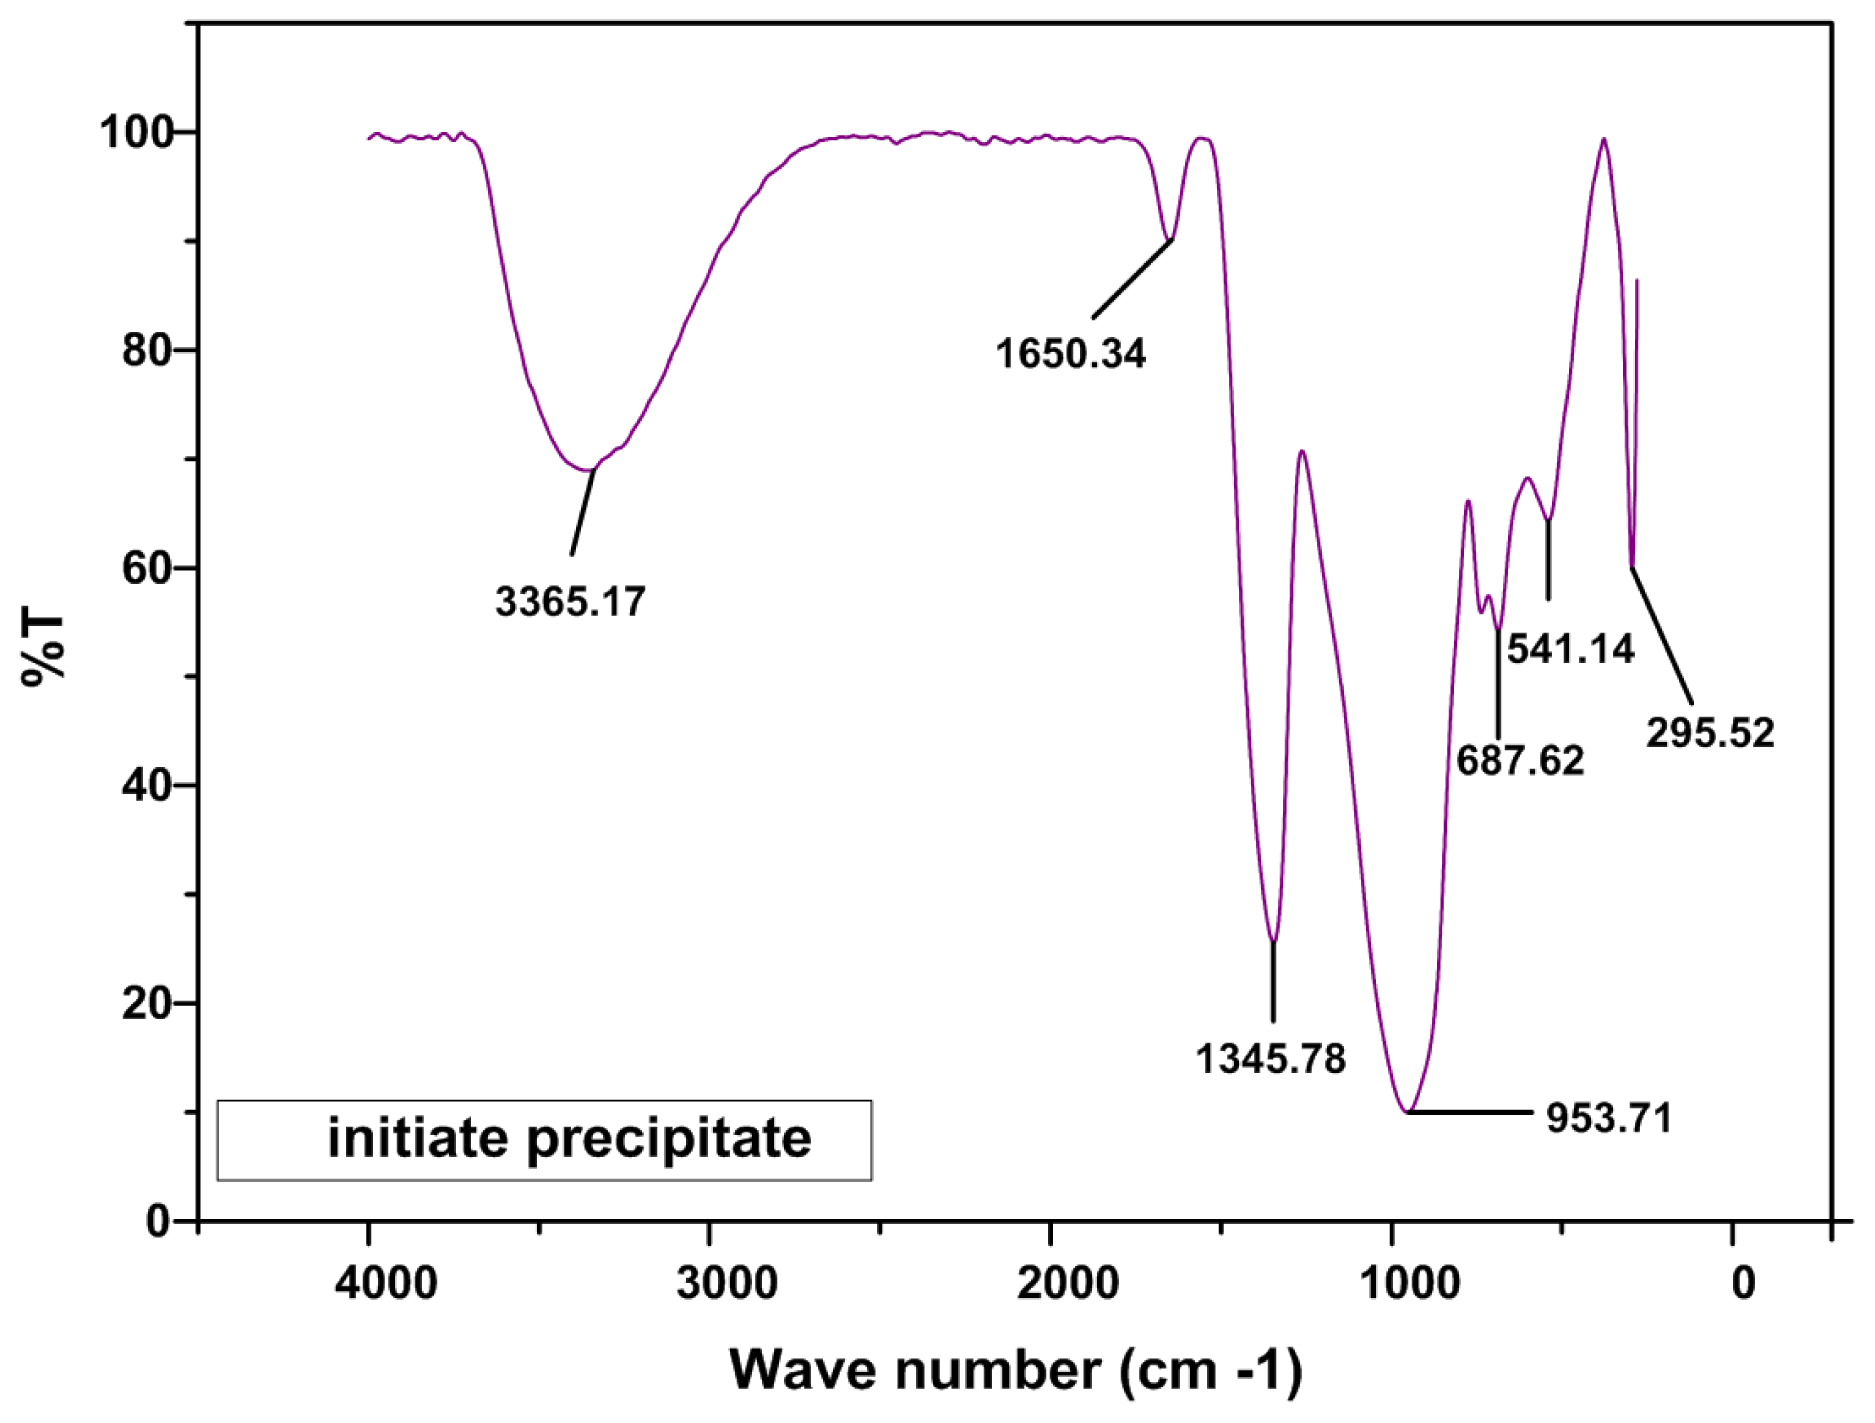
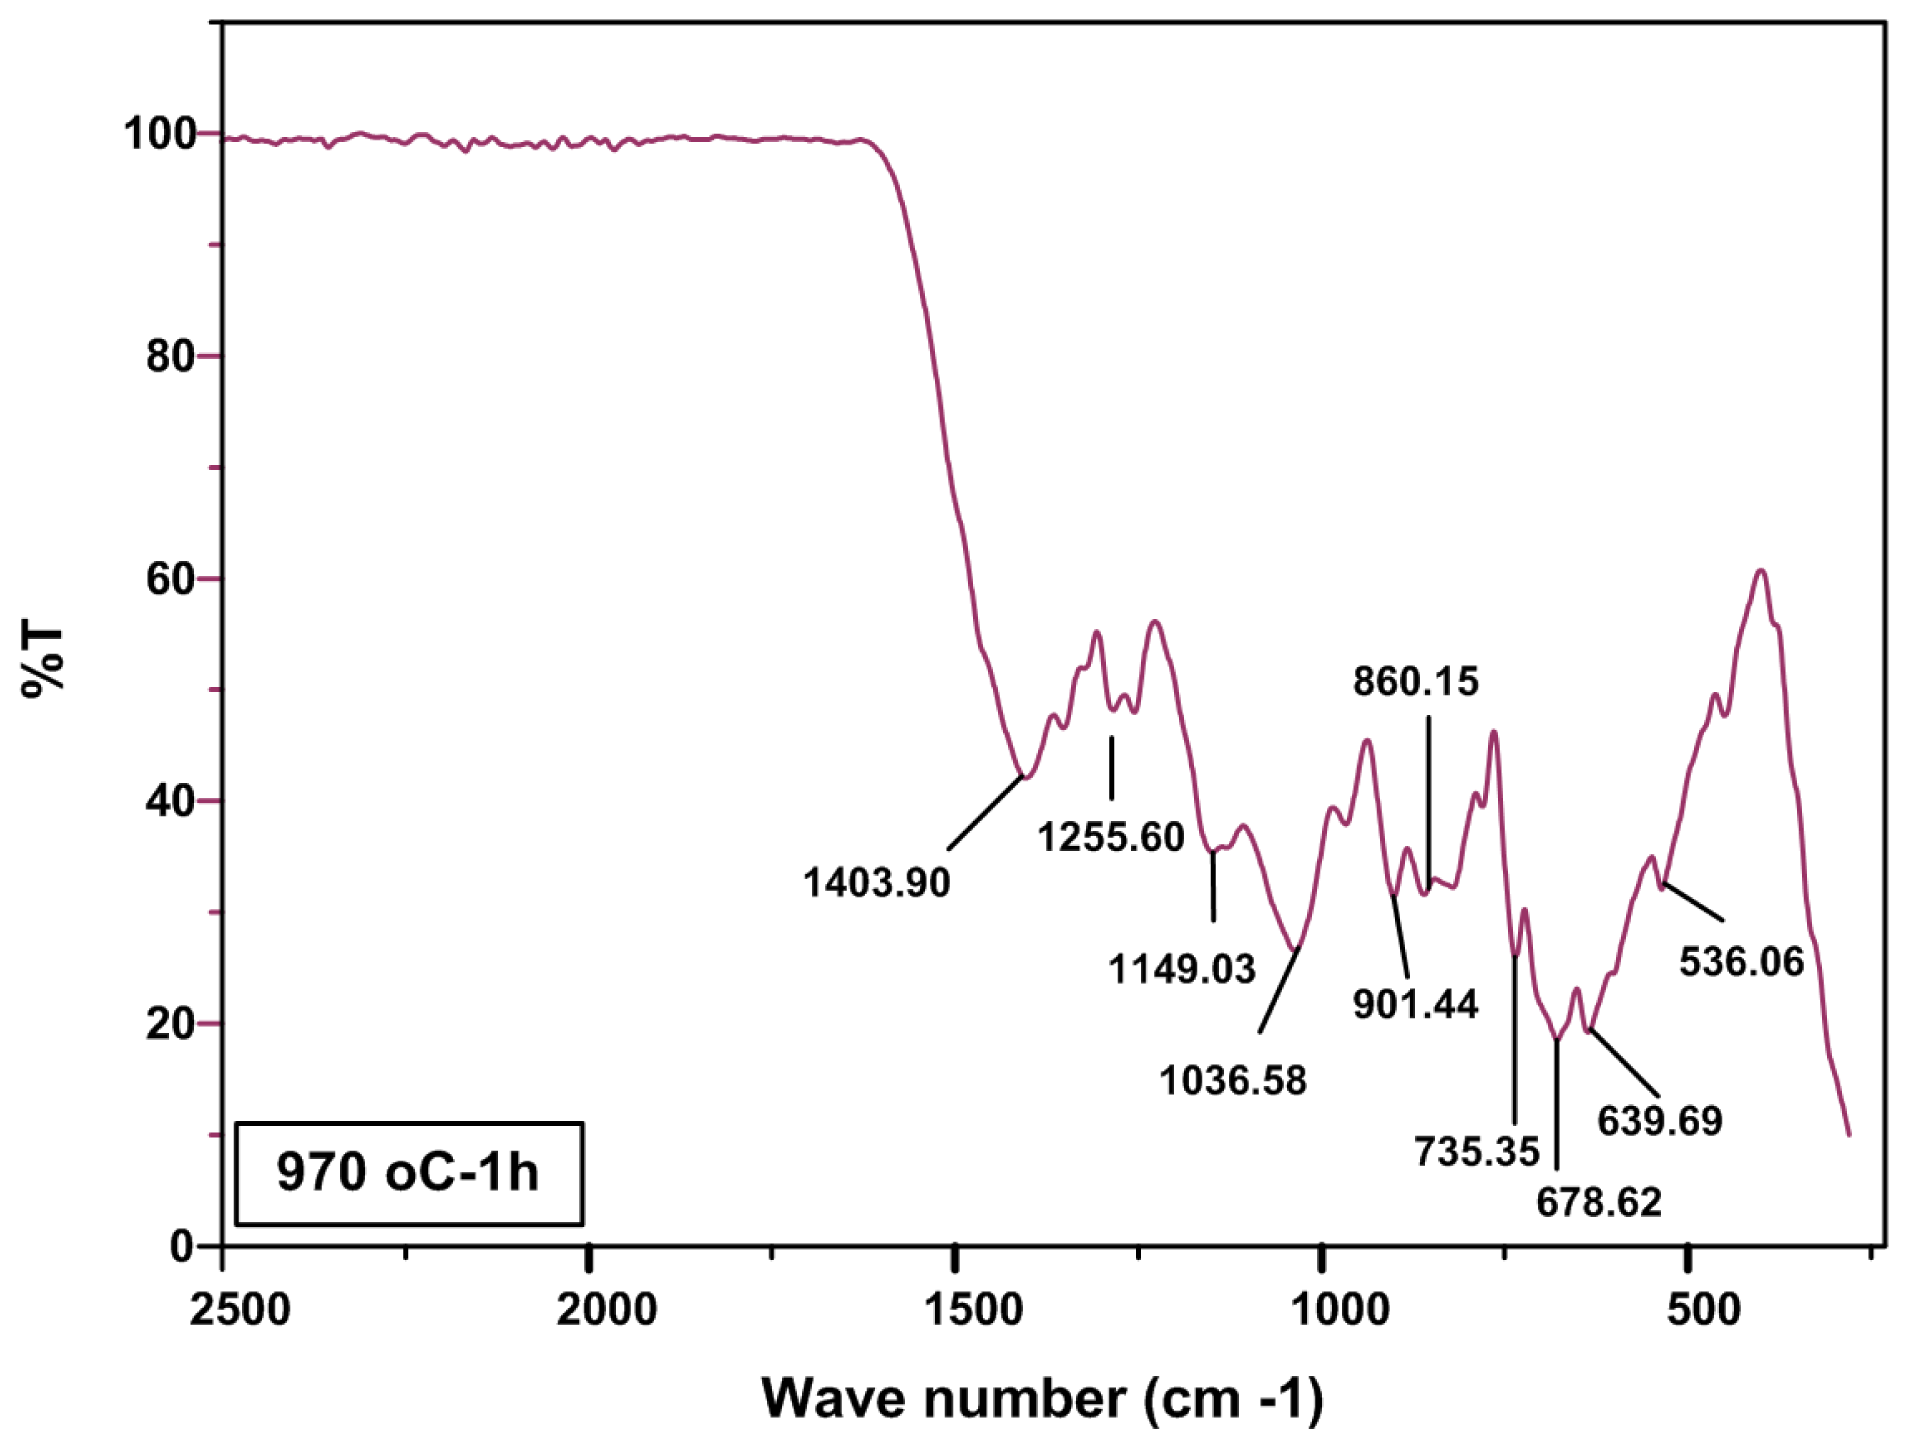
2.2. FTIR Analysis
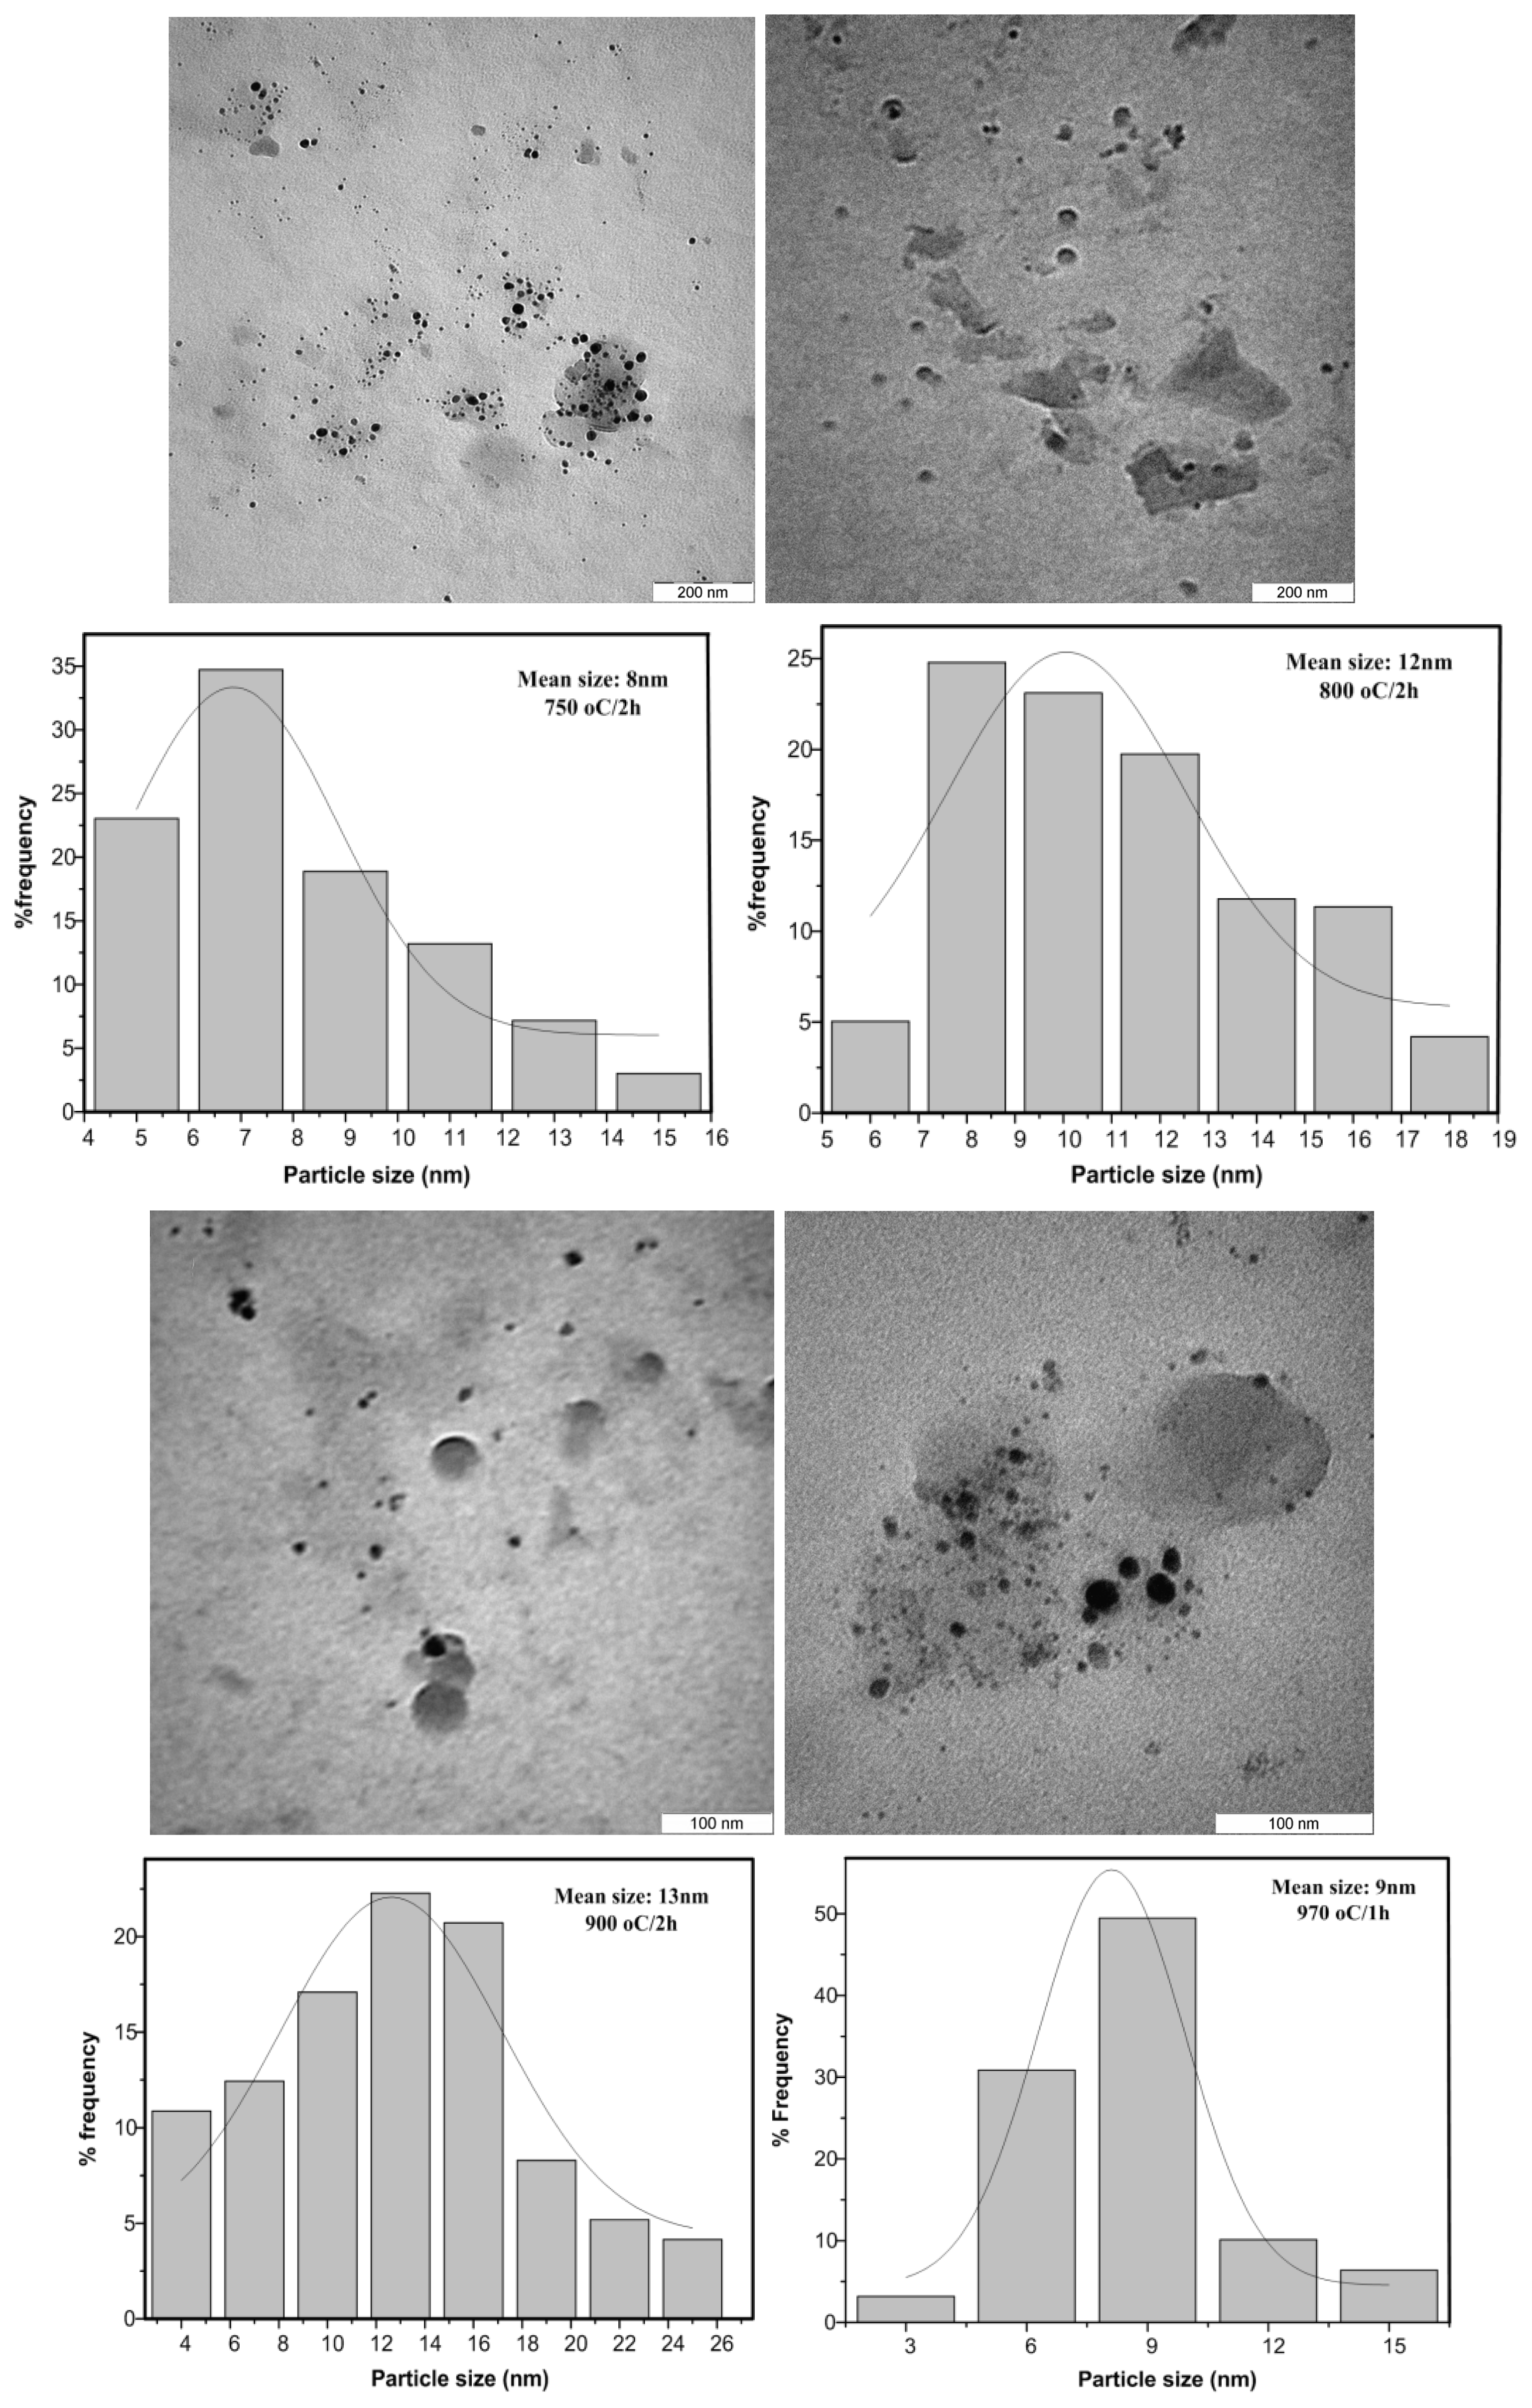
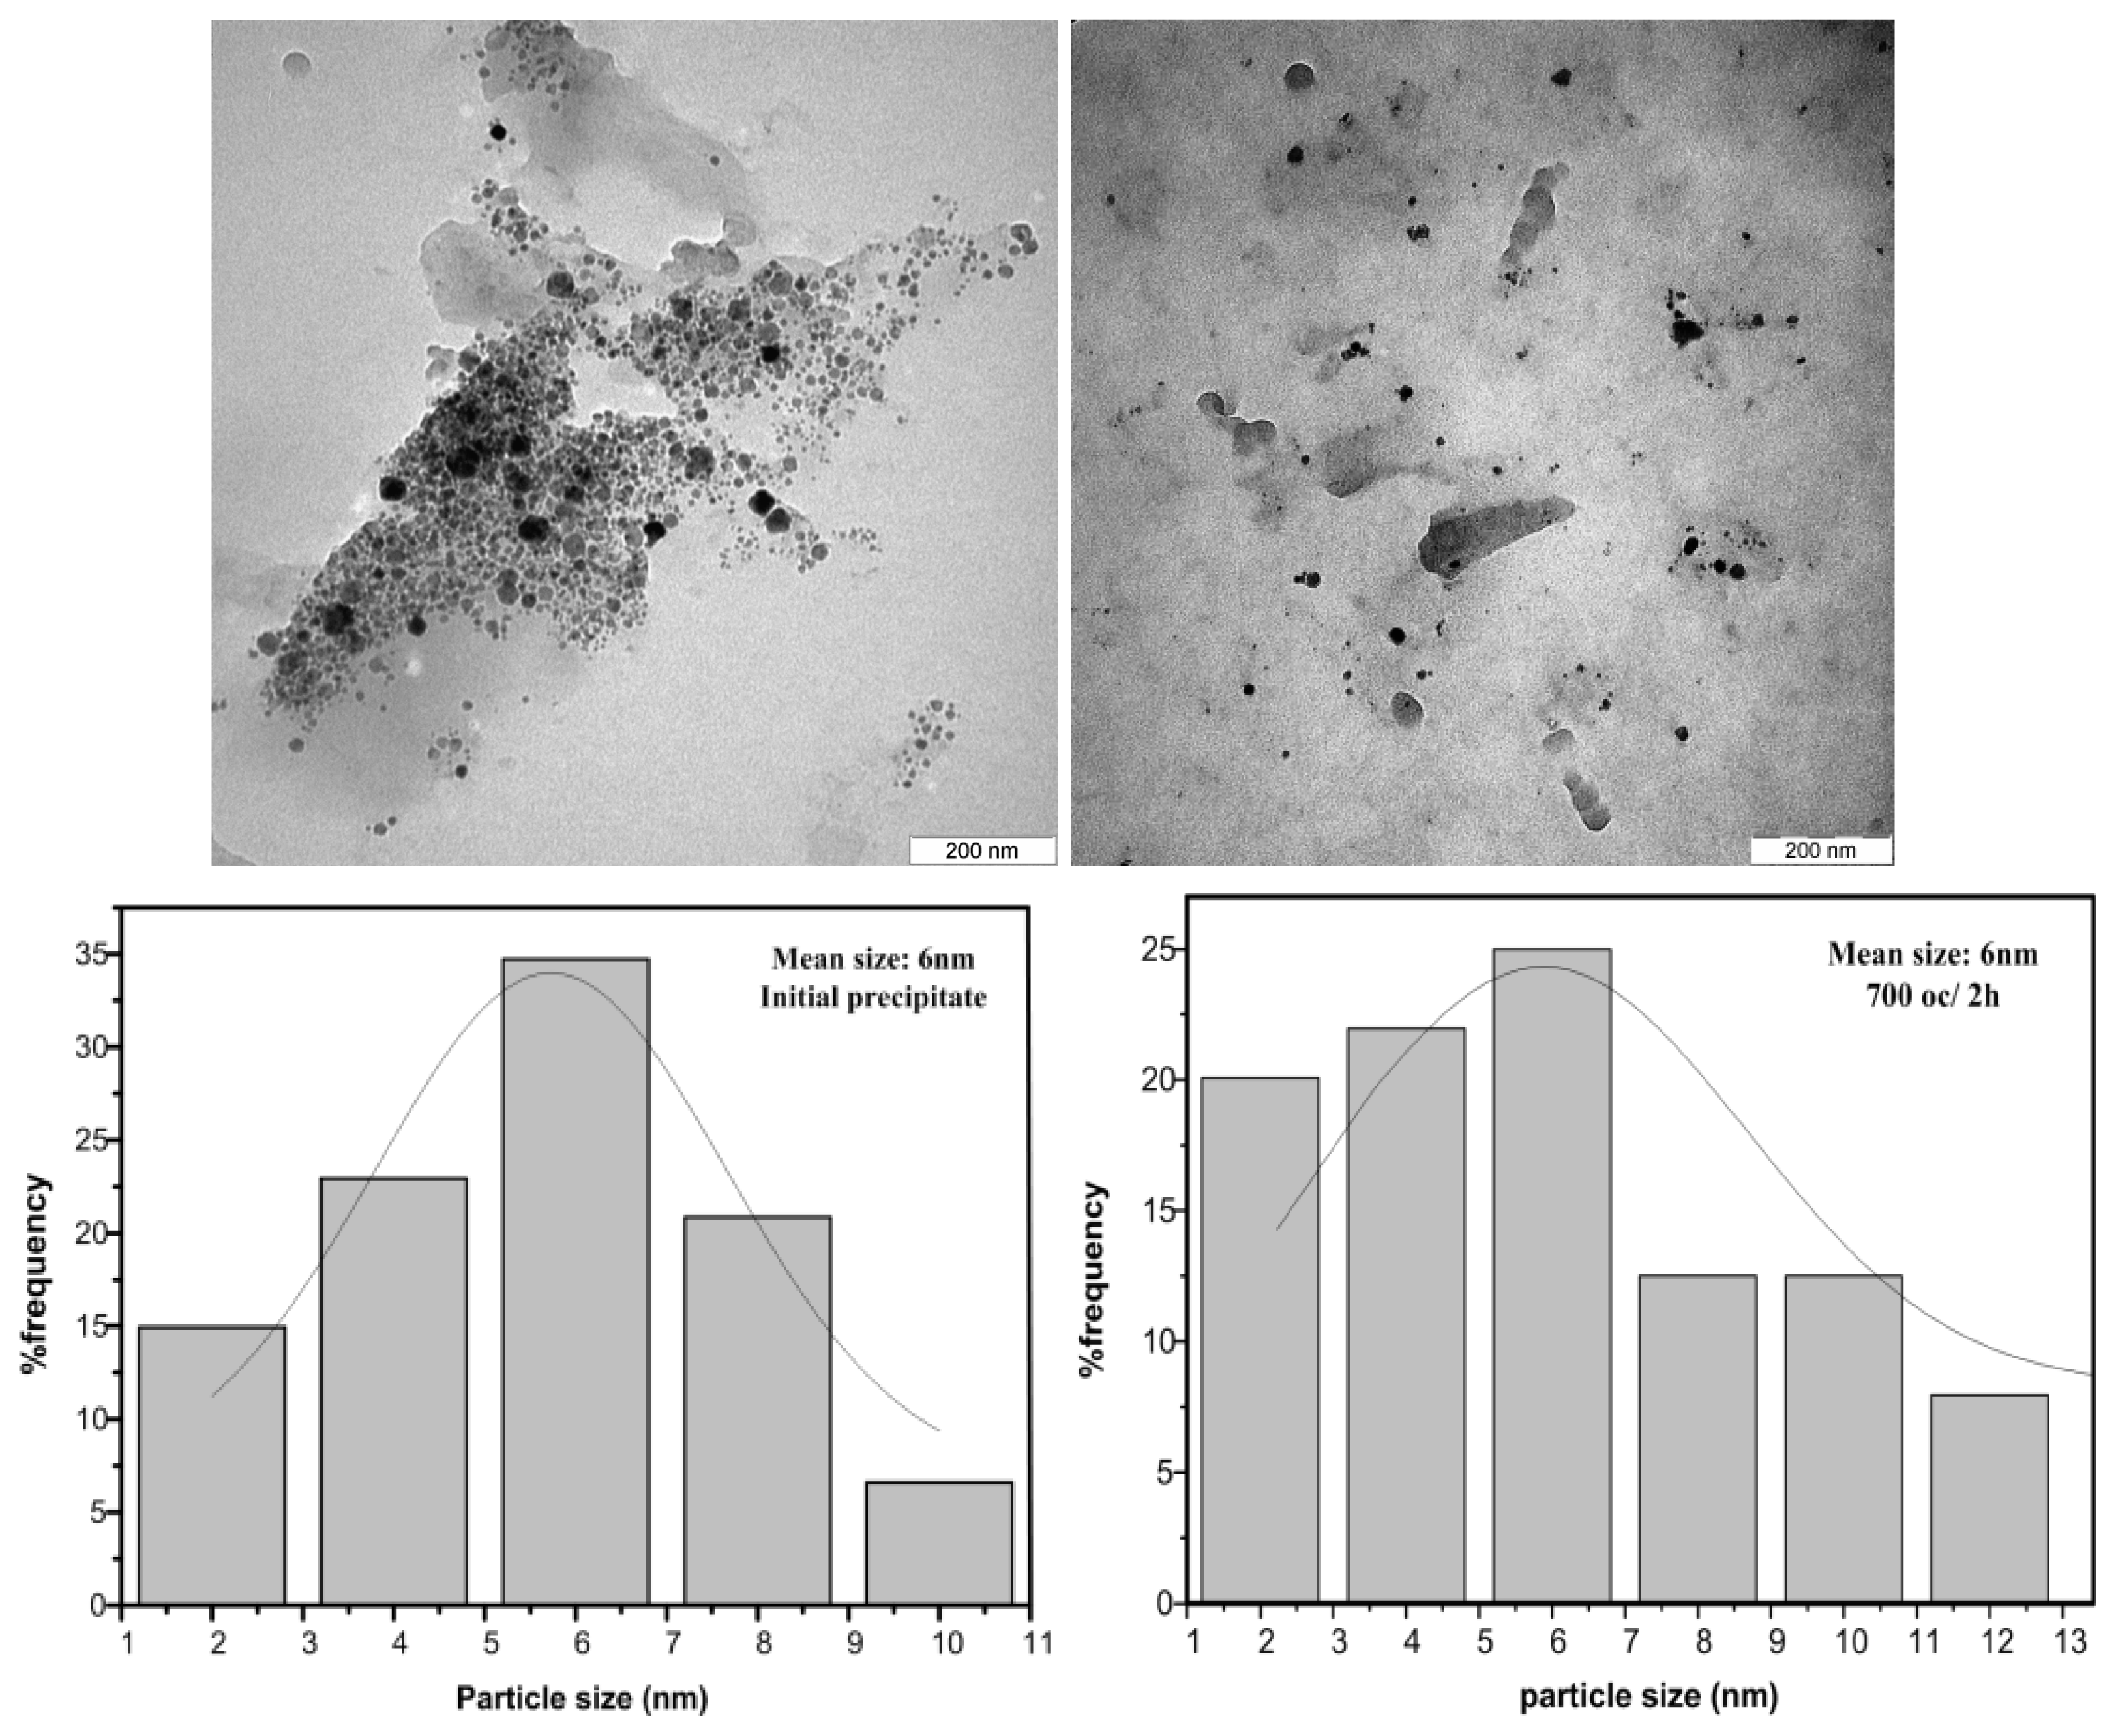
2.3. TEM Results
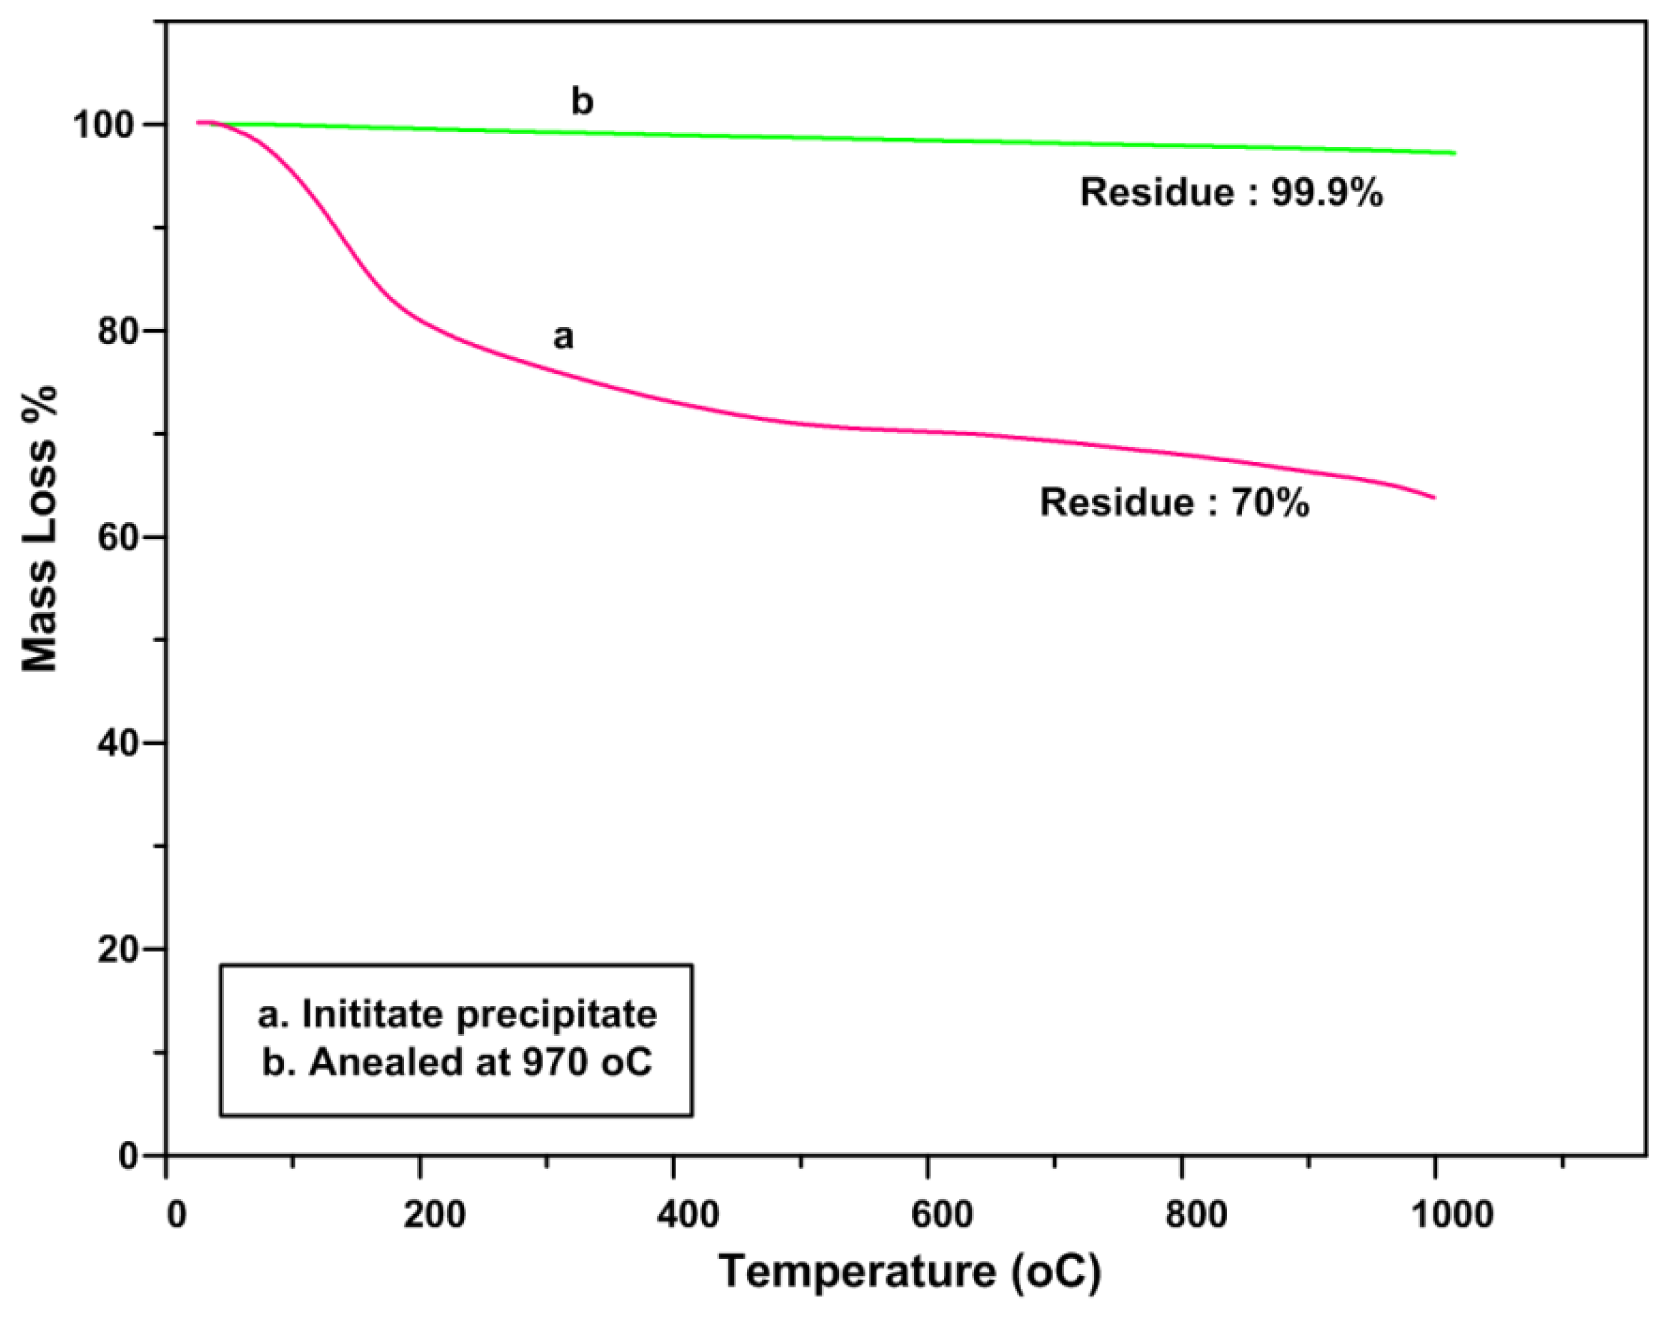
2.4. TGA Analysis (Thermal Stability)
3. Experimental Details
4. Conclusion
Acknowledgments
References
- Fonseca, A.; Franco, N.; Alves, E.; Barradas, N.P.; Leitão, J.P.; Sobolev, N.A.; Banhart, D.F.; Prestinge, H.; Ulyanov, V.V.; Nikiforov, A.I. High resolution backscattering studies of nanostructured magnetic and semiconducting materials. Nucl. Instrum. Methods Phys. Res 2004, 241, 454–458. [Google Scholar]
- Freitas, M.L.L.; Silva, L.P.; Azevedo, R.B.; Garcia, V.A.P.; Lacava, L.M.; Grisólia, C.K.; Lucci, C.M.; Morais, P.C.; da Silva, M.F.; Buske, N.; et al. A double-coated magnetite-based magnetic fluid evaluation by cytometry and genetic tests. J. Magn. Magn. Mater 2002, 252, 396–398. [Google Scholar]
- Kerman, K.; Morita, Y.; Takamura, Y.; Tamiya, E. Escherichia coli single-strand binding protein–DNA interactions on carbon nanotube-modified electrodes from a label-free electrochemical hybridization sensor. Anal. Bioanal. Chem 2005, 381, 1114–1121. [Google Scholar]
- Samori, P. Exploring the nanoscale world with scanning probe microscopies. In Emerging Applications of Radiation Nanotechnology, Proceedings of Emerging Applications of Radiation Nanotechnology, Bologna, Italy, 22–25 March, 2004; IAEA: Vienna, Austria, 2005; pp. 91–97. [Google Scholar]
- Zhu, J.; Zhou, M.; Xu, J.; Liao, X. Preparation of CdS and ZnS nanoparticles using microwave irradiation. Mater. Lett 2001, 47, 25–29. [Google Scholar]
- De la Rosa, E.; Rodrlguez, R.A.; Melendrez, R.; Salas, P.; Diaz-Torres, L.A.; Barboza Flores, M. Thermoluminescence properties of undoped and Tb3+ and Ce3+ doped YAG nanophosphor under UV-, X- and B-ray irradiation. Nucl. Instrum. Meth. Phys. Res 2007, 255, 357–364. [Google Scholar]
- Kortov, V.S. Nanophosphors and outlooks for their use in ionizing radiation detection. Radiat. Meas 2010, 45, 3–6. [Google Scholar]
- Salah, N. Nanocrystalline materials for the dosimetry of heavy charged particles: A review. Radiat. Phys. Chem 2011, 80, 1–10. [Google Scholar]
- Salah, N.; Sahare, P.D.; Rupasov, A.A. Thermoluminescence of nanocrystalline LiF: Mg, Cu, P. J. Lumin 2007, 124, 357–364. [Google Scholar]
- Singh, L.; Chopra, V.; Lochab, S.P. Synthesis and characterization of thermoluminescent Li2B4O7 nanophosphor. J. Lumin 2011, 131, 1177–1183. [Google Scholar]
- Sahare, P.D.; Bakare, J.S.; Dhole, S.D.; Ingale, N.B.; Rupasov, A.A. Synthesis and luminescence properties of nanocrystalline LiF: Mg, Cu, P phosphor. J. Lumin 2010, 130, 258–265. [Google Scholar]
- Lochab, S.P.; Pandey, A.; Sahare, P.D.; Chauhan, R.S.; Salah, N.; Ranjan, R. Nanocrystalline MgB4O7: Dy for high dose measurement of gamma radiation. Phys. Status. Solidi (a) 2007, 204, 2416–2425. [Google Scholar]
- Tekin, E.E.; Ege, A.; Karali, T.; Townsend, P.D.; Prokic, M. Thermoluminescence studies of thermally treated CaB4O7: Dy. Radiat. Meas 2010, 45, 764–767. [Google Scholar]
- Dhage, S.R.; Khollam, Y.B.; Deshpande, S.B.; Ravi, V. Co-precipitation technique for the preparation of nanocrystalline ferroelectric SrBi2Ta2O9. Mater. Res. Bull 2003, 38, 1601–1605. [Google Scholar]
- Gaikwad, S.P.; Dhage, S.R.; Potdar, H.S.; Violet, S.; Ravi, V. Co-Precipitation Method for the Preparation of Nanocrystalline Ferroelectric SrBi2Nb2O9 Ceramics. J. Electroceram 2005, 14, 83–87. [Google Scholar]
- Gaikwad, S.P.; Potdara, H.S.; Violet, S.; Ravi, V. Co-precipitation method for the preparation of fine ferroelectric BaBi2Nb2O9. Ceram. Int 2005, 31, 379–381. [Google Scholar]
- Mona, J.; Kale, S.N.; Gaikwad, A.B.; Murugan, A.V.; Ravi, V. Chemical methods to synthesize FeTiO3 powders. Mater. Lett 2006, 60, 1425–1427. [Google Scholar]
- Vadivel Murugan, A.; Gaikwad, A.B.; Samuel, V.; Ravi, V. A coprecipitation technique to prepare Sr0.5Ba0.5Nb2O6. Bull. Mater. Sci 2006, 29, 221–223. [Google Scholar]
- Villa-Sanchéz, G.; Mendoza-Anaya, D.; Gutiérrez-Wing, C.; Pérez-Hernández, R.; González-Martínez, P.R.; Ángeles-Chavez, C. Ag nanoparticle effects on the thermoluminescent properties of monoclinic ZrO2 exposed to ultraviolet and gamma radiation. Nanotechnology 2007, 18. [Google Scholar] [CrossRef]
- Zahedifar, M.; Sadeghi, E.; Mohebbi, Z. Synthesis and thermoluminescence characteristics of Mn doped CaSO4 nanoparticles. Nucl. Instrum. Methods Phys. Res 2012, 274, 162–166. [Google Scholar]
- Salah, N.; Habib, S.S.; Khan, Z.H.; Al-Hamedi, S.; Lochab, S.P. Nanoparticles of BaSO4:Eu for heavy-dose measurements. J. Lumin 2009, 129, 192–196. [Google Scholar]
- Sahare, P.D.; Ranju, R.; Salah, N.; Lochab, S.P. K3Na(SO4)2: Eu nanoparticles for high dose of ionizing radiation. J. Phys. Appl. Phys 2007, 40, 759–764. [Google Scholar]
- Salah, N.; Sahare, P.D.; Rupasov, A.A. Thermoluminescence of nanocrystalline LiF: Mg, Cu, P. J. Lumin 2007, 124, 357–364. [Google Scholar]
- Salah, N.; Khan, Z.H.; Habib, S.S. Nanoparticles of Al2O3:Cr as a sensitive thermoluminescent material for high exposures of gamma rays irradiations. Nucl. Instrum. Methods Phys. Res 2011, 269, 401–404. [Google Scholar]
- Singh, L.; Chopra, V.; Lochab, S.P. Synthesis and characterization of thermoluminescent Li2B4O7 nanophosphor. J. Lumin 2011, 131, 1177–1183. [Google Scholar]
- Folkerts, H.F.; Blasse, G. Luminescence of Pb2+ in Several Calcium Borates. J. Mater. Chem 1995, 5, 273–276. [Google Scholar]
- Fukuda, Y.; Mizugchi, K.; Takeuchi, N. Thermoluminescence in sintered CaB4O7: Dy and CaB4O7: Eu. Radiat. Prot. Dosimet 1986, 17, 397–401. [Google Scholar]
- Manam, J.; Sharma, S.K. Thermally stimulated luminescence studies of undoped and doped CaB4O7 compounds. Semicond. Phys. Quantum Electron. Optoelectron 2003, 6, 465–470. [Google Scholar]
- Rojas, S.S.; Yukimitu, K.; de Camargo, A.S.S.; Nunes, L.A.O.; Hernandes, A.C. Undoped and calcium doped borate glass system for thermoluminescent dosimeter. J. Non-Cryst. Solids 2006, 352, 3608–3612. [Google Scholar]
- Lakshminarasappa, B.M.; Jayaramaiah, B.N.; Nagabhushana, J.R. Thermoluminescence of combustion synthesized yttrium oxide. Powder Technol 2012, 217, 7–10. [Google Scholar]
- Depci, T.; Ozbayoglu, G.; Yilmaz, A. Comparison of Different Synthesis Methods to Produce Lithium Triborate and Their Effects on Its Thermoluminescent Property. Metall. Mater. Trans. A 2010, 41, 2584–2594. [Google Scholar]
- Manam, J.; Sharma, S.K. Evaluation of trappingparameters of thermally stimulated luminescence glow curves in Cu-doped Li2B4O7 phosphor. J. Radiat. Phys. Chem 2005, 72, 423–427. [Google Scholar]
- Ozdemir, Z.; Ozbayoglu, G.; Aysen, Y. Investigation of thermoluminescence properties of metal oxide doped lithium triborate. J. Mater. Sci 2007, 42, 8501–8508. [Google Scholar]
- Pekpak, E.; Yilmaz, A.; Ozbayoglu, G. The effect of synthesis and doping procedures on thermoluminescenct response of lithium tetraborate. J. Alloy. Comp 2011, 509, 2466–2472. [Google Scholar]
- Naseri, M.G.; Saion, E.; Abbastabar Ahangar, H.; Shaari, A.H.; Hashim, M. Simple Synthesis and Characterization of Cobalt Ferrite Nanoparticles by a Thermal Treatment Method. J. Nanomater. 2010, 2010. [Google Scholar] [CrossRef]
- Sharma, R.; Bisen, D.P.; Dhoble, S.J.; Brahme, N.; Chandra, B.P. Mechanoluminescence and thermoluminescence of Mn doped ZnS nanocrystals. J. Lumin 2011, 131, 2089–2092. [Google Scholar]
- Eastes, W.L. Method for producing calcium borate. U.S. Patent 4,233,051, 1980. [Google Scholar]


| Temperature | Main Diffraction Peaks | h | k | l | Dominate Phase |
|---|---|---|---|---|---|
| 970 °C | 24.42 | 0 | 1 | 2 | CaB4O7 |
| 26.092 | −3 | 1 | 1 | ||
| 26.47 | −2 | 0 | 1 | ||
| 29.75 | 2 | 1 | 0 | ||
| 46.89 | 4 | 3 | 2 | ||
| 900 °C | 26.40 | 1 | 1 | 1 | CaB2O4 |
| 29.75 | 2 | 1 | 0 | ||
| 34.41 | 1 | 3 | 1 | ||
| 42.23 | 0 | 0 | 2 | ||
| 46.85 | 1 | 5 | 1 | ||
| 800 °C | 19.85 | 1 | 0 | 2 | CaB2O4 |
| 29.81 | 2 | 1 | 0 | ||
| 750 °C | 19.85 | 1 | 0 | 2 | CaB2O4 |
| 29.81 | 2 | 1 | 0 |
| Sample | Annealing Temperature (°C) | Annealing Time (h) | TEM Size (nm) | Dominate Phase |
|---|---|---|---|---|
| 1 | 0 | 0 | 6 | Amorphous |
| 2 | 700 | 2 | 6 | Amorphous |
| 3 | 700 | 3 | 9 | Amorphous |
| 4 | 700 | 5 | 13 | CaB2O4 |
| 5 | 750 | 2 | 8 | CaB2O4 |
| 6 | 750 | 3 | 11 | CaB2O4 |
| 7 | 750 | 5 | 15 | CaB2O4 |
| 8 | 800 | 2 | 12 | CaB2O4 |
| 9 | 800 | 3 | 13 | CaB2O4 |
| 10 | 800 | 5 | 15 | CaB2O4 |
| 11 | 900 | 1 | 13 | CaB2O4 |
| 12 | 900 | 2 | 14 | CaB2O4 |
| 14 | 970 | 1 | 9 | CaB4O7 |
| 15 | 970 | 2 | 14 | CaB4O7 |
| Frequencies (cm−1) | Assignment | Reference |
|---|---|---|
| ~685 | B–O–B bending vibration | [29] |
| ~700 | B–O–B bending vibration in borate ring | [29,31,33] |
| 850–1100 | B–O stretching of tetrahydral BO4− | [29,31,33] |
| 600–800 | bending vibrations of various borate | [31,33] |
| ~907 | B–O streching vibration of BO4 units in tri, tetra and pantaborate groups | [29,32] |
| 1400 | B–O stretching trigonal BO3 units | [29,31,33,34] |
© 2012 by the authors; licensee Molecular Diversity Preservation International, Basel, Switzerland. This article is an open-access article distributed under the terms and conditions of the Creative Commons Attribution license (http://creativecommons.org/licenses/by/3.0/).
Share and Cite
Erfani, M.; Saion, E.; Soltani, N.; Hashim, M.; Abdullah, W.S.B.W.; Navasery, M. Facile Synthesis of Calcium Borate Nanoparticles and the Annealing Effect on Their Structure and Size. Int. J. Mol. Sci. 2012, 13, 14434-14445. https://doi.org/10.3390/ijms131114434
Erfani M, Saion E, Soltani N, Hashim M, Abdullah WSBW, Navasery M. Facile Synthesis of Calcium Borate Nanoparticles and the Annealing Effect on Their Structure and Size. International Journal of Molecular Sciences. 2012; 13(11):14434-14445. https://doi.org/10.3390/ijms131114434
Chicago/Turabian StyleErfani, Maryam, Elias Saion, Nayereh Soltani, Mansor Hashim, Wan Saffiey B. Wan Abdullah, and Manizheh Navasery. 2012. "Facile Synthesis of Calcium Borate Nanoparticles and the Annealing Effect on Their Structure and Size" International Journal of Molecular Sciences 13, no. 11: 14434-14445. https://doi.org/10.3390/ijms131114434