Increasing the X-ray Diffraction Power of Protein Crystals by Dehydration: The Case of Bovine Serum Albumin and a Survey of Literature Data


Abstract
:1. Introduction
2. Results and Discussion
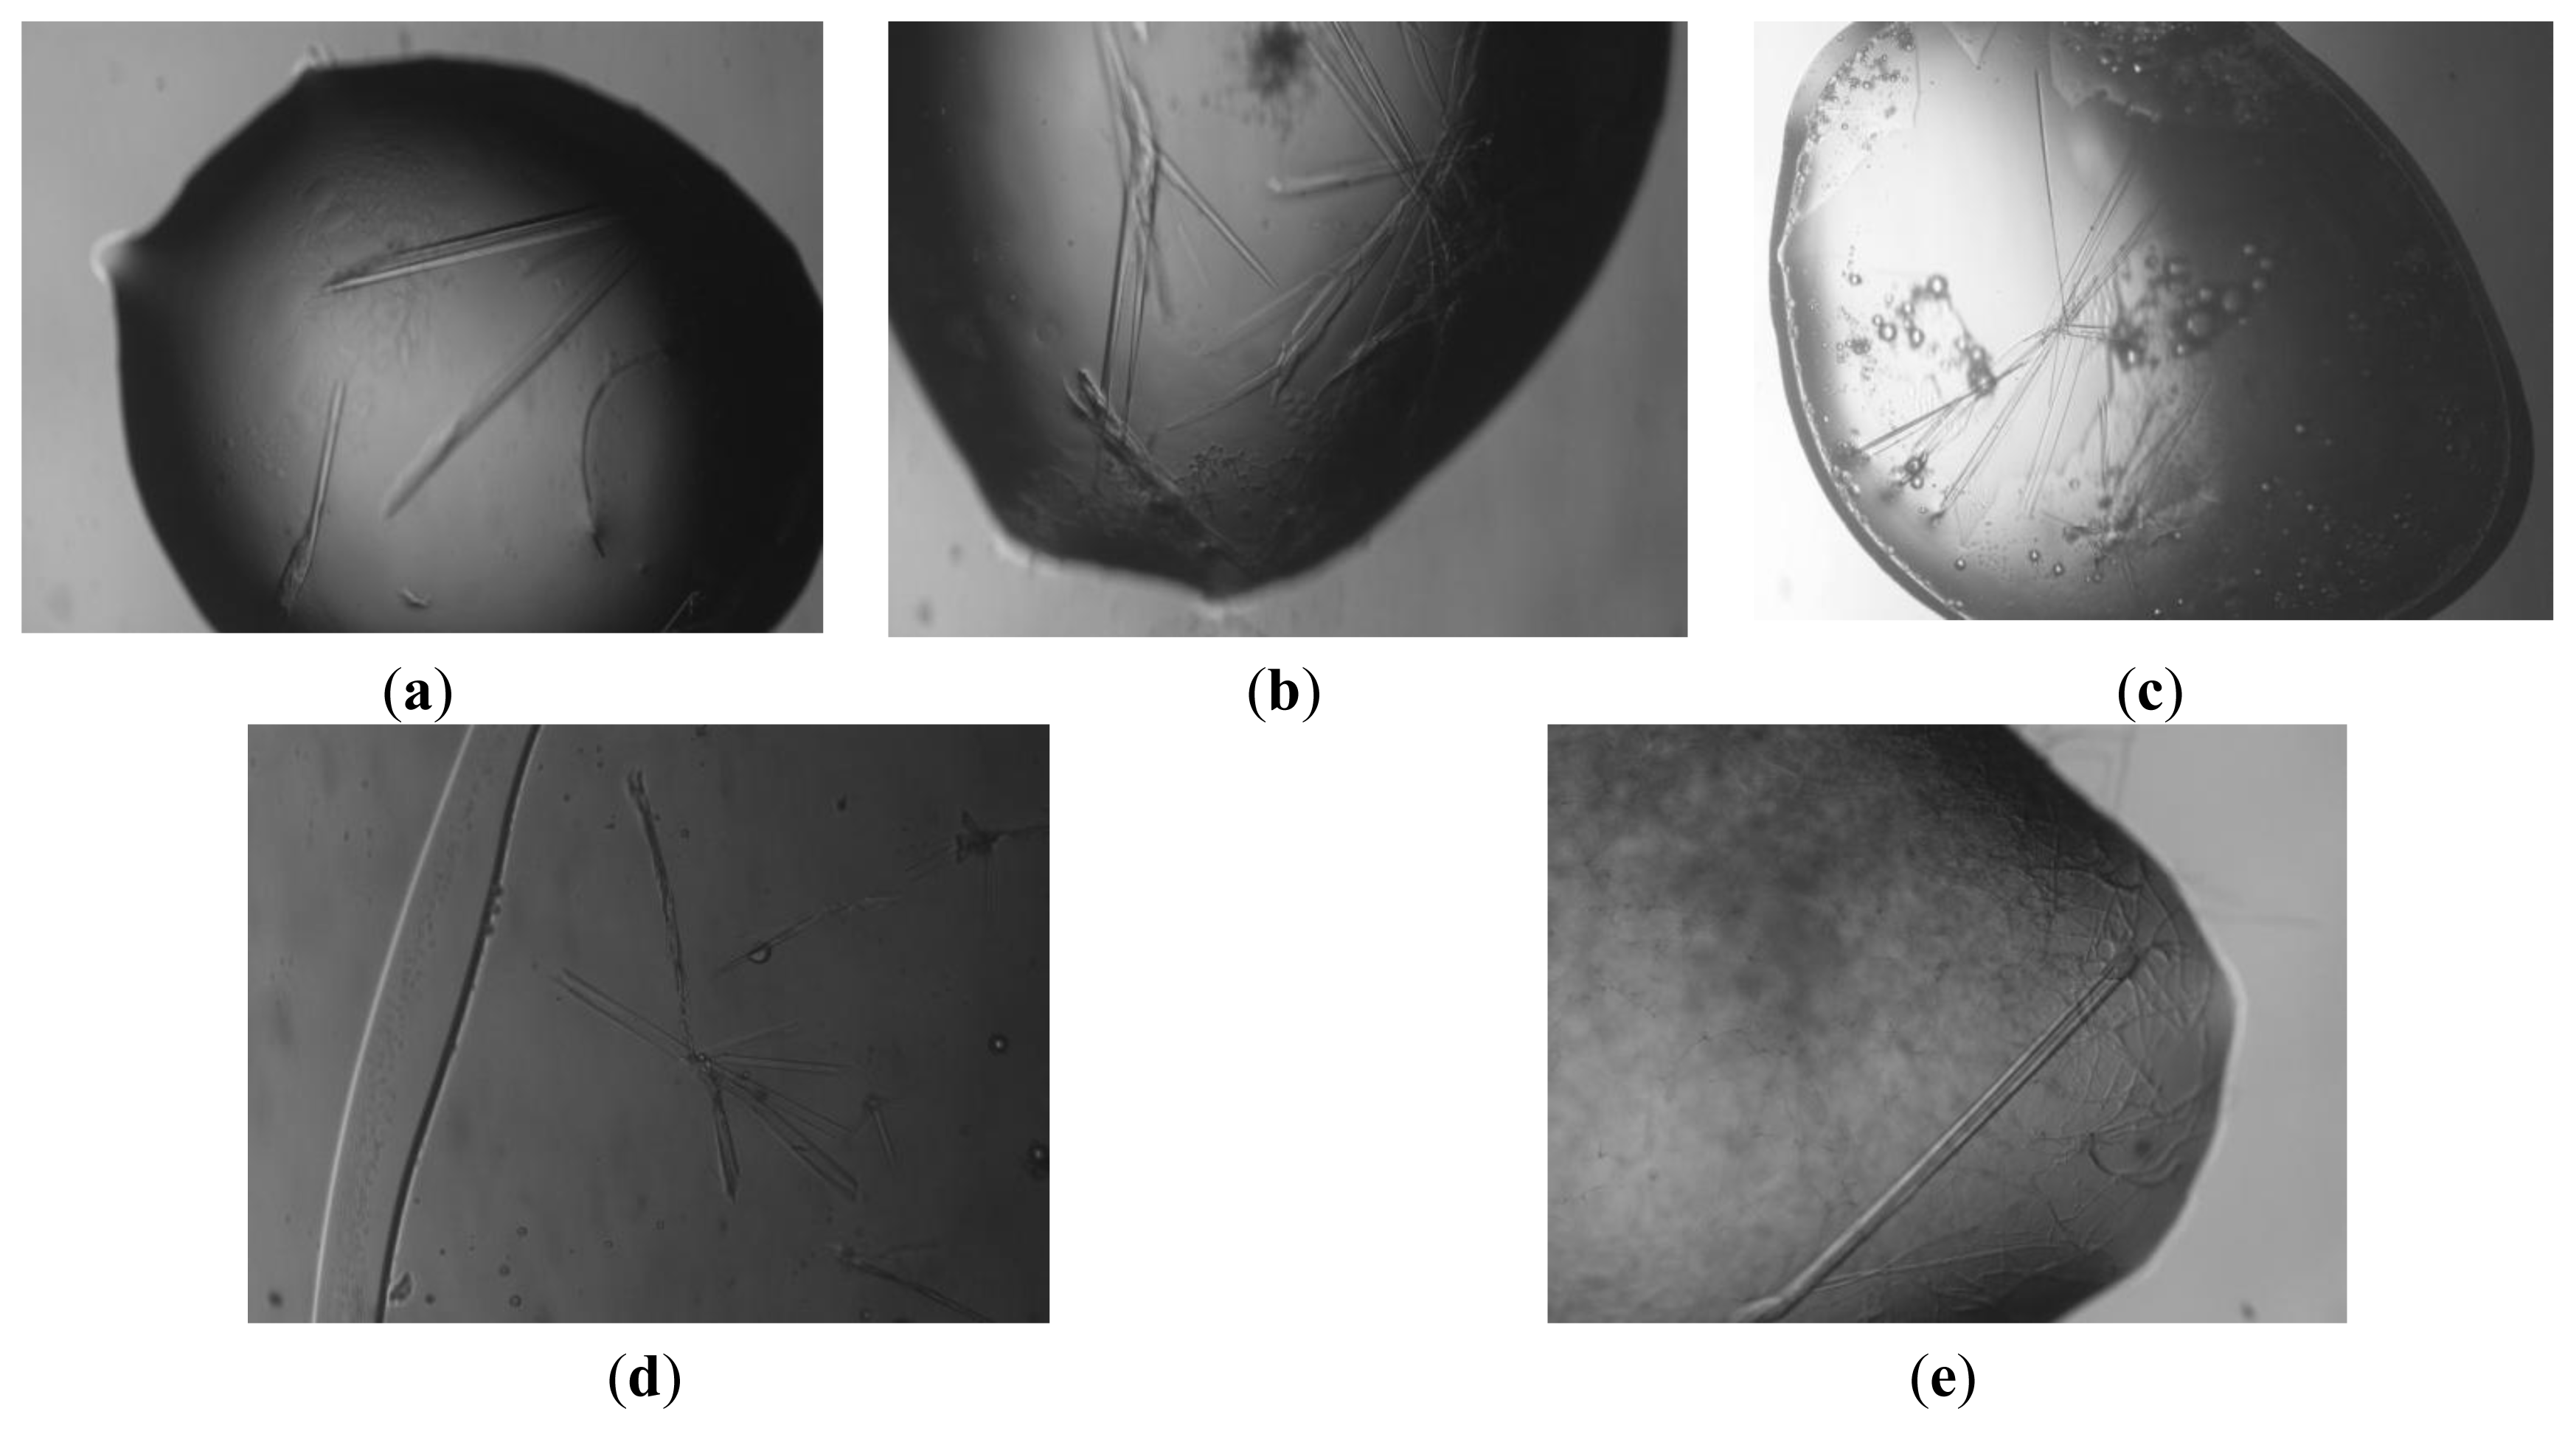
2.1. Crystallization of BSA
3. Experimental Section
3.1. Crystallization of BSA
3.2. Dehydration
3.3. Data collection and Processing
3.4. Structure Determination
4. Conclusions
Acknowledgements
References
- Carter, D.C.; Ho, J.X. Structure of serum albumin. Adv. Protein Chem 1994, 45, 153–203. [Google Scholar]
- Carter, D.C.; He, X.M.; Munson, S.H.; Twigg, P.D.; Gernert, K.M.; Broom, M.B.; Miller, T.Y. Three-dimensional structure of human serum albumin. Science 1989, 244, 1195–1198. [Google Scholar]
- Figge, J.; Rossing, T.H.; Fencl, V. The role of serum proteins in acid-base equilibria. J. Lab. Clin. Med 1991, 117, 453–467. [Google Scholar]
- Sjoholm, I.; Ekman, B.; Kober, A.; Ljungstedt-Pahlman, I.; Seiving, B.; Sjodin, T. Binding of drugs to human serum albumin:XI. The specificity of three binding sites as studied with albumin immobilized in microparticles. Mol. Pharmacol 1979, 16, 767–777. [Google Scholar]
- He, X.M.; Carter, D.C. Atomic structure and chemistry of human serum albumin. Nature 1992, 358, 209–215. [Google Scholar]
- Chakraborty, T.; Chakraborty, I.; Moulik, S.P.; Ghosh, S. Physicochemical and conformational studies on BSA-surfactant interaction in aqueous medium. Langmuir 2009, 25, 3062–3074. [Google Scholar]
- Abou-Zied, O.K.; Al-Shihi, O.I. Characterization of subdomain IIA binding site of human serum albumin in its native, unfolded, and refolded states using small molecular probes. J. Am. Chem. Soc 2008, 130, 10793–10801. [Google Scholar]
- Sadler, P.J.; Tucker, A. pH-induced structural transitions of bovine serum albumin. Histidine pKa values and unfolding of the N-terminus during the N to F transition. Eur. J. Biochem 1993, 212, 811–817. [Google Scholar]
- Peters, T., Jr. Serum albumin. Adv. Protein Chem. 1985, 37, 161–245. [Google Scholar]
- Riley, D.P.; Arndt, U.W. New type of x-ray evidence on the molecular structure of globular proteins. Nature 1952, 169, 138–139. [Google Scholar]
- Doherty, P.; Benedek, G.B. The effect of electric charge on the diffusion of macromolecules. J. Chem. Phys 1974, 61, 5426–5435. [Google Scholar]
- Hughes, W.L. The Proteins; Neurath, H., Biley, K., Eds.; Academic Press: New York NY, USA, 1954; Volume 2b, pp. 663–755. [Google Scholar]
- Bendedouch, D.; Chen, S.H. Structure and interparticle interactions of bovine serum albumin in solution studied by small-angle neutron scattering. J. Phys. Chem 1983, 87, 1473–1477. [Google Scholar]
- Bos, O.J.; Labro, J.F.; Fischer, M.J.; Wilting, J.; Janssen, L.H. The molecular mechanism of the neutral-to-base transition of human serum albumin. Acid/base titration and proton nuclear magnetic resonance studies on a large peptic and a large tryptic fragment of albumin. J. Biol. Chem 1989, 264, 953–959. [Google Scholar]
- Thome, D.M. X-ray Crystallographic Studies of Thiomolybdates and Bovine Serum Albumin. In Ph.D. thesis; Department of Chemistry, University of Saskatchewan: Saskatchewan, Canada, 2001. [Google Scholar]
- Tai, H.C. X-ray Crystallographic Studies of Bovine Serum Albumin and Helicobacter Pylori Thioredoxin-2. In Ph.D. Thesis; Department of Chemistry, University of Saskatchewan: Saskatchewan, Canada, 2004. [Google Scholar]
- Asanov, A.N.; Delucas, L.J.; Oldham, P.B.; Wilson, W.W. Interfacial aggregation of bovine serum albumin related to crystallization conditions studied by total internal reflection fluorescence. J. Colloid Interface Sci 1997, 196, 62–73. [Google Scholar]
- Heras, B.; Martin, J.L. Post-crystallization treatments for improving diffraction quality of protein crystals. Acta Crystallogr. D Biol. Crystallogr 2005, 61, 1173–1180. [Google Scholar]
- Newman, J. A review of techniques for maximizing diffraction from a protein crystal in stilla. Acta Crystallogr. D Biol. Crystallogr 2006, 62, 27–31. [Google Scholar]
- Merlino, A.; Russo Krauss, I.; Albino, A.; Pica, A.; Vergara, A.; Masullo, M.; De Vendittis, E.; Sica, F. Improving protein crystal quality by the without-oil microbatch method: Crystallization and preliminary x-ray diffraction analysis of glutathione synthetase from pseudoalteromonas haloplanktis. Int. J. Mol. Sci 2011, 12, 6312–6319. [Google Scholar]
- Harp, J.M.; Timm, D.E.; Bunick, G.J. Macromolecular crystal annealing: Overcoming increased mosaicity associated with cryocrystallography. Acta Crystallogr. D Biol. Crystallogr 1998, 54, 622–628. [Google Scholar]
- Kriminski, S.; Caylor, C.L.; Nonato, M.C.; Finkelstein, K.D.; Thorne, R.E. Flash-cooling and annealing of protein crystals. Acta Crystallogr. D Biol. Crystallogr 2002, 58, 459–471. [Google Scholar]
- Cramer, P.; Bushnell, D.A.; Fu, J.; Gnatt, A.L.; Maier-Davis, B.; Thompson, N.E.; Burgess, R.R.; Edwards, A.M.; David, P.R.; Kornberg, R.D. Architecture of RNA polymerase II and implications for the transcription mechanism. Science 2000, 288, 640–649. [Google Scholar]
- Heras, B.; Edeling, M.A.; Byriel, K.A.; Jones, A.; Raina, S.; Martin, J.L. Dehydration converts DsbG crystal diffraction from low to high resolution. Structure 2003, 11, 139–145. [Google Scholar]
- Abergel, C. Spectacular improvement of X-ray diffraction through fast desiccation of protein crystals. Acta Crystallogr. D Biol. Crystallogr 2004, 60, 1413–1416. [Google Scholar]
- Russi, S.; Juers, D.H.; Sanchez-Weatherby, J.; Pellegrini, E.; Mossou, E.; Forsyth, V.T.; Huet, J.; Gobbo, A.; Felisaz, F.; Moya, R.; et al. Inducing phase changes in crystals of macromolecules: Status and perspectives for controlled crystal dehydration. J. Struct. Biol 2011, 175, 236–243. [Google Scholar]
- Van Hoorebeke, A.; Stout, J.; Van der Meeren, R.; Kyndt, J.; Van Beeumen, J.; Savvides, S.N. Crystallization and X-ray diffraction studies of inverting trehalose phosphorylase from Thermoanaerobacter sp. Acta Crystallogr. Sect. F Struct. Biol. Cryst. Commun 2010, 66, 442–447. [Google Scholar]
- Pang, S.S.; Guddat, L.W.; Duggleby, R.G. Crystallization of the FAD-independent acetolactate synthase of Klebsiella pneumoniae. Acta Crystallogr. D Biol. Crystallogr 2002, 58, 1237–1239. [Google Scholar]
- Sam, M.D.; Abbani, M.A.; Cascio, D.; Johnson, R.C.; Clubb, R.T. Crystallization, dehydration and preliminary X-ray analysis of excisionase (Xis) proteins cooperatively bound to DNA. Acta Crystallogr. Sect. F Struct. Biol. Cryst. Commun 2006, 62, 825–828. [Google Scholar]
- Arakaki, T.L.; Pezza, J.A.; Cronin, M.A.; Hopkins, C.E.; Zimmer, D.B.; Tolan, D.R.; Allen, K.N. Structure of human brain fructose 1,6-(bis)phosphate aldolase: linking isozyme structure with function. Protein Sci 2004, 13, 3077–3084. [Google Scholar]
- Malay, A.D.; Allen, K.N.; Tolan, D.R. Structure of the thermolabile mutant aldolase B, A149P: Molecular basis of hereditary fructose intolerance. J. Mol. Biol 2005, 347, 135–144. [Google Scholar]
- Igura, M.; Ose, T.; Obita, T.; Sato, C.; Maenaka, K.; Endo, T.; Kohda, D. Crystallization and preliminary X-ray analysis of mitochondrial presequence receptor Tom20 in complexes with a presequence from aldehyde dehydrogenase. Acta Crystallogr. Sect. F Struct. Biol. Cryst. Commun 2005, 61, 514–517. [Google Scholar]
- Bailly, M.; Blaise, M.; Lorber, B.; Thirup, S.; Kern, D. Isolation, crystallization and preliminary X-ray analysis of the transamidosome, a ribonucleoprotein involved in asparagine formation. Acta Crystallogr. Sect. F Struct. Biol. Cryst. Commun 2009, 65, 577–581. [Google Scholar]
- Wojdyla, J.A.; Manolaridis, I.; Snijder, E.J.; Gorbalenya, A.E.; Coutard, B.; Piotrowski, Y.; Hilgenfeld, R.; Tucker, P.A. Structure of the X (ADRP) domain of nsp3 from feline coronavirus. Acta Crystallogr. D Biol. Crystallogr 2009, 65, 1292–1300. [Google Scholar]
- Tsukazaki, T.; Mori, H.; Fukai, S.; Numata, T.; Perederina, A.; Adachi, H.; Matsumura, H.; Takano, K.; Murakami, S.; Inoue, T.; et al. Purification, crystallization and preliminary X-ray diffraction of SecDF, a translocon-associated membrane protein, from Thermus thermophilus. Acta Crystallogr. Sect. F Struct. Biol. Cryst. Commun 2006, 62, 376–380. [Google Scholar]
- Haebel, P.W.; Wichman, S.; Goldstone, D.; Metcalf, P. Crystallization and initial crystallographic analysis of the disulfide bond isomerase DsbC in complex with the alpha domain of the electron transporter DsbD. J. Struct. Biol 2001, 136, 162–166. [Google Scholar]
- Izard, T.; Sarfaty, S.; Westphal, A.; de Kok, A.; Hol, W.G. Improvement of diffraction quality upon rehydration of dehydrated icosahedral Enterococcus faecalis pyruvate dehydrogenase core crystals. Protein Sci 1997, 6, 913–915. [Google Scholar]
- Yang, J.K.; Yoon, H.J.; Ahn, H.J.; Lee, B.I.; Cho, S.H.; Waldo, G.S.; Park, M.S.; Suh, S.W. Crystallization and preliminary X-ray crystallographic analysis of the Rv2002 gene product from Mycobacterium tuberculosis, a beta-ketoacyl carrier protein reductase homologue. Acta Crystallogr. D Biol. Crystallogr 2002, 58, 303–305. [Google Scholar]
- Kim, H.W.; Han, B.W.; Yoon, H.J.; Yang, J.K.; Lee, B.I.; Lee, H.H.; Ahn, H.J.; Suh, S.W. Crystallization and preliminary X-ray crystallographic analysis of peptide deformylase from Pseudomonas aeruginosa. Acta Crystallogr. D Biol. Crystallogr 2002, 58, 1874–1875. [Google Scholar]
- Kuo, A.; Bowler, M.W.; Zimmer, J.; Antcliff, J.F.; Doyle, D.A. Increasing the diffraction limit and internal order of a membrane protein crystal by dehydration. J. Struct. Biol 2003, 141, 97–102. [Google Scholar]
- Hunsicker-Wang, L.M.; Pacoma, R.L.; Chen, Y.; Fee, J.A.; Stout, C.D. A novel cryoprotection scheme for enhancing the diffraction of crystals of recombinant cytochrome ba3 oxidase from Thermus thermophilus. Acta Crystallogr. D Biol. Crystallogr 2005, 61, 340–343. [Google Scholar]
- Lu, Q.; Ma, J.; Rong, H.; Fan, J.; Yuan, Y.; Li, K.; Gao, Y.; Zhang, X.; Teng, M.; Niu, L. Cloning, expression, purification, crystallization and preliminary crystallographic analysis of 5-aminolaevulinic acid dehydratase from Bacillus subtilis. Acta Crystallogr. Sect. F Struct. Biol. Cryst. Commun 2010, 66, 1053–1055. [Google Scholar]
- Koch, M.; Breithaupt, C.; Kiefersauer, R.; Freigang, J.; Huber, R.; Messerschmidt, A. Crystal structure of protoporphyrinogen IX oxidase: A key enzyme in haem and chlorophyll biosynthesis. EMBO J 2004, 23, 1720–1728. [Google Scholar]
- Bowler, M.W.; Montgomery, M.G.; Leslie, A.G.; Walker, J.E. Reproducible improvements in order and diffraction limit of crystals of bovine mitochondrial F(1)-ATPase by controlled dehydration. Acta Crystallogr. D Biol. Crystallogr 2006, 62, 991–995. [Google Scholar]
- Engel, M.; Hoffmann, T.; Wagner, L.; Wermann, M.; Heiser, U.; Kiefersauer, R.; Huber, R.; Bode, W.; Demuth, H.U.; Brandstetter, H. The crystal structure of dipeptidyl peptidase IV (CD26) reveals its functional regulation and enzymatic mechanism. Proc. Natl. Acad. Sci. USA 2003, 100, 5063–5068. [Google Scholar]
- Estebanez-Perpina, E.; Fuentes-Prior, P.; Belorgey, D.; Braun, M.; Kiefersauer, R.; Maskos, K.; Huber, R.; Rubin, H.; Bode, W. Crystal structure of the caspase activator human granzyme B, a proteinase highly specific for an Asp-P1 residue. Biol. Chem 2000, 381, 1203–1214. [Google Scholar]
- Kyrieleis, O.J.; Goettig, P.; Kiefersauer, R.; Huber, R.; Brandstetter, H. Crystal structures of the tricorn interacting factor F3 from Thermoplasma acidophilum, a zinc aminopeptidase in three different conformations. J. Mol. Biol 2005, 349, 787–800. [Google Scholar]
- Chotiyarnwong, P.; Stewart-Jones, G.B.; Tarry, M.J.; Dejnirattisai, W.; Siebold, C.; Koch, M.; Stuart, D.I.; Harlos, K.; Malasit, P.; Screaton, G.; et al. Humidity control as a strategy for lattice optimization applied to crystals of HLA-A*1101 complexed with variant peptides from dengue virus. Acta Crystallogr. Sect. F Struct. Biol. Cryst. Commun 2007, 63, 386–392. [Google Scholar]
- Ke, A.; Doudna, J.A. Crystallization of RNA and RNA-protein complexes. Methods 2004, 34, 408–414. [Google Scholar]
- Bowman, G.D.; O’Donnell, M.; Kuriyan, J. Structural analysis of a eukaryotic sliding DNA clamp-clamp loader complex. Nature 2004, 429, 724–730. [Google Scholar]
- Rojviriya, C.; Pratumrat, T.; Saper, M.A.; Yuvaniyama, J. Improved X-ray diffraction from Bacillus megaterium penicillin G acylase crystals through long cryosoaking dehydration. Acta Crystallogr. Sect. F Struct. Biol. Cryst. Commun 2011, 67, 1570–1574. [Google Scholar] [Green Version]
- Liu, B.; Luna, V.M.; Chen, Y.; Stout, C.D.; Fee, J.A. An unexpected outcome of surface engineering an integral membrane protein: Improved crystallization of cytochrome ba(3) from Thermus thermophilus. Acta Crystallogr. Sect. F Struct. Biol. Cryst. Commun 2007, 63, 1029–1034. [Google Scholar]
- Deng, X.; Davidson, W.S.; Thompson, T.B. Improving the diffraction of apoA-IV crystals through extreme dehydration. Acta Crystallogr. Sect. F Struct. Biol. Cryst. Commun 2012, 68, 105–110. [Google Scholar]
- Amunts, A.; Drory, O.; Nelson, N. The structure of a plant photosystem I supercomplex at 3.4 A resolution. Nature 2007, 447, 58–63. [Google Scholar]
- Narita, H.; Nakagawa, A.; Yamamoto, Y.; Sakisaka, T.; Takai, Y.; Suzuki, M. Refolding, crystallization and preliminary X-ray crystallographic study of the whole extracellular regions of nectins. Acta Crystallogr. Sect. F Struct. Biol. Cryst. Commun 2011, 67, 344–348. [Google Scholar]
- Barton, W.A.; Liu, B.P.; Tzvetkova, D.; Jeffrey, P.D.; Fournier, A.E.; Sah, D.; Cate, R.; Strittmatter, S.M.; Nikolov, D.B. Structure and axon outgrowth inhibitor binding of the Nogo-66 receptor and related proteins. EMBO J 2003, 22, 3291–3302. [Google Scholar]
- Latham, C.F.; Hu, S.H.; Gee, C.L.; Armishaw, C.J.; Alewood, P.F.; James, D.E.; Martin, J.L. Crystallization and preliminary X-ray diffraction of the Munc18c-syntaxin4 (1–29) complex. Acta Crystallogr. Sect. F Struct. Biol. Cryst. Commun 2007, 63, 524–528. [Google Scholar]
- Esnouf, R.M.; Ren, J.; Garman, E.F.; Somers, D.O.; Ross, C.K.; Jones, E.Y.; Stammers, D.K.; Stuart, D.I. Continuous and discontinuous changes in the unit cell of HIV-1 reverse transcriptase crystals on dehydration. Acta Crystallogr. D Biol. Crystallogr 1998, 54, 938–953. [Google Scholar]
- Rustiguel, J.K.; Pinheiro, M.P.; Araujo, A.P.; Nonato, M.C. Crystallization and preliminary X-ray diffraction analysis of recombinant chlorocatechol 1,2-dioxygenase from Pseudomonas putida. Acta Crystallogr. Sect. F Struct. Biol. Cryst. Commun 2011, 67, 507–509. [Google Scholar]
- Papanikolau, Y.; Papadovasilaki, M.; Ravelli, R.B.; McCarthy, A.A.; Cusack, S.; Economou, A.; Petratos, K. Structure of dimeric SecA, the Escherichia coli preprotein translocase motor. J. Mol. Biol 2007, 366, 1545–1557. [Google Scholar]
- Fu, Z.Q.; Du Bois, G.C.; Song, S.P.; Harrison, R.W.; Weber, I.T. Improving the diffraction quality of MTCP-1 crystals by post-crystallization soaking. Acta Crystallogr. D Biol. Crystallogr 1999, 55, 5–7. [Google Scholar]
- Anandan, A.; Vallet, C.; Coyle, T.; Moustafa, I.M.; Vrielink, A. Crystallization and preliminary diffraction analysis of an engineered cephalosporin acylase. Acta Crystallogr. Sect. F Struct. Biol. Cryst. Commun 2010, 66, 808–810. [Google Scholar]
- Zurbriggen, A.; Schneider, P.; Bahler, P.; Baumann, U.; Erni, B. Expression, purification, crystallization and preliminary X-ray analysis of the EIICGlc domain of the Escherichia coli glucose transporter. Acta Crystallogr. Sect. F Struct. Biol. Cryst. Commun 2010, 66, 684–688. [Google Scholar]
- Wang, H.; Guo, J.; Pang, H.; Zhang, X. Crystallization and preliminary X-ray analysis of the MaoC-like dehydratase from Phytophthora capsici. Acta Crystallogr. Sect. F Struct. Biol. Cryst. Commun 2010, 66, 272–274. [Google Scholar]
- Jenni, S.; Ban, N. Imperfect pseudo-merohedral twinning in crystals of fungal fatty acid synthase. Acta Crystallogr. D Biol. Crystallogr 2009, 65, 101–111. [Google Scholar]
- An, Y.J.; Ahn, B.E.; Roe, J.H.; Cha, S.S. Crystallization and preliminary X-ray crystallographic analyses of Nur, a nickel-responsive transcription regulator from Streptomyces coelicolor. Acta Crystallogr. Sect. F Struct. Biol. Cryst. Commun 2008, 64, 130–132. [Google Scholar]
- Harata, K.; Akiba, T. Effect of a sodium ion on the dehydration-induced phase transition of monoclinic lysozyme crystals. Acta Crystallogr. D Biol. Crystallogr 2007, 63, 1016–1021. [Google Scholar]
- Nakamura, A.; Wada, C.; Miki, K. Expression and purification of F-plasmid RepE and preliminary X-ray crystallographic study of its complex with operator DNA. Acta Crystallogr. Sect. F Struct. Biol. Cryst. Commun 2007, 63, 346–349. [Google Scholar]
- Peng, Y.; Xu, F.; Bell, S.G.; Wong, L.L.; Rao, Z. Crystallization and preliminary X-ray diffraction studies of a ferredoxin reductase from Rhodopseudomonas palustris CGA009. Acta Crystallogr. Sect. F Struct. Biol. Cryst. Commun 2007, 63, 422–425. [Google Scholar]
- Henderson, K.N.; Reid, H.H.; Borg, N.A.; Broughton, S.E.; Huyton, T.; Anderson, R.P.; McCluskey, J.; Rossjohn, J. The production and crystallization of the human leukocyte antigen class II molecules HLA-DQ2 and HLA-DQ8 complexed with deamidated gliadin peptides implicated in coeliac disease. Acta Crystallogr. Sect. F Struct. Biol. Cryst. Commun 2007, 63, 1021–1025. [Google Scholar]
- Tong, L.; Qian, C.; Davidson, W.; Massariol, M.J.; Bonneau, P.R.; Cordingley, M.G.; Lagace, L. Experiences from the structure determination of human cytomegalovirus protease. Acta Crystallogr. D Biol. Crystallogr 1997, 53, 682–690. [Google Scholar]
- Mao, X.; Chen, X. Crystallization and X-ray crystallographic analysis of human STAT1. Acta Crystallogr. Sect. F Struct. Biol. Cryst. Commun 2005, 61, 666–668. [Google Scholar]
- Madhusudan; Kodandapani, R.; Vijayan, M. Protein hydration and water structure: X-ray analysis of a closely packed protein crystal with very low solvent content. Acta Crystallogr. D Biol. Crystallogr 1993, 49, 234–245. [Google Scholar]
- Dobrianov, I.; Kriminski, S.; Caylor, C.L.; Lemay, S.G.; Kimmer, C.; Kisselev, A.; Finkelstein, K.D.; Thorne, R.E. Dynamic response of tetragonal lysozyme crystals to changes in relative humidity: Implications for post-growth crystal treatments. Acta Crystallogr. D Biol. Crystallogr 2001, 57, 61–68. [Google Scholar]
- Callahan, S.J.; Morgan, R.D.; Jain, R.; Townson, S.A.; Wilson, G.G.; Roberts, R.J.; Aggarwal, A.K. Crystallization and preliminary crystallographic analysis of the type IIL restriction enzyme MmeI in complex with DNA. Acta Crystallogr. Sect. F Struct. Biol. Cryst. Commun 2011, 67, 1262–1265. [Google Scholar]
- Andres, S.N.; Junop, M.S. Crystallization and preliminary X-ray diffraction analysis of the human XRCC4-XLF complex. Acta Crystallogr. Sect. F Struct. Biol. Cryst. Commun 2011, 67, 1399–1402. [Google Scholar]
- Pauwels, K.; Loris, R.; Vandenbussche, G.; Ruysschaert, J.M.; Wyns, L.; Van Gelder, P. Crystallization and crystal manipulation of a steric chaperone in complex with its lipase substrate. Acta Crystallogr. Sect. F Struct. Biol. Cryst. Commun 2005, 61, 791–795. [Google Scholar]
- Stocker, A.; Keis, S.; Cook, G.M.; Dimroth, P. Purification, crystallization, and properties of F1-ATPase complexes from the thermoalkaliphilic Bacillus sp. strain TA2.A1. J. Struct. Biol 2005, 152, 140–145. [Google Scholar]
- Schick, B.; Jurnak, F. Crystal growth and crystal improvement strategies. Acta Crystallogr. F 1994, 50, 563–568. [Google Scholar]
- Cramer, P.; Muller, C.W. Engineering of diffraction-quality crystals of the NF-kappaB P52 homodimer: DNA complex. FEBS Lett 1997, 405, 373–377. [Google Scholar]
- Shang, G.; Cang, H.; Liu, Z.; Gao, W.; Bi, R. Crystallization and preliminary crystallographic analysis of a calcineurin B-like protein 1 (CBL1) mutant from Ammopiptanthus mongolicus. Acta Crystallogr. Sect. F Struct. Biol. Cryst. Commun 2010, 66, 1602–1605. [Google Scholar]
- Suga, M.; Maeda, S.; Nakagawa, S.; Yamashita, E.; Tsukihara, T. A description of the structural determination procedures of a gap junction channel at 3.5 A resolution. Acta Crystallogr. D Biol. Crystallogr 2009, 65, 758–766. [Google Scholar]
- Verma, S.K.; Jaiswal, M.; Kumar, N.; Parikh, A.; Nandicoori, V.K.; Prakash, B. Structure of N-acetylglucosamine-1-phosphate uridyltransferase (GlmU) from Mycobacterium tuberculosis in a cubic space group. Acta Crystallogr. Sect. F Struct. Biol. Cryst. Commun 2009, 65, 435–439. [Google Scholar]
- Ravaud, S.; Wild, K.; Sinning, I. Purification, crystallization and preliminary structural characterization of the periplasmic domain P1 of the Escherichia coli membrane-protein insertase YidC. Acta Crystallogr. Sect. F Struct. Biol. Cryst. Commun 2008, 64, 144–148. [Google Scholar]
- Yap, T.L.; Chen, Y.L.; Xu, T.; Wen, D.; Vasudevan, S.G.; Lescar, J. A multi-step strategy to obtain crystals of the dengue virus RNA-dependent RNA polymerase that diffract to high resolution. Acta Crystallogr. Sect. F Struct. Biol. Cryst. Commun 2007, 63, 78–83. [Google Scholar]
- Kiefersauer, R.; Than, M.E.; Dobbek, H.; Gremer, L.; Melero, M.; Strobl, S.; Dias, J.M.; Soulimane, T.; Huber, R. A novel free-mounting system for protein crystals: transformation and improvement of diffraction power by accurately controlled humidity changes. J. Appl. Cryst 2000, 33, 1223–1230. [Google Scholar]
- Sanchez-Weatherby, J.; Bowler, M.W.; Huet, J.; Gobbo, A.; Felisaz, F.; Lavault, B.; Moya, R.; Kadlec, J.; Ravelli, R.B.; Cipriani, F. Improving diffraction by humidity control: A novel device compatible with X-ray beamlines. Acta Crystallogr. D Biol. Crystallogr 2009, 65, 1237–1246. [Google Scholar]
- Sjogren, T.; Carlsson, G.; Larsson, G.; Hajdu, A.; Andersson, C.; Pettersson, H.; Hajdu, J. Protein crystallography in a vapour stream: Data collection, reaction initiation and intermediate trapping in naked hydrated protein crystals. J. Appl. Cryst 2002, 35, 113–116. [Google Scholar]
- Wheeler, M.J.; Russi, S.; Bowler, M.G.; Bowler, M.W. Measurement of the equilibrium relative humidity for common precipitant concentrations: Facilitating controlled dehydration experiments. Acta Crystallogr. Sect. F Struct. Biol. Cryst. Commun 2012, 68, 111–114. [Google Scholar]
- Eliassi, A.; Modarress, H. Densities of poly(ethylene glycol) + water mixtures in the 298.15–328.15 K temperature range. J. Chem. Eng. Data 1998, 43, 719–772. [Google Scholar]
- Alcorn, T.; Juers, D.H. Progress in rational methods of cryoprotection in macromolecular crystallography. Acta Crystallogr. D Biol. Crystallogr 2010, 66, 366–373. [Google Scholar]
- Matthews, B.W. Solvent content of protein crystals. J. Mol. Biol 1968, 33, 491–497. [Google Scholar]
- Painter, L.; Harding, M.M.; Beeby, P.J. Synthesis and interaction with human serum albumin of the first 3,18-disubstituted derivative of bilirubin. J. Chem. Soc. Perkin Trans 1998, 18, 3041–3050. [Google Scholar]
- Otwinowsky, Z.; Minor, W. Processing of X-ray diffraction data collected in oscillation mode. Methods Enzymol 1997, 276, 307–326. [Google Scholar]
- Storoni, L.C.; McCoy, A.J.; Read, R.J. Likelihood-enhanced fast rotation functions. Acta Crystallogr. D Biol. Crystallogr 2004, 60, 432–438. [Google Scholar]
- Sugio, S.; Kashima, A.; Mochizuki, S.; Noda, M.; Kobayashi, K. Crystal structure of human serum albumin at 2.5 A resolution. Protein Eng 1999, 12, 439–446. [Google Scholar]


| Protein crystal | Reference | Crystal precipitanta | Dehydrating agent | Dehydration treatment | Space group (SG) | Solvent content b before (%) | Solvent content b after (%) | RH before (%) | RH after (%) | Resolution before(Å) | Resoluti on after (Å) |
|---|---|---|---|---|---|---|---|---|---|---|---|
| BSA | This work | 22% MPEG 5K | 30% PEG 8K | Transfer to drop of dehydr soln, 10 min | C2 | 50–53 | 47 | 99.2 | 98.5 | ~8 e | 3.2 e |
| DsbG | [24] | 20% PEG 4K | 30% PEG 4K | Transfer to drop of dehydr soln, hang over reservoir of dehydr soln, 12h | C2 | ~90 | 53 | 99.3 | 98.4 | ~10e | 2.0 e 1.7 d |
| FAD-indep ALS | [28] | 6–8% PEG 8K 6–9% EG | Ppt 30% PEG 600 | Hang over same dehydr soln, 12 h+ cryocool | C2 | NR | 52 | NC | NC | 2.9 e | 2.6 e |
| Xis–DNAX1-X2 | [29] | 30% PEG 4K | 35–40% PEG 4K | Replacing both the well and hangdrop solutions with dehydr soln | P3121 or P3221 | NR | 59 | 98.4 | 96.9–97.7 | 10 d | 2.6 d |
| Aldolase C | [30] | 25% PEG 8K 4% glucose | 25% PEG 8K 4% glucose | Replacing both the well and hangdrop solutions with dehydr soln | P1 | NR | NR | NC | NC | NR | 3.0 e |
| Aldolase B | [31] | 1.8–2.2 M AS 2% diaminooctane | 3.5 M AS | Replacing both the well and hangdrop solutions with dehydr soln | P21212 | NR | NR | 91.2–93.0 | 85.3 | NR | 2.7 e |
| Tom20 receptor | [32] | 15% PEG 6K | 25% PEG 6K | Replacing both the well and hangdrop solutions with dehydr soln | C2 | NR | NR | 99.6 | 99.0 | 3–8 d | 2.1 d |
| transamidosome | [33] | 10% PEG 4K | 30% PEG 400 10% PEG 4K | Replacing the reservoir solution with dehydr soln | P212121 to P21 upon dehydr | NR | 65 | 99.8 | <97.1 | 4.0 d | 3.0 d |
| X (or ADRP) domain of a variant of feline coronavirus | [34] | 2.6–2.8 M AS | 2.6–2.8 M AS 4–17% glycerol | Replacing the reservoir solution with dehydr soln 12h | P41212 | NR | 78 | NC | NC | 4.5 e | 3.1 d |
| SecDF | [35] | 26% PEG 400 | 50% PEG 400 | Replacing both the well and hanging-drop solutions with dehydr soln | P43212 | 75 | 74 | 97.7 | 92.3 | 4.2 d | 3.7 d |
| DsbC-DsbDα | [36] | 25% MPEG 5K 5% glycerol | 40% MPEG 5K 10% glycerol | Air dehydrate 30 min + cryocool | P43212 | 55 | 41 | NC | NC | 7.0 e | 3.8 e 2.3 d |
| Pyruvate Dehydrogenase | [37] | 6% PEG 3K | Ppt 35% glycerol | Air dehydrate for 28 months, rehydrate in same soln, cryocool | R32 | NR | 73 | 99.9 | 90.5 | 7.0 d | 4.2 d |
| E. coli YbgL | [25] | 0.8M sodium citrate | Ppt 10% EG | Annealing+air dehydrate (2 h) | C2 | NR | 57 | NC | NC | ~12e | 2.6 e 1.8 d |
| E. coli YggV | [25] | 35% AS | 37.5% AS 10% glycerol | Annealing+air dehydrate (30 min) | P43212 | NR | 38 | 89.5 | <88.6 | ~12e | 2.6 e 2.0 d |
| 3-Dehydro dehy | [25] | 11% PEG 8K | Ppt 10% glycerol | Annealing+air dehydrate (15 min) | P21 | NR | 88 | 99.8 | <97.9 | ND | 3.0 d |
| Rv2002 gene product | [38] | 20% PEG 3K | Ppt 10% MPD | Anneal + air dehydrate, 5 h | P312 1 | NR | 35 | NC | NC | 2.1 d | 1.8 d |
| Peptide deformylase | [39] | 12% PEG 4K | 20% PEG 4K 10% PEG 400 | Anneal + air dehydrate, 30 min | P212121 | NR | 50 | 99.7 | <99.3 | 2.0 d | 1.8 d |
| CLC Cl channel | [40] | 22–32% Jeffamine | Ppt | Incub. in cryst. drop (5 months) | P222 | NR | NR | NC | NC | 7.5 d | 4.0 d |
| Cytochrome ba3 oxidase | [41] | 14–16% PEG 2K | 20% glycerol 20% EG | Incub. under oil 2–4 h/air exp. 10 min | P43212 | NR | 62 | 99.6–99.5 | <93.2 | 4.0 d | 2.3 d |
| 5-Aminolaevulinic acid dehydratase | [42] | 0.7 M 1,6-hexanediol | Air dehydrate, 30 min | P 42212 | NR | 41 or 61 | NC | NC | NR | 2.7 d | |
| Pea chloroplast photosystem I | [26] | 26% PEG 4K | Controlled relative humidity device | P21 | NR | NR | 99 | 97 | 6.0 d | 4.0 d | |
| Phosphoglycerate kinase | [26] | 26% PEG 4K | Controlled relative humidity device | P21212 | NR | NR | 98.5 | 97.5 | 3.0 d | 1.8 d | |
| Thioredoxin | [43] | 10% PEG 1000 | Controlled relative humidity device | C2221 | NR | NR | NR | NR | 8.0 d | 2.9 d | |
| F1-ATPase | [44] | 14% PEG 6K | Controlled relative humidity device | P212121 | NR | Reduction of 22% | 99 | 90 | NR | 1.9 d | |
| Dipeptidyl peptidase IV | [45] | 20–22% PEG 2K | Controlled relative humidity device | P1 | NR | NR | 96.5 | 86.5 | ~10 d | 3.0 d | |
| Human GzmB | [46] | 36% PEG 8K | Controlled relative humidity device | P212121 | NR | NR | 90 | 85 | NR | 3.1 d | |
| Tricorn Interacting Factor F3 | [47] | 18% PEG 2K | Controlled relative humidity device | P3221 | NR | NR | 98 | 94 | BD | 2.3 d | |
| pMHC complexed with GTSGSPIADK | [48] | 1.2 M K2HPO4 0.6 M NaH2PO4 | Controlled relative humidity device | C2 | NR | 70 | 94.5 | 93.5 | ~7 d | 3.2 d | |
| RFC–PCNA | [50] | 15% PEG 3.4K | 33% PEG 3.4K | Serial transfer into increasing PEG 3.4K, 2h | P212121 | 58 | 52 | 99.6 | 98.0 | 5.0 d | 2.8 d |
| Penicillin G acylase | [51] | 29% PEG 4K | 36–70% PEG 4K 12–15% glycerol | Transfer to drop of dehydr soln (5–30 s) | P21 | NR | 46 | 98.5 | <84.1 | 8.0 e | 2.2 e |
| Cytochrome ba3 oxidase mutants | [52] | 6–7% PEG 2K | 50% MPD, 14% PEG 2K | Transfer to drop of dehydr soln | P43212 P41212 | NR | 57–6 | 99.9 | <99.6 | 2.6–3.0 d | 2.3–2.4 d |
| ApoA-IV | [53] | 22–28% PEG 3.4K | 60% PEG 3.4K | Transfer to drop of dehydr soln, 12h | P6 | 64 | 59 | 99.3–98.6 | 90.8 | 3.5 d | 2.7 d |
| Plant photosystem I | [54] | 0.5% PEG 400 3–5% PEG 6K | 0.5% PEG 400 40% PEG 6K | Transfer to drop of dehydr soln, 1 week | P21 | NR | NR | 99.9 | 97.0 | 4.4 d | 3.4 d |
| Nectin-1-EC complex | [55] | 5% PEG 300 | 25% PEG 300 | Transfer in var. steps to drop of dehydr soln | P213 | NR | NR | 99.6 | 97.4 | ~5 d | 2.8 d |
| NgR | [56] | 3.7 M NaCl | 4.5 M NaCl | Transfer to drop of dehydr soln | P3121 | 90 | 85 | 87.0 | 84.3 | ~5 d | 3.2 d |
| Munc18c–syntaxin 41–29 complex | [57] | 10–13% PEG 3.4K | 25–30% PEG 3.4K | Transfer in var. steps to drop of dehydr soln | P213 | 54 | 53 | 99.8–99.7 | 98.9–98.4 | 4.3 e | 3.7 e |
| HIV-RT:inhibitor | [58] | 6% PEG 3.4K | 46% PEG 3.4K | Serial transfer, 5% increments, 3 days | P212121 | 56 | 48 | 99.9 | 95.5 | 3.7 e | 2.2 e |
| Pp 1,2-CCD | [59] | 14% PEG 8K | 16–18% PEG 8K 20 % glycerol | Transfer to drop of dehydr soln, 30–60s | P6122 | NR | 63 | 99.7 | <95.3 | 8–10 d | ~3.3 d |
| ecSecA | [60] | 6–9% PEG 35K | 2 M KCl | NR | P21 | 65 | 56 | NC | NC | ~3.5 d | 2.0 d |
| MTCP-1 | [61] | 1.5 M AS | 2.0 M AS | Soaked for 1–5 months | P6222 | 41 | 37 | 94.2 | 92.1 | 3.0 e | 2.0 e |
| Trehalose phosphorylase | [27] | 10% PEG 4K | 18% PEG 4K | Various procedures | P212121 | NR | 60 | 99.8 | 99.5 | ~7–8 d | ~3–4 d |
| Glutaryl-7-aminocephalosporanic acid acylase | [62] | 4% PEG 8K 10–20% PEG 4K | 30% PEG 8K 20% glycerol | Transfer to drop of dehydr soln | P212121 | NR | NR | NC | NC | ~4 d | 1.6 e |
| EIICGlc(1–412, K394A, M17T, K150E) | [63] | 32–35% PEG 400 | >80% PEG 400 | Transfer to drop of dehydr soln, 48 h. | P212121 | NR | 85 | 96.8–96.2 | 74.3 | ~8 d | 4.5 e |
| MaoC-like dehydratase | [64] | 5% PEG 6K | 12% PEG 6K | Transfer to drop of dehydr soln, 30 min | P212121 | NR | NR | 99.9 | 99.8 | ND | 1.9 d |
| Fatty acid synthase | [65] | 4–5% PEG 6K | 23% PEG 6K | Transfer to drop of dehydr soln, | P212121 to P21 upon dehydr | 67 | 65 | 99.9 | 99.2 | ~8 d | ~5 d |
| Nur | [66] | 5% PEG 6K, 5% MPD | 15% PEG 6K, 10% MPD | Transfer to drop of dehydr soln, 20 min | P31 | NR | 65 | 99.9 | <99.6 | NR | 2.4 d |
| Monoclinic lysozyme | [67] | 10% NaCl | Satd NaCl solution | Transfer to drop of dehydr soln, 20 min | P21 | 29 | 23 | 91.1 | 79.3 | 1.4 e | 1.1 e |
| His6-RepE–DNA1 | [68] | 10% PEG 4K | 12% PEG 4K | Transfer to drop of dehydr soln, 36 h | P21 | NR | 63 | 99.8 | 99.8 | ~8 d | 3.1 d |
| Ferredoxin reductase | [69] | 16–18% PEG 10K | 20% PEG 4K | Transfer to drop of dehydr soln, 15min | P32211 | NR | 53 | 99.6–99.5 | 99.3 | NR | 2.2 d |
| MHC HLA-DQ2 complexed with gliadin peptides | [70] | 25% PEG 4K | 30% PEG 4K | dehydrated in a capillary containing dehydr soln, 3 days | I23 | NR | 40 | 98.9 | 98.4 | ~9 d | 3.9 e |
| HCMV protease | [71] | 16% PEG 4K | 30% PEG 4K 0.15 M Na2SO4 | Serial increase in reservoir conc, 3–5 days | P412121 | 58 | 56 | 99.6 | <98.4 | 3.0 e | 2.5 e 2.0 d |
| Human STAT1 | [72] | 10–12% PEG 400 | 10.5% PEG 400 10–30% PEG 4K | Transfer in var. steps to drop of dehydr soln | P6122 | NR | 60 | NC | NC | 3.7 e | 3.0 e |
| Monoclinic lysozyme | [73] | 3% NaNO3 | Satd K2CrO4 solution | Seal crystal in capillary, add plug of dehydr soln, for 15–20 h | P21 | 33 | 22 | NC | NC | 2.5 e | 1.7 e |
| Tetragonal lysozyme | [74] | 0.48–0.75 M NaCl | Satd salt solutions | Seal crystal in capillary, add plug of dehydr soln, for days to weeks | P43212 | NR | NR | 98.3–97.3 | 79.3 | 3.7 d | 1.6 d |
| MmeI in complex with DNA | [75] | 10% PEG 8K | 20% PEG 4K | Changing the mother liquor for crystal growth | P1 | NR | NR | 99.8 | 99.3 | ~4 d | 2.6 d |
| XRCC4–XLF complex | [76] | 1.8 M TC | 2.5 M AS | Transfer to 2.5 M AS 1 week + over 4 M AS, 5 days + 0.5 mM TB and 60% PEG 8000, 3 h | C2 | NR | NR | NC | NC | ~20 d | 3.9 d |
| lipase–foldase complex | [77] | 12% PEG 4K | 30% PEG 8K | Transfer in var. steps to drop of dehydr soln | P3121 | 62 | 60 | 99.8 | 98.5 | ~15 d | 2.9 d |
| F1-ATPase | [78] | 20% PEG 6K | 20% PEG 6K 20% PEG 400 | Serial transfer into dehydr soln | P212121 | NR | 62 | NC | NC | 6–8 d | 3.1 d |
| EF-Tu-Ts | [79] | 20% PEG 4K | 28%–40%, var PEGs | Serial transfer, 5 min each | P212121 | 61 | 55 | NC | NC | 4.0 e | 2.7 e |
| NF-κB P52-DNA | [80] | 4–6% PEG 4K | Ppt 30% PEG 400 HA | Serial transfer into dehydr soln | I212121 | 52 | 49 | NC | NC | 3.5 d | 2.0 d |
| CBL1 | [81] | 25% PEG 3.4K | 7% MPEG 2K 0.7 M Li2SO4 | Transfer to dehydr soln, 5 min | P21212 | NR | 54 | NC | NC | NR | 2.9 d |
| Cx26 | [82] | 16–18% PEG | 200 25–30% | TEG Serial transfer into increasing TEG, 1–2days | C2 | NR | NR | NC | NC | ~7 d | 3.5 d |
| Nacetylglucosamine-1-phosphate Uridyltransferase | [83] | 1.8 M AS | 2.0 M AS Na malonate 5% glycerol | Serial transfer into dehydr soln | I432 | Very high solvent content | 82 | 93.0 | <92. 1 | 3.8 e | 3.4 e |
| SeMet YidC | [84] | 22% PEG 3350 10% EG | 30% PEG 3.4K 5–15% PEG 400 | Serial transfer into dehydr soln | C2 | 50 | 47 | NC | NC | 3.5 e | 1.8 e |
| DENV 3 RdRp | [85] | 0.5% MPEG 5K | Var dehydr soln i.e., 30% PEG 4K | Var procedures | C2221 | NR | 59 | NC | NC | ~20 d | 1.8 d |
| Space group | C2 |
|---|---|
| Cell parameters | |
| a (Å) | 216.45 |
| b (Å) | 44.72 |
| c (Å) | 140.18 |
| β (°) | 114.5 |
| Resolution limits (Å) | 50.00–3.24 |
| Highest resolution shell (Å) | 3.32–3.24 |
| No. of observations | 57717 |
| No. of unique reflections | 18006 |
| Completeness (%) | 88.8 (81.5) |
| I/σ (I) | 5.5 (2.9) |
| Average multiplicity | 3.2 (2.4) |
| Rmerge (%) | 15.4 (31.9) |
| Mosaicity | 1.2 |
© 2012 by the authors; licensee Molecular Diversity Preservation International, Basel, Switzerland. This article is an open-access article distributed under the terms and conditions of the Creative Commons Attribution license (http://creativecommons.org/licenses/by/3.0/).
Share and Cite
Russo Krauss, I.; Sica, F.; Mattia, C.A.; Merlino, A. Increasing the X-ray Diffraction Power of Protein Crystals by Dehydration: The Case of Bovine Serum Albumin and a Survey of Literature Data. Int. J. Mol. Sci. 2012, 13, 3782-3800. https://doi.org/10.3390/ijms13033782
Russo Krauss I, Sica F, Mattia CA, Merlino A. Increasing the X-ray Diffraction Power of Protein Crystals by Dehydration: The Case of Bovine Serum Albumin and a Survey of Literature Data. International Journal of Molecular Sciences. 2012; 13(3):3782-3800. https://doi.org/10.3390/ijms13033782
Chicago/Turabian StyleRusso Krauss, Irene, Filomena Sica, Carlo Andrea Mattia, and Antonello Merlino. 2012. "Increasing the X-ray Diffraction Power of Protein Crystals by Dehydration: The Case of Bovine Serum Albumin and a Survey of Literature Data" International Journal of Molecular Sciences 13, no. 3: 3782-3800. https://doi.org/10.3390/ijms13033782