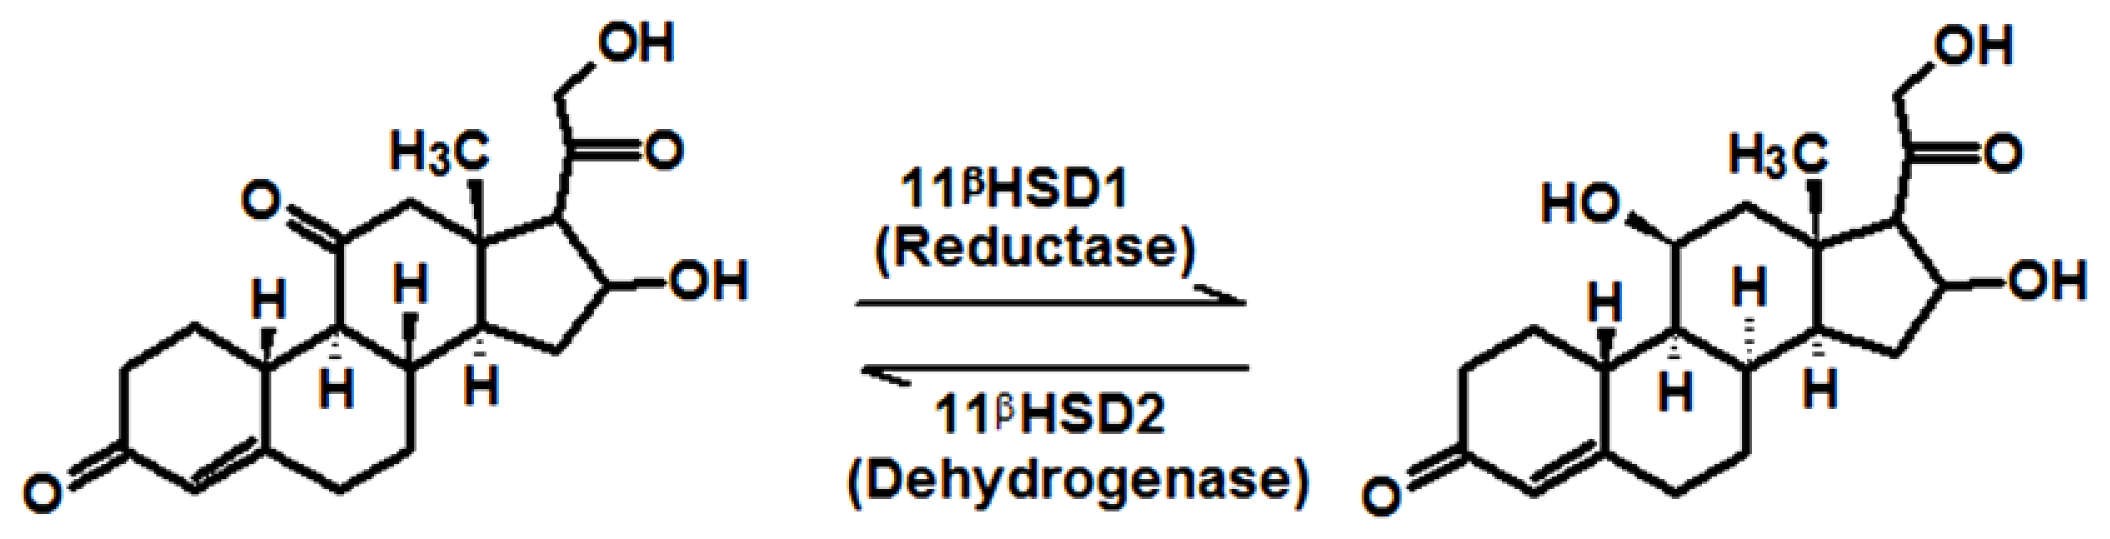
Identification of Important Chemical Features of 11β-Hydroxysteroid Dehydrogenase Type1 Inhibitors: Application of Ligand Based Virtual Screening and Density Functional Theory

Abstract
:
1. Introduction
2. Results and Discussion
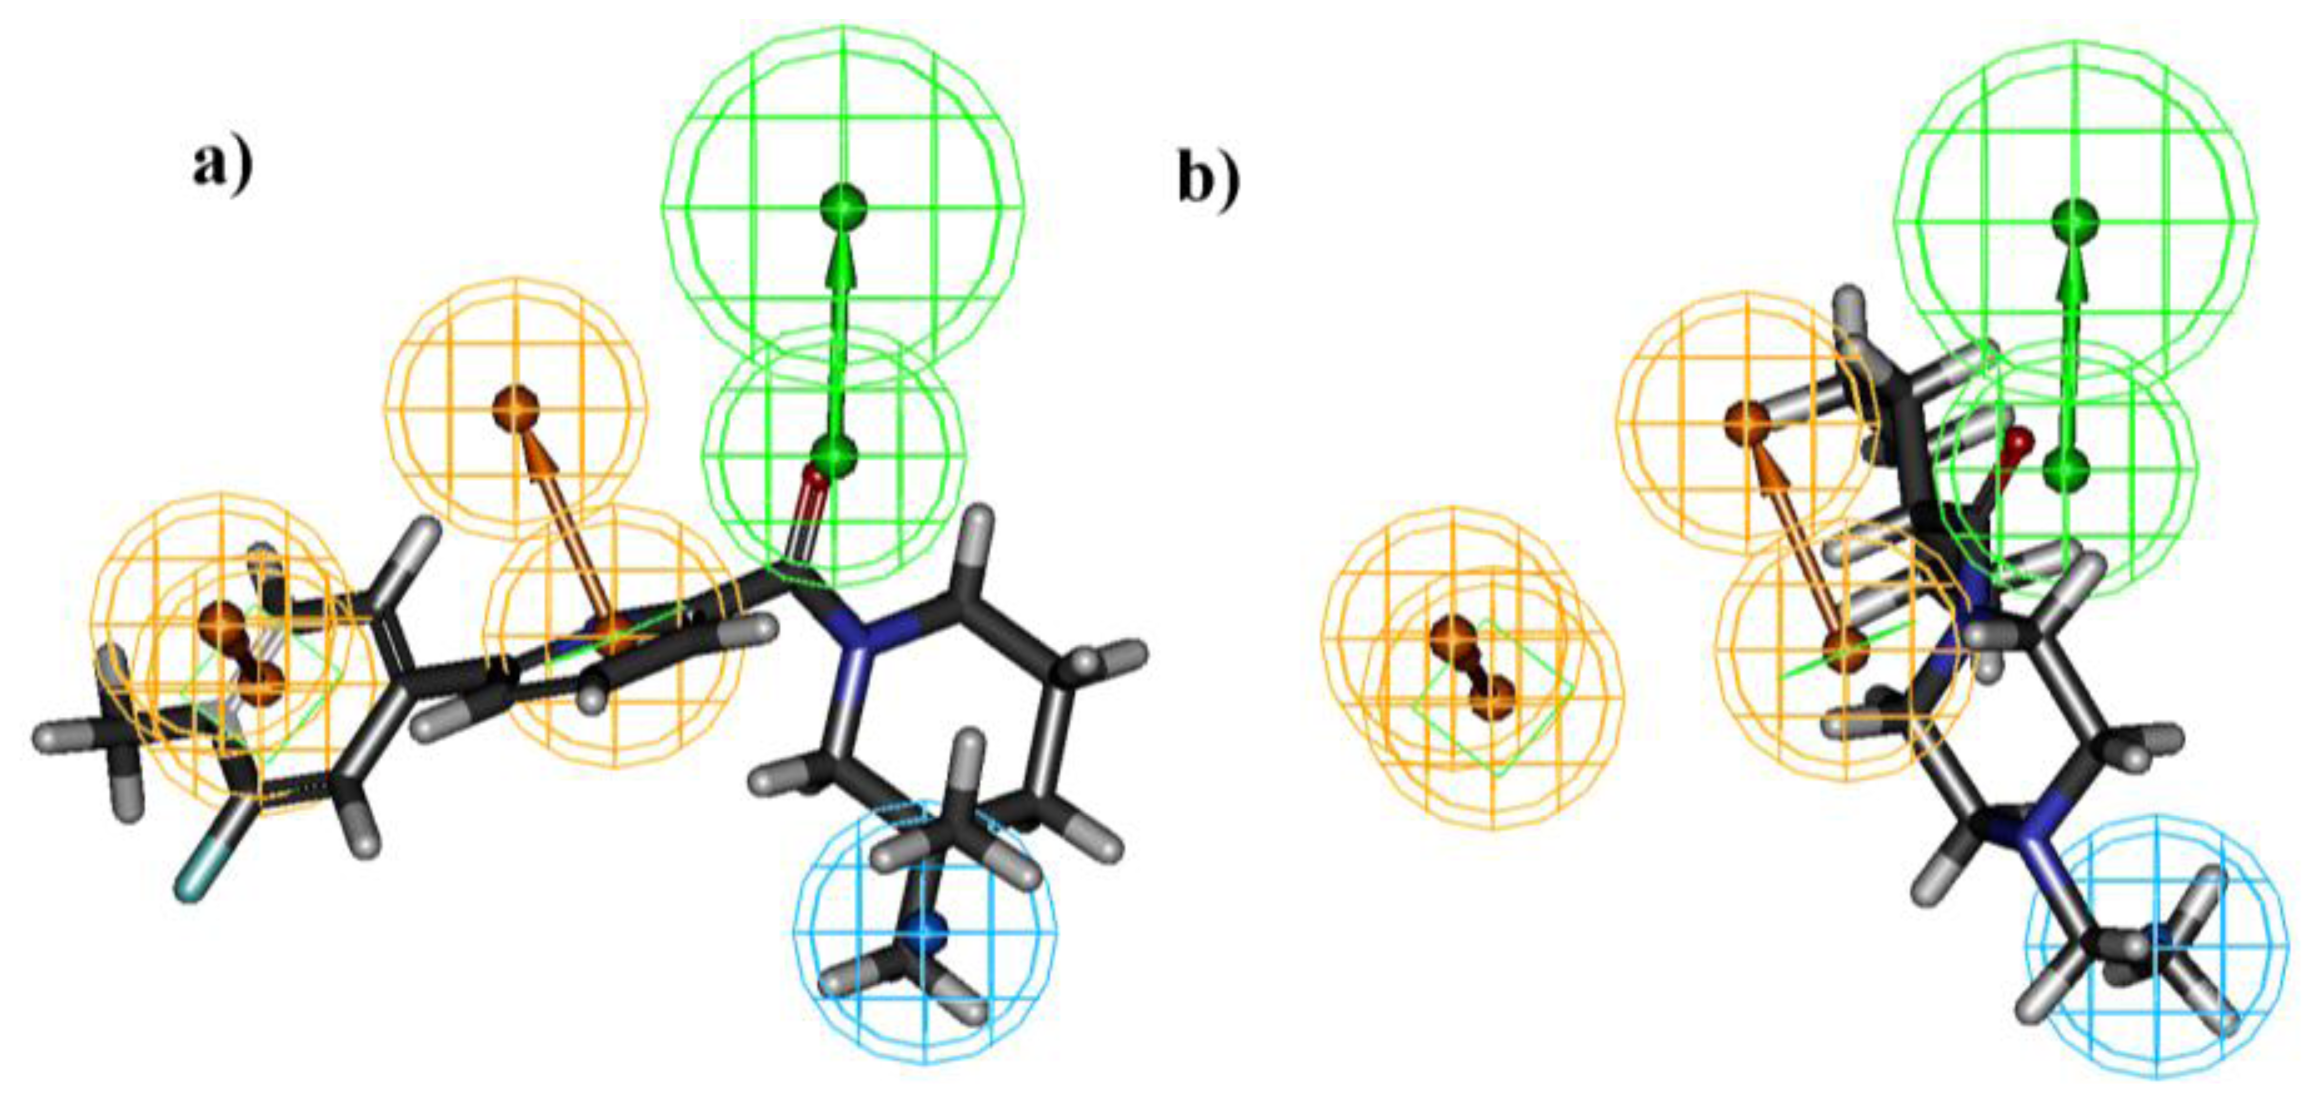
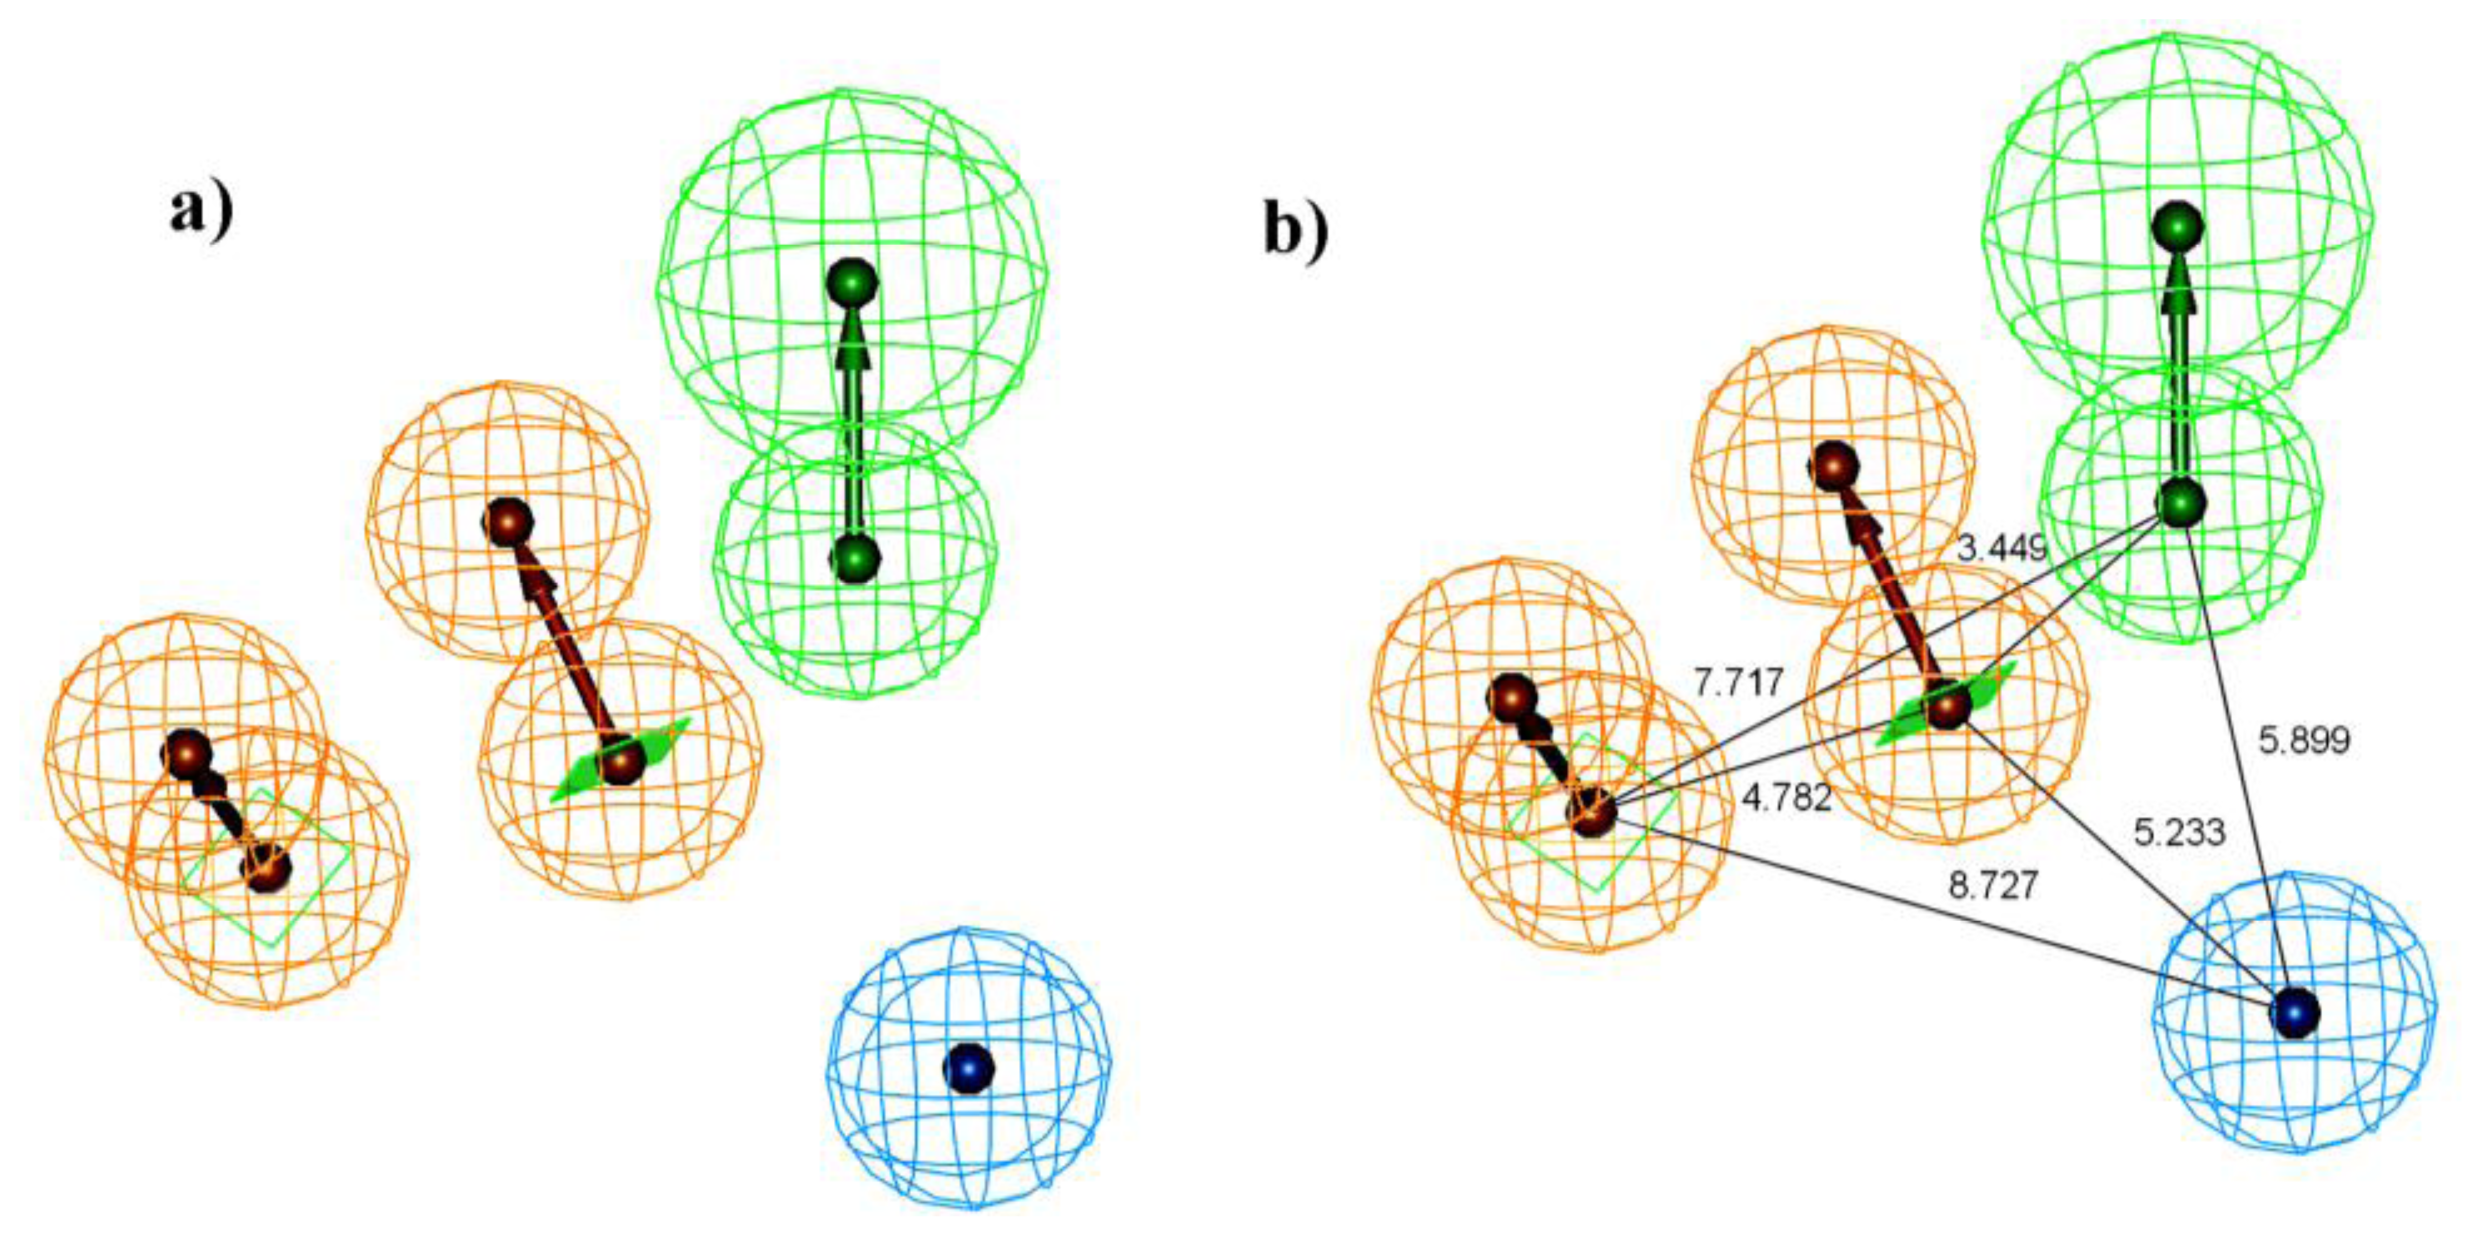
2.1. Pharmacophore Generation
2.1.1. Selection of the Best Hypothesis by Debnath Analysis
2.1.2. Score Hypothesis
2.2. Pharmacophore Validation
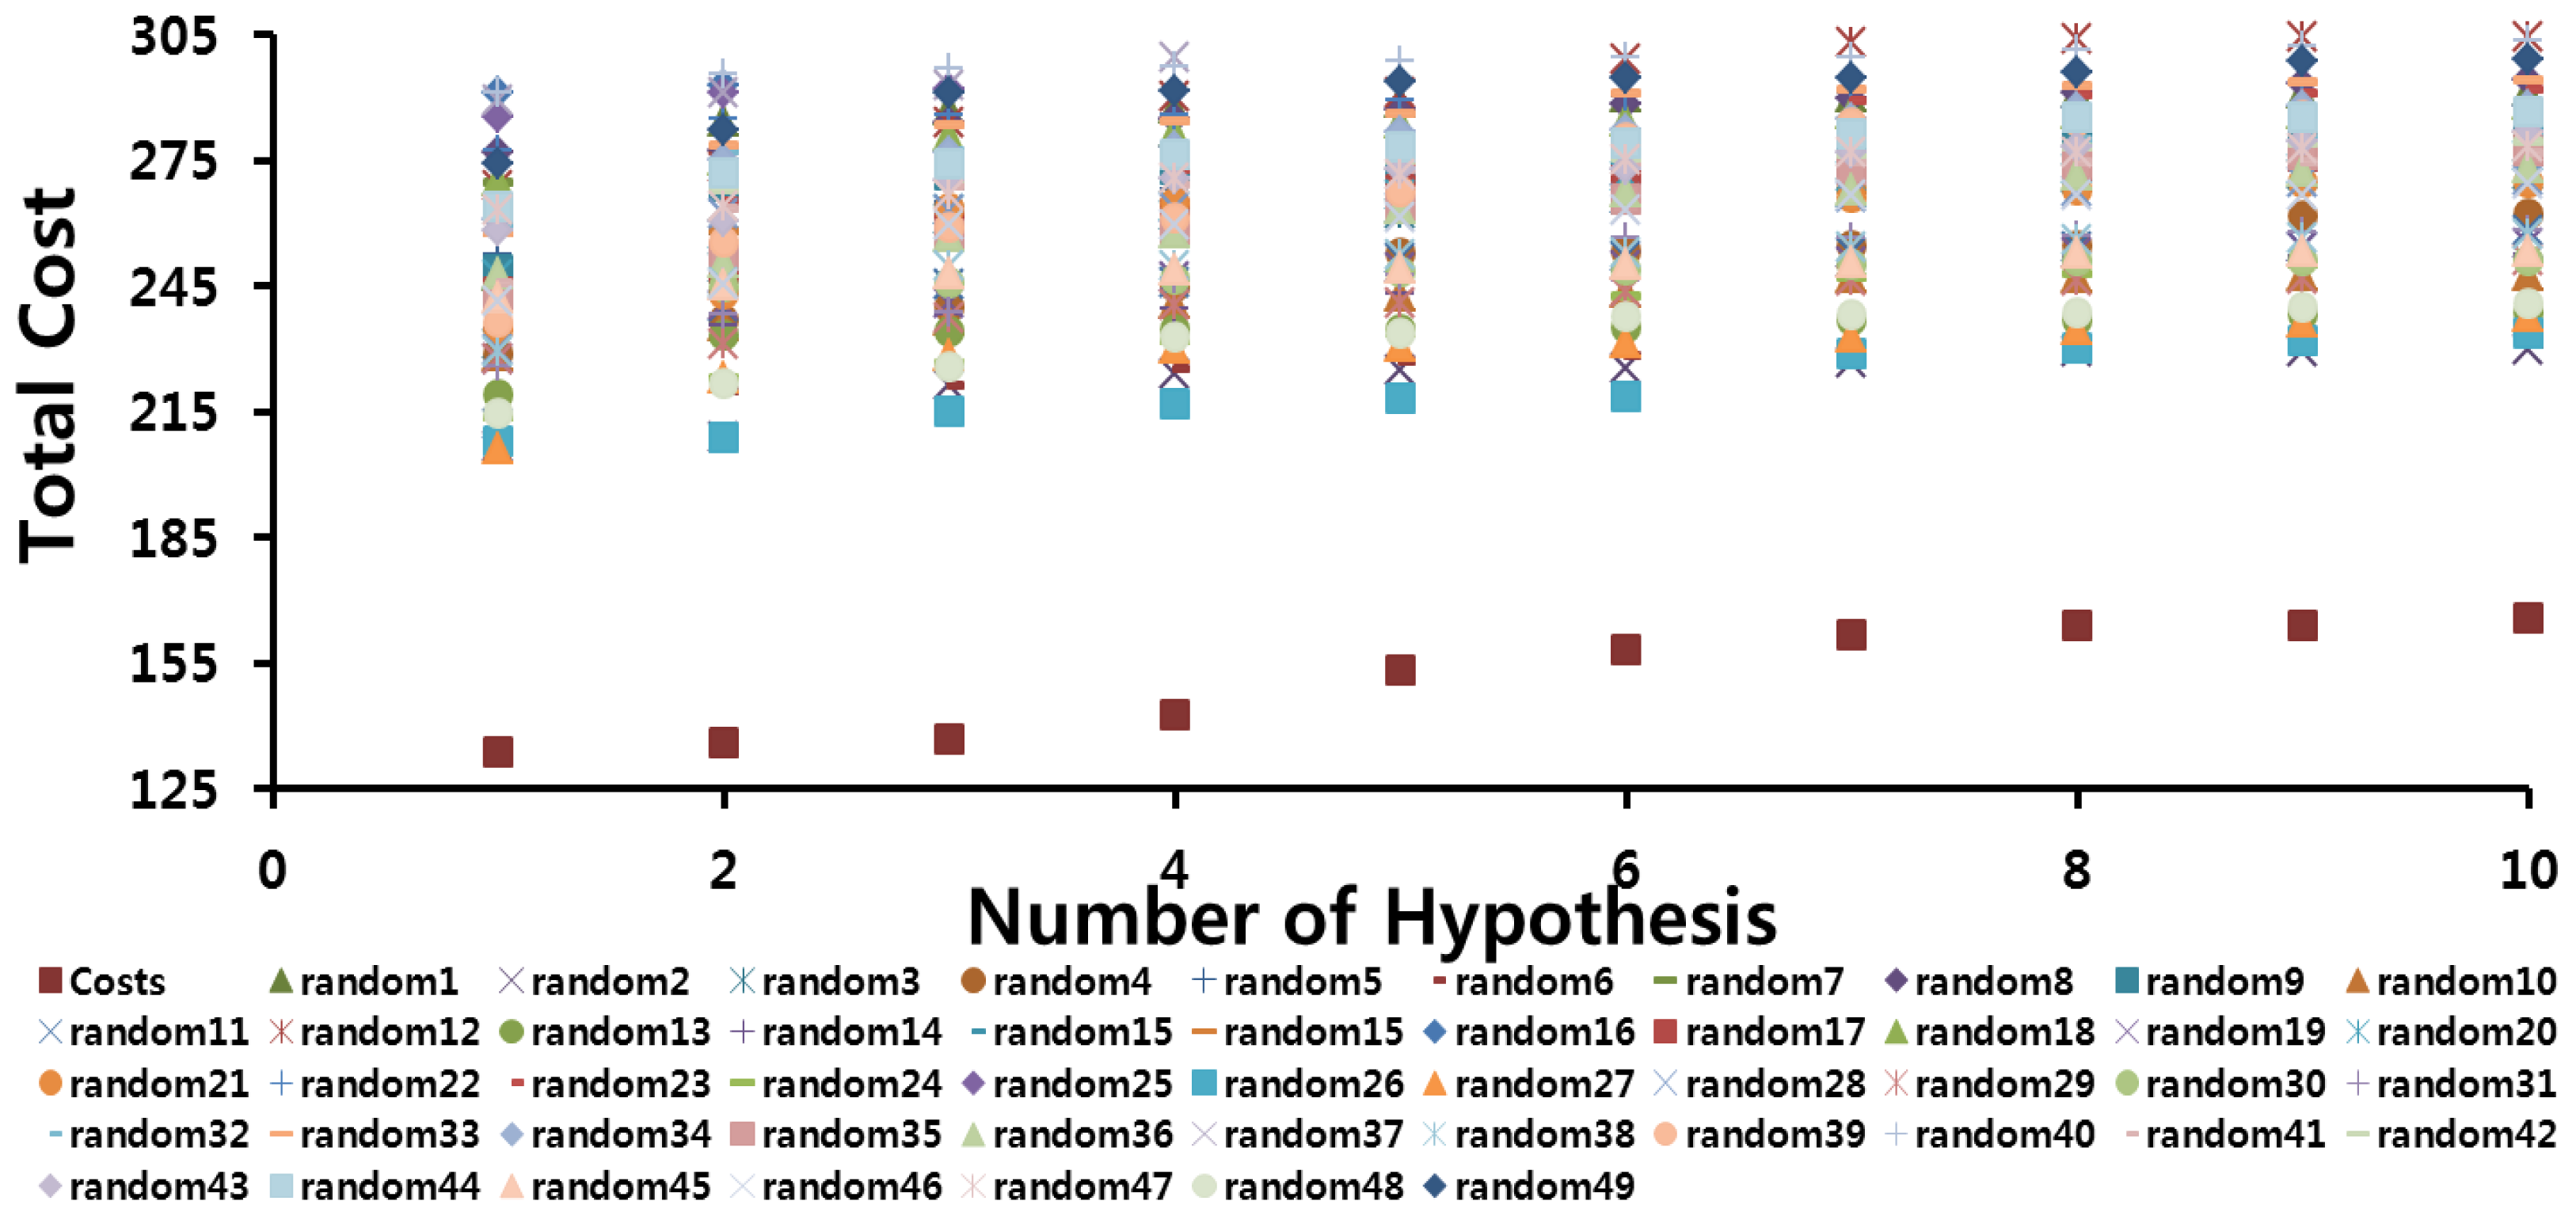
2.2.1. Fischer’s Randomization Test
2.2.2. Test Set Method
2.2.3. Decoy Set
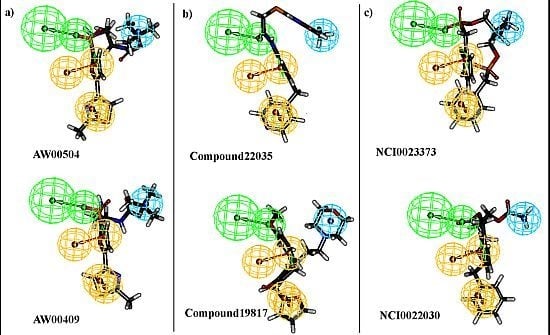
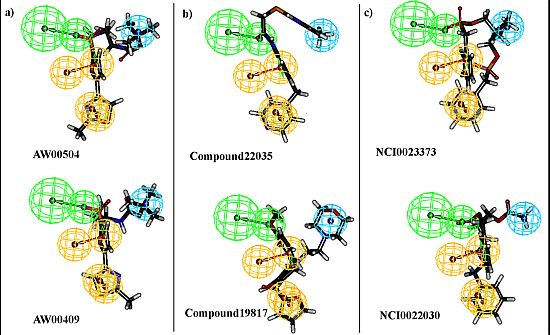
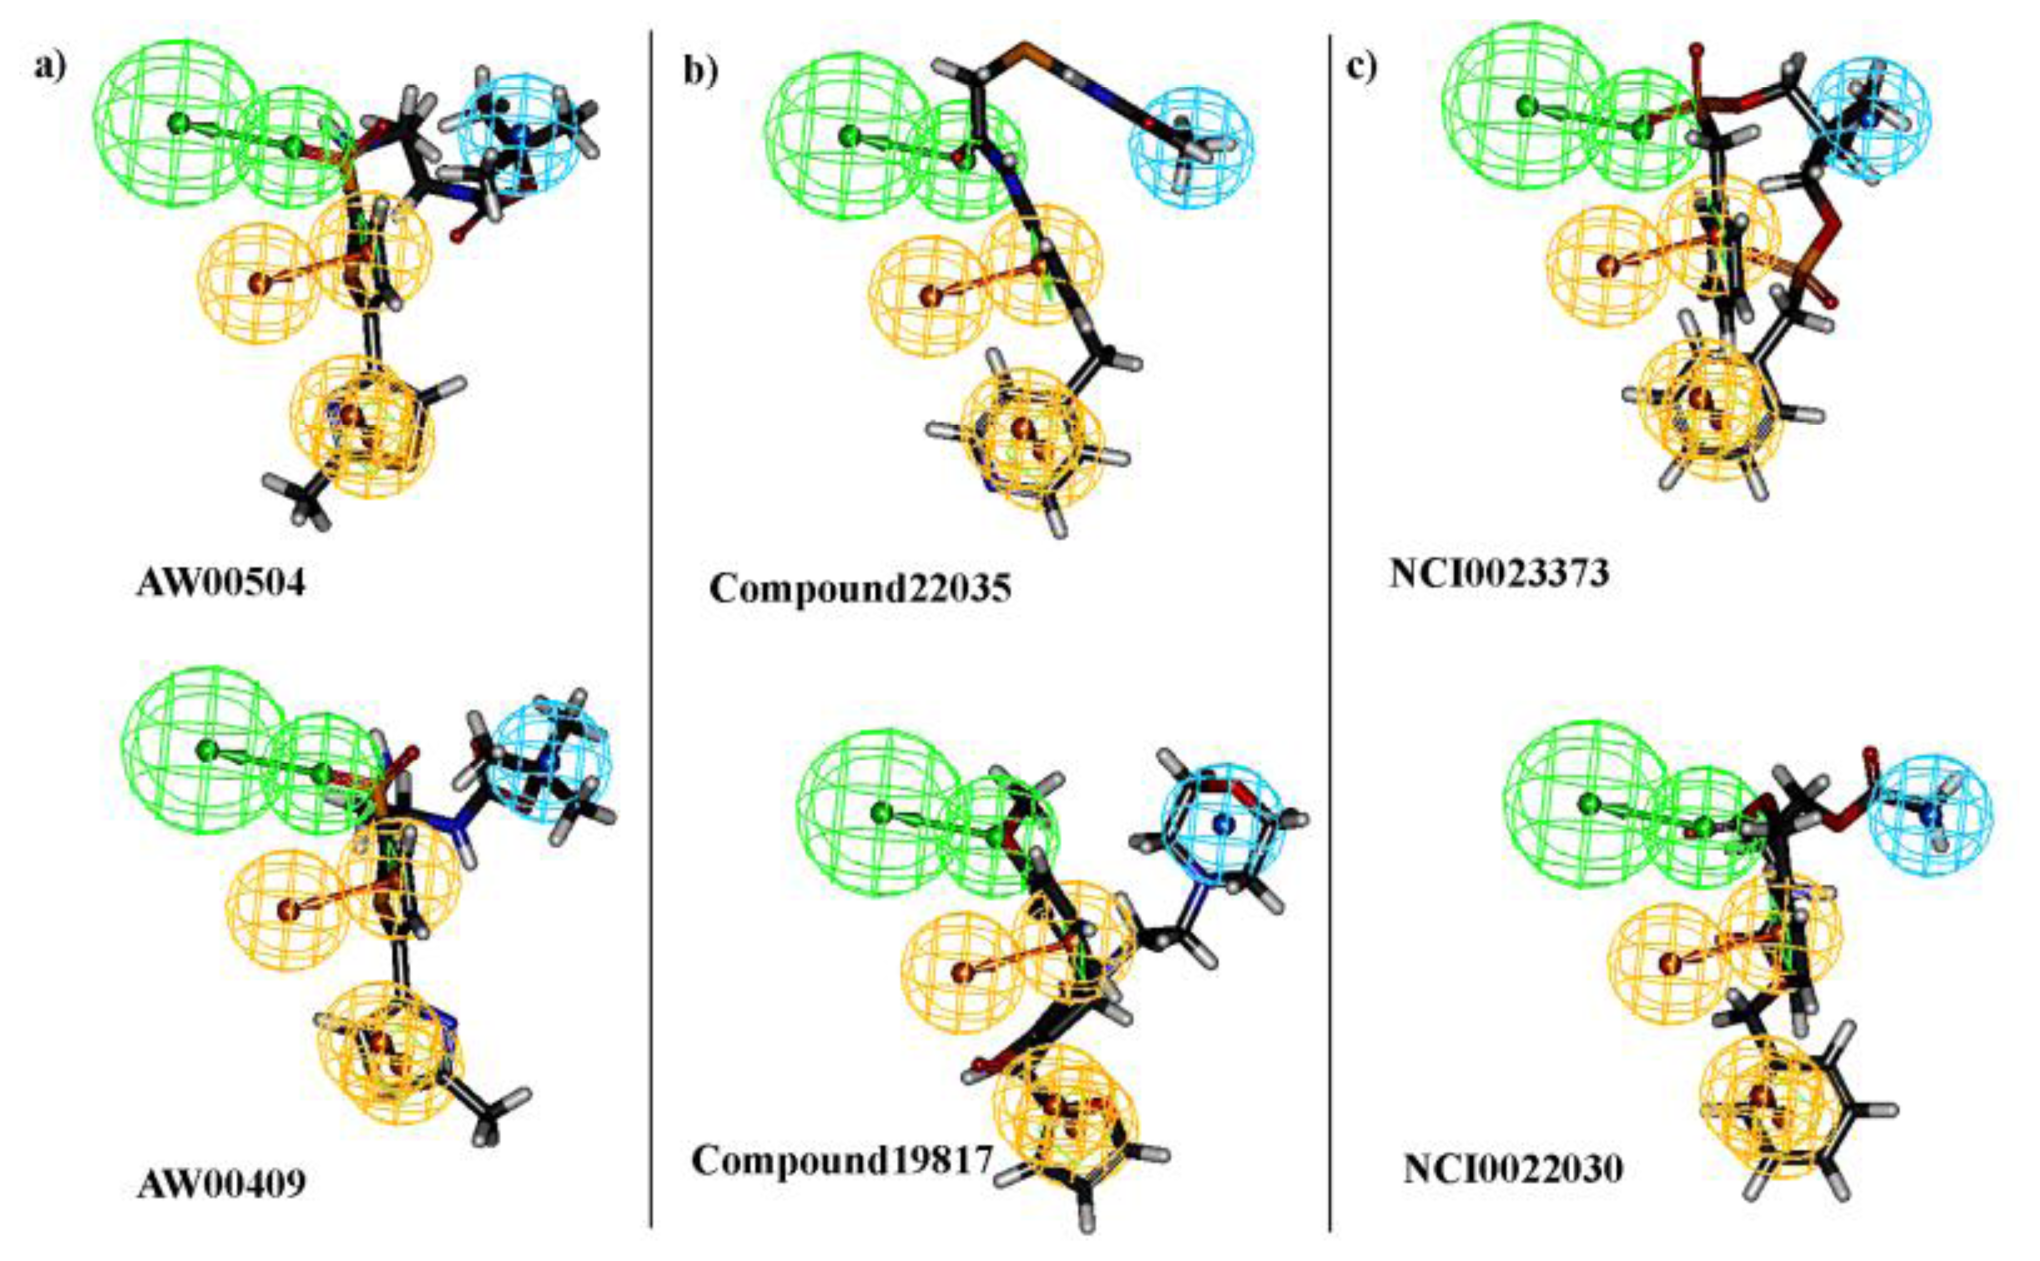
2.3. Pharmacophore Model Based Virtual Screening
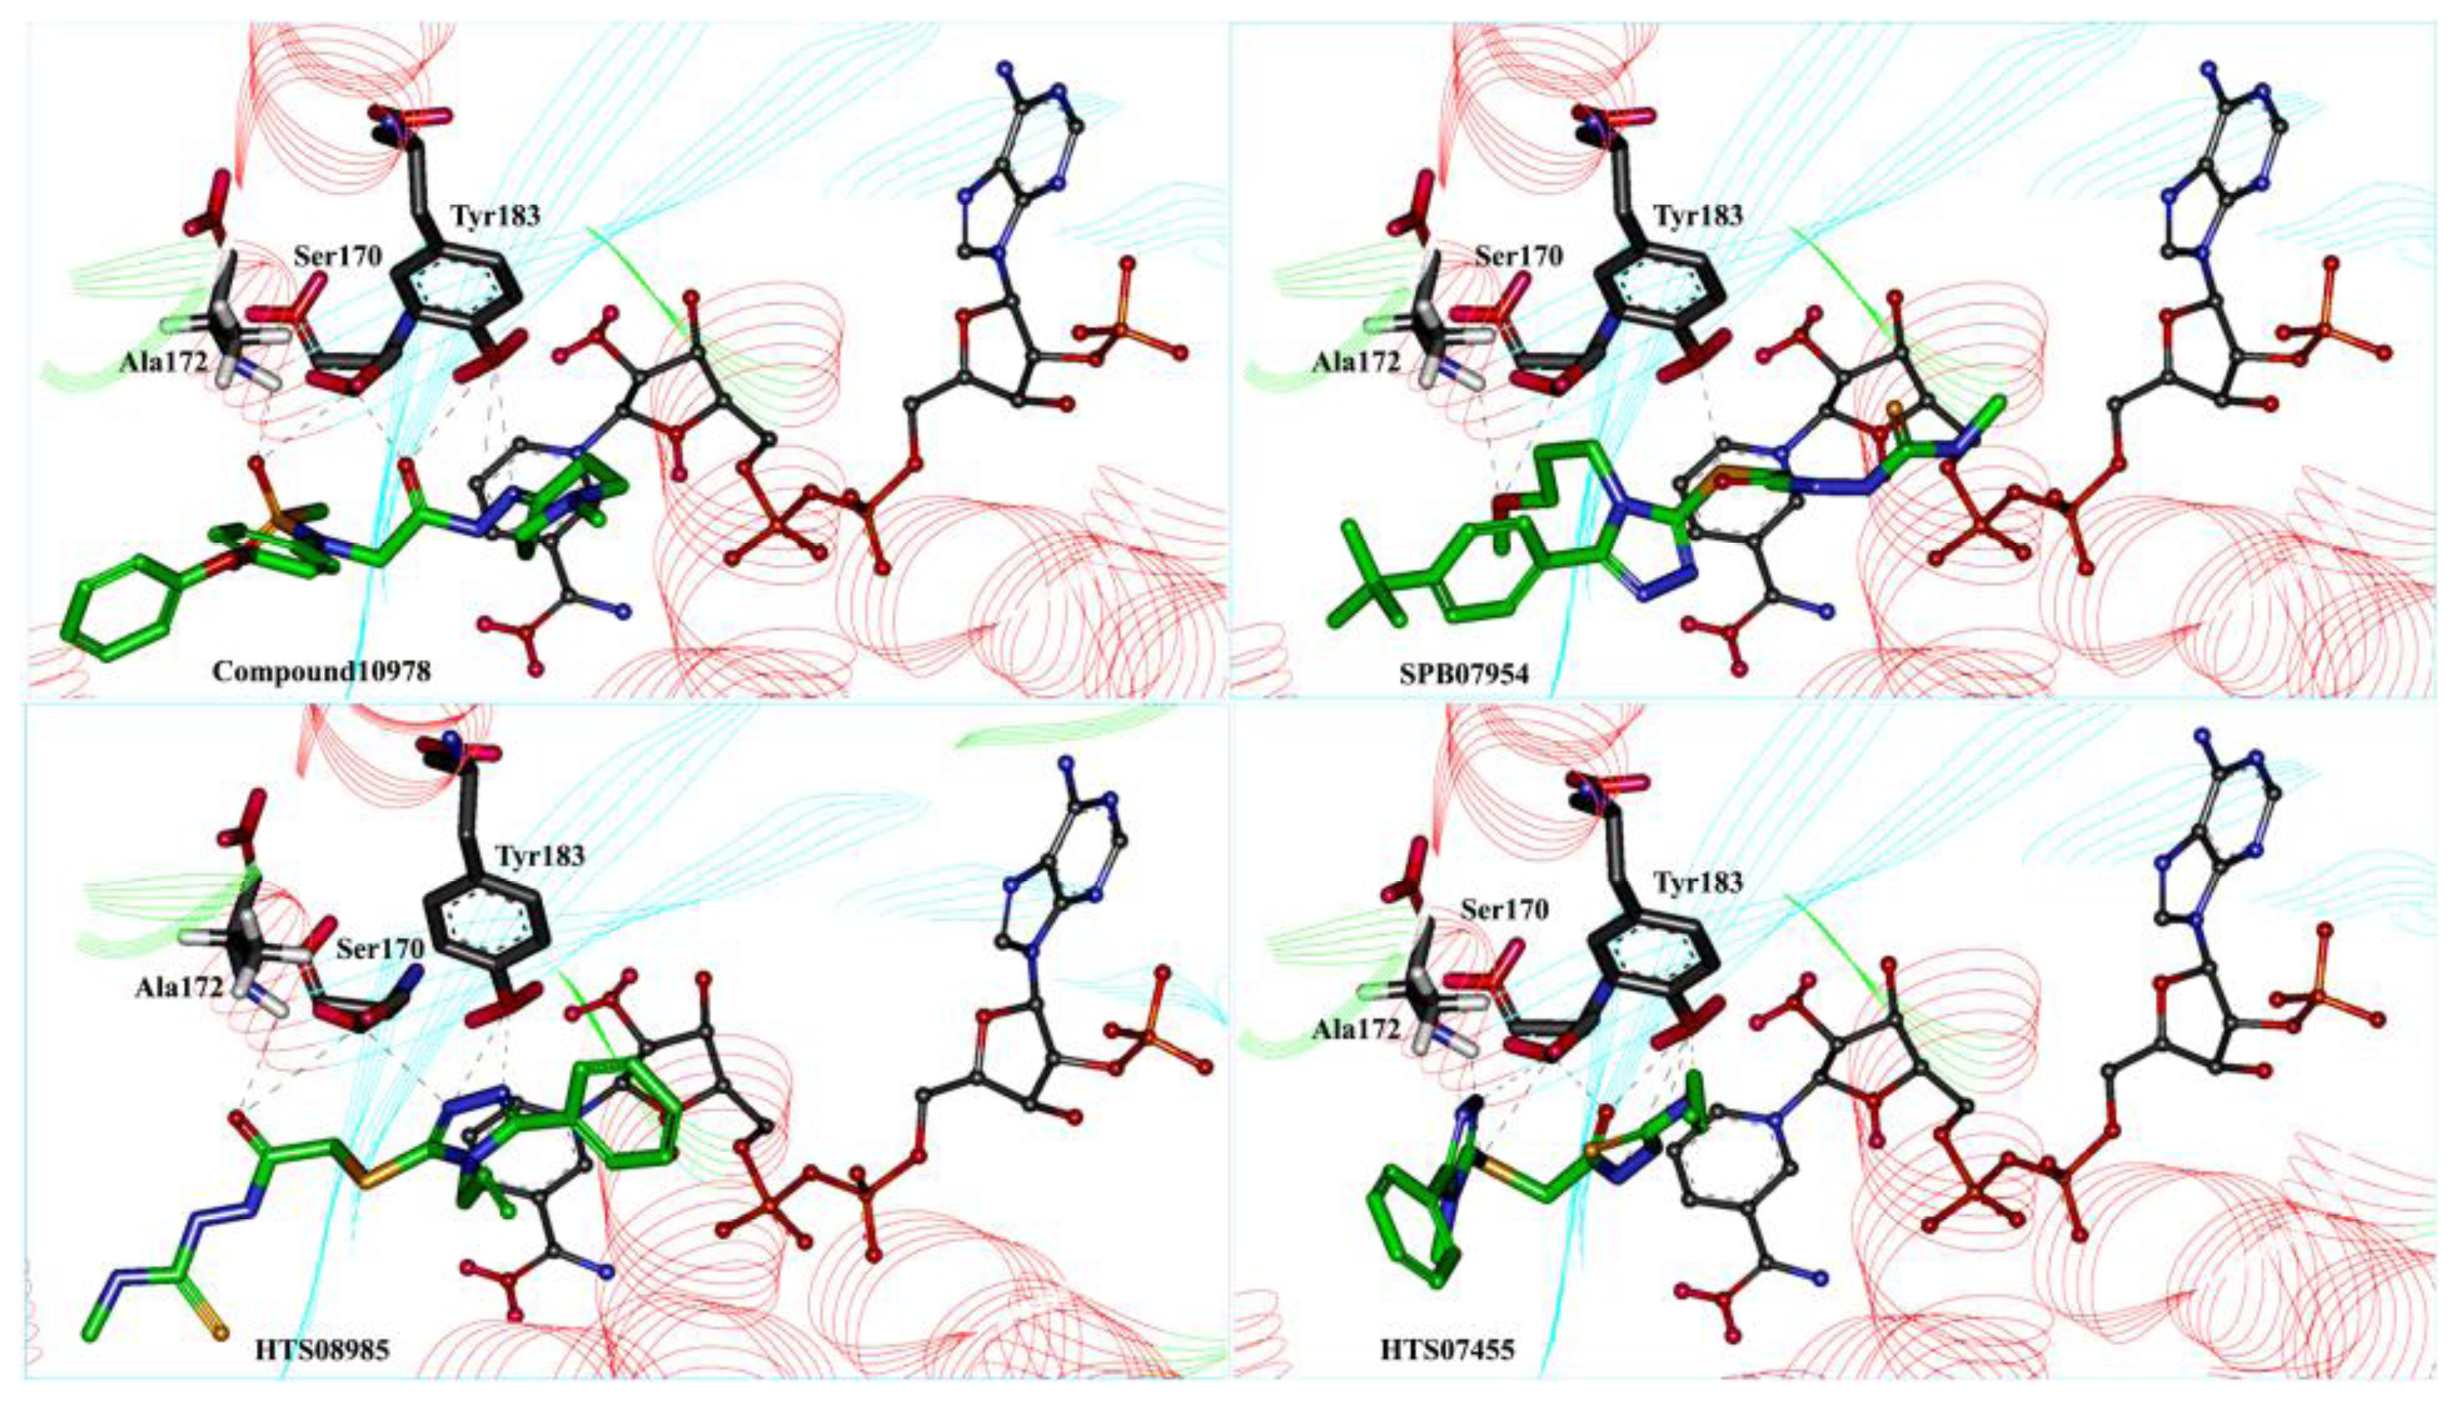
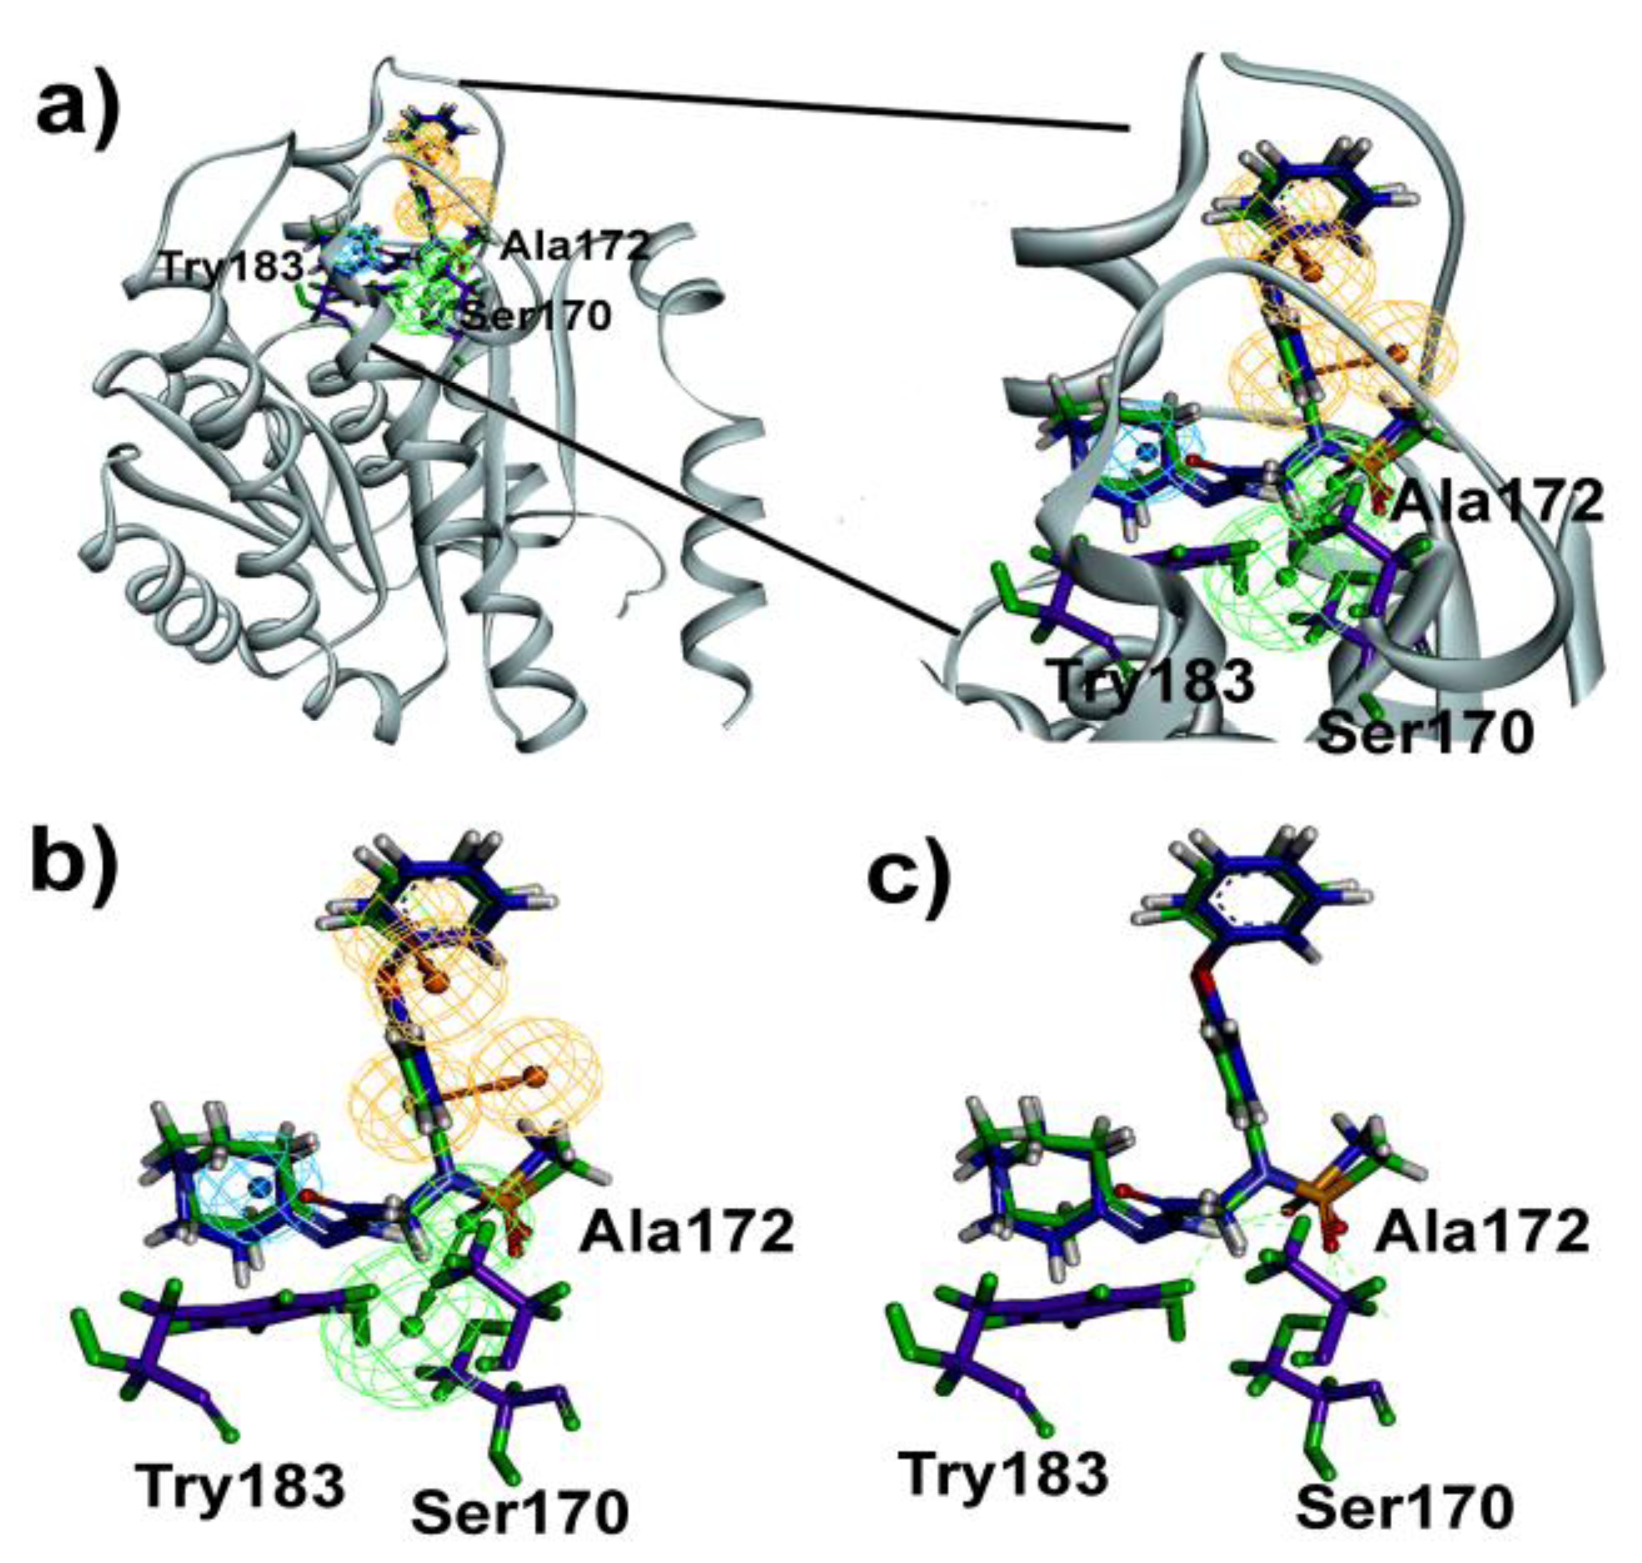
2.4. Molecular Docking
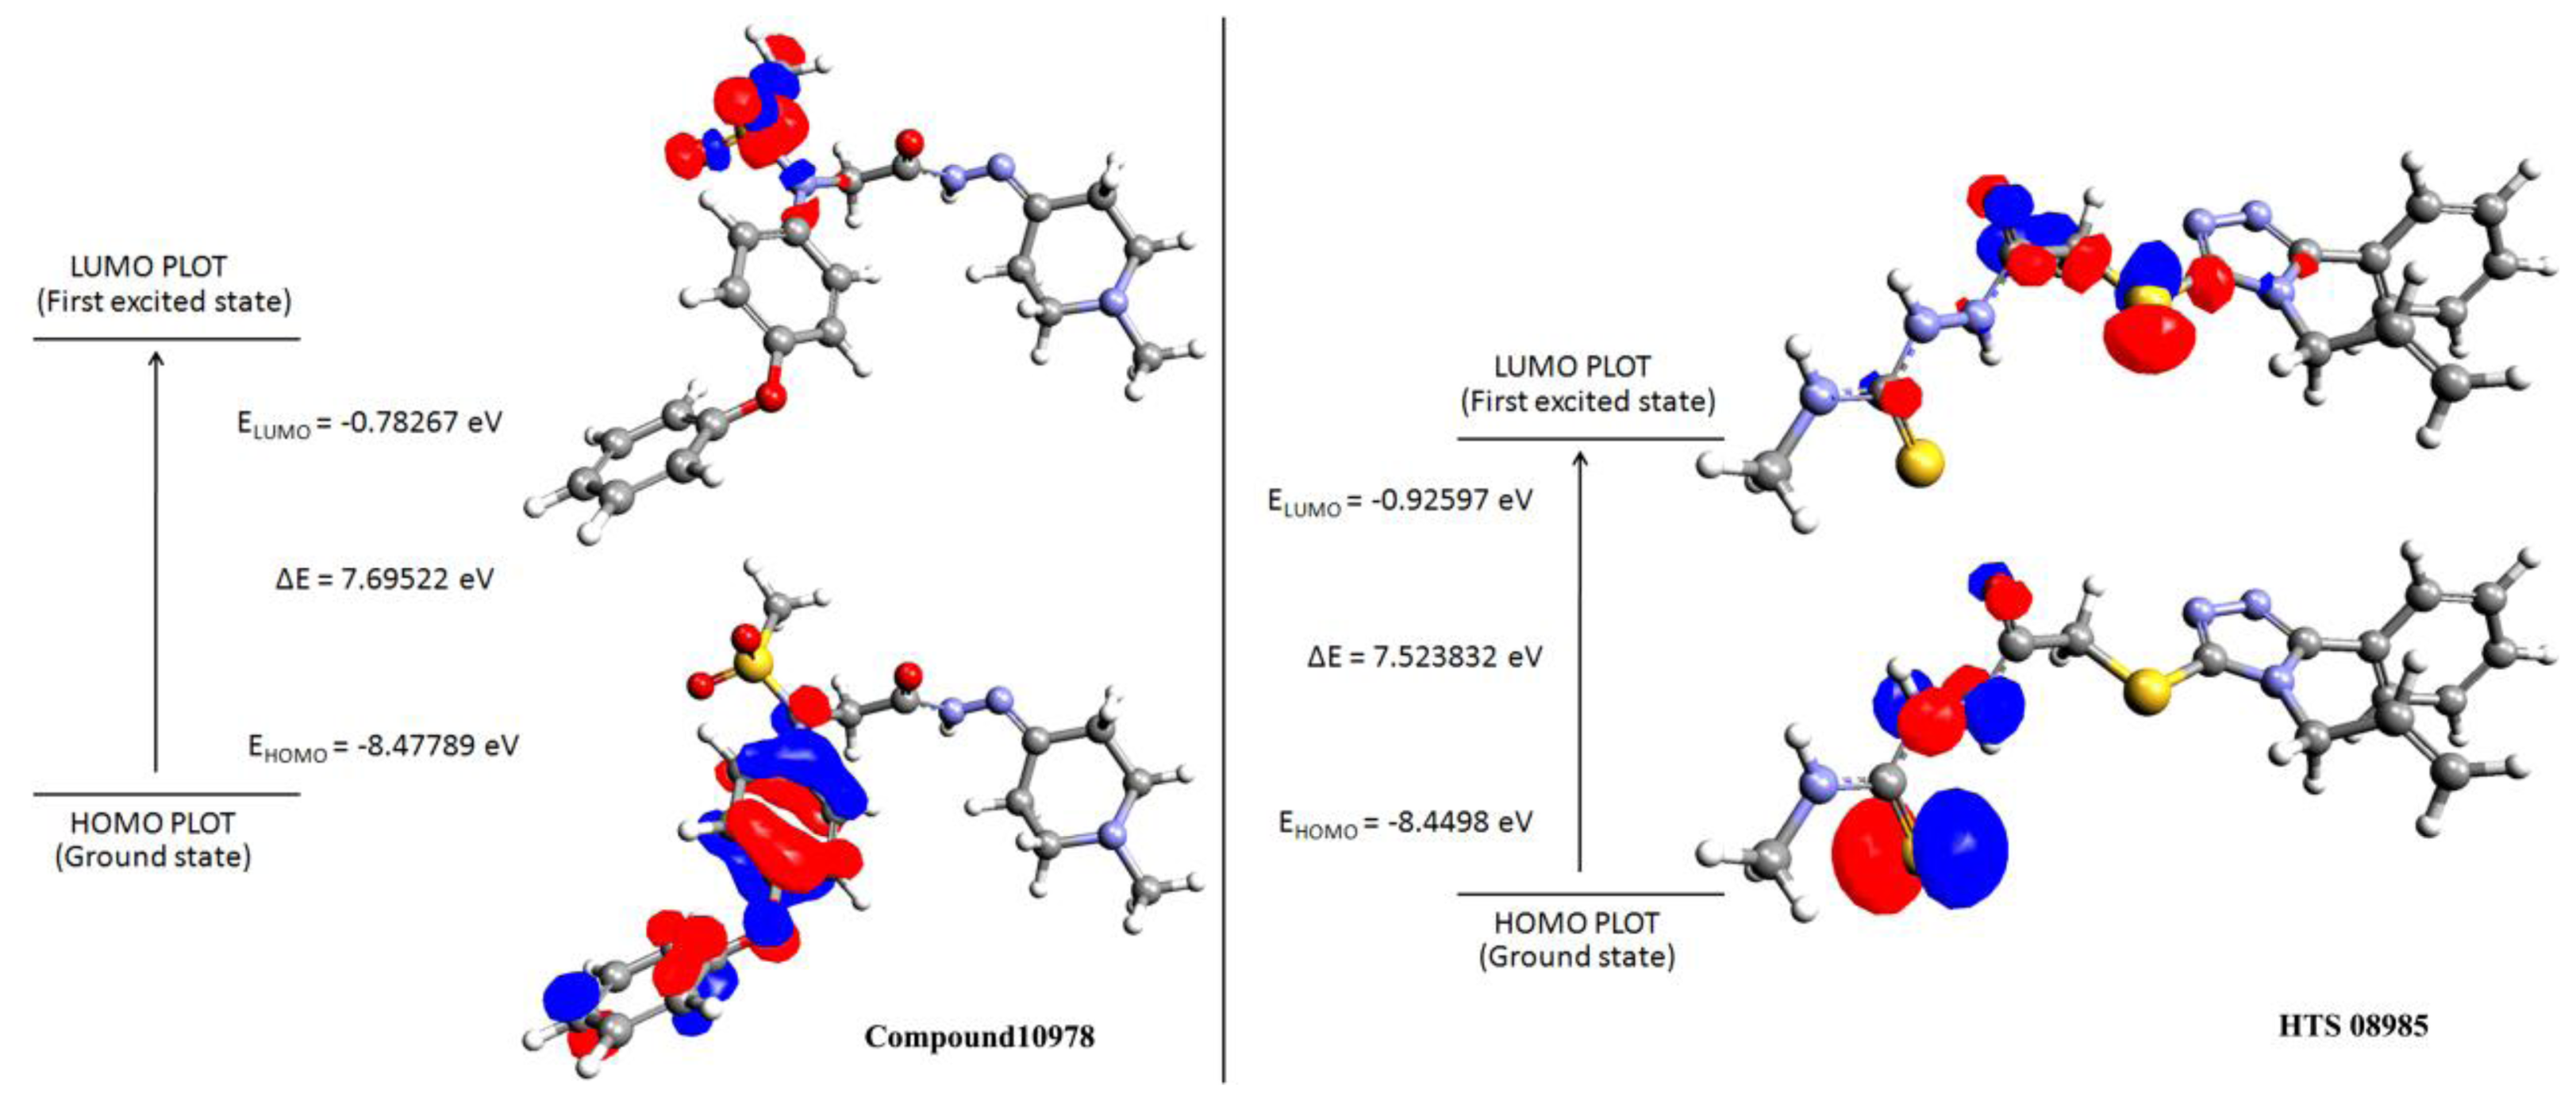
2.5. Density Functional Theory
3. Experimental Section
3.1. Pharmacophore Modeling
3.1.1. Training and Test Set Preparation
3.1.2. Pharmacophore Generation
3.2. Methods to Select the Best Pharmacophore Model and to Validate the Hypothesis
3.2.1. Debnath’s Analysis
3.2.2. Fischer’s Randomization Test
3.2.3. Test Set
3.2.4. Decoy Set
3.3. Virtual Screening
3.4. Molecular Docking
3.5. Density Functional Theory
4. Conclusions
Acknowledgments
References
- Lakshmi, V.; Monder, C. Purification and characterization of the corticosteroid 11β-dehydrogenase component of the rat liver 11β-hydroxysteroid dehydrogenase complex. Endocrinology 1998, 123, 2390–2398. [Google Scholar]
- Bujalska, I.J.; Kumar, S. Central obesity: “Cushing’s disease of the omentum”. Lancet 1997, 349, 1210–1213. [Google Scholar]
- Sandeep, T.C.; Yau, J.L.W.; MacLullich, A.M.J.; Noble, J.; Deary, I.J.; Walker, B.R.; Secki, J.R. 11β-Hydroxysteroid dehydrogenase inhibition improves cognitive function in healthy elderly men and type 2 diabetes. Proc. Natl. Acad. Sci. USA 2004, 101, 6734–6739. [Google Scholar]
- Small, G.R.; Hadoke, P.W.F.; Sharif, I.; Dover, A.R.; Armour, D.; Kenyon, C.J.; Gray, G.; Walker, B.R. Preventing local regeneration of glucocorticoids by 11β-hydroxysteroid dehydrogenase type 1 enhances angiogenesis. Proc. Natl. Acad. Sci. USA 2005, 102, 12165–12170. [Google Scholar]
- Gilmour, J.S.; Coutinho, A.E.; Cailhier, J.F.; Man, T.Y.; Clay, M.; Thomas, G.; Harris, H.J.; Mullins, J.J.; Seckl, J.R.; Savil, J.S.; Chapman, K.E. Local amplification of glucocorticoids by 11-beta-hydroxysteroid dehydrogenase type1 promites macrophage phagocytosis of apoptotic leukocytes. J. Immunol 2006, 176, 7605–7611. [Google Scholar]
- Rauz, S.; Cheung, C.M.G.; Wood, P.J.; Coca-Prados, M.; Walker, E.A.; Murray, P.I.; Stewart, P.M. Inhibition of 11-beta-hydroxysteroid dehydrogenase type 1 lowers intraocular pressure in patients with ocular hypertension. Q. J. Med 2006, 96, 481–490. [Google Scholar]
- Eijken, M.; Hewison, M.; Cooper, M.S.; De Jong, F.H.; Chiba, H.; Stewart, P.M.; Uitterlindn, A.G.; Pols, H.A.; van Leeuwen, J.P. 11-beta-Hydroxysteroid dehydrogenase expression and glucocorticoid synthesis are directed by a molecular switch during osteoblast differentiation. Mol. Endocrinol 2005, 19, 621–631. [Google Scholar]
- Hundertmark, S.; Dill, A.; Ebert, A. Foetal lung maturation in 11-beta-hydroxysteroid dehydrogenase type1 knockout mice. Horm. Metab. Res 2002, 34, 545–549. [Google Scholar]
- Thomas, F.J.; Thomas, M.J.; Tetsuka, M. Corticosteroid metanolism in human granulose-lutein cells. Clin. Endocrinol 1998, 48, 509–513. [Google Scholar]
- Kershaw, E.E.; Morton, N.M.; Dhillon, H.; Ramage, L.; Seckl, J.R.; Flierl, J.S. Adipose-specific glucocorticoid inactivation protects against diet-induced obesity. Diabetes 2005, 54, 1023–1031. [Google Scholar]
- Tomlinson, J.W.; Moore, J.; Cooper, M.S.; Bujalska, I.; Shahmanesh, M.; Burt, C.; Strain, A.; Hewison, M.; Stewart, P.M. Regulation of expression of 11β-hydroxysteroid dehydrogenase type1 in adipose: Tissue-specific induction by cytokines. Endocrinology 2001, 142, 1982–1989. [Google Scholar]
- Narf, T.B.; Williams, M. Recent progress in 11-beta-hydroxysteroid dehydrogenase type 1 (11-beta-HSD1) inhibitor development. Drugs Future 2006, 31, 231–243. [Google Scholar]
- Zimmet, P.; Alberti, K.G.; Shaw, J. Global and societal implications of the diabetes epidemic. Nature 2001, 414, 189–202. [Google Scholar]
- Eckel, R.H.; Grudy, S.M.; Zimmet, P.Z. The metabolic syndrome. Lancet 2005, 365, 1415–1428. [Google Scholar]
- Barf, T.; Vallgarda, J.; Emond, R.; Haggstroem, C.; Kurz, G.; Nygren, A.; Larwood, V.; Mosialou, E.; Axelsson, K.; Olsson, L.; et al. Arylsulfonamidothiazoles as a new class of potential antidiabetic drugs. Discovery of potent and selective inhibitors of the 11β-hydroxysteroid dehydrogenase type 1. J. Med. Chem 2002, 45, 3813–3815. [Google Scholar]
- Yang, H.; Dou, W.; Lou, J.; Leng, Y.; Shen, J. Discovery of novel inhibitors of 11β-hydroxysteroid dehydrogenase type 1 by docking and pharmacophore modeling. Bioorg. Med. Chem. Lett 2008, 18, 1340–1345. [Google Scholar]
- Thomas, F.J.; Thomas, M.J.; Tetsuka, M. Corticosteroid metabolism in human granulose-lutein cells. Clin. Endocrinol 1998, 48, 509–513. [Google Scholar]
- Tomlinson, J.W.; Moore, J.; Cooper, M.S.; Bujalska, I.; Shahmanesh, M.; Burt, C.; Strain, A.; Hewison, M.; Stewart, P.M. Regulation of expression of 11β-hydroxysteroid dehydrogenase type1 in adipose: Tissue-specific induction by cytokines. Endocrinology 2001, 142, 1982–1989. [Google Scholar]
- Auriekson, N.Q.; Bruno, A.Q.G.; Waldir, M.M.; Rosivaldo, S.B. A theoretical antioxidant pharmacophore for resveratrol. Eur. J. Med. Chem 2009, 44, 1644–1649. [Google Scholar]
- Webster, S.P.; Ward, P.; Binnie, M.; Craigie, E.; McConnell, K.M.M.; Vinter, A.; Seckl, J.R.; Walker, B.R. Discovery and biological evaluation of adamantly amide 11β-HSD1 inhibitors. Bioorg. Med. Chem. Lett 2007, 17, 2838–2843. [Google Scholar]
- Flyren, K.; Bergquist, L.O.; Castro, V.M.; Fotsch, C.; Johansson, L.; Jean, D.J.; Sutin, L.; Meredith, W. Piperidine amides as 11β-hydroxysteroid dehysrogenase type 1 inhibitors. Bioorg. Med. Chem. Lett 2007, 17, 3421–3425. [Google Scholar]
- Yuan, C.; Jean, J.S., Jr; Liu, A.; Cai, L.; Li, A.; Han, H.; Moniz, G.; Askew, B.; Hungate, R.W.; Johansson, L.; et al. The discovery of 2-anilonothiazoles as 11α-HSD1 inhibitors. Bioorg. Med. Chem. Lett 2007, 17, 6056–6061. [Google Scholar]
- Wang, H.; Ruan, Z.; Li, J.J.; Simpkins, L.M.; Smirk, R.A.; Wu, S.C.; Hutchins, R.D.; Nirschl, D.S.; Kirk, K.V.; Cooper, C.B.; et al. Pyridine amides as potent and selective inhibitors of 11β-hydroxysteroid dehydrogenase type 1. Bioorg. Med. Chem. Lett 2008, 18, 3168–3172. [Google Scholar]
- Sun, D.; Wang, Z.; Di, Y.; Jaen, J.C.; Labelle, M.; Ma, J.; Miao, S.; Sudom, A.; Tang, L.; Tomooka, C.S.; et al. Discovery and initial SAR of arylsulfonylpiperazine inhibitors of 11β-hydroxysteroid dehydrogenase type 1 (11β-HSD1). Bioorg. Med. Chem. Lett 2008, 18, 3513–3516. [Google Scholar]
- Rew, Y.; McMinn, D.L.; Wang, Z.; He, Z.; Hungate, R.W.; Jaen, C.J.; Sudom, A.; Sun, D.; Tu, H.; Ursu, S.; et al. Discovery and optimization of piperidyl benzamide derivatives as a novel class of 11β-HSD1 inhibitors. Bioorg. Med. Chem. Lett 2009, 19, 1797–1801. [Google Scholar]
- Huaiyu, H.; Shen, Y.; Chen, J.; Jiang, Q.; Leng, Y.; Shen, J. Structure-based virtual screening for identification of novel 11β-HSD1 inhibitors. Eur. J. Med. Chem 2009, 44, 1167–1171. [Google Scholar]
- Eijken, M.; Hewison, M.; Cooper, M.S. 11-beta-Hydroxysteroid dehydrogenase expression and glucocorticoid synthesis are directed by a molecular switch during osteoblast differentiation. Mol. Endocrinol 2005, 19, 621–631. [Google Scholar]
- Hundertmark, S.; Dill, A.; Ebert, A. Foetal lung maturation in 11-beta-hydroxysteroid dehydrogenase type1 knockout mice. Horm. Metab. Res 2002, 34, 545–549. [Google Scholar]
- NCI. Available online: http://www.NCI.com accessed on 16 February 2011.
- Maybridge Chemical Company Ltd. Available online: http://www.maybridge.com accessed on 16 February 2011.
- Chembridge Corporation. Chembridge Chemical Database. Available online: http://chembridge.com accessed on 16 February 2011.
- Lipinsky, C.A.; Lombardo, F.; Dominy, B.W.; Feeney, P. Experimental and computational approaches to estimate solubility and permeability in drug discovery and development settings. Adv. Drug Delivery Rev 1997, 23, 3–25. [Google Scholar]
- Jones, G.; Willet, P.; Glen, R.C. Molecular recognition of receptor sites using a genetic algorithm with a description of desolvation. J. Mol. Biol 1995, 245, 43–53. [Google Scholar]
- Jones, G.; Willet, P.; Glen, R.C.; Taylor, R. Development and validation of a genetic algorithm for flexible docking. J. Mol. Biol 1997, 267, 727–748. [Google Scholar]
- Berman, H.M.; Westbrook, J.; Feng, Z.; Gililand, G.; Bhat, T.N.; Weissig, H.; Shindyalov, I.N.; Bourne, P.E. The protein data bank. Nucleic Acids Res 2000, 28, 235–242. [Google Scholar]
- Gaussian, Revision C.02; Gaussian, Inc: Wallingford, CT, USA, 2004.
- Schlegel, H.B. Optimization of equilibrium geometries and transition structures. J. Comput. Chem 1982, 3, 214–218. [Google Scholar]
- Gece, G. The use of quantum chemical methods in corrosion inhibitor studies. Corros. Sci 2008, 50, 2981–2992. [Google Scholar]
- Fukui, K. Role of frontier orbitals in chemical reactions. Science 1982, 218, 747–754. [Google Scholar]
- Lewis, D.F.V.; Ioannides, C.; Parke, D.V. Interaction of a series of nitriles with the alcohol-inducible isoform of P450: Computer analysis of structure-activity relationships. Xenobiotica 1994, 24, 401–408. [Google Scholar]


| Hypo No. | Total Cost | Cost Difference a | RMS | Correlation | Features b | Max. Fit | ||
|---|---|---|---|---|---|---|---|---|
| HBA | Hy-Ali | RA | ||||||
| Hypo1 | 133.91 | 157.30 | 1.21 | 0.94 | 1 | 1 | 2 | 11.81 |
| Hypo2 | 136.12 | 155.09 | 1.26 | 0.93 | 1 | 1 | 2 | 11.09 |
| Hypo3 | 136.85 | 154.36 | 1.26 | 0.93 | 1 | 1 | 2 | 12.51 |
| Hypo4 | 142.56 | 148.65 | 1.49 | 0.91 | 1 | 1 | 2 | 10.57 |
| Hypo5 | 153.2 | 138.01 | 1.69 | 0.88 | 1 | 1 | 2 | 11.09 |
| Hypo6 | 158.37 | 132.84 | 1.85 | 0.85 | 1 | 2 | 1 | 8.28 |
| Hypo7 | 161.76 | 129.45 | 1.86 | 0.85 | 1 | 1 | 2 | 11.01 |
| Hypo8 | 164.01 | 127.20 | 1.95 | 0.84 | 1 | 1 | 2 | 8.67 |
| Hypo9 | 164.08 | 127.13 | 1.79 | 0.87 | 1 | 2 | 1 | 13.13 |
| Hypo10 | 165.89 | 125.32 | 1.98 | 0.83 | 1 | 2 | 1 | 8.86 |
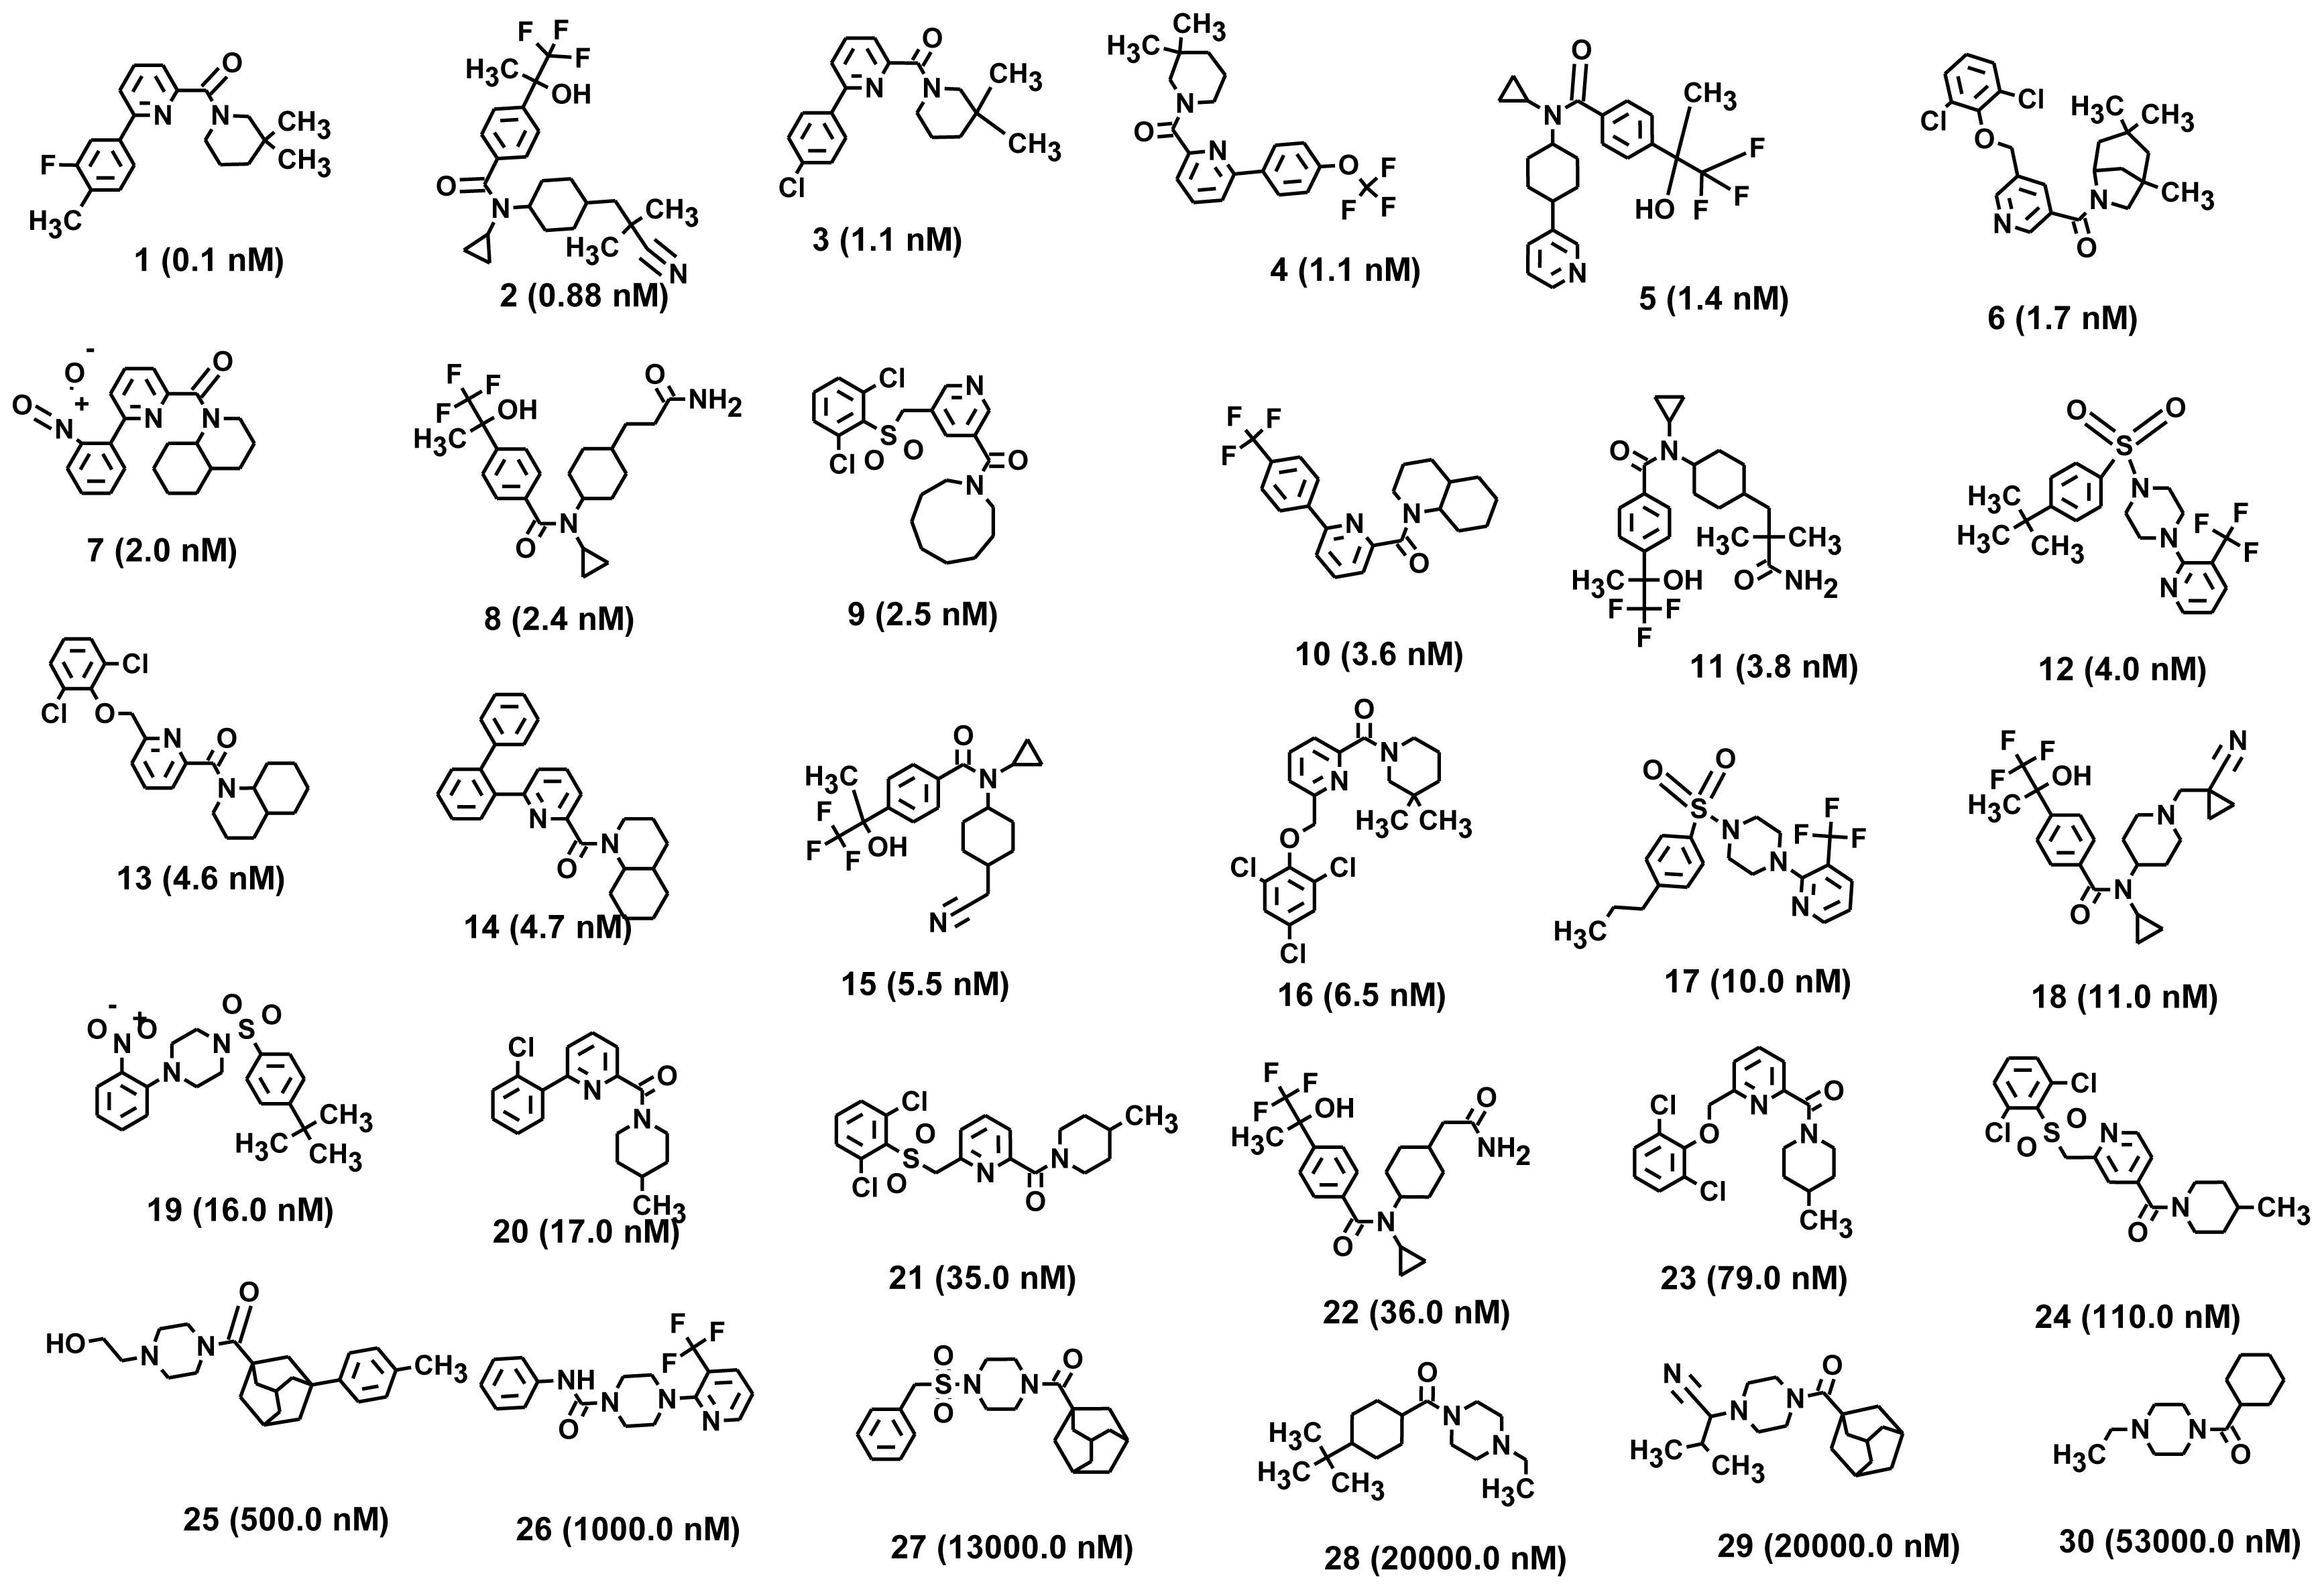
| Compound No. | Fit Value a | Exp.IC50 nM | Pred.IC50 nM | Error | Exp. Scale b | Pred. Scale b |
|---|---|---|---|---|---|---|
| 1 | 9.39 | 0.1 | 0.61 | 6.1 | +++ | +++ |
| 2 | 8.49 | 0.88 | 4.9 | 5.5 | +++ | +++ |
| 3 | 9.5 | 1.1 | 0.48 | −2.3 | +++ | +++ |
| 4 | 9.4 | 1.1 | 0.6 | −1.8 | +++ | +++ |
| 5 | 8.54 | 1.4 | 4.3 | 3.1 | +++ | +++ |
| 6 | 8.71 | 1.7 | 2.9 | 1.7 | +++ | +++ |
| 7 | 9.45 | 2 | 0.53 | −3.8 | +++ | +++ |
| 8 | 8.62 | 2.4 | 3.6 | 1.5 | +++ | +++ |
| 9 | 8.03 | 2.5 | 14 | 5.6 | +++ | ++ |
| 10 | 8.72 | 3.6 | 2.9 | −1.3 | +++ | +++ |
| 11 | 8.52 | 3.8 | 4.5 | 1.2 | +++ | +++ |
| 12 | 8.17 | 4 | 10 | 2.5 | +++ | ++ |
| 13 | 8.71 | 4.6 | 3 | −1.6 | +++ | +++ |
| 14 | 8.71 | 4.7 | 3 | −1.6 | +++ | +++ |
| 15 | 8.55 | 5.5 | 4.3 | −1.3 | +++ | +++ |
| 16 | 8.6 | 6.5 | 3.8 | −1.7 | +++ | +++ |
| 17 | 8.2 | 10 | 9.5 | −1.1 | ++ | +++ |
| 18 | 7.33 | 11 | 71 | 6.4 | ++ | ++ |
| 19 | 7.84 | 16 | 22 | 1.4 | ++ | ++ |
| 20 | 7.95 | 17 | 17 | −1 | ++ | ++ |
| 21 | 7.87 | 35 | 20 | −1.7 | ++ | ++ |
| 22 | 8.46 | 36 | 5.2 | −6.9 | ++ | + |
| 23 | 7.7 | 79 | 30 | −2.7 | ++ | ++ |
| 24 | 6.91 | 110 | 180 | 1.7 | + | + |
| 25 | 5.84 | 500 | 2200 | 4.4 | + | + |
| 26 | 5.61 | 1000 | 3700 | 3.7 | + | + |
| 27 | 5.48 | 13,000 | 5000 | −2.6 | + | + |
| 28 | 5.49 | 20,000 | 4900 | −4.1 | + | + |
| 29 | 5.4 | 20,000 | 5900 | −3.4 | + | + |
| 30 | 5.4 | 53,000 | 6000 | −8.8 | + | + |
| Compound No. | Fit Value a | Exp. IC50nM | Pred. IC50nM | Error | Exp. Scale b | Pred. Scale b |
|---|---|---|---|---|---|---|
| 1 | 7.273 | 2.90 | 2.94 | +1.01 | +++ | +++ |
| 2 | 8.711 | 7.20 | 8.66 | +1.20 | +++ | +++ |
| 3 | 5.202 | 11 | 17.54 | +1.59 | ++ | ++ |
| 4 | 6.608 | 22 | 41.42 | +1.88 | ++ | ++ |
| 5 | 6.549 | 74 | 80.70 | +1.09 | ++ | ++ |
| 6 | 6.721 | 123 | 424.94 | +3.45 | + | + |
| 7 | 7.936 | 218 | 257.82 | +1.18 | + | + |
| 8 | 5.82 | 282 | 287.97 | +1.02 | + | + |
| 9 | 6.769 | 381 | 373.32 | −1.02 | + | + |
| 10 | 6.181 | 381 | 427.44 | +1.12 | + | + |
| 11 | 6.255 | 850 | 842 | −1.01 | + | + |
| 12 | 5.603 | 980 | 997.78 | +1.02 | + | + |
| 13 | 8.243 | 1730 | 1182.70 | −1.46 | + | + |
| 14 | 6.009 | 2050 | 2079.91 | +1.01 | + | + |
| 15 | 7.563 | 2130 | 2824.87 | +1.33 | + | + |
| 16 | 5.729 | 2250 | 1791.88 | −1.26 | + | + |
| 17 | 5.862 | 2350 | 1096.74 | −2.14 | + | + |
| 18 | 5.977 | 4670 | 3576 | −1.31 | + | + |
| 19 | 6.552 | 10000 | 1850.38 | −5.40 | + | + |
| 20 | 4.857 | 10000 | 21026 | +2.10 | + | + |
| No. | Parameter | Values |
|---|---|---|
| 1 | Total number of molecules in database | 1300 |
| 2 | Total number of actives in database (A) | 13 |
| 3 | Total number of hit molecules from the database (Ht) | 12 |
| 4 | Total number of active molecules in hit list (Ha) | 9 |
| 5 | % yield of actives[(Ha/Ht) × 100] | 75 |
| 6 | % Ratio of actives [(Ha/A) × 100] | 69.23 |
| 7 | Enrichment Factor (EF) | 7.5 |
| 8 | False negatives [A − Ha] | 4 |
| 9 | False Positives [Ht − Ha] | 3 |
| 10 | Goodness of fit score (GH) | 0.73 |
| Name | Structure | Gold Score | S(hb_ext) | S(vdw_ext) |
|---|---|---|---|---|
| Compound 23516 |  | 62.61 | 2.05 | 44.05 |
| HTS 05706 |  | 64.01 | 0.61 | 46.11 |
| NCI0022030 |  | 64.11 | 8.45 | 40.49 |
| NCI0025130 |  | 64.75 | 4.52 | 43.81 |
| KM 10378 |  | 65.43 | 1.45 | 46.56 |
| SPB 02668 |  | 65.93 | 7.07 | 42.82 |
| RJC 03502 |  | 66.29 | 1.08 | 47.45 |
| JFD 03179 |  | 66.84 | 1.42 | 47.62 |
| SCR 00436 |  | 67.04 | 0.15 | 48.68 |
| SCR 00883 |  | 67.87 | 3.32 | 46.94 |
| Compound 10978 |  | 68.04 | 1.75 | 48.25 |
| HTS 07455 | 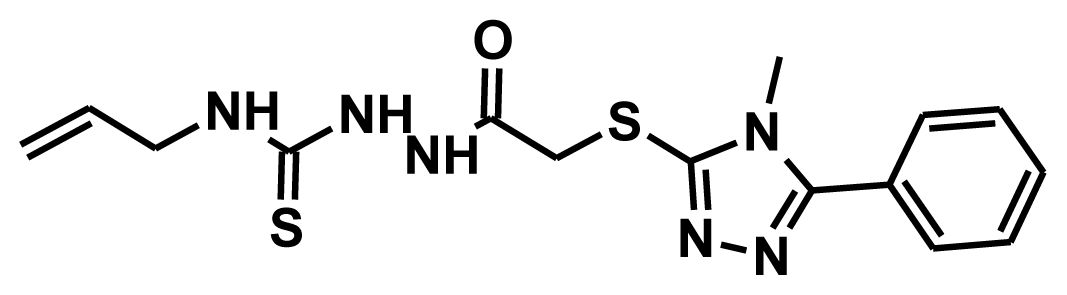 | 72.24 | 2.23 | 50.94 |
| HTS 08985 | 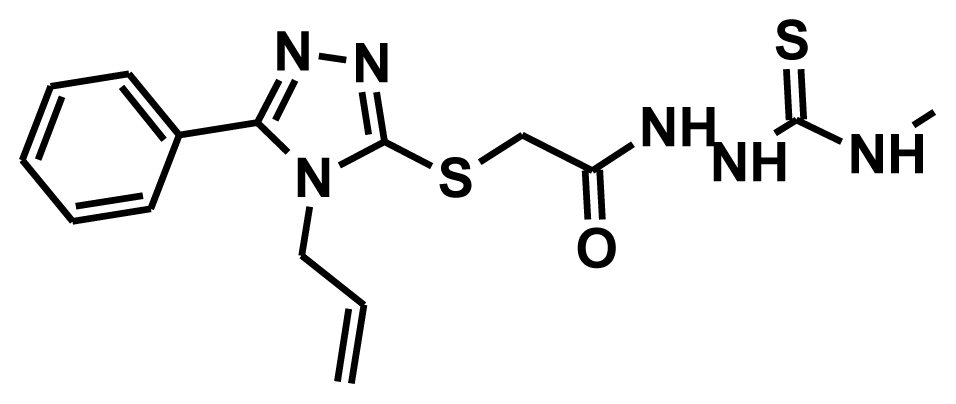 | 75.27 | 3.00 | 52.59 |
| NCI0050873 |  | 75.46 | 6.03 | 50.53 |
| KM 06091 |  | 75.56 | 4.00 | 52.07 |
| NCI0031862 |  | 76.17 | 2.28 | 53.78 |
| SPB 07954 |  | 83.04 | 0.62 | 59.95 |
| Name | Structure | HOMO | LUMO | ΔE a |
|---|---|---|---|---|
| KM 06091 |  | −8.31 | −0.93 | 7.37 |
| HTS 08985 |  | −8.44 | −0.92 | 7.52 |
| Compound 10978 |  | −8.47 | −0.78 | 7.69 |
| HTS 07455 |  | −8.48 | −0.63 | 7.84 |
| SPB 07954 |  | −8.51 | −0.79 | 7.71 |
| Training9 | 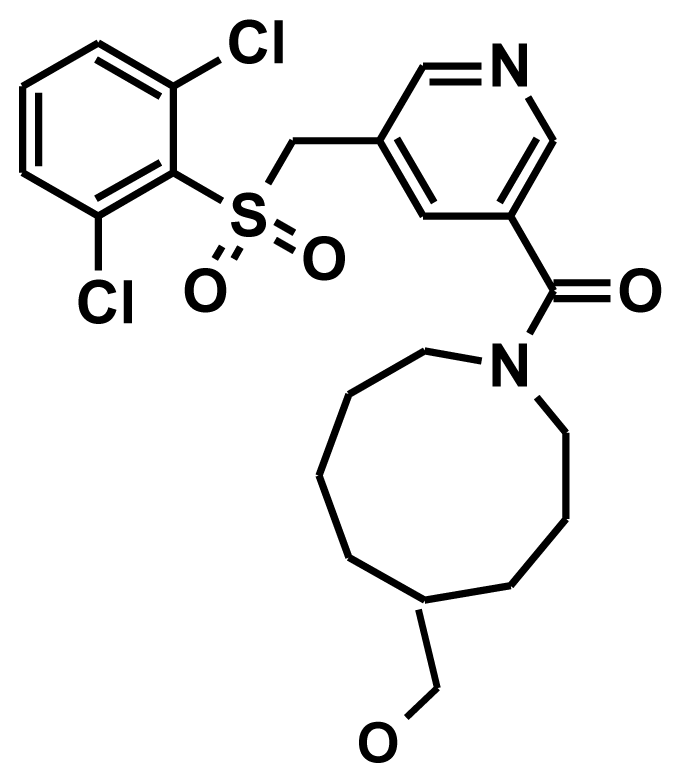 | −8.56 | −1.20 | 7.35 |
| NCI0050873 | 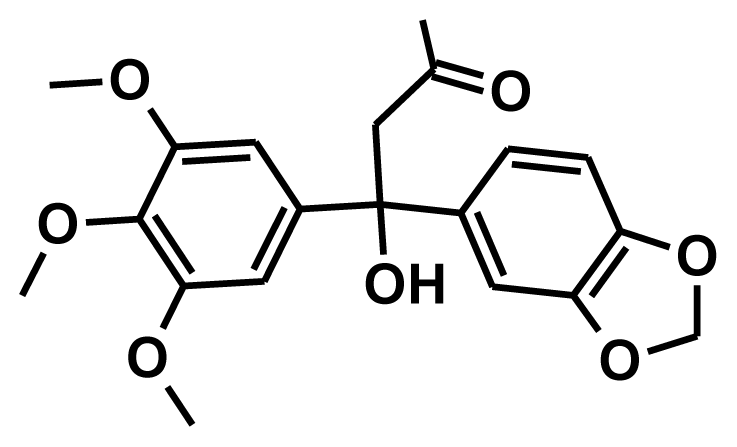 | −8.73 | −0.07 | 8.65 |
| Training12 | 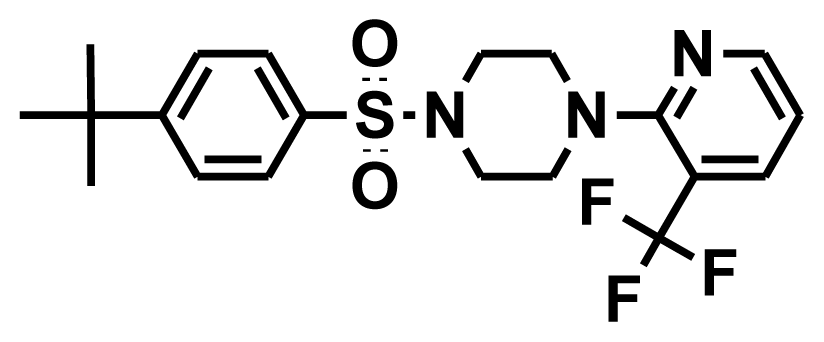 | −8.74 | −0.76 | 7.97 |
| Training17 |  | −8.89 | −0.73 | 8.16 |
| HTS 05706 |  | −8.93 | −1.72 | 7.21 |
| KM10378 |  | −8.95 | −1.72 | 7.21 |
| SCR 00883 |  | −9 | −1.18 | 7.82 |
| SPB02668 |  | −9.04 | −1.86 | 7.18 |
| JFD03179 |  | −9.07 | −0.87 | 8.20 |
| NCI22030 |  | −9.11 | −0.16 | 8.71 |
| NCI0025130 | 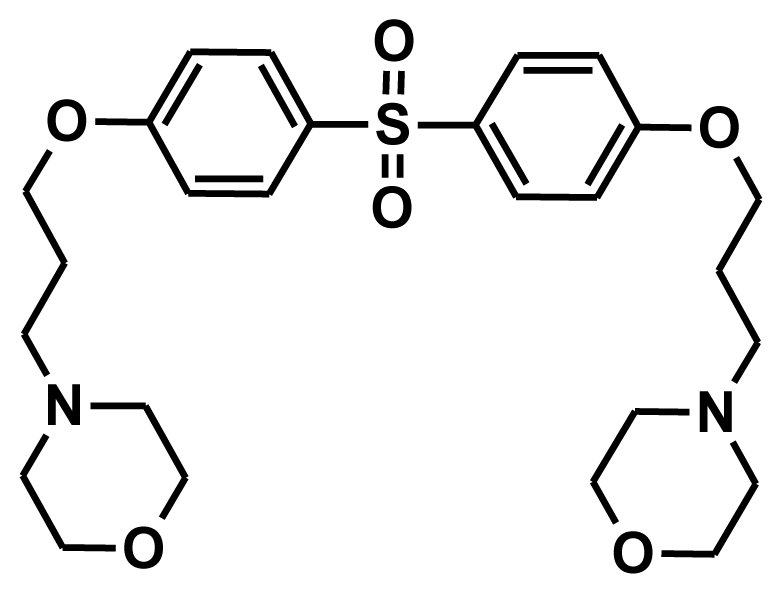 | −9.32 | −0.61 | 8.71 |
| NCI0031862 |  | −9.84 | −1.11 | 8.73 |
| RJC03502 |  | −9.96 | −1.44 | 8.52 |
| SCR00436 | 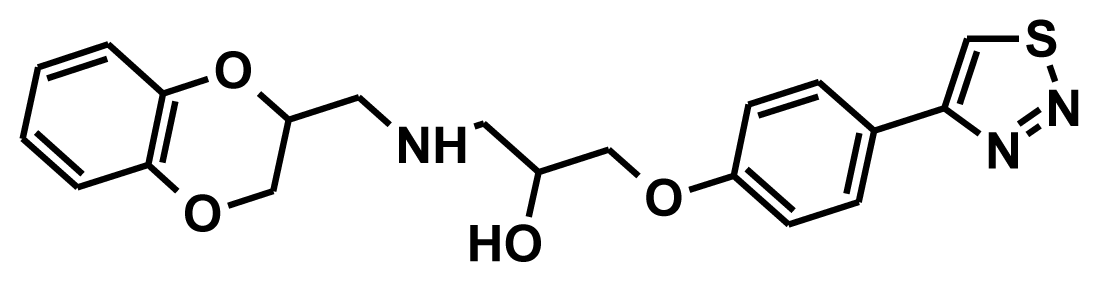 | −9.56 | −1.81 | 8.46 |
© 2012 by the authors; licensee Molecular Diversity Preservation International, Basel, Switzerland. This article is an open-access article distributed under the terms and conditions of the Creative Commons Attribution license (http://creativecommons.org/licenses/by/3.0/).
Share and Cite
Sakkiah, S.; Meganathan, C.; Sohn, Y.-S.; Namadevan, S.; Lee, K.W. Identification of Important Chemical Features of 11β-Hydroxysteroid Dehydrogenase Type1 Inhibitors: Application of Ligand Based Virtual Screening and Density Functional Theory. Int. J. Mol. Sci. 2012, 13, 5138-5162. https://doi.org/10.3390/ijms13045138
Sakkiah S, Meganathan C, Sohn Y-S, Namadevan S, Lee KW. Identification of Important Chemical Features of 11β-Hydroxysteroid Dehydrogenase Type1 Inhibitors: Application of Ligand Based Virtual Screening and Density Functional Theory. International Journal of Molecular Sciences. 2012; 13(4):5138-5162. https://doi.org/10.3390/ijms13045138
Chicago/Turabian StyleSakkiah, Sugunadevi, Chandrasekaran Meganathan, Young-Sik Sohn, Sundaraganesan Namadevan, and Keun Woo Lee. 2012. "Identification of Important Chemical Features of 11β-Hydroxysteroid Dehydrogenase Type1 Inhibitors: Application of Ligand Based Virtual Screening and Density Functional Theory" International Journal of Molecular Sciences 13, no. 4: 5138-5162. https://doi.org/10.3390/ijms13045138