Article

Plasma Depolymerization of Chitosan in the Presence of Hydrogen Peroxide

1
School of Food Science and Engineering, Harbin Institute of Technology, 73 Huanghe Road, Nangang District, Harbin 150090, China
2
College of Forestry, Northeast Forestry University, 26 Hexing Road Xiangfang District, Harbin 150040, China
*
Author to whom correspondence should be addressed.
Int. J. Mol. Sci. 2012, 13(6), 7788-7797; https://doi.org/10.3390/ijms13067788
Submission received: 23 April 2012 / Revised: 16 June 2012 / Accepted: 18 June 2012 / Published: 21 June 2012

Abstract

:
The depolymerization of chitosan by plasma in the presence of hydrogen peroxide (H2O2) was investigated. The efficiency of the depolymerization was demonstrated by means of determination of viscosity-average molecular weight and gel permeation chromatography (GPC). The structure of the depolymerized chitosan was characterized by Fourier-transform infrared spectra (FT-IR), ultraviolet spectra (UV) and X-ray diffraction (XRD). The results showed that chitosan can be effectively degradated by plasma in the presence of H2O2. The chemical structure of the depolymerized chitosan was not obviously modified. The combined plasma/H2O2 method is significantly efficient for scale-up manufacturing of low molecular weight chitosan.

1. Introduction

Chitin is the second most abundant natural polysaccharide in nature after cellulose. Chitosan, produced by deacetylation of chitin, has been found to be non-toxic, biodegradable, biofunctional, and biocompatible. It also has strong antimicrobial, hypocholesterolemic, immunity-enhancing and antitumor effects. Chitosan has been applied in many diverse fields, such as food, drug delivery, and biotechnology [14]. However, the high molecular weight chitosan (DD > 50%) shows poor solubility in neutral pH aqueous solutions and high viscosity of its solution, which limits its applications [57]. In order to improve its solubility and biological, chemical and physical properties, a variety of depolymerization technologies are usually used to prepare low molecular weight chitosan. Therefore, scientists worldwide are focusing on reducing the molecular weight of chitosan without changing its chemical structure by different hydrolysis methods, such as acid [8], hydrogen peroxide [9,10], enzyme [11], ultraviolet light [12], ozone [13], ultrasound [14], radiation [1517], and so on. In recent years, novel electrotechnologies have been used successfully to prepare low molecular weight chitosan. The effect of pulsed electric fields (PEF) and electrolysis with Ti/TiO2-RuO2 on the depolymerization of chitosan was demonstrated [18,19].
Non-thermal plasma has emerged as a great prospect for the cold process [20]. Due to its advantages, including operation at atmospheric pressure, no presence of toxic substances, low-temperature, long operative duration, and economical and simple systems [21], the plasma has been applied for various applications, such as pollution control [22], and sterilization [23]. The plasma is generated by electrical discharges in liquid or air. The discharges can produce oxidizing species radicals (H•, O•, OH•, etc.) and molecules (H2O2, O3, etc.), in addition to shock waves and UV light. These reactive species and physical conditions have sufficient energy levels to break chemical bonds of organic and inorganic substrates, and play a very important role to degrade organic compounds rapidly and efficiently [2427]. In this paper, the potential of depolymerizing chitosan by plasma from gas discharge of alternating current circuit (AC) is investigated. The synergetic effect of plasma of 0.3% chitosan solution in the presence of H2O2 (1% and 2%) on the depolymerization of chitosan was studied. In addition, the structure of the depolymerized chitosan was characterized by gel permeation chromatography (GPC), Fourier-transform infrared spectra (FT-IR), UV and X-ray spectra.

2. Results and Discussion

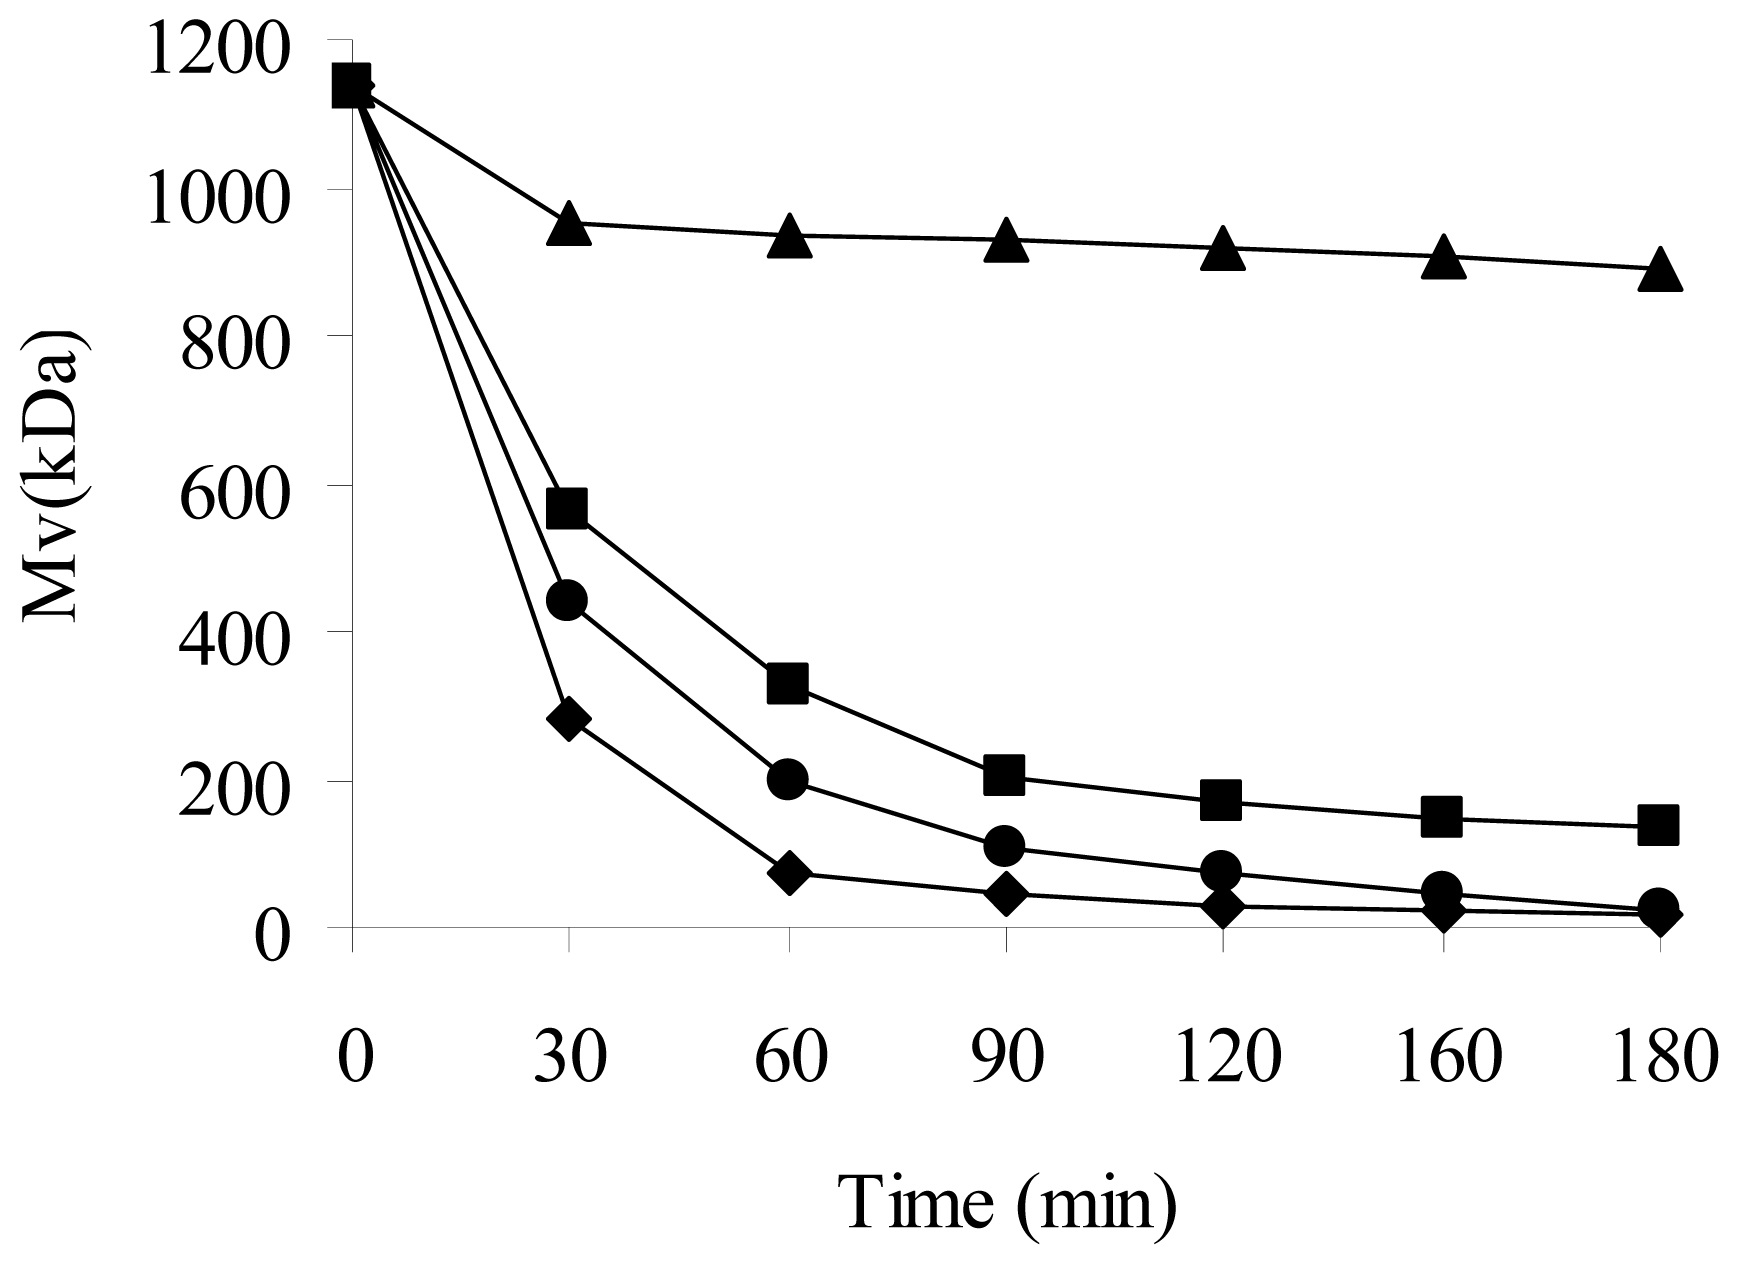
2.1. Synergetic Effect of Plasma and H2O2 on Depolymerization of Chitosan

In order to investigate the synergetic efficiency of plasma and H2O2 on depolymerization of chitosan, two different H2O2 concentrations, 1% and 2%, were used in the presence of plasma treatment. Figure 1 shows that the combined treatment by plasma and H2O2 could significantly enhance the depolymerization of chitosan compared to treatment with plasma or H2O2 alone at room temperature. The higher the concentration of H2O2, the greater the reduction of the Mv occurred at the same treatment time.
When the original chitosan was only exposed to plasma radiation, the Mv decreased effectively from 1138.11 ± 0.20 to 134.80 ± 0.23 kDa in 180 min. The rate of the depolymerization of chitosan in the Mv was 88.15%.
When the original chitosan was treated with only H2O2 at room temperature, the Mv decreased from 1138.11 ± 0.20 to 888.89 ± 0.18 kDa in 180 min. The corresponding rate of decrease in Mv was only 21.90%.
When the original chitosan was treated with plasma combined with H2O2 (2%), the corresponding Mv of chitosan decreased from 1138.11 ± 0.20 to 16.25 ± 0.58 kDa in 180 min. The rate of decrease in Mv was 98.57%.
Figure 1 also shows that the Mv dropped sharply in the first 60 min and then decreased slowly (60–180 min). This suggests that the high molecular weight chitosans were preferentially depolymerized over the low-molecular-weight chitosans. The depolymerization of chitosan increased with increasing H2O2 concentration. When H2O2 concentration was 1% and 2%, the Mv in 60 min was 199.72 ± 0.15 and 72.44 ± 0.31 kDa, respectively. The rate of decrease in the Mv of chitosan was 82.45% and 93.64%, respectively.
To further confirm the effect of plasma depolymerization of chitosan, GPC was used for qualitative evaluation of the reduction in molecular weight of chitosan and its distribution. Figure 2 shows the GPC elution curves of original chitosan and plasma chitosan in the presence of 2% H2O2 after 60 and 180 min. The large molecular weight molecules of large size appeared at low retention time and the lower molecular weight molecules of small size appeared at high retention time. This observation implies that some depolymerization had already occurred. Such a change is reckoned with the expected dominance of chain scission events in the depolymerization of chitosan. The plasma also causes a broadening of the overall distribution, which is diagnostic of the increase of the polydispersity. Therefore, the GPC chromatograms in Figure 2 confirmed the depolymerization effect of plasma on chitosan in the presence of H2O2.

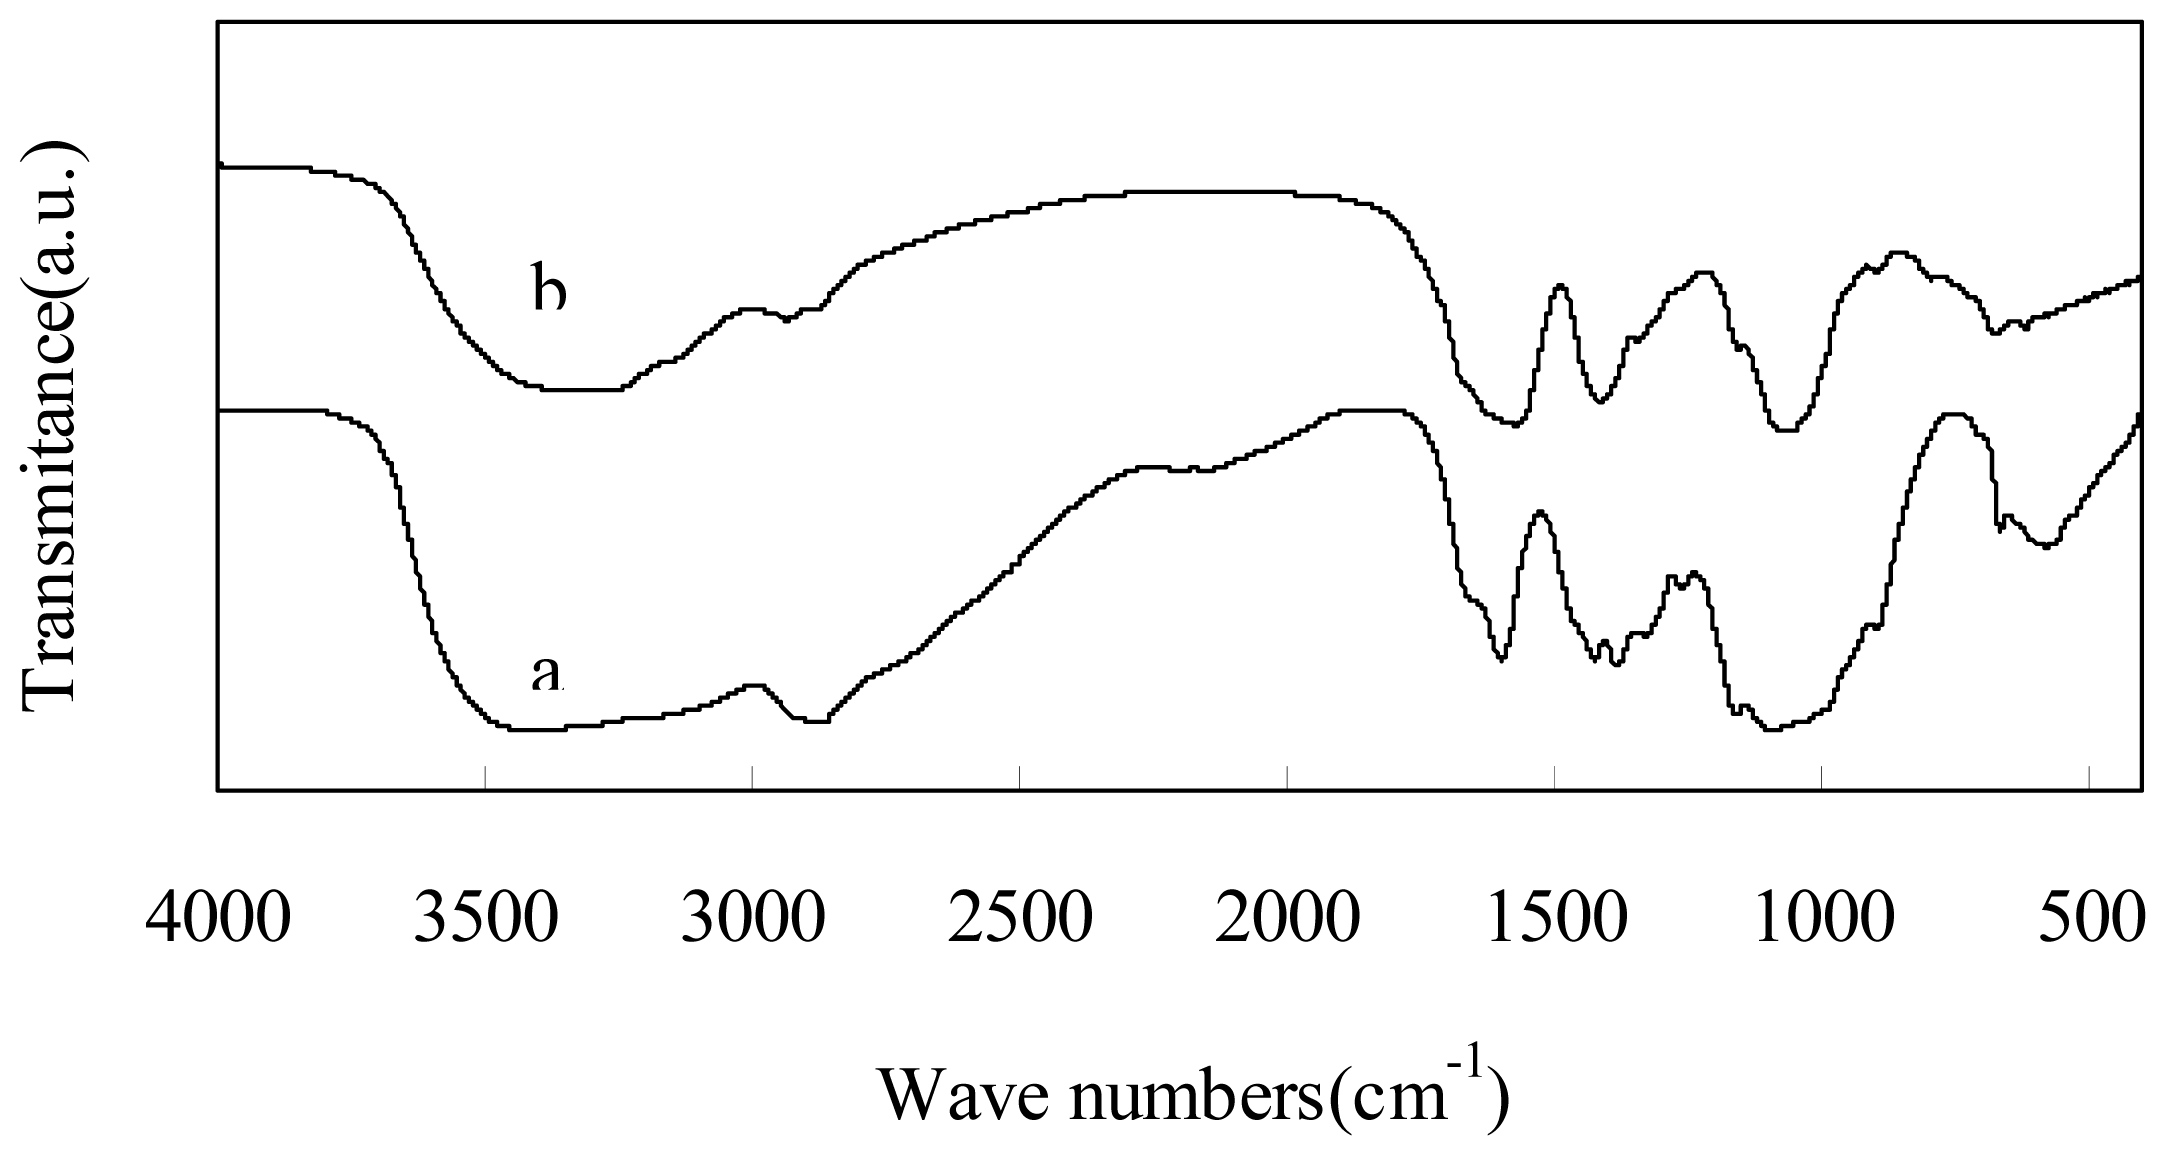
2.2. FT-IR Spectral Analysis

Figure 3 shows the FT-IR spectra of the original chitosan and depolymerized chitosan by plasma treatment with 2% H2O2 after 180 min. The spectrum of the depolymerized chitosan was similar to that of the original one. The broad absorbent band centered at 3396 cm−1 was characteristic of the stretching vibration of –OH and –NH2 [28]. The band near 2960–2850 cm−1 corresponds to C–H stretching of the alkyl substituent [29]. The bands at 1597 and 599 cm−1 were attributed to the binding vibrations of the amido groups [30]. The bands in the range 1158–895 cm−1 are assigned to the characteristics of β-D-(1→4) glycosidic bond in chitosan [31,32]. The result of FT-IR spectra suggested that there was no significant difference between the chemical structure of the depolymerized and original chitosan. In addition, the band at 1735 cm−1, which assigned to the carboxyl group, was not obvious, indicating that the carboxyl group of chitosan was not formed during depolymerization. In conclusion, the original monomeric structure of chitosan is retained in the depolymerized chitosan.

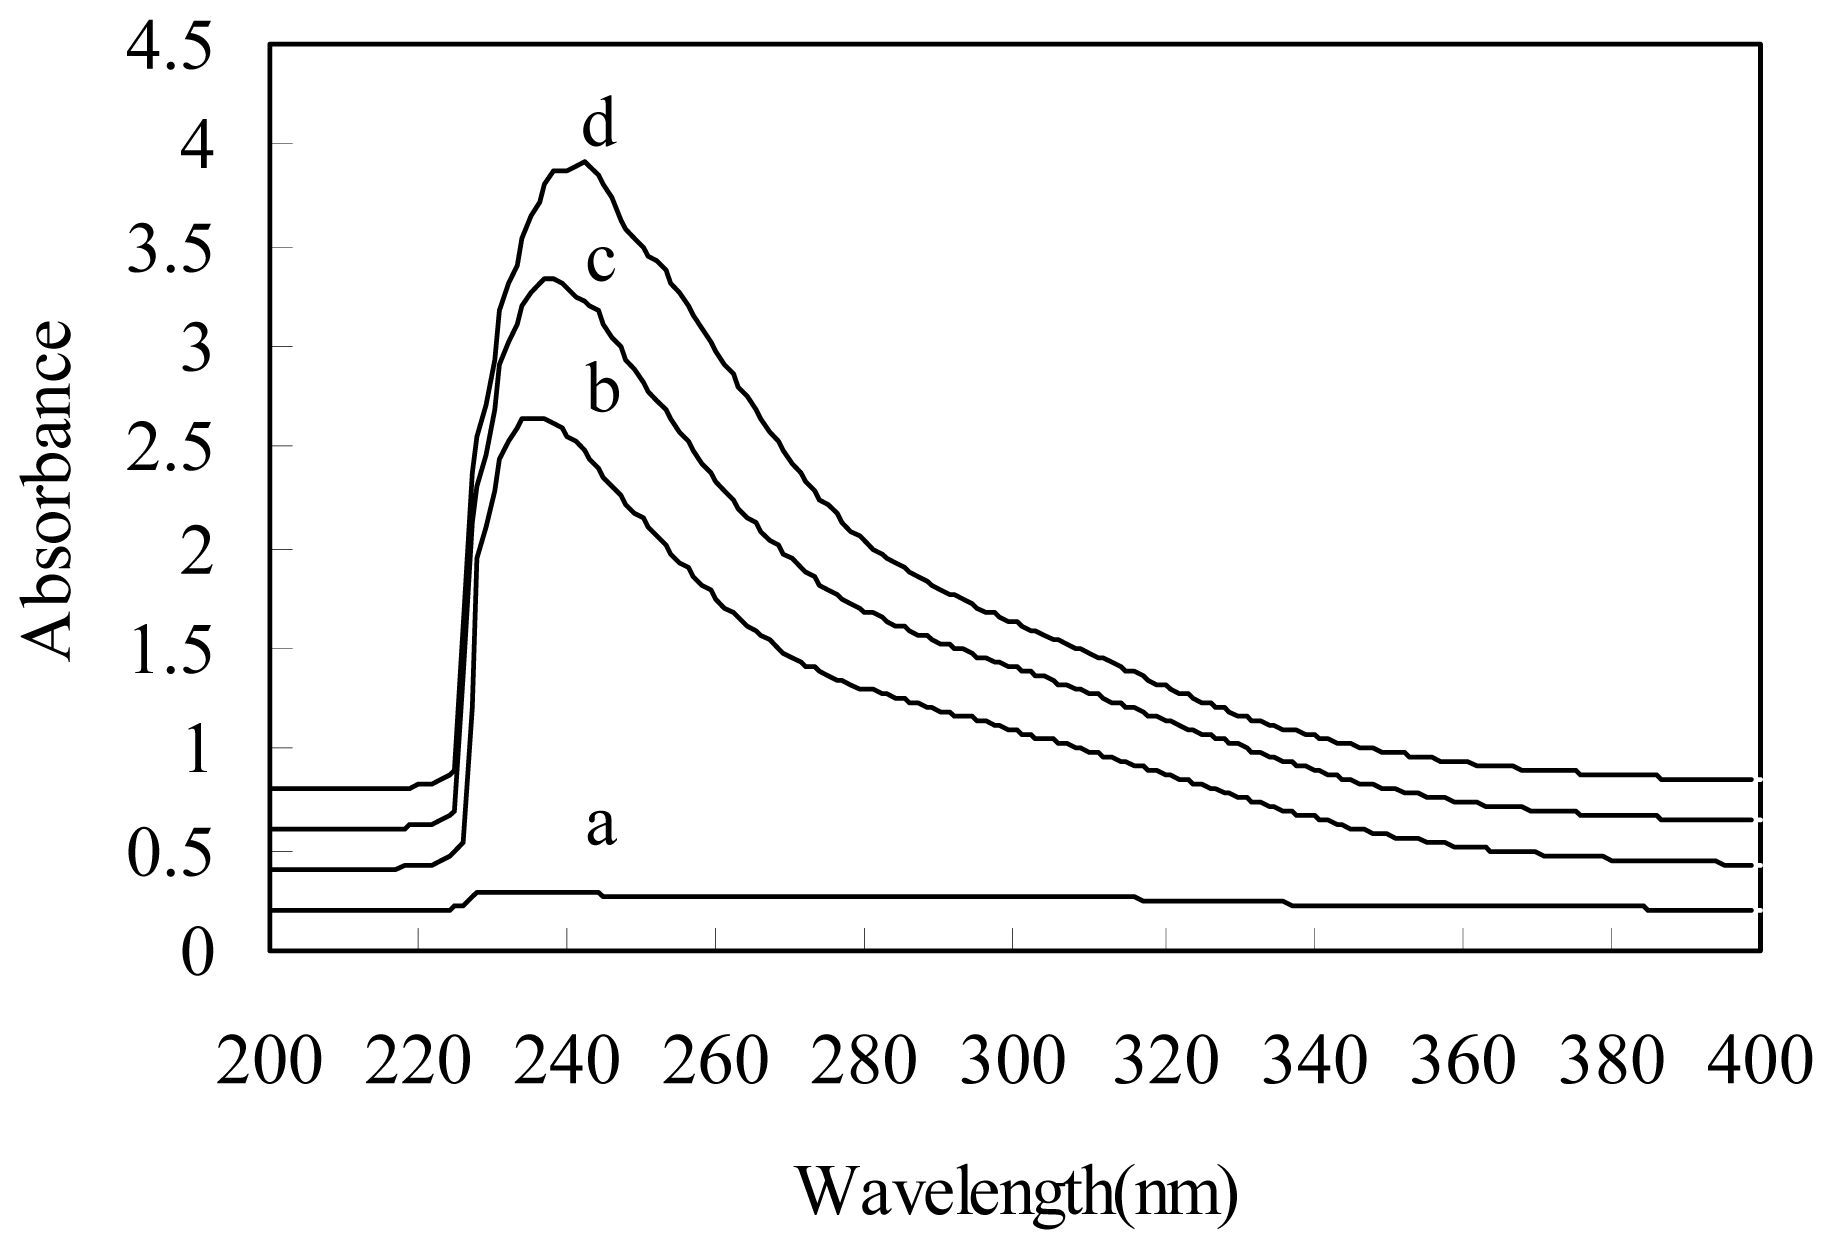
2.3. UV Spectral Analysis
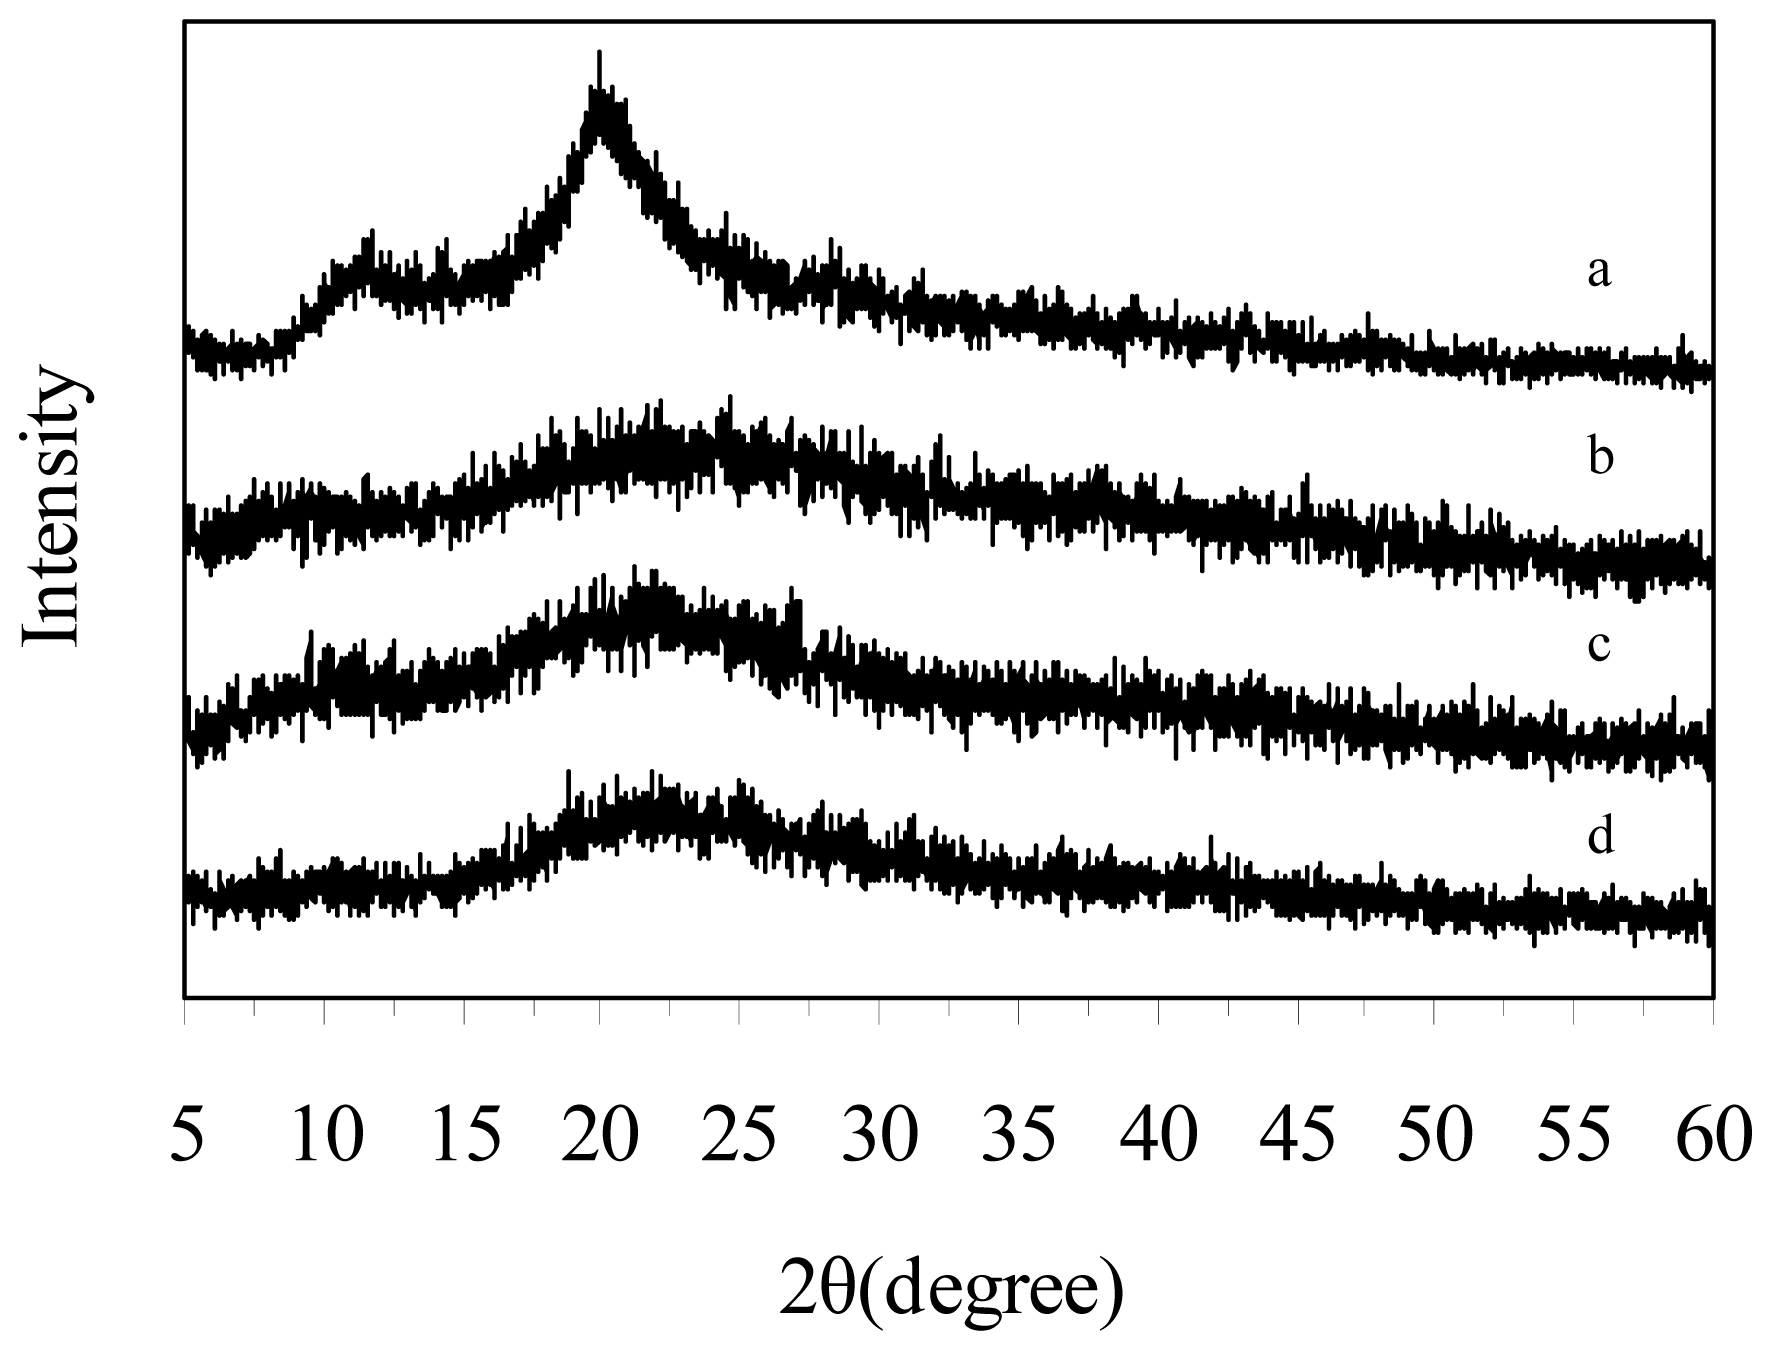
We studied the stability of the depolymerized chitosan by investigating the UV spectra. Figure 4 shows the UV spectra of the original chitosan and depolymerized chitosan after plasma treatment with 2% H2O2 at different times. For the treated chitosans, a new absorption band at 240 nm was observed, which was ascribed to carbonyl groups [19,33]. The relative absorption intensity of the peaks increased with increasing treatment time. This result indicates that the carbonyl groups might be formed during depolymerization.

2.4. X-ray Analysis

Figure 5 shows the X-ray diffraction patterns of original chitosan and depolymerized chitosan (60 min, 120 min, 180 min). For the original chitosan, the treatment conditions were the same as the depolymerized chitosan except for the plasma; there were two characteristic peaks at 10.42 and 19.6. Compared with the original chitosan, the depolymerized chitosan sample prepared by plasma combined with H2O2 had only the peak at 19.6 with less intensity and became amorphous. The present results indicate that the synergistic depolymerization of chitosan by plasma/H2O2 caused destruction of the crystal structure.

3. Experimental Section

3.1. Materials

Chitosan was supplied by Sinopharm Chemical Reagent Co., Ltd, China. The degree of deacetylation (DD) of chitosan was not less than 90%. The viscosity-average molecular weight (Mv) was about 1138.11 ± 0.20 kDa. All other chemicals, including H2O2, acetic acid (CH3COOH), sodium acetate (CH3COONa), NaOH and ethyl alcohol were of reagent grade obtained from Sinopharm Chemical Reagent Co., Ltd, China. All solutions were prepared using distilled water.

3.2. Plasma Treatment Experiments

A home built apparatus for the plasma treatment, as shown in Figure 6, includes a pulsed high voltage generator with AC and a treatment chamber (100 mL) with needle-plate electrodes. The needle electrode was a stainless steel needle (diameter 1 mm). The plate electrode was a stainless disk (diameter 40 mm). The high voltage pulse generator provided a discharge for a few microseconds. During the treatment, the peak pulse voltage is 60 KV, the power is 350 W, the distance between the electrodes is 2 mm and the treatment time is 180 min. When the pulsed power system was activated, the generator supplied the electrical discharges, which established an electric field across the sparged liquid. Thus the dispersed air bubbles in the liquid are ionized, and the plasma is obtained.

3.3. Preparation of Depolymerized Chitosan

Chitosan powder was dissolved into 1% (v/v) acetic acid aqueous solution. The final concentration of chitosan was 0.3 (wt.%). The 80 mL chitosan solution was treated by plasma in the presence of H2O2 at room temperature.

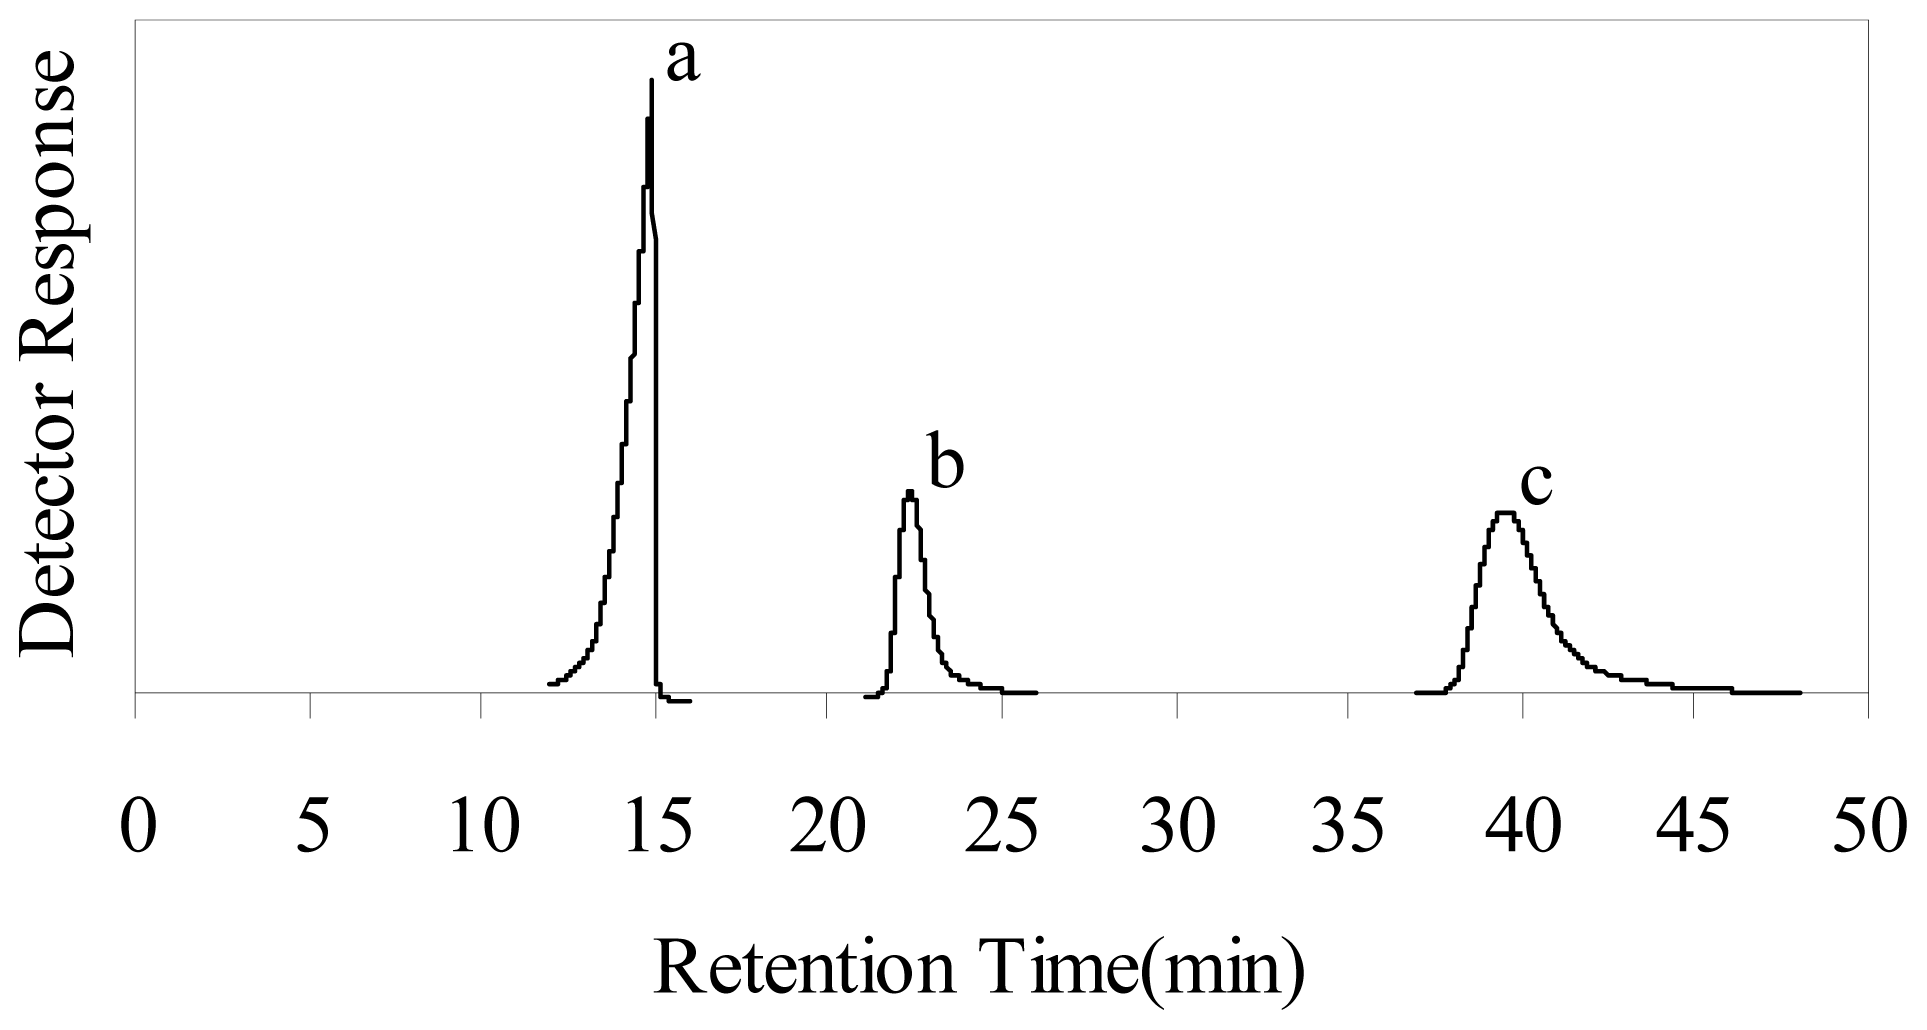
3.4. Separation (Fractionation) of Water-Soluble Chitosan

After depolymerization, the solution was neutralized with 2 M NaOH solution to pH ~7.5, and then twice the volume of the solution of absolute ethanol was added to precipitate chitosan molecules from dispersions, and then the solid product was filtrated, and washed with ethanol. Finally, the solid product was dried in an oven at 60 °C and the powder of water soluble chitosan was obtained.

3.5. Characterization

The molecular weight of chitosan was determined by the viscometric method [31]. The relative viscosity, ηr, of chitosan was measured using an Ubbelohde capillary viscometer (Shanghai Longtuo Instrument Co., Ltd., China) in a constant-temperature water bath at 25 ± 0.5 °C as the mean of three replicates from the same chitosan solution. The intrinsic viscosity, [η], was calculated according to Equation (1):
[ η ] = ( η s p + 3 ln  η r ) 4 c
where ηsp is the incremental viscosity, ηsp = ηr − 1, c is the concentration of chitosan (g/mL). Then, the Mv of chitosan was calculated based on the Mark–Houwink Equation (2:
[ η ] = k × ( M v ) a
The value of k and α is 6.589 × 10⁻³ and 0.88, respectively [34].
GPC was used for qualitative evaluation of the reduction in molecular weight of chitosan on a GPC instrument (Agilent 1100) equipped with a refractive index detector. GPC measurement was carried out at 30 °C using connected columns (79911GF-083 and 79911GF-084) with 0.2 M CH3COOH/0.1 M CH3COONa solution as an eluent at a flow rate of 1 mL/min.
FT-IR spectrum was measured in powder form on Bruker Vector 22 spectrophotometer (Germany) using KBr pellets in the range of 400–4000 cm−1.
UV-Vis spectrum was taken on a TU-1810 (Beijing Purkinje General Instrument Co., Ltd., China) in the range of 200 to 400 nm.
X-ray powder diffraction (XRD) patterns of the depolymerized chitosan fraction were measured on a Rigaku D/max-2200 X-ray diffractometer using a CuKα target at 30 KV and 30 mA at 25 °C. The relative intensity was recorded in the range (2θ) of 5–60° with a scanning rate of 0.02°/s.

4. Conclusions

Chitosan was efficiently depolymerized by plasma treatment in the presence of H2O2.The results of GPC analysis showed that the molecular weight of chitosan decreased with the increase of the treatment time. The FT-IR spectra indicated no obvious modification of chemical structure of chitosan before and after depolymerization. The UV spectra suggested that carbonyl groups might be formed during the depolymerization. The results of XRD confirmed this claim that the reduction in molecular weight of the resulting chitosan led to the transformation of the crystal structure. Therefore, plasma treatment in the presence of H2O2 is a potentially applicable technique for the production of low-molecular-weight chitosan.

References

  1. Kean, T.; Thanou, M. Biodegradation, biodistribution and toxicity of chitosan. Adv. Drug Deliv. Rev 2010, 62, 3–11. [Google Scholar]
  2. Xia, W.; Liu, P.; Zhang, J.; Chen, J. Biological activities of chitosan and Chitooligosaccharides. Food Hydrocolloid 2011, 25, 170–179. [Google Scholar]
  3. Aider, M. Chitosan application for active bio-based films production and potential in the food industry: Review. LWT Food Sci. Technol 2010, 43, 837–842. [Google Scholar]
  4. Sajomsang, W. Synthetic methods and applications of chitosan containing pyridylmethyl moiety and its quaternized derivatives: A review. Carbohydr. Polym 2010, 80, 631–647. [Google Scholar]
  5. Xia, W.; Liu, P.; Liu, J. Advance in chitosan hydrolysis by non-specific cellulases. Bioresour. Technol 2008, 99, 6751–6762. [Google Scholar]
  6. Aiba, S. Studies on chitosan: 3. Evidence for the presence of random and block copolymer structures in partially Nacetylated chitosans. Int. J. Biol. Macromol 1991, 13, 40–44. [Google Scholar]
  7. Rinaudo, M. Chitin and chitosan: Properties and applications. Prog. Polym. Sci 2006, 31, 603–632. [Google Scholar]
  8. Rege, P.R.; Block, L.H. Chitosan processing: Influence of process parameters during acidic and alkaline hydrolysis and effect of the processing sequence on the resultant chitosans properties. Carbohydr. Res 1999, 321, 235–245. [Google Scholar]
  9. Qin, C.Q.; Du, Y.M.; Xiao, L. Effect of hydrogen peroxide treatment on the molecular weight and structure of chitosan. Polym. Degrad. Stabil 2002, 76, 211–218. [Google Scholar]
  10. Huang, Q.Z.; Meng, Z.H.; Feng, Y.Q.; Shi, H.Z. Study on the heterogeneous degradation of chitosan with H2O2 catalyzed by a new supermolecular assembly crystal: [C6H8N2]6H3[PW12O40] · 2H2O. Carbohyd. Res 2010, 345, 115–119. [Google Scholar]
  11. Xie, Y.; Hu, J.; Wei, Y.; Hong, X. Preparation of chitooligosaccharides by the enzymatic hydrolysis of chitosan. Polym. Degrad. Stabil 2009, 94, 1895–1899. [Google Scholar]
  12. Wang, S.M.; Huang, Q.Z.; Wang, Q.S. Study on the synergetic degradation of chitosan with ultraviolet light and hydrogen peroxide. Carbohyd. Res 2005, 340, 1143–1147. [Google Scholar]
  13. Yue, W.; Yao, P.; Wei, Y.; Mo, H. Synergetic effect of ozone and ultrasonic radiation on degradation of chitosan. Polym. Degrad. Stabil 2008, 93, 1814–1821. [Google Scholar]
  14. Taghizadeh, M.T.; Abdollahi, R. Sonolytic, sonocatalytic and sonophotocatalytic degradation of chitosan in the presence of TiO2 nanoparticles. Ultrason. Sonochem 2011, 18, 149–157. [Google Scholar]
  15. Shen, K.; Hu, Q.L.; Wamg, Z.K.; Qu, J. Effect of 60Co irradiation on the properties of chitosan rod. Mater. Sci. Eng. C 2011, 31, 866–872. [Google Scholar]
  16. Abd El-Rehim, H.A.; El-Sawy, N.M.; Hegazy, el-S.A.; Soliman, el-S.A.; Elbarbary, A.M. Improvement of antioxidant activity of chitosan by chemical treatment and ionizing radiation. Int. J. Biol. Macromol 2012, 50, 403–413. [Google Scholar]
  17. Nguyen Ngoc, D.; Dang Van, P.; Nguyen Tue, A.; Nguyen Quoc, H. Synergistic degradation to prepare oligochitosan by r-irradiation of chitosan solution in the presence of hydrogen peroxide. Phys. Chem 2011, 80, 848–853. [Google Scholar]
  18. Luo, W.B.; Han, Z.; Zeng, X.A.; Yu, S.J.; Kennedy, F. Study on the degradation of chitosan by pulsed electric fields treatment. Innovat. Food Sci. Emerg 2010, 11, 587–591. [Google Scholar]
  19. Cai, Q.; Gu, Z.; Chen, Y.; Han, W.; Fu, T.; Song, H.; Li, F. Degradation of chitosan by an electro-chemical process. Carbohydr. Polymer 2010, 79, 783–785. [Google Scholar]
  20. Gweon, B.; Kim, D.B.; Moon, S.Y.; Choe, W. Escherichia coli deactivation Study controlling the atmospheric pressure plasma discharge conditions. Curr. Appl. Phys 2009, 9, 625–628. [Google Scholar]
  21. Hu, M.; Guo, Y. The sterilization of Escherichia coli by dielectric-barrier discharge plasma at atmospheric pressure. Appl. Surf. Sci 2011, 257, 7065–7070. [Google Scholar]
  22. Jolibois, J.; Takashima, K.; Mizuno, A. Application of a non-thermal surface plasma discharge in wet condition for gas exhaust treatment: NOx removal. J. Electrostat 2012, 70, 300–308. [Google Scholar]
  23. Fernández, A.; Thompson, A. The inactivation of Salmonella by cold atmospheric plasma treatment. Food Res. Int 2012, 45, 678–684. [Google Scholar]
  24. Acda, M.N.; Devera, E.E.; Cabangon, R.J.; Ramos, H.J. Effects of plasma modification on adhesion properties of wood. Int. J. Adhes 2012, 32, 70–75. [Google Scholar]
  25. Ryu, S.M.; Hong, E.J.; Seok, D.C.; Yoo, S.R.; Kim, Y.J.; Lho, T.; Lee, B.J. Characteristics of discharged sea water generated by underwater plasma system. Curr. Appl. Phys 2011, 1–7. [Google Scholar]
  26. Magureanu, M.; Piroi, D.; Mandache, N.B.; David, V.; Medvedovici, A.; Bradu, C.; Parvulescu, V.I. Degradation of antibiotics in water by non-thermal plasma treatment. Water Res 2011, 45, 3407–3416. [Google Scholar]
  27. Marsilia, L.; Espieb, S.; Andersona, J.G.; MacGregor, S.J. Plasma inactivation of food-related microorganisms in liquids. Radiat. Phys. Chem 2002, 65, 507–513. [Google Scholar]
  28. Li, S.D.; Zhang, C.H.; Dong, J.J.; Qu, C.Y.; Quan, W.Y.; Yang, L.; She, X.D. Effect of cupric ion on thermal degradation of quaternized chitosan. Carbohydr. Polymer 2010, 81, 182–187. [Google Scholar]
  29. de Britto, D.; de Assis, O.B. Synthesis and mechanical properties of quaternary salts of chitosan-based films for food application. Int. J. Biol. Macromol 2007, 41, 198–203. [Google Scholar]
  30. Huang, Q.Z.; Wan, S.M.; Huang, J.F.; Zhuo, L.H.; Guo, Y.C. Study on the heterogeneous degradation of chitosan with hydrogen peroxide under the catalysis of phosphotungstic acid. Carbohydr. Polymer 2007, 68, 761–765. [Google Scholar]
  31. Chen, R.H.; Hwa, H.D. Effect of molecular weight of chitosan with the same degree of deacetylation on the thermal, mechanical, and permeability properties of the prepared membrane. Carbohydr. Polym 1996, 29, 353–358. [Google Scholar]
  32. Peniche, C.; Waldo, A.M.; Davidenko, N.; Sastre, R.; Gallardo, A.; Roman, J.S. Self-curing membranes of chitosan/PAA IPNs obtained by radical polymerization: Preparation, characterization and interpolymer complexation. Biomaterials 1999, 20, 1869–1878. [Google Scholar]
  33. Czechowska-Biskup, R.; Rokita, B.; Lotfy, S.; Ulanski, P.; Rosiak, J.M. Degradation of chitosan and starch by 360-kHz ultrasound. Carbohydr. Polym 2005, 60, 175–184. [Google Scholar]
  34. Wang, W.; Bo, S.; Li, S.; Qin, W. Determination of the Mark-Houwink equation for chitosans with different degrees of deacetylation. Int. J. Biol. Macromol 1991, 13, 281–285. [Google Scholar]
Figure 1. Effect of plasma and H2O2 on the molecular weight of chitosan. ■: plasma alone; ▲: 2% H2O2 alone; ●: plasma in the presence of H2O2 (1%); ♦: plasma in the presence of H2O2 (2%).
Ijms 13 07788f1
Figure 2. Gel permeation chromatography (GPC) chromatograms of the original chitosan and depolymerized chitosan (depolymerized by plasma in the presence of 2% H2O2 for different times): (a) original chitosan; (b) 60 min; (c) 180 min.
Ijms 13 07788f2
Figure 3. Fourier-transform infrared spectra (FT-IR) spectra of chitosan: (a) original chitosan; (b) depolymerized chitosan by means of plasma in the presence of 2% H2O2 after 180 min.
Ijms 13 07788f3
Figure 4. UV spectra of the original chitosan and depolymerized chitosan (depolymerized by plasma in the presence of 2% H2O2 for different times): (a) original chitosan; (b) 60 min; (c) 120min; (d) 180 min.
Ijms 13 07788f4
Figure 5. X-ray diffraction (XRD) patterns of the original chitosan and depolymerized chitosan (depolymerized by plasma in the presence of 2% H2O2 for different times): (a) original chitosan; (b) 180 min; (c) 120 min; (d) 60 min.
Ijms 13 07788f5
Figure 6. The schematic of plasma experimental apparatus.
Ijms 13 07788f6

