Differential mRNA Expression Levels of Human Histone-Modifying Enzymes in Normal Karyotype B Cell Pediatric Acute Lymphoblastic Leukemia

Abstract
:1. Introduction
2. Results and Discussion
2.1. Real-Time PCR Array Design
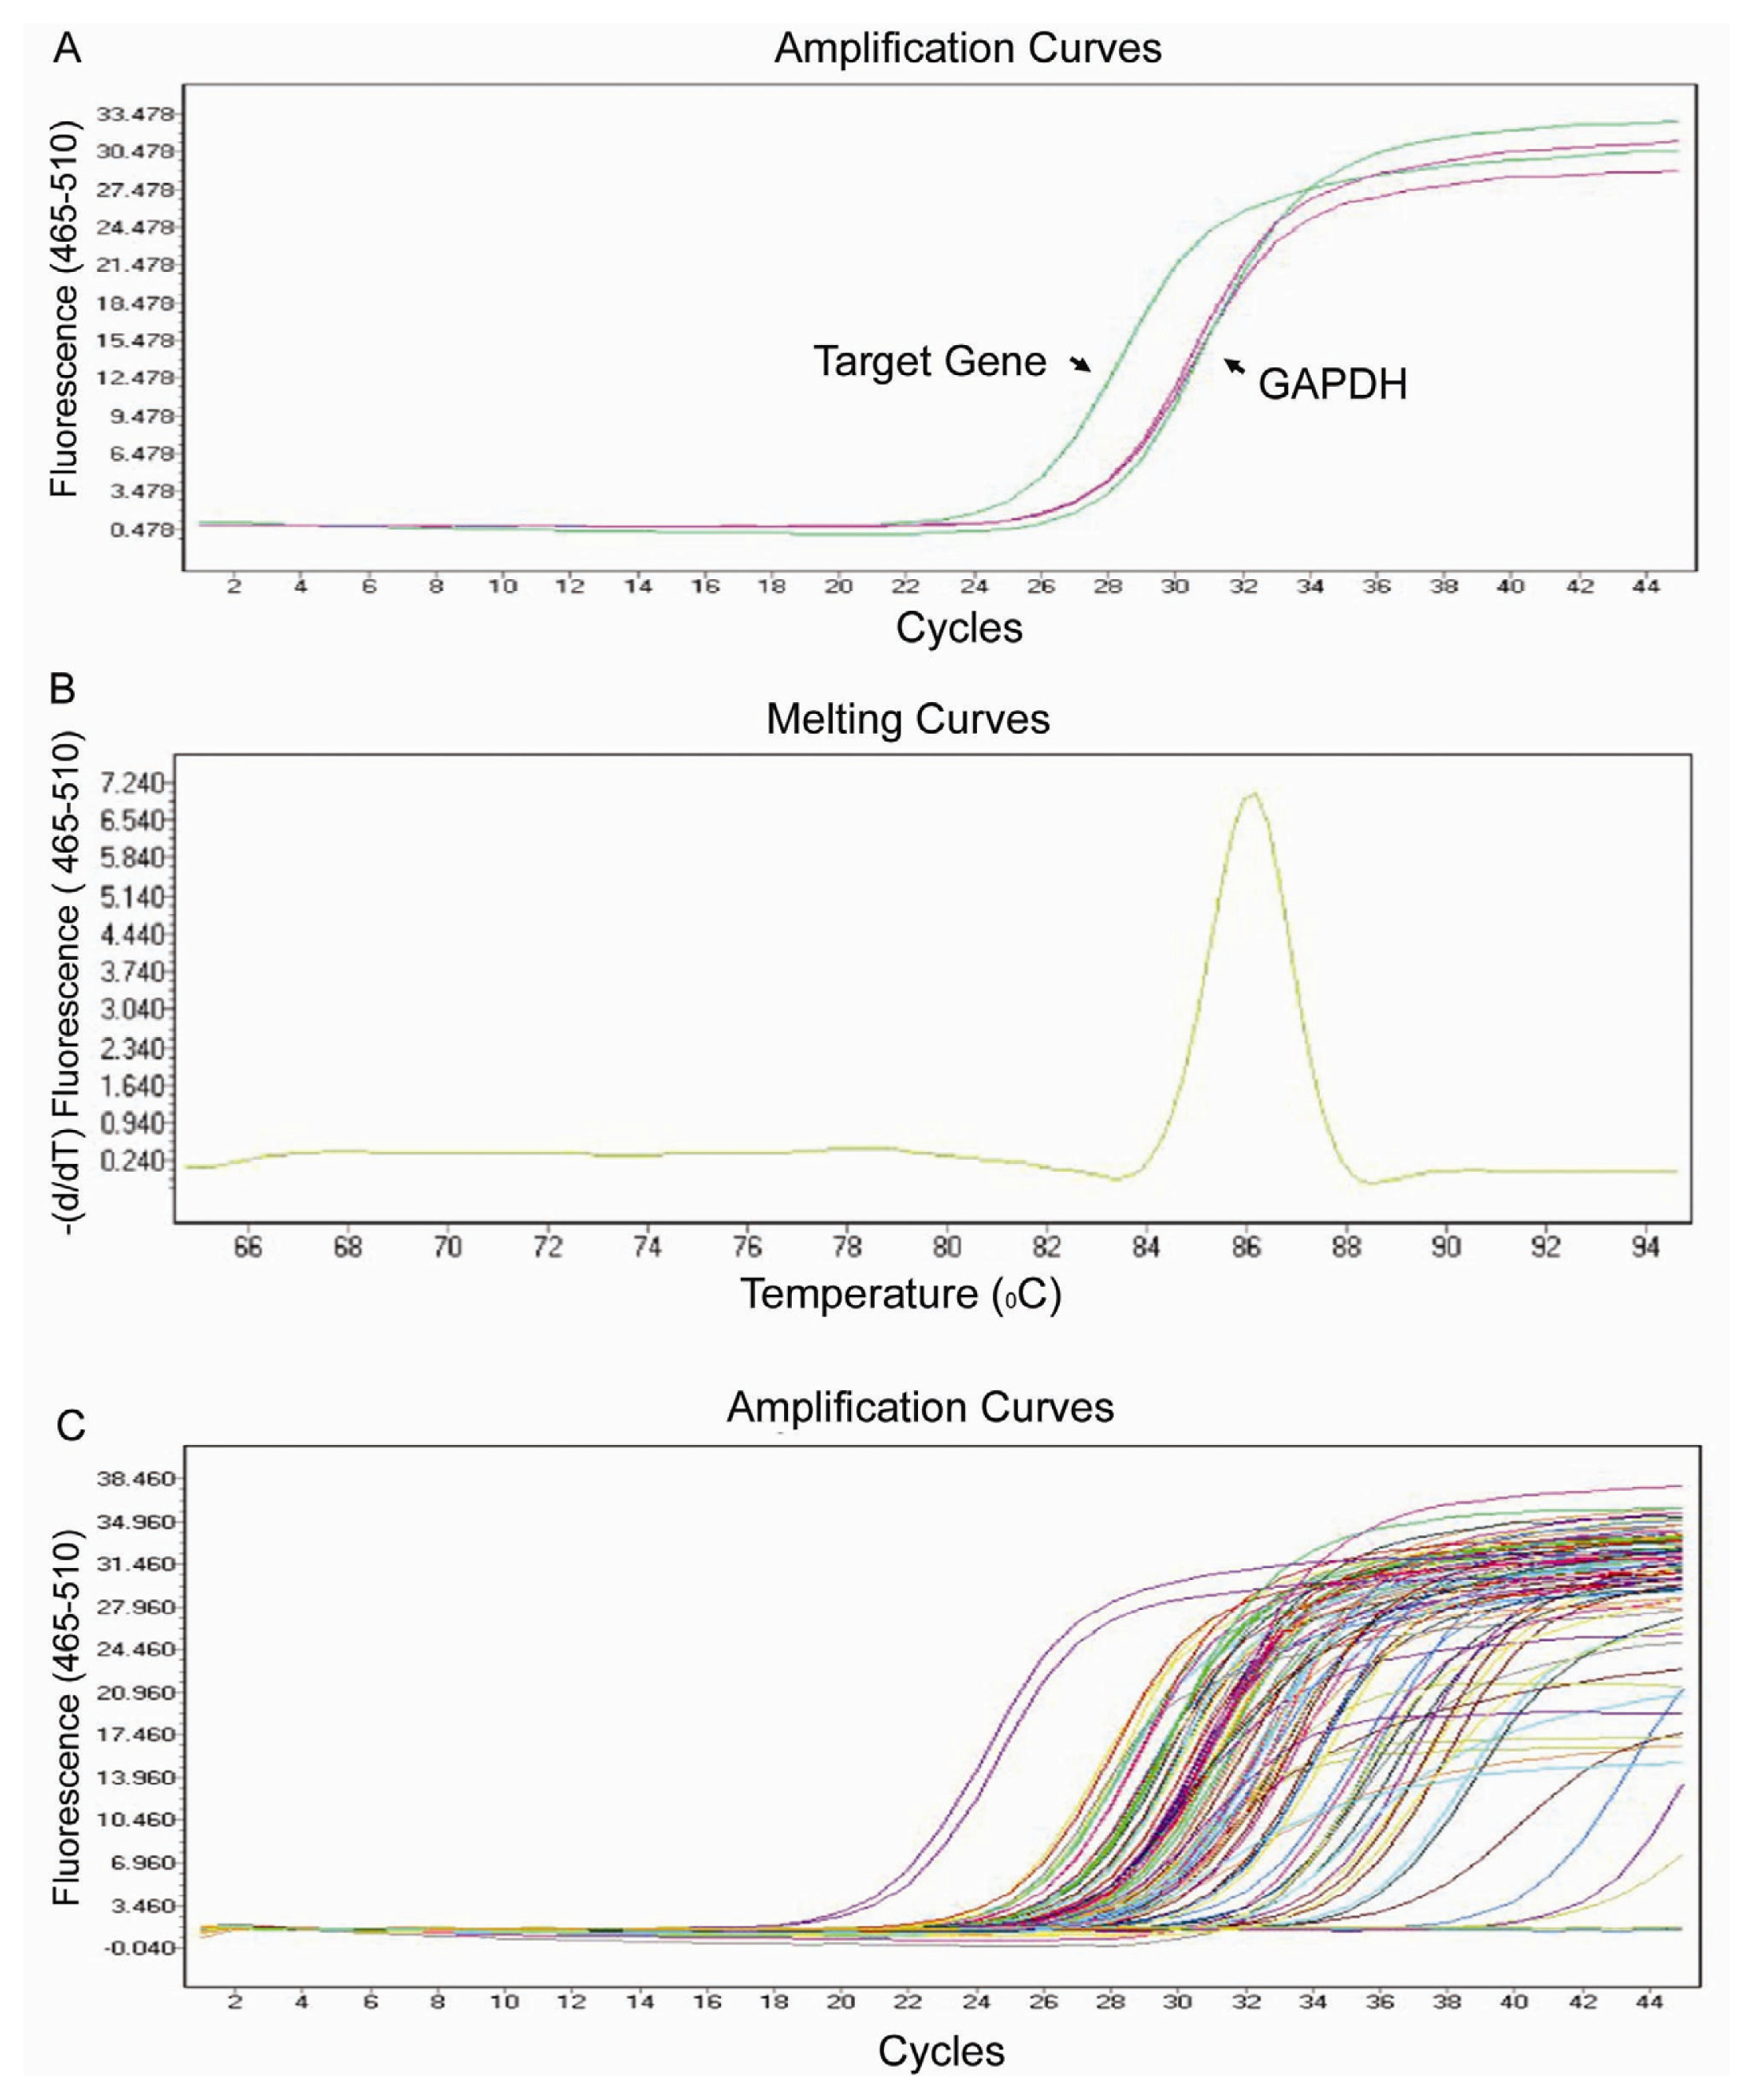
2.2. Real-Time PCR Array Testing
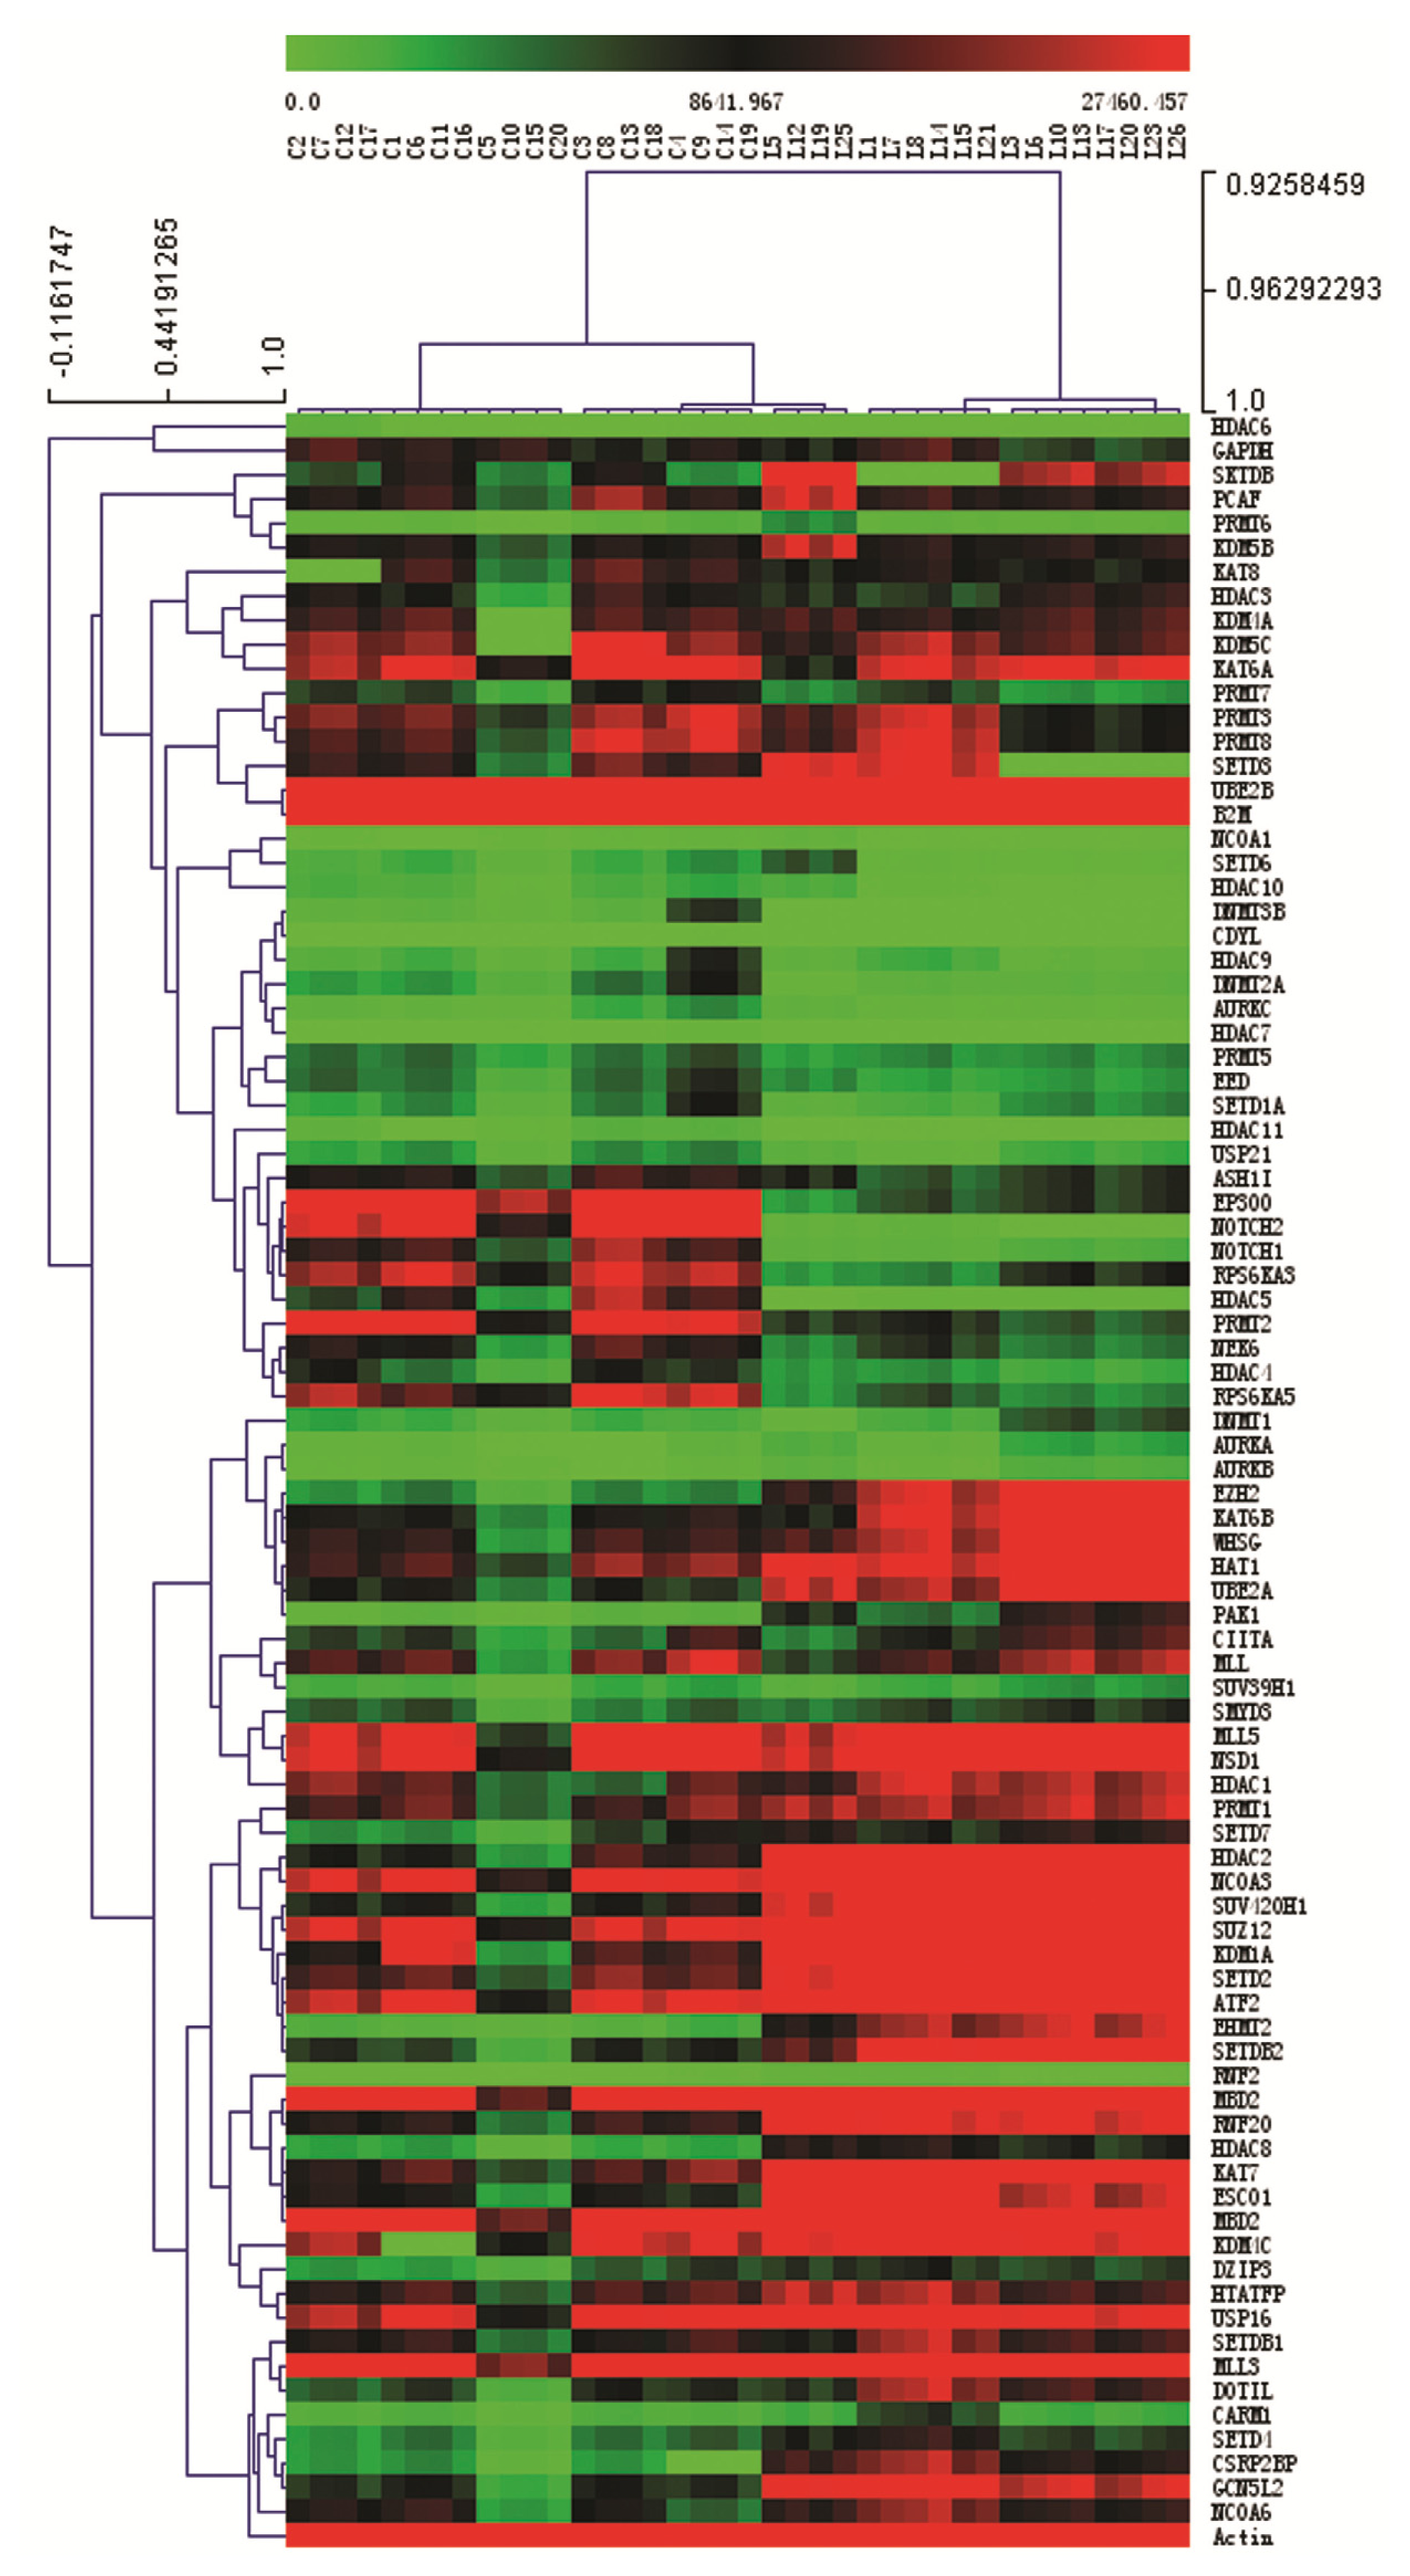
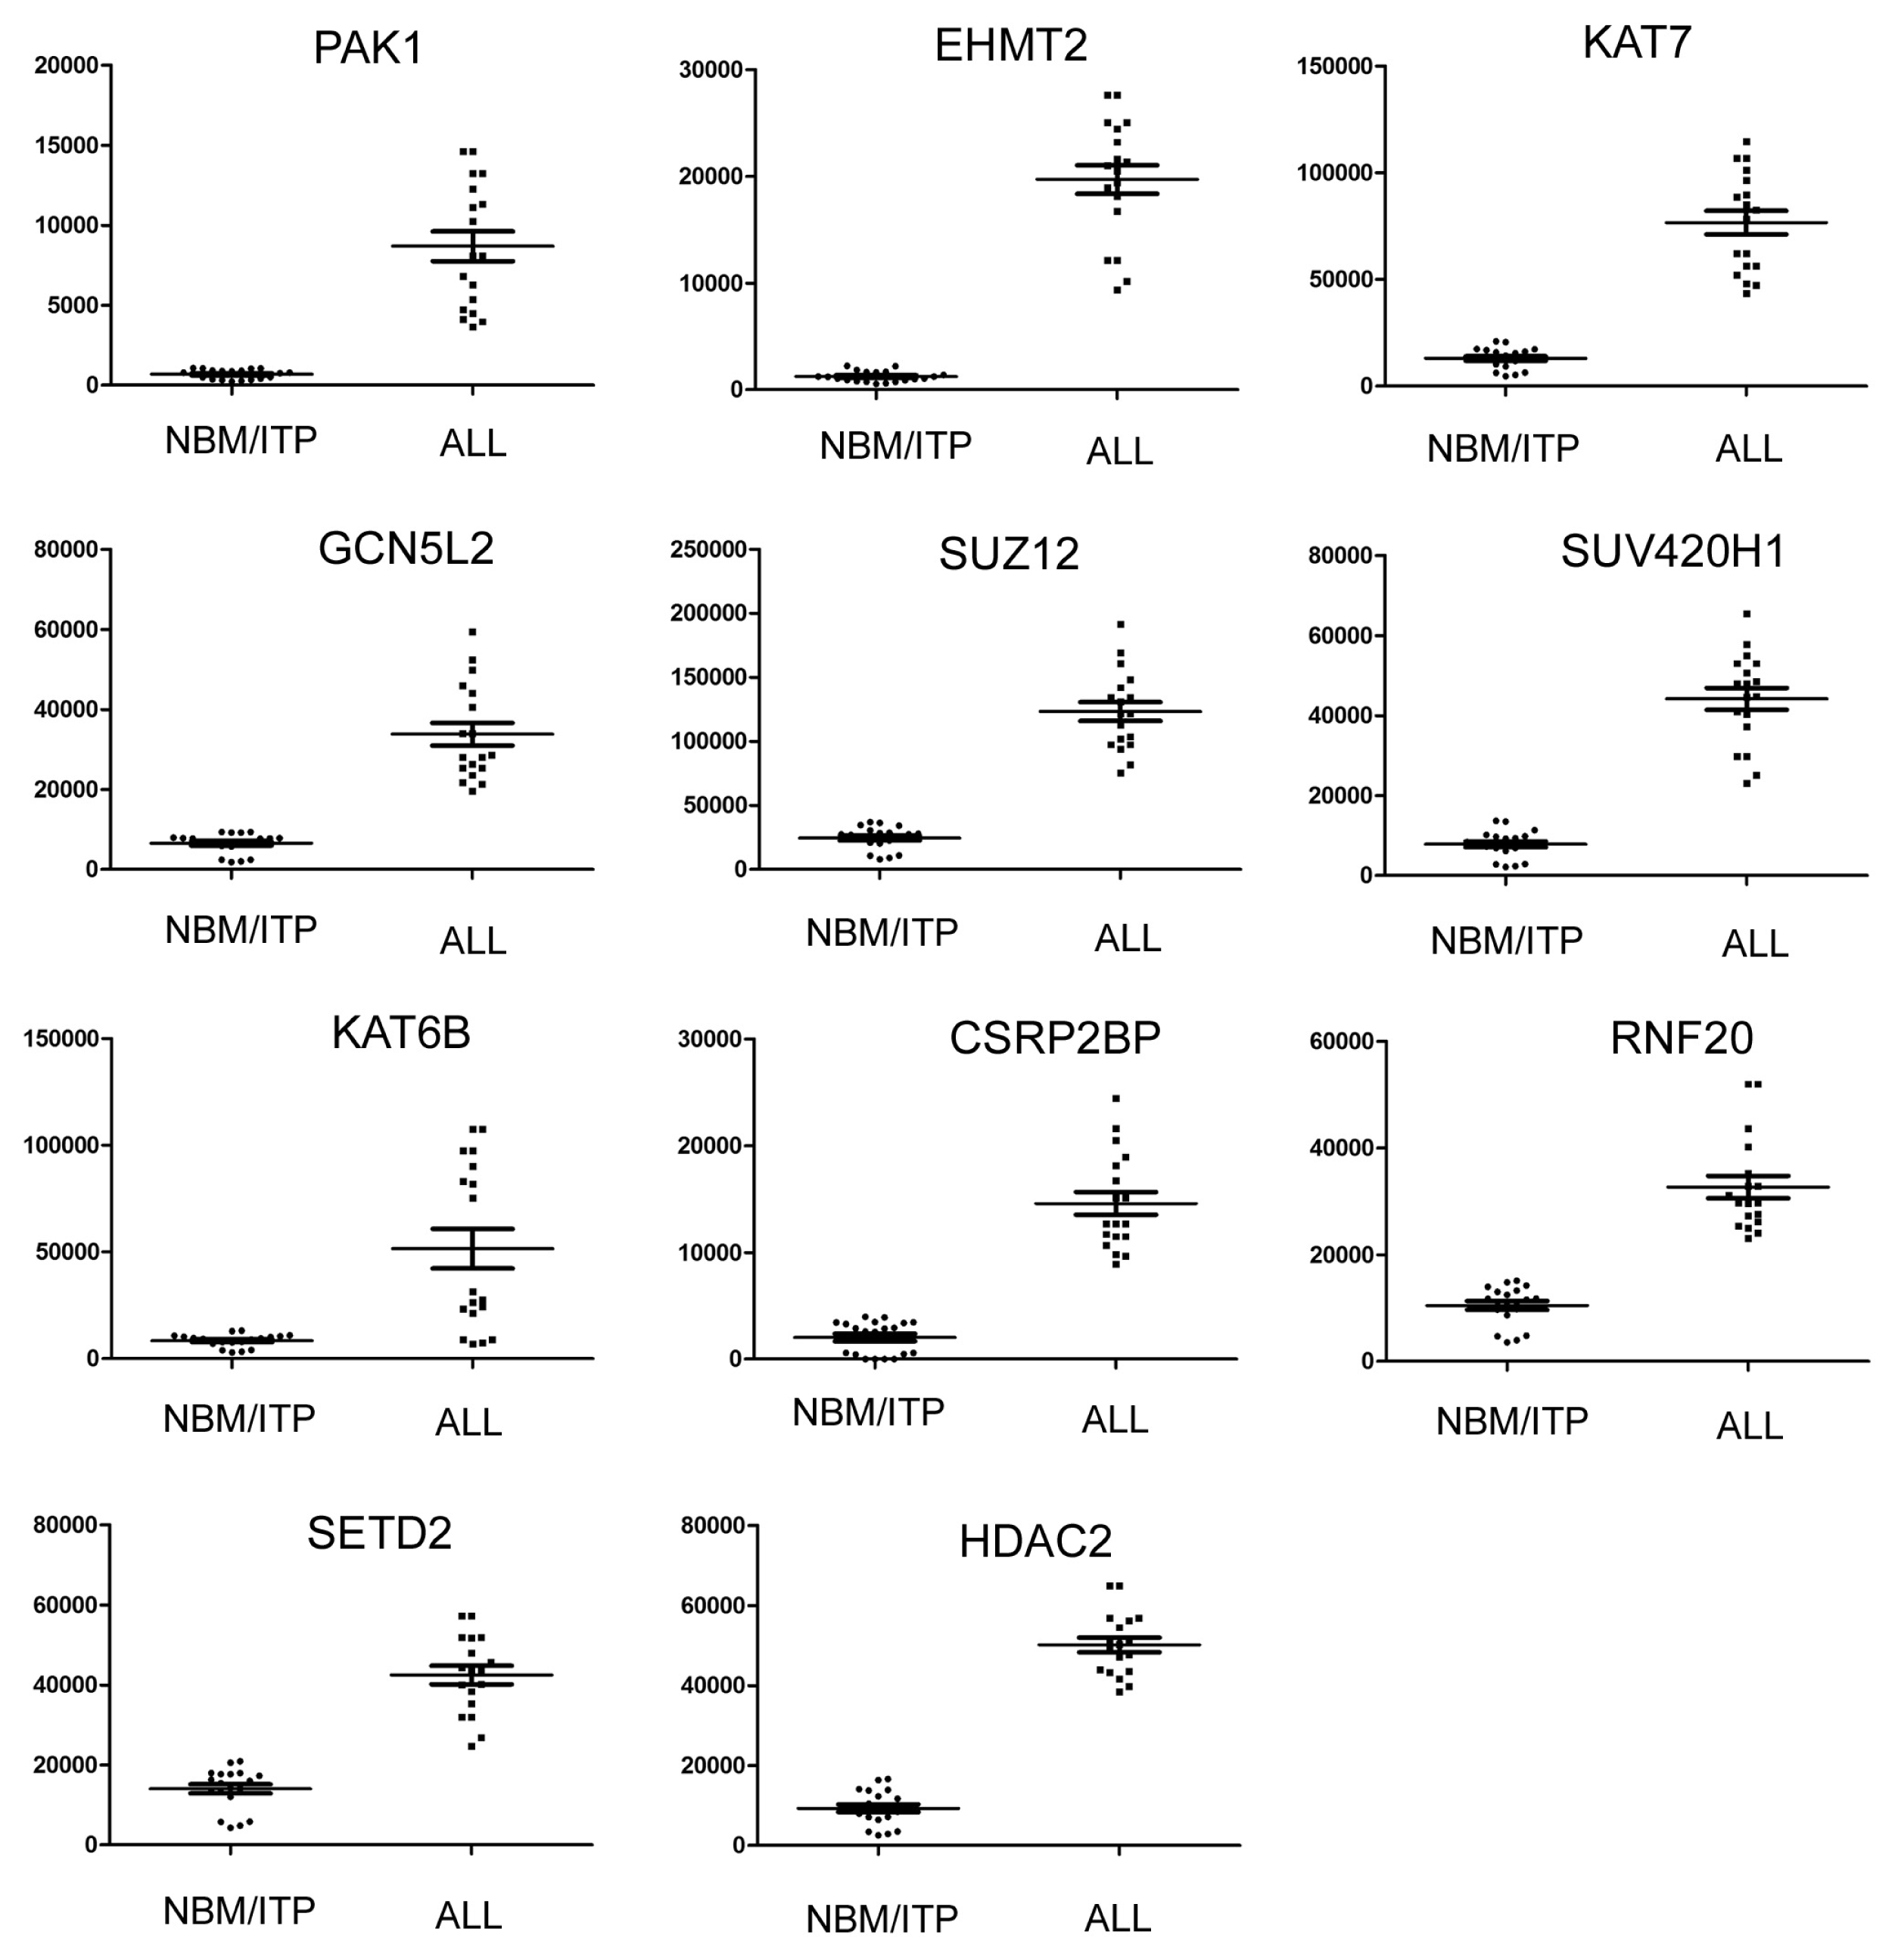
2.3. Expression Profiling of Normal Karyotype B Cell Pediatric ALL and Normal Control Samples
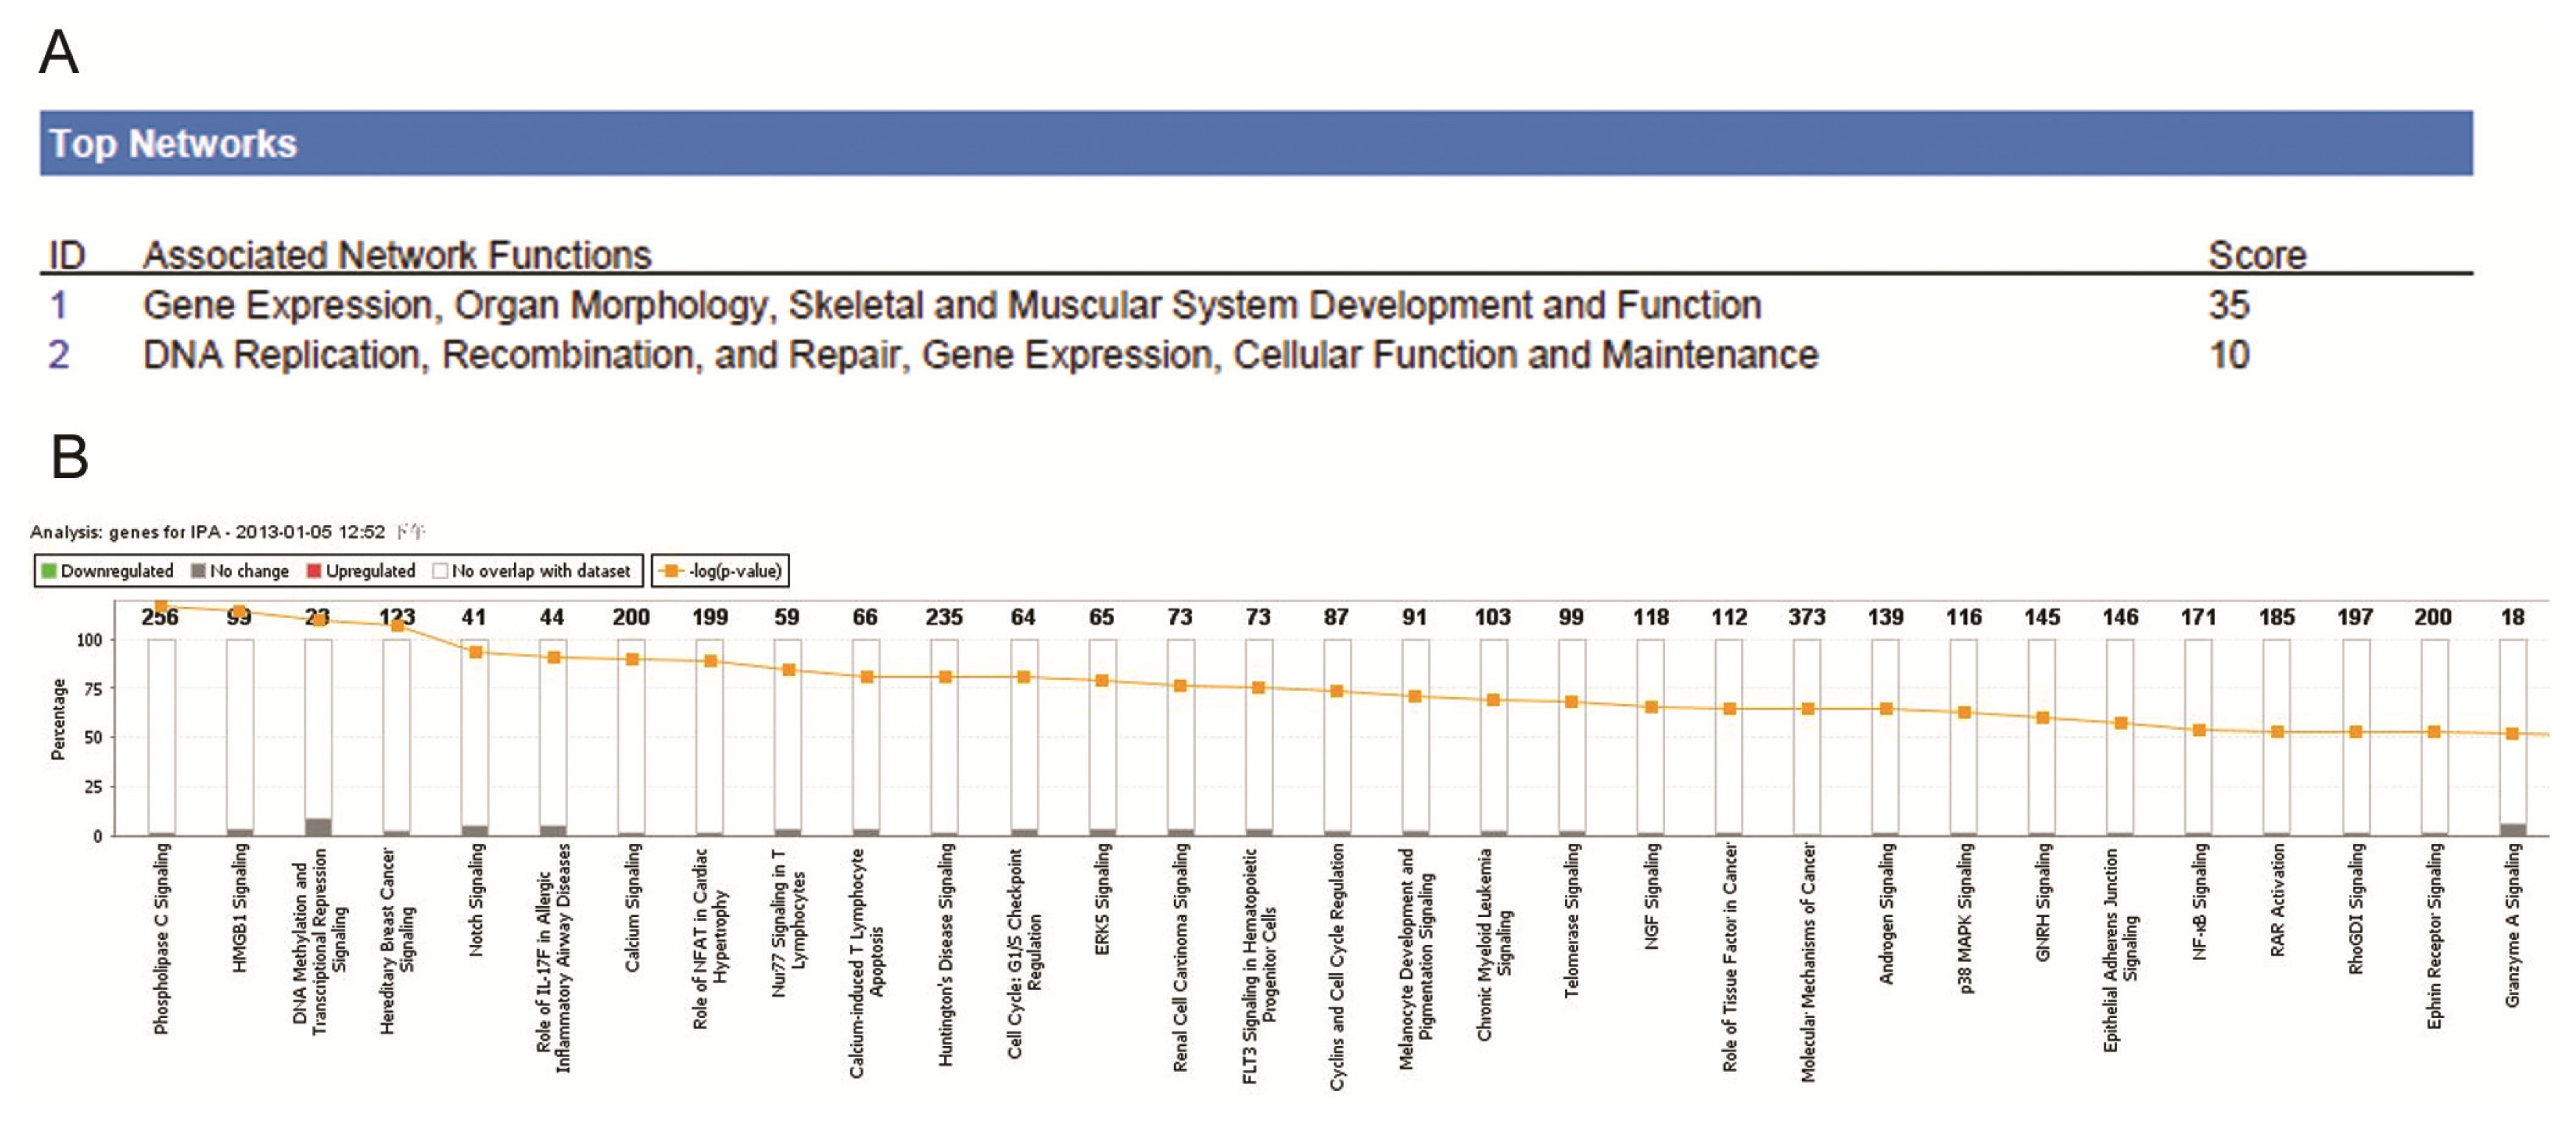
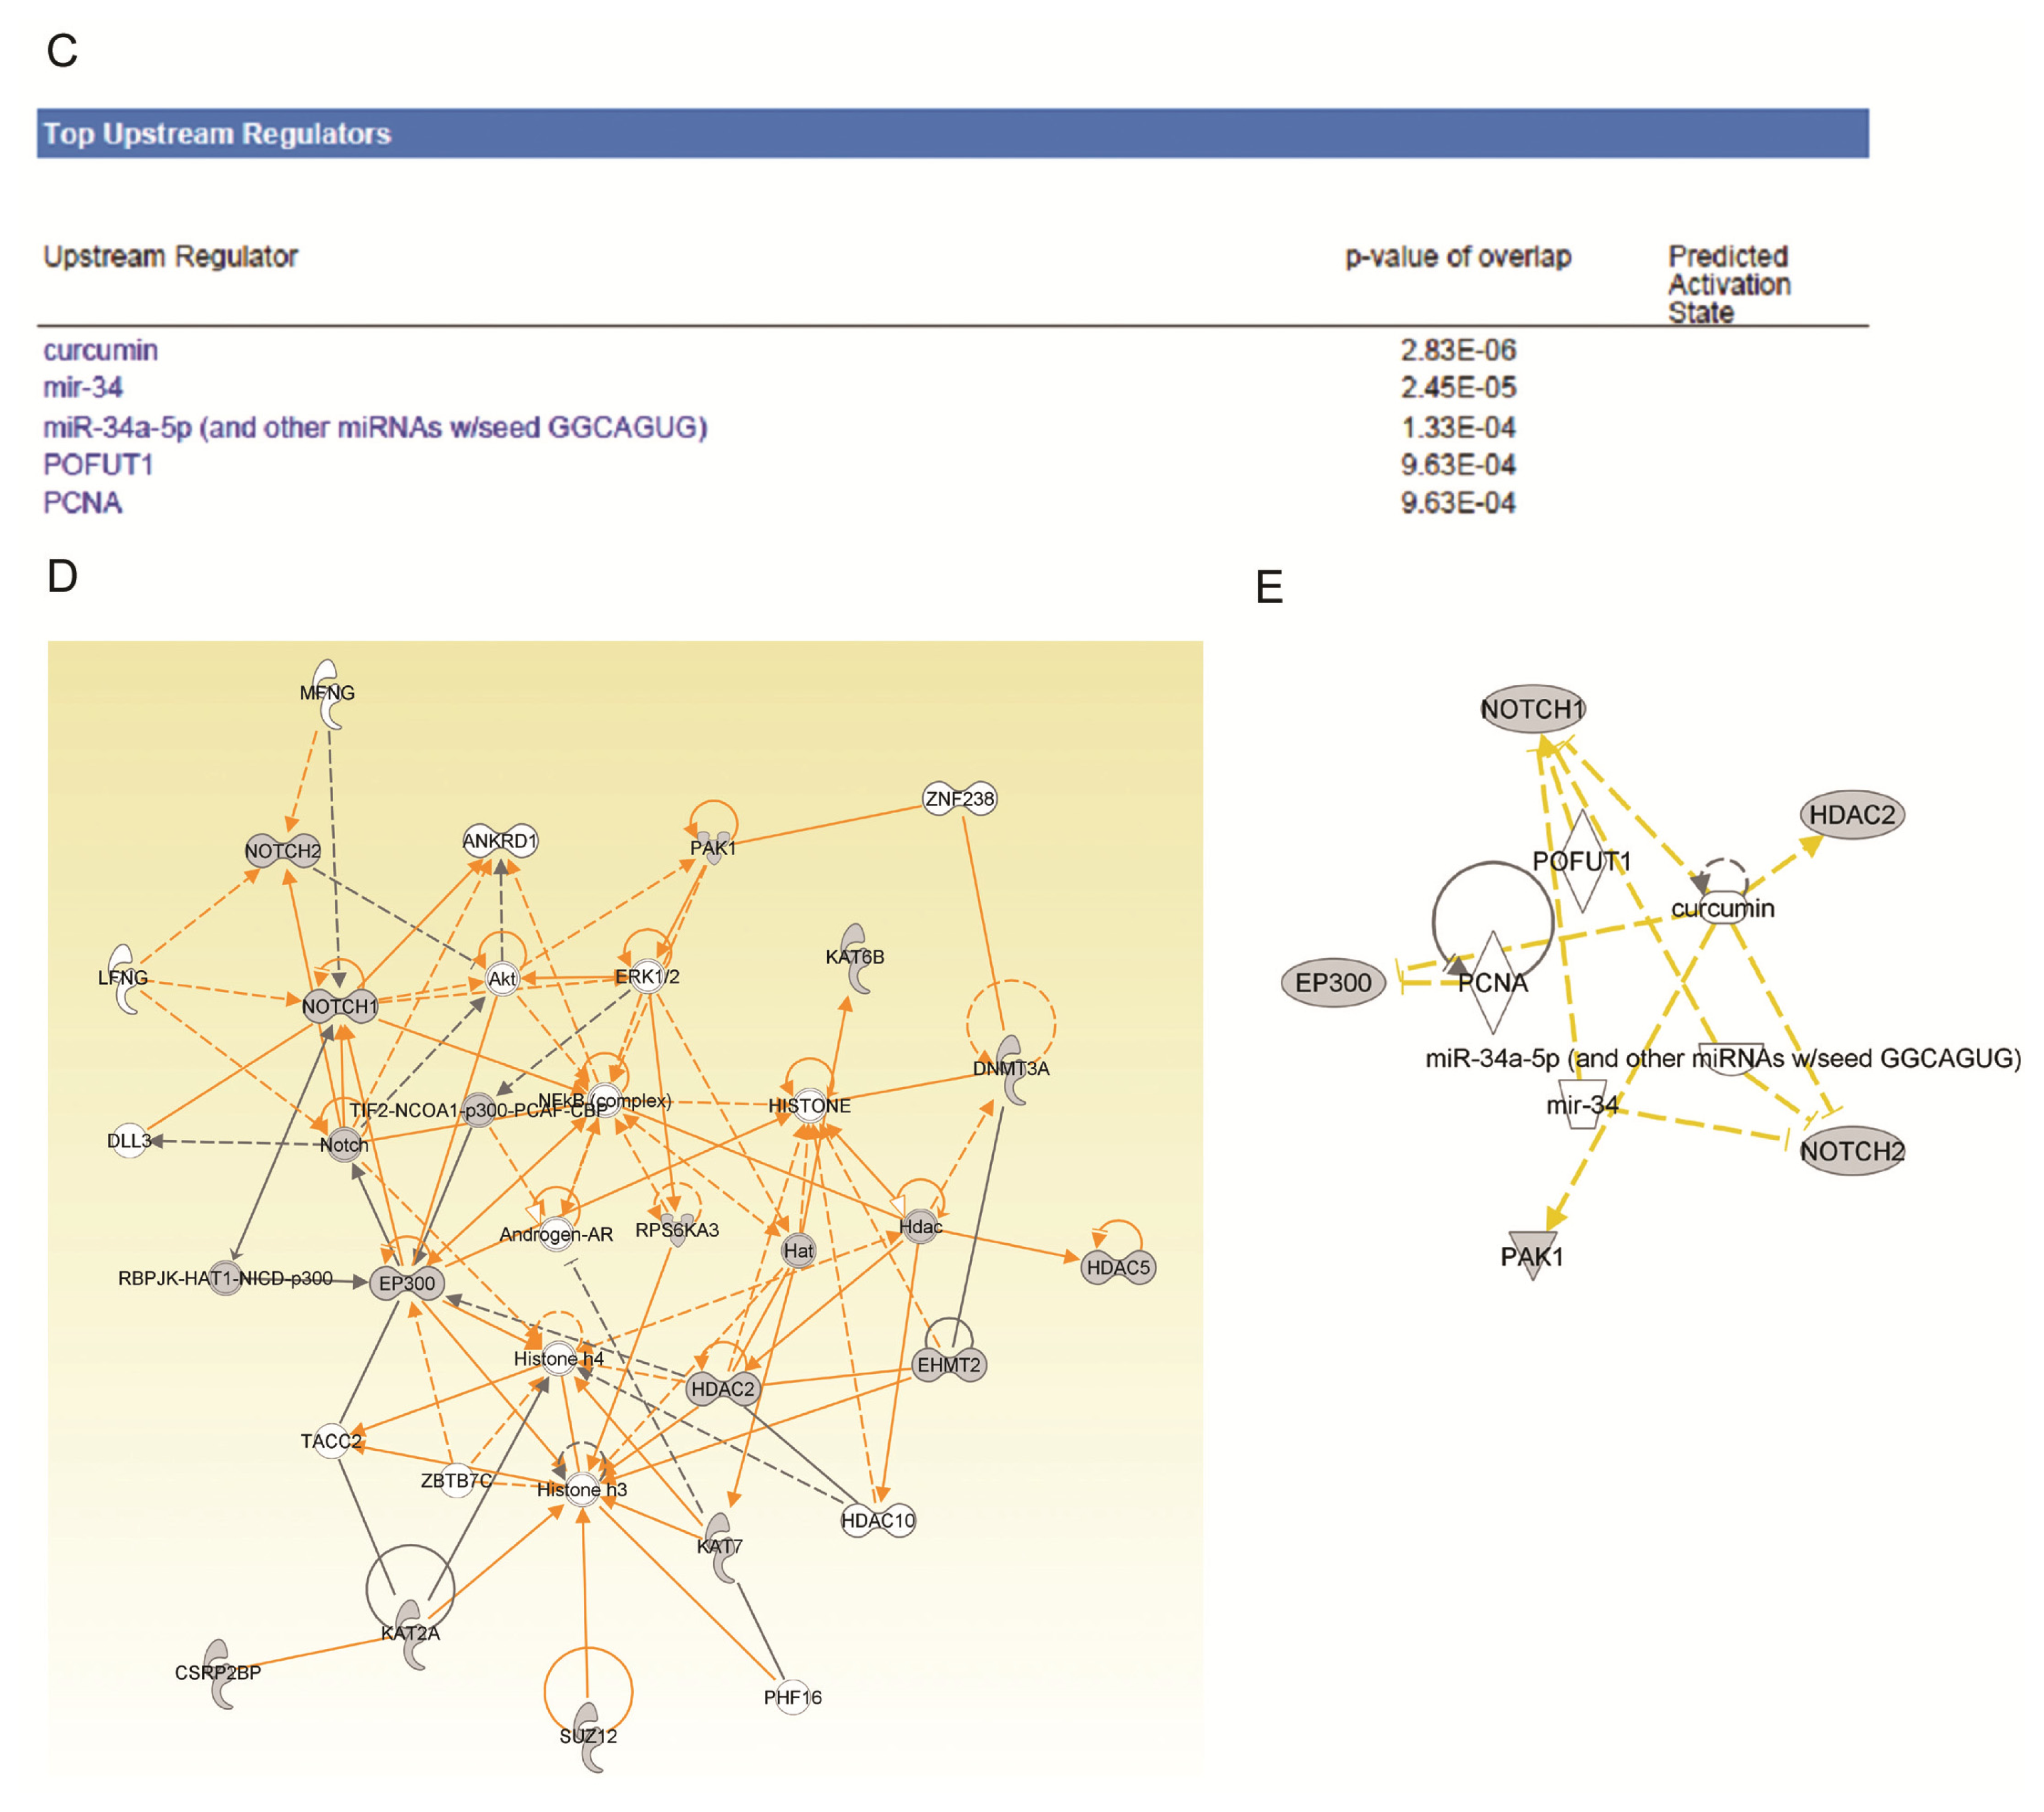
2.4. Ingenuity Pathway Analysis of Dys-regulated Genes in Normal Karyotype B cell Pediatric ALL
3. Experimental Section
3.1. Patients and Samples
3.2. RNA Extraction
3.3. Synthesis of cDNA
3.4. Real-Time PCR Array Design and Testing
3.5. Real-Time PCR Array Analysis
3.6. Western Blot Analysis
3.7. Ingenuity Pathway Analysis (IPA)
3.8. Statistical Analysis
4. Conclusions
Acknowledgments
Conflicts of Interest
References
- Foa, R. Acute lymphoblastic leukemia: Age and biology. Pediatr. Rep 2011, 3, e2. [Google Scholar]
- Krupa, M.; Szczepanski, T. Prophylaxis of hepatitis B in children treated for ALL. Wiad. Lek 2009, 62, 149–152. [Google Scholar]
- Pui, C.H. Acute lymphoblastic leukemia: Introduction. Semin. Hematol 2009, 46, 1–2. [Google Scholar]
- Salek, C.; Sponerova, D.; Soukupova Maaloufova, J. Acute lymphoblastic leukemia: Past and present. Vnitr. Lek 2012, 58, 20–26. [Google Scholar]
- Zangrando, A.; Dell’orto, M.C.; Te Kronnie, G.; Basso, G. MLL rearrangements in pediatric acute lymphoblastic and myeloblastic leukemias: MLL specific and lineage specific signatures. BMC Med. Genomics 2009, 2, 36. [Google Scholar]
- Mishra, B.P.; Ansari, K.I.; Mandal, S.S. Dynamic association of MLL1, H3K4 trimethylation with chromatin and Hox gene expression during the cell cycle. FEBS J 2009, 276, 1629–1640. [Google Scholar]
- Passaro, D.; Rana, G.; Piscopo, M.; Viggiano, E.; de Luca, B.; Fucci, L. Epigenetic chromatin modifications in the cortical spreading depression. Brain Res 2010, 1329, 1–9. [Google Scholar]
- Krivtsov, A.V.; Armstrong, S.A. MLL translocations, histone modifications and leukaemia stem-cell development. Nat. Rev. Cancer 2007, 7, 823–833. [Google Scholar]
- Cosgrove, M.S.; Patel, A. Mixed lineage leukemia: A structure-function perspective of the MLL1 protein. FEBS J 2010, 277, 1832–1842. [Google Scholar]
- Islam, A.B.; Richter, W.F.; Jacobs, L.A.; Lopez-Bigas, N.; Benevolenskaya, E.V. Co-regulation of histone-modifying enzymes in cancer. PLoS One 2011, 6, e24023. [Google Scholar]
- Fullgrabe, J.; Kavanagh, E.; Joseph, B. Histone onco-modifications. Oncogene 2011, 30, 3391–3403. [Google Scholar]
- Henrique, R.; Luis, A.S.; Jeronimo, C. The epigenetics of renal cell tumors: From biology to biomarkers. Front. Genet 2012, 3, 94. [Google Scholar]
- Nemeth, A.; Langst, G. Chromatin higher order structure: Opening up chromatin for transcription. Brief Funct. Genomic Proteomic 2004, 2, 334–343. [Google Scholar]
- Zhang, Y.; Moriguchi, H. Chromatin remodeling system, cancer stem-like attractors, and cellular reprogramming. Cell. Mol. Life Sci 2011, 68, 3557–3571. [Google Scholar]
- Del Rizzo, P.A.; Trievel, R.C. Substrate and product specificities of SET domain methyltransferases. Epigenetics 2011, 6, 1059–1067. [Google Scholar]
- Albaugh, B.N.; Arnold, K.M.; Denu, J.M. KAT(ching) metabolism by the tail: Insight into the links between lysine acetyltransferases and metabolism. Chembiochem 2011, 12, 290–298. [Google Scholar]
- Hou, H.; Yu, H. Structural insights into histone lysine demethylation. Curr. Opin. Struct. Biol 2010, 20, 739–748. [Google Scholar]
- Krichevsky, A.; Zaltsman, A.; Lacroix, B.; Citovsky, V. Involvement of KDM1C histone demethylase-OTLD1 otubain-like histone deubiquitinase complexes in plant gene repression. Proc. Natl. Acad. Sci. USA 2011, 108, 11157–11162. [Google Scholar]
- Luo, X.; Liu, Y.; Kubicek, S.; Myllyharju, J.; Tumber, A.; Ng, S.; Che, K.H.; Podoll, J.; Heightman, T.D.; Oppermann, U.; et al. A selective inhibitor and probe of the cellular functions of Jumonji C domain-containing histone demethylases. J. Am. Chem. Soc 2011, 133, 9451–9456. [Google Scholar]
- Marmorstein, R.; Trievel, R.C. Histone modifying enzymes: Structures, mechanisms, and specificities. Biochim. Biophys. Acta 2009, 1789, 58–68. [Google Scholar]
- Upadhyay, A.K.; Cheng, X. Dynamics of histone lysine methylation: Structures of methyl writers and erasers. Prog. Drug Res 2011, 67, 107–124. [Google Scholar]
- Lawless, M.W.; Norris, S.; O’Byrne, K.J.; Gray, S.G. Targeting histone deacetylases for the treatment of disease. J. Cell. Mol. Med 2009, 13, 826–852. [Google Scholar]
- Tao, Y.F.; Wu, D.; Pang, L.; Zhao, W.L.; Lu, J.; Wang, N.; Wang, J.; Feng, X.; Li, Y.H.; Ni, J.; et al. Analyzing the gene expression profile of pediatric acute myeloid leukemia with real-time PCR arrays. Cancer Cell. Int 2012, 12, 40. [Google Scholar]
- Arikawa, E.; Sun, Y.; Wang, J.; Zhou, Q.; Ning, B.; Dial, S.L.; Guo, L.; Yang, J. Cross-platform comparison of SYBR Green real-time PCR with TaqMan PCR, microarrays and other gene expression measurement technologies evaluated in the MicroArray Quality Control (MAQC) study. BMC Genomics 2008, 9, 328. [Google Scholar]
- Moreno, D.A.; Scrideli, C.A.; Cortez, M.A.; de Paula Queiroz, R.; Valera, E.T.; da Silva Silveira, V.; Yunes, J.A.; Brandalise, S.R.; Tone, L.G. Differential expression of HDAC3, HDAC7 and HDAC9 is associated with prognosis and survival in childhood acute lymphoblastic leukaemia. Br. J. Haematol 2010, 150, 665–673. [Google Scholar]
- Niegisch, G.; Knievel, J.; Koch, A.; Hader, C.; Fischer, U.; Albers, P.; Schulz, W.A. Changes in histone deacetylase (HDAC) expression patterns and activity of HDAC inhibitors in urothelial cancers. Urol. Oncol. 2012. [Epub ahead of print]. [Google Scholar]
- Patani, N.; Jiang, W.G.; Newbold, R.F.; Mokbel, K. Histone-modifier gene expression profiles are associated with pathological and clinical outcomes in human breast cancer. Anticancer Res 2011, 31, 4115–4125. [Google Scholar]
- Noh, J.H.; Jung, K.H.; Kim, J.K.; Eun, J.W.; Bae, H.J.; Xie, H.J.; Chang, Y.G.; Kim, M.G.; Park, W.S.; Lee, J.Y.; et al. Aberrant regulation of HDAC2 mediates proliferation of hepatocellular carcinoma cells by deregulating expression of G1/S cell cycle proteins. PLoS One 2011, 6, e28103. [Google Scholar]
- Zhu, P.; Martin, E.; Mengwasser, J.; Schlag, P.; Janssen, K.P.; Gottlicher, M. Induction of HDAC2 expression upon loss of APC in colorectal tumorigenesis. Cancer Cell 2004, 5, 455–463. [Google Scholar]
- Zhu, G.; Wang, Y.; Huang, B.; Liang, J.; Ding, Y.; Xu, A.; Wu, W. A Rac1/PAK1 cascade controls beta-catenin activation in colon cancer cells. Oncogene 2012, 31, 1001–1012. [Google Scholar]
- Lee, M.Y.; Kim, S.H.; Ihm, H.J.; Chae, H.D.; Kim, C.H.; Kang, B.M. Up-regulation of p21-activated kinase 1 by in vitro treatment with interleukin 1-beta and its increased expression in ovarian endometriotic cysts. Fertil Steril 2011, 96, 508–511. [Google Scholar]
- Kamai, T.; Shirataki, H.; Nakanishi, K.; Furuya, N.; Kambara, T.; Abe, H.; Oyama, T.; Yoshida, K. Increased Rac1 activity and Pak1 overexpression are associated with lymphovascular invasion and lymph node metastasis of upper urinary tract cancer. BMC Cancer 2010, 10, 164. [Google Scholar]
- Kim, S.R.; Kim, S.H.; Lee, H.W.; Chae, H.D.; Kim, C.H.; Kang, B.M. Increased expression of p21-activated kinase in adenomyosis. Fertil Steril 2010, 94, 1125–1128. [Google Scholar]
- Wang, R.A.; Vadlamudi, R.K.; Bagheri-Yarmand, R.; Beuvink, I.; Hynes, N.E.; Kumar, R. Essential functions of p21-activated kinase 1 in morphogenesis and differentiation of mammary glands. J. Cell. Biol 2003, 161, 583–592. [Google Scholar]
- Akinmade, D.; Talukder, A.H.; Zhang, Y.; Luo, W.M.; Kumar, R.; Hamburger, A.W. Phosphorylation of the ErbB3 binding protein Ebp1 by p21-activated kinase 1 in breast cancer cells. Br. J. Cancer 2008, 98, 1132–1140. [Google Scholar]
- Siu, M.K.; Wong, E.S.; Chan, H.Y.; Kong, D.S.; Woo, N.W.; Tam, K.F.; Ngan, H.Y.; Chan, Q.K.; Chan, D.C.; Chan, K.Y.; et al. Differential expression and phosphorylation of Pak1 and Pak2 in ovarian cancer: Effects on prognosis and cell invasion. Int. J. Cancer 2010, 127, 21–31. [Google Scholar]
- Tharakan, R.; Lepont, P.; Singleton, D.; Kumar, R.; Khan, S. Phosphorylation of estrogen receptor alpha, serine residue 305 enhances activity. Mol. Cell. Endocrinol 2008, 295, 70–78. [Google Scholar]
- Wang, J.X.; Zhou, Y.N.; Zou, S.J.; Ren, T.W.; Zhang, Z.Y. Correlations of P21-activated kinase 1 expression to clinicopathological features of gastric carcinoma and patients’ prognosis. Chin. J. Cancer 2010, 29, 649–654. [Google Scholar]
- Liu, F.; Li, X.; Wang, C.; Cai, X.; Du, Z.; Xu, H.; Li, F. Downregulation of p21-activated kinase-1 inhibits the growth of gastric cancer cells involving cyclin B1. Int. J. Cancer 2009, 125, 2511–2519. [Google Scholar]
- Tillinghast, G.W.; Partee, J.; Albert, P.; Kelley, J.M.; Burtow, K.H.; Kelly, K. Analysis of genetic stability at the EP300 and CREBBP loci in a panel of cancer cell lines. Genes Chromosomes Cancer 2003, 37, 121–131. [Google Scholar]
- Bryan, E.J.; Jokubaitis, V.J.; Chamberlain, N.L.; Baxter, S.W.; Dawson, E.; Choong, D.Y.; Campbell, I.G. Mutation analysis of EP300 in colon, breast and ovarian carcinomas. Int. J. Cancer 2002, 102, 137–141. [Google Scholar]
- Gayther, S.A.; Batley, S.J.; Linger, L.; Bannister, A.; Thorpe, K.; Chin, S.F.; Daigo, Y.; Russell, P.; Wilson, A.; Sowter, H.M.; et al. Mutations truncating the EP300 acetylase in human cancers. Nat. Genet 2000, 24, 300–303. [Google Scholar]
- Zhong, J.; Cao, R.X.; Zu, X.Y.; Hong, T.; Yang, J.; Liu, L.; Xiao, X.H.; Ding, W.J.; Zhao, Q.; Liu, J.H.; et al. Identification and characterization of novel spliced variants of PRMT2 in breast carcinoma. FEBS J 2012, 279, 316–335. [Google Scholar]
- Hata, K.; Nishijima, K.; Mizuguchi, J. Role for Btg1 and Btg2 in growth arrest of WEHI-231 cells through arginine methylation following membrane immunoglobulin engagement. Exp. Cell. Res 2007, 313, 2356–2366. [Google Scholar]
- Scoumanne, A.; Chen, X. The epithelial cell transforming sequence 2, a guanine nucleotide exchange factor for Rho GTPases, is repressed by p53 via protein methyltransferases and is required for G1-S transition. Cancer Res 2006, 66, 6271–6279. [Google Scholar]
- Ganesh, L.; Yoshimoto, T.; Moorthy, N.C.; Akahata, W.; Boehm, M.; Nabel, E.G.; Nabel, G.J. Protein methyltransferase 2 inhibits NF-kappaB function and promotes apoptosis. Mol. Cell. Biol 2006, 26, 3864–3874. [Google Scholar]
- Wong, K.Y.; Yu, L.; Chim, C.S. DNA methylation of tumor suppressor miRNA genes: A lesson from the miR-34 family. Epigenomics 2011, 3, 83–92. [Google Scholar]
- Hermeking, H. The miR-34 family in cancer and apoptosis. Cell Death Differ 2010, 17, 193–199. [Google Scholar]
- Tabuchi, T.; Satoh, M.; Itoh, T.; Nakamura, M. MicroRNA-34a regulates the longevity-associated protein SIRT1 in coronary artery disease: Effect of statins on SIRT1 and microRNA-34a expression. Clin. Sci 2012, 123, 161–171. [Google Scholar]
- Yamakuchi, M.; Lowenstein, C.J. MiR-34, SIRT1 and p53: The feedback loop. Cell Cycle 2009, 8, 712–715. [Google Scholar]
- Yamakuchi, M.; Ferlito, M.; Lowenstein, C.J. miR-34a repression of SIRT1 regulates apoptosis. Proc. Natl. Acad. Sci. USA 2008, 105, 13421–13426. [Google Scholar]
- Shishodia, S. Molecular mechanisms of curcumin action: Gene expression. Biofactors 2012. [Google Scholar] [CrossRef]
- Basnet, P.; Skalko-Basnet, N. Curcumin: An anti-inflammatory molecule from a curry spice on the path to cancer treatment. Molecules 2011, 16, 4567–4598. [Google Scholar]
- Ravindran, J.; Prasad, S.; Aggarwal, B.B. Curcumin and cancer cells: How many ways can curry kill tumor cells selectively? AAPS J 2009, 11, 495–510. [Google Scholar]


| NBM/ITP | Pediatric ALL | ||
|---|---|---|---|
| Age | 4.3 (0.7–13.6) | 5.1 (0.9–13.6) | |
| Sex (M/F) | 12/8 | 19/11 | |
| White blood cells (109/L) | 8.4 (3.82–16.97) | 56.9 (2.1–638) | |
| Hemoglobin (g/L) | 129 (90–157) | 81.2 (28–126) | |
| Platelet count (109/L) | 313 (17–498) | 49 (8–195) | |
| Immunophenotyping | B-ALL | ns | 28 |
| T-ALL | ns | 2 | |
| Risk stratification | Standard | ns | 6 |
| Median | ns | 8 | |
| High | ns | 16 | |
| Karyotype | Normal | ns | 18 |
| Abnormal | ns | 12 | |
| Fusion gene | MLL | ns | 2 |
| TEL/AML1 | ns | 7 | |
| BCR/ABL1 | ns | 1 | |
| E2A/PBX | ns | 1 | |
| Gene | Description | NBM | ALL | Change | p value | |
|---|---|---|---|---|---|---|
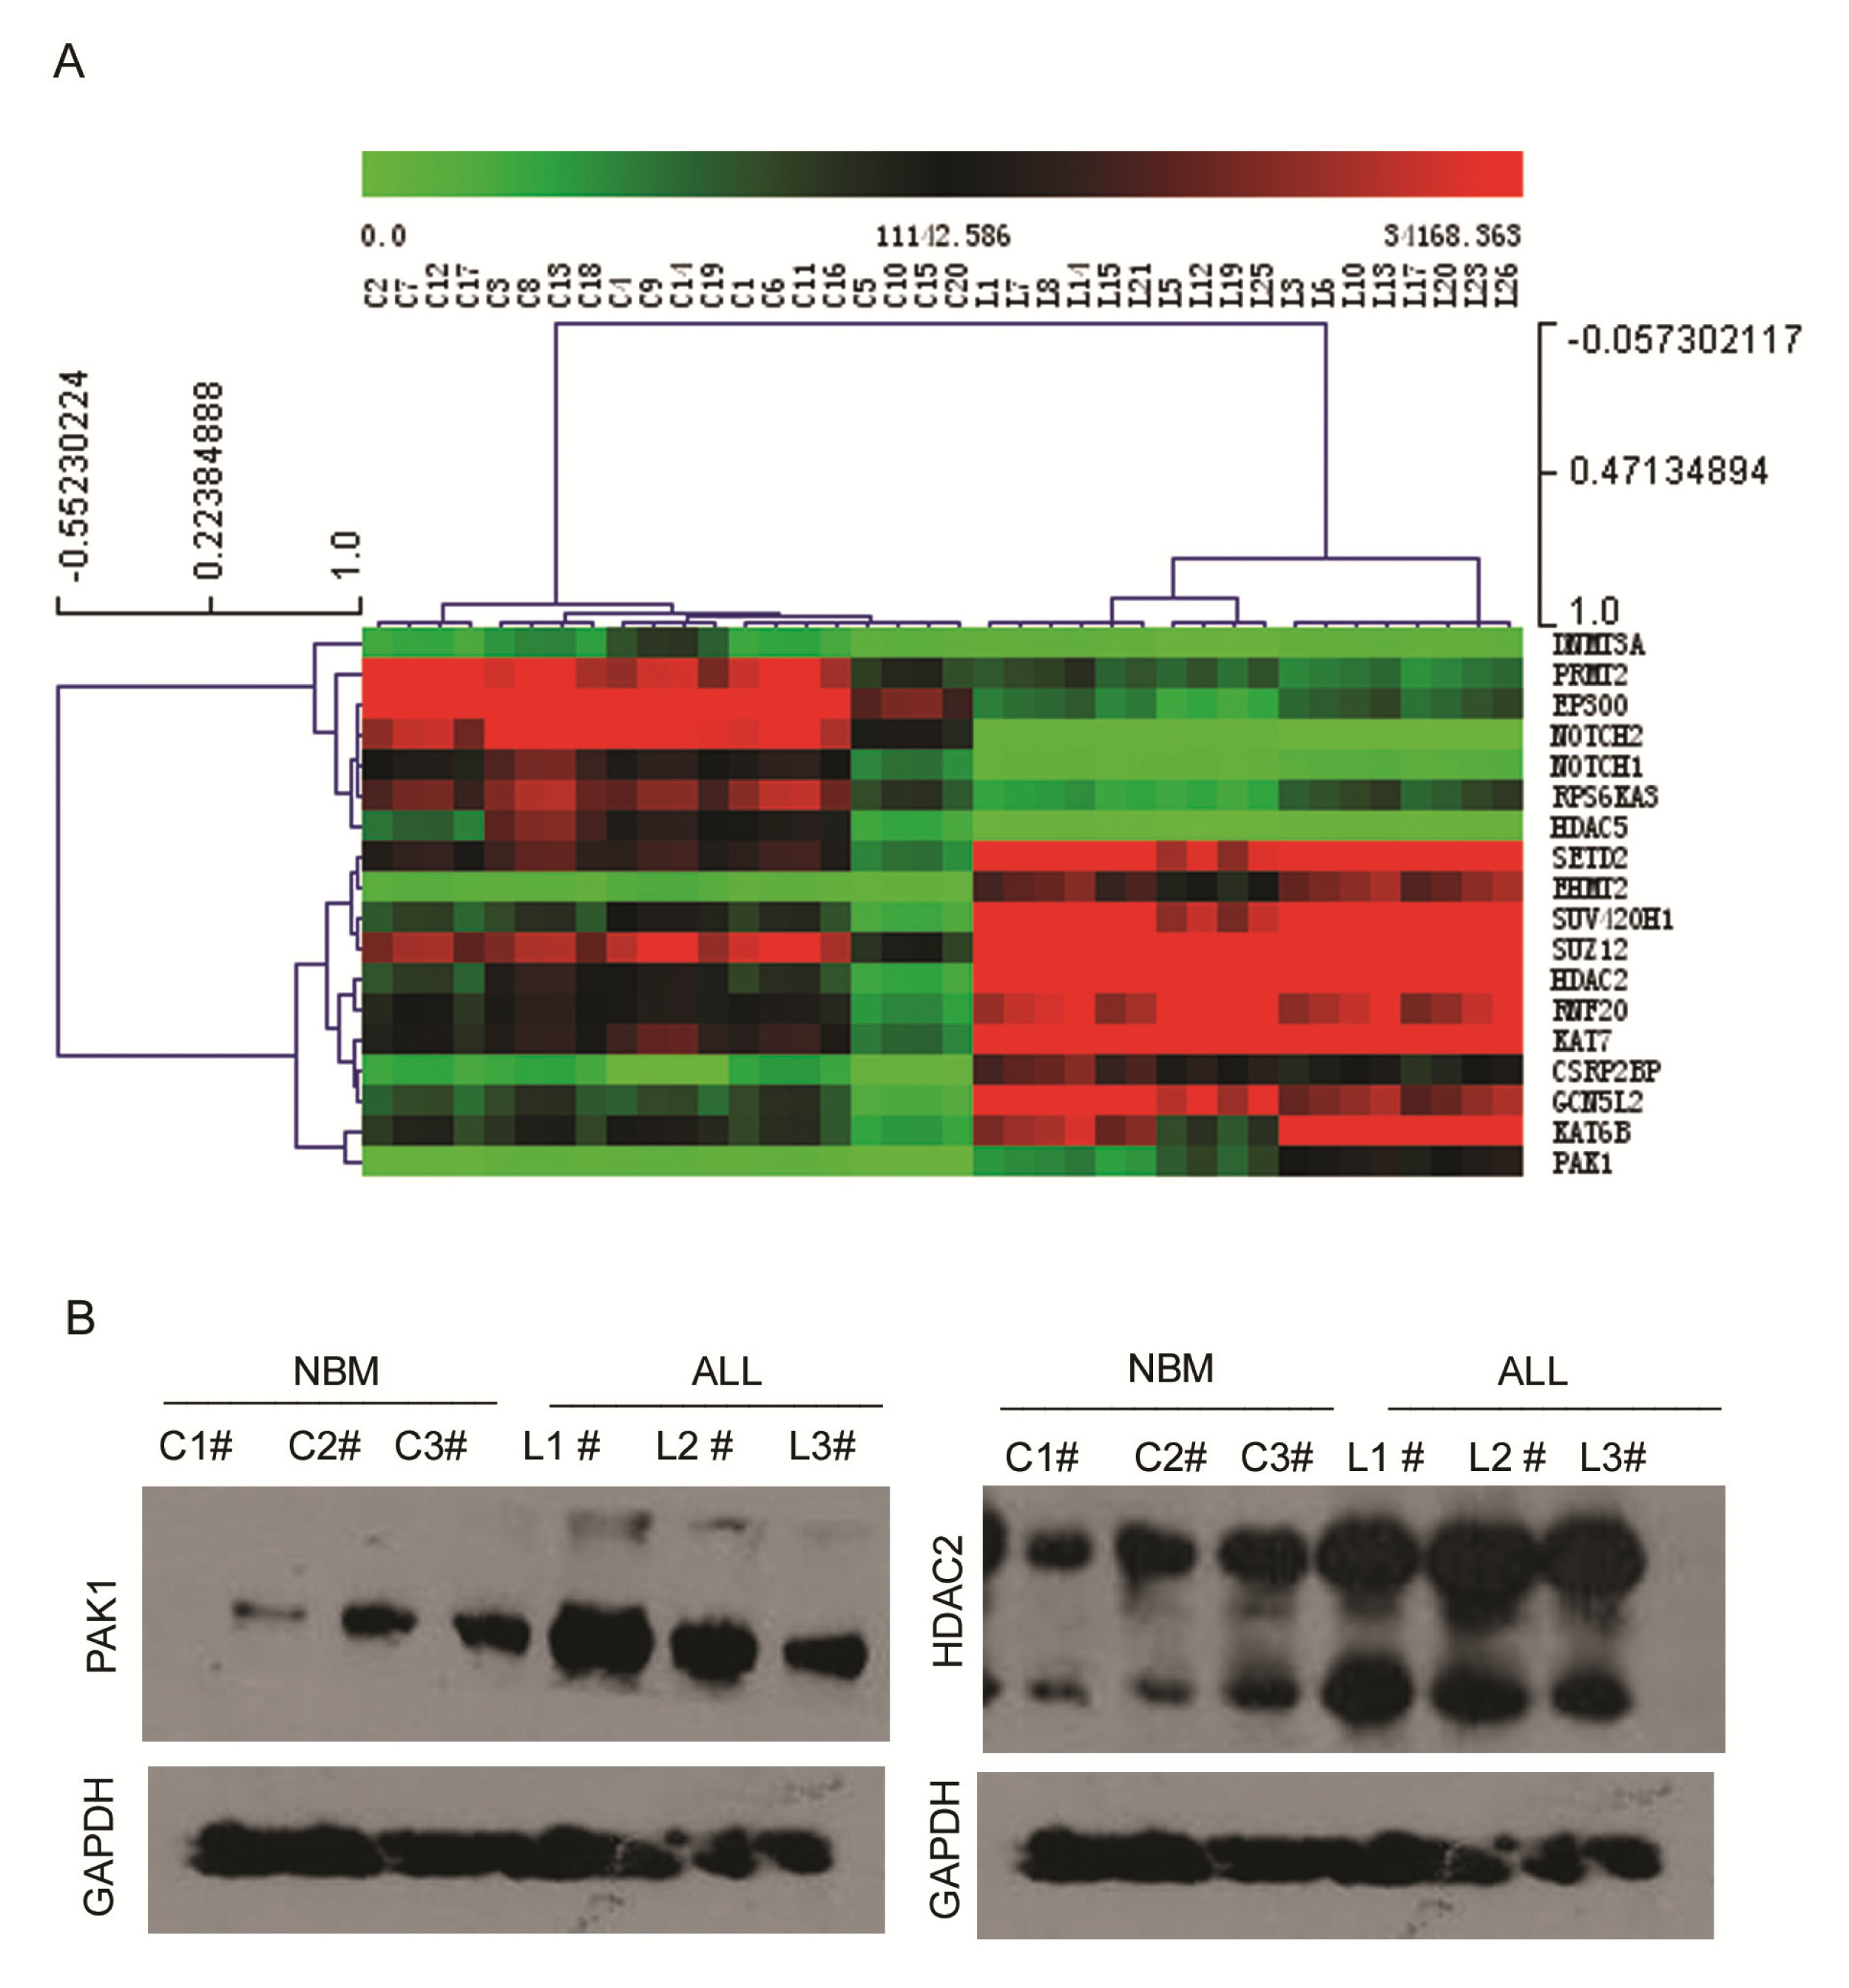
| 1 | PAK1 | P21 protein (Cdc42/Rac)-activated kinase 1 | 690.78 | 8684.84 | 12.57 | 3.94 × 10⁻¹⁷ |
| 2 | EHMT2 | Euchromatic histone-lysine N-methyltransferase 2 | 1238.91 | 19701.33 | 15.90 | 1.07 × 10⁻¹⁵ |
| 3 | KAT7 | K(lysine) acetyltransferase 7 | 13037.87 | 76644.47 | 5.88 | 5.97 × 10⁻⁹ |
| 4 | GCN5L2 | K(lysine) acetyltransferase 2A | 6554.99 | 33808.15 | 5.16 | 6.03 × 10⁻⁹ |
| 5 | SUZ12 | Suppressor of zeste 12 homolog | 24556.24 | 123398.3 | 5.03 | 1.56 × 10⁻⁶ |
| 6 | SUV420H1 | Suppressor of variegation 4–20 homolog 1 | 7843.03 | 44187.54 | 5.63 | 1.65 × 10⁻⁶ |
| 7 | KAT6B | K(lysine) acetyltransferase 6B | 26130.51 | 75299.71 | 2.88 | 4.19 × 10⁻⁶ |
| 8 | CSRP2BP | CSRP2 binding protein | 2041.52 | 14595.22 | 7.15 | 2.25 × 10⁻⁵ |
| 9 | RNF20 | Ring finger protein 20 | 10498.77 | 32675.14 | 3.11 | 0.00034 |
| 10 | SETD2 | SET domain containing 2 | 14027.6 | 42467.29 | 3.02 | 0.008 |
| 11 | HDAC2 | Histone deacetylase 2 | 9325.25 | 50147.01 | 5.38 | 0.015 |
| Gene | Description | NBM | ALL | Change | p value | |
|---|---|---|---|---|---|---|
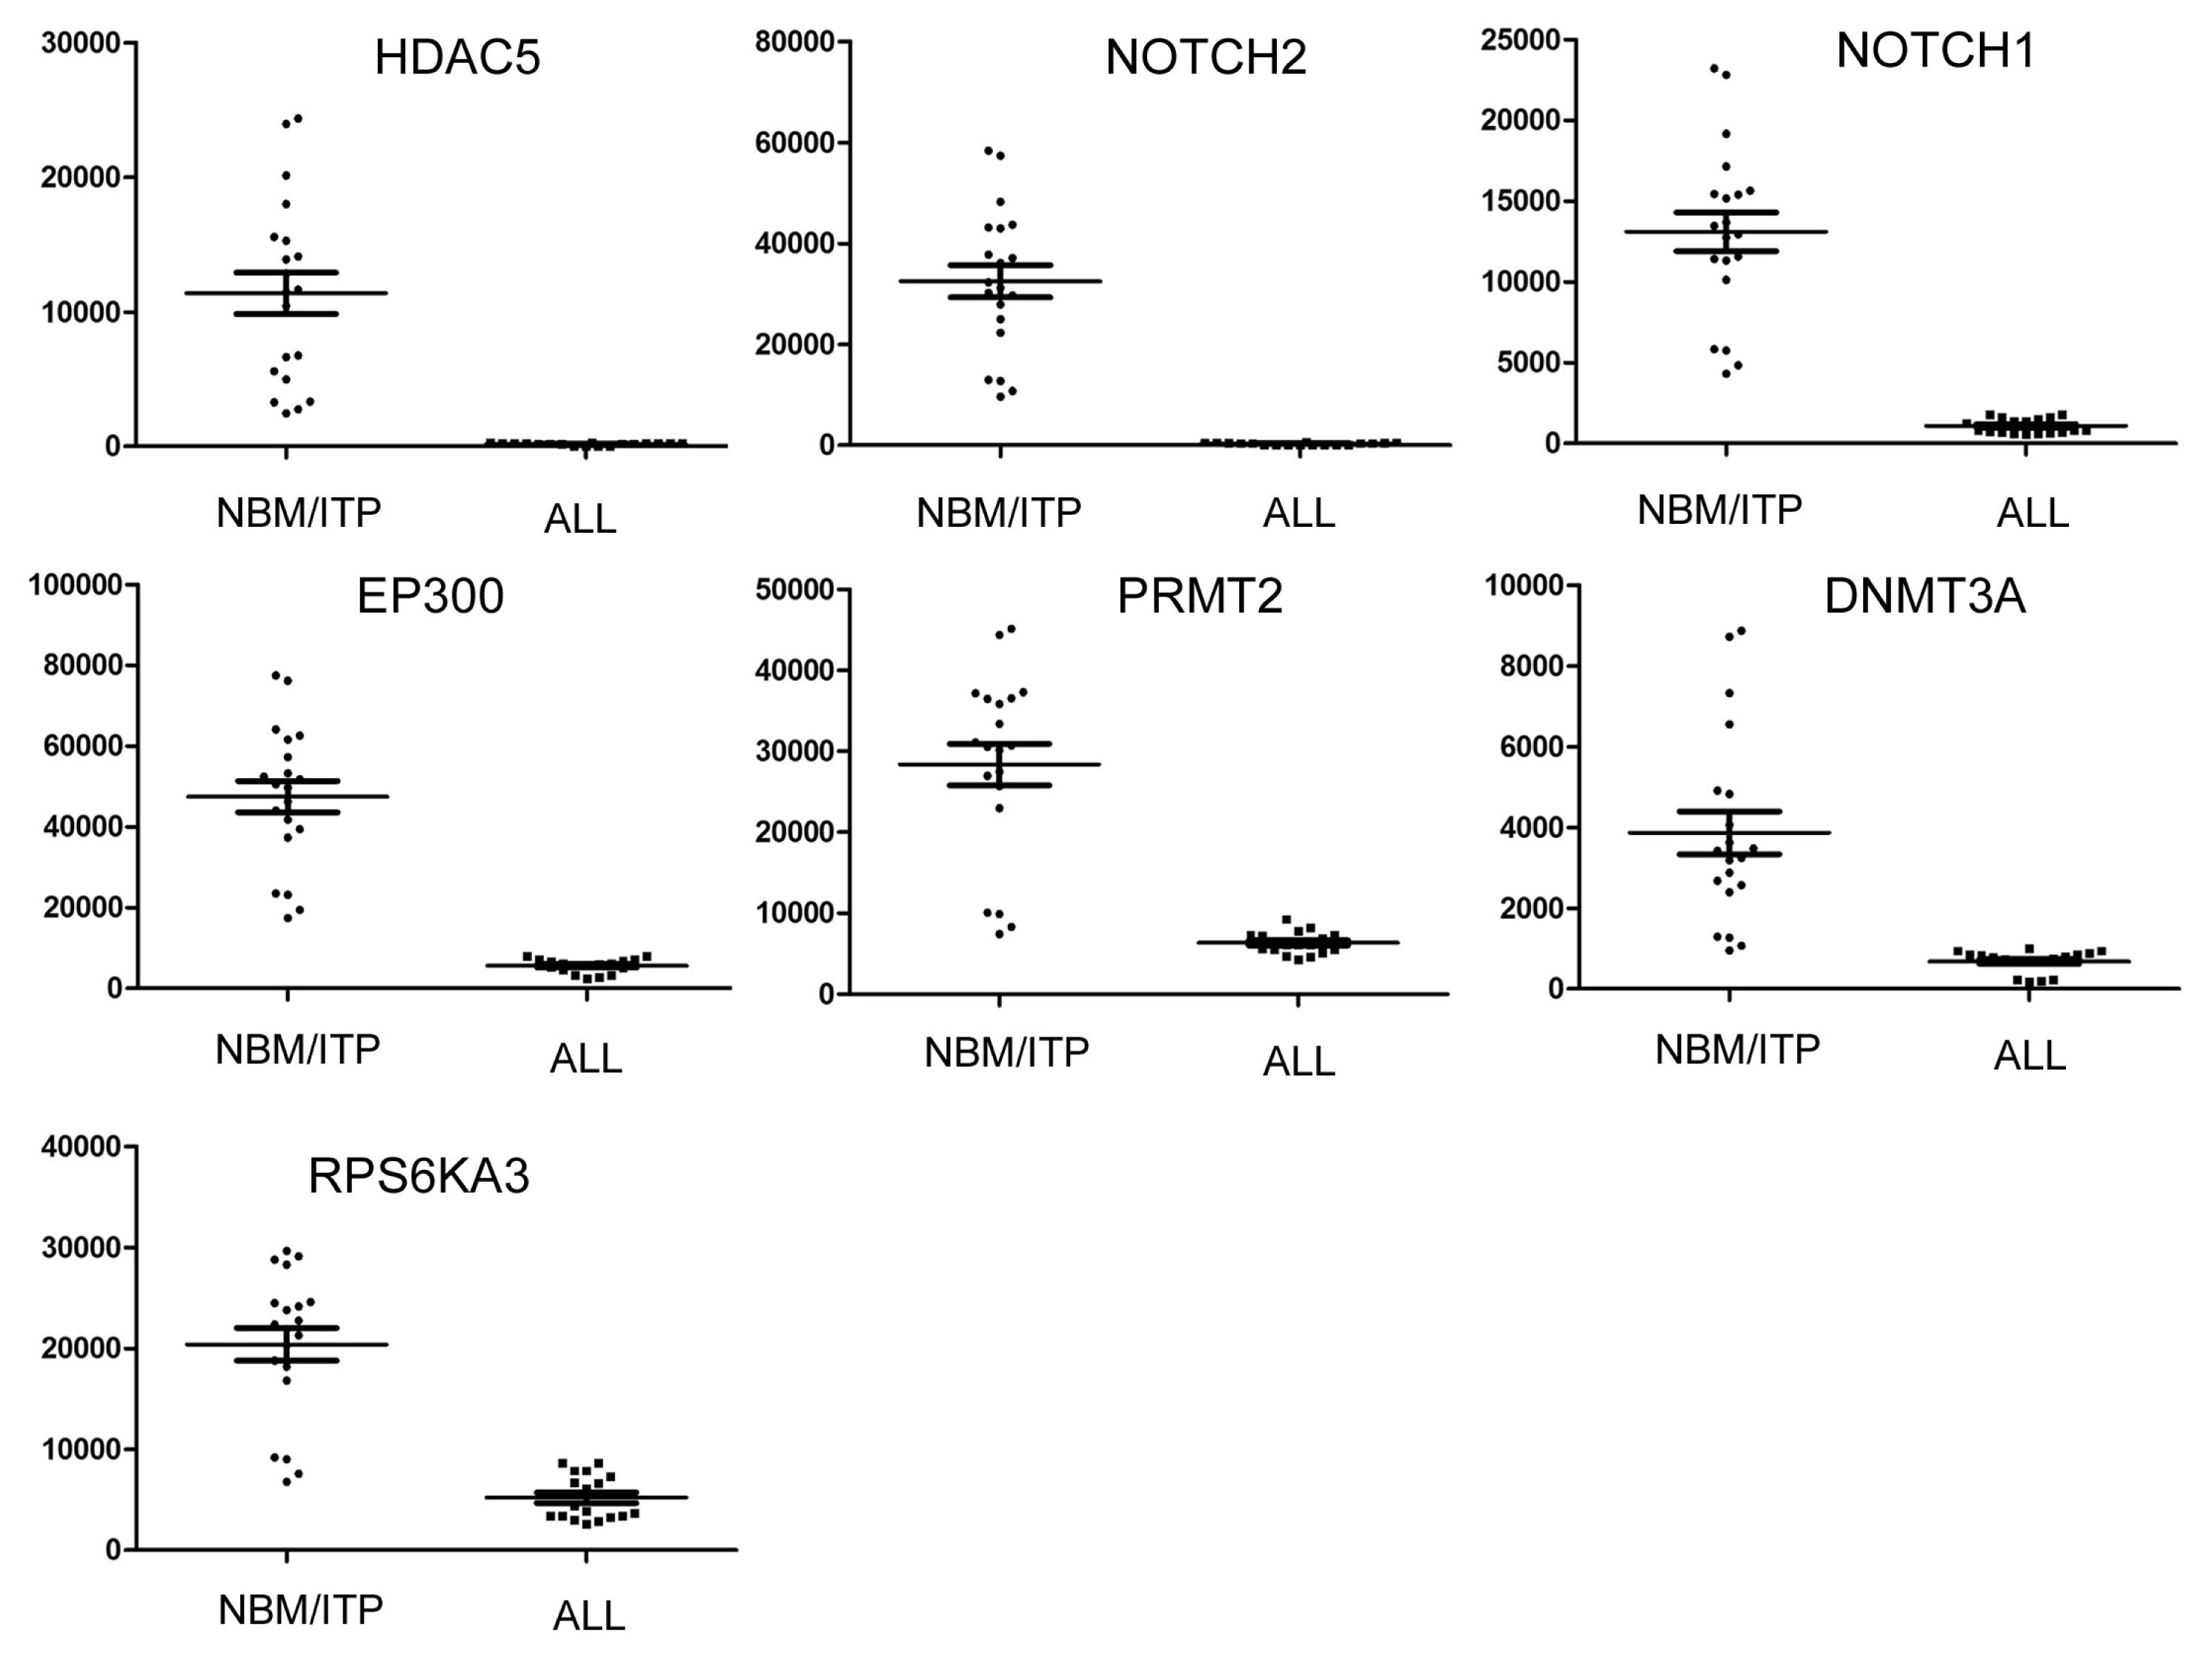
| 1 | HDAC5 | Histone deacetylase 5 | 11379.83 | 186.94 | 0.01 | 2.67 × 10⁻²⁷ |
| 2 | NOTCH2 | Notch homolog 2 | 32473.8 | 319.09 | 0.01 | 3.05 × 10⁻²⁷ |
| 3 | NOTCH1 | Notch homolog 1 | 13109.41 | 1089.23 | 0.05 | 9.19 × 10⁻¹⁵ |
| 4 | EP300 | E1A binding protein p300 | 47487.19 | 5601.60 | 0.12 | 1.37 × 10⁻¹³ |
| 5 | PRMT2 | Protein arginine methyltransferase 2 | 28388.11 | 6336.82 | 0.22 | 2.08 × 10⁻¹² |
| 6 | DNMT3A | DNA (cytosine) methyltransferase 3 alpha | 3868.084 | 682.15 | 0.17 | 2.04 × 10⁻¹² |
| 7 | RPS6KA3 | Ribosomal protein S6 polypeptide 3 | 20389.11 | 5203.03 | 0.25 | 1.00 × 10⁻⁵ |
Supplementary Files
© 2013 by the authors; licensee Molecular Diversity Preservation International, Basel, Switzerland. This article is an open access article distributed under the terms and conditions of the Creative Commons Attribution license (http://creativecommons.org/licenses/by/3.0/).
Share and Cite
Tao, Y.-F.; Pang, L.; Du, X.-J.; Sun, L.-C.; Hu, S.-Y.; Lu, J.; Cao, L.; Zhao, W.-L.; Feng, X.; Wang, J.; et al. Differential mRNA Expression Levels of Human Histone-Modifying Enzymes in Normal Karyotype B Cell Pediatric Acute Lymphoblastic Leukemia. Int. J. Mol. Sci. 2013, 14, 3376-3394. https://doi.org/10.3390/ijms14023376
Tao Y-F, Pang L, Du X-J, Sun L-C, Hu S-Y, Lu J, Cao L, Zhao W-L, Feng X, Wang J, et al. Differential mRNA Expression Levels of Human Histone-Modifying Enzymes in Normal Karyotype B Cell Pediatric Acute Lymphoblastic Leukemia. International Journal of Molecular Sciences. 2013; 14(2):3376-3394. https://doi.org/10.3390/ijms14023376
Chicago/Turabian StyleTao, Yan-Fang, Li Pang, Xiao-Juan Du, Li-Chao Sun, Shao-Yan Hu, Jun Lu, Lan Cao, Wen-Li Zhao, Xing Feng, Jian Wang, and et al. 2013. "Differential mRNA Expression Levels of Human Histone-Modifying Enzymes in Normal Karyotype B Cell Pediatric Acute Lymphoblastic Leukemia" International Journal of Molecular Sciences 14, no. 2: 3376-3394. https://doi.org/10.3390/ijms14023376