Article

Comparative Proteomic Analysis of Differential Responses of Pinus massoniana and Taxus wallichiana var. mairei to Simulated Acid Rain

1
Key Laboratory for Subtropical Wetland Ecosystem Research of MOE, College of the Environment and Ecology, Xiamen University, Xiamen 361005, Fujian, China
2
Department of Biology, Huaiyin Normal University, Huaian 223300, Jiangsu, China
3
College of Life and Environmental Sciences, Hangzhou Normal University, Hangzhou 310036, Zhejiang, China
*
Author to whom correspondence should be addressed.
These authors contributed equally to this work.
Int. J. Mol. Sci. 2014, 15(3), 4333-4355; https://doi.org/10.3390/ijms15034333
Submission received: 4 January 2014 / Revised: 5 February 2014 / Accepted: 17 February 2014 / Published: 12 March 2014
(This article belongs to the Section Biochemistry)

Abstract

:
Acid rain (AR), a serious environmental issue, severely affects plant growth and development. As the gymnosperms of conifer woody plants, Pinus massoniana (AR-sensitive) and Taxus wallichiana var. mairei (AR-resistant) are widely distributed in southern China. Under AR stress, significant necrosis and collapsed lesions were found in P. massoniana needles with remarkable yellowing and wilting tips, whereas T. wallichiana var. mairei did not exhibit chlorosis and visible damage. Due to the activation of a large number of stress-related genes and the synthesis of various functional proteins to counteract AR stress, it is important to study the differences in AR-tolerance mechanisms by comparative proteomic analysis of tolerant and sensitive species. This study revealed a total of 65 and 26 differentially expressed proteins that were identified in P. massoniana and T. wallichiana var. mairei, respectively. Among them, proteins involved in metabolism, photosynthesis, signal transduction and transcription were drastically down-regulated in P. massoniana, whereas most of the proteins participating in metabolism, cell structure, photosynthesis and transcription were increased in T. wallichiana var. mairei. These results suggest the distinct patterns of protein expression in the two woody species in response to AR, allowing a deeper understanding of diversity on AR tolerance in forest tree species.

1. Introduction

Constant increase of human activities in recent decades results in some regions suffering from environmental pollution, such as acid rain (AR), especially in the fast developing regions of southern China [1,2]. To date, AR continues to threaten many sensitive ecosystems and cause detrimental impacts on local vegetation [3,4]. For instance, AR can induce necrosis and chlorosis in leaves of AR-sensitive plants and even structural abnormalities through damaging the cuticles of the epidermis and leaf mesophyll cells [5,6]. In addition, AR can also disturb the normal metabolism of plants and cause a decrease in photosynthesis, depression in plant growth and development, and even the death of plants in some extreme cases [7].
Pinus massoniana, a widely distributed coniferous species in southern China, has suffered seriously from AR in recent decades [8]. Severe defoliation of P. massoniana in several AR-affected regions of southern China was revealed in previous studies and the growth was significantly reduced under AR treatment [9,10]. Taxus wallichiana var. mairei, another conifer tree species, is distributed in adjacent regions that are also suffering from serious AR [11]. Physiological and biochemical changes and growth responses to AR have been reported in T. wallichiana var. mairei. The results suggest that T. wallichiana var. mairei is a resistant species to AR stress [12,13]; however the biochemical and physiological features and molecular mechanisms of such a distinction remains poorly understood. Analyzing protein expression changes under AR stress is a powerful way to reveal the molecular mechanism through a comparison between AR-sensitive and AR-resistant species.
Recently, by using a 2-DE-based proteomic approach, a set of proteins associated with: primary metabolism, secondary metabolism, protein stability and defense, photosynthesis and energy metabolism, etc., have been successfully identified and characterized, and may play important roles in mediating plant responses to AR for P. massoniana and Arabidopsis [1416]. In the present study, a 2-DE and MALDI-TOF MS study was performed to identify the global changes in protein expression under AR treatment in P. massoniana and T. wallichiana var. mairei, which respectively represent AR-sensitive and AR-tolerant species. Furthermore, we also characterized the AR-responsive proteins, analyzed the functions of these differentially expressed proteins, and established the different responsive networks of metabolism in P. massoniana and T. wallichiana var. mairei under AR stress.
The results of this study, providing different evidence from that evaluating the effects of AR stress on single tree species, could further enhance the current understanding of the protein changes underlying AR stress-related cellular and physiological responses between AR-sensitive and AR-resistant woody plants, and further dissect the different tolerance mechanisms of forest trees to AR stress.

2. Results and Discussion

2.1. Results

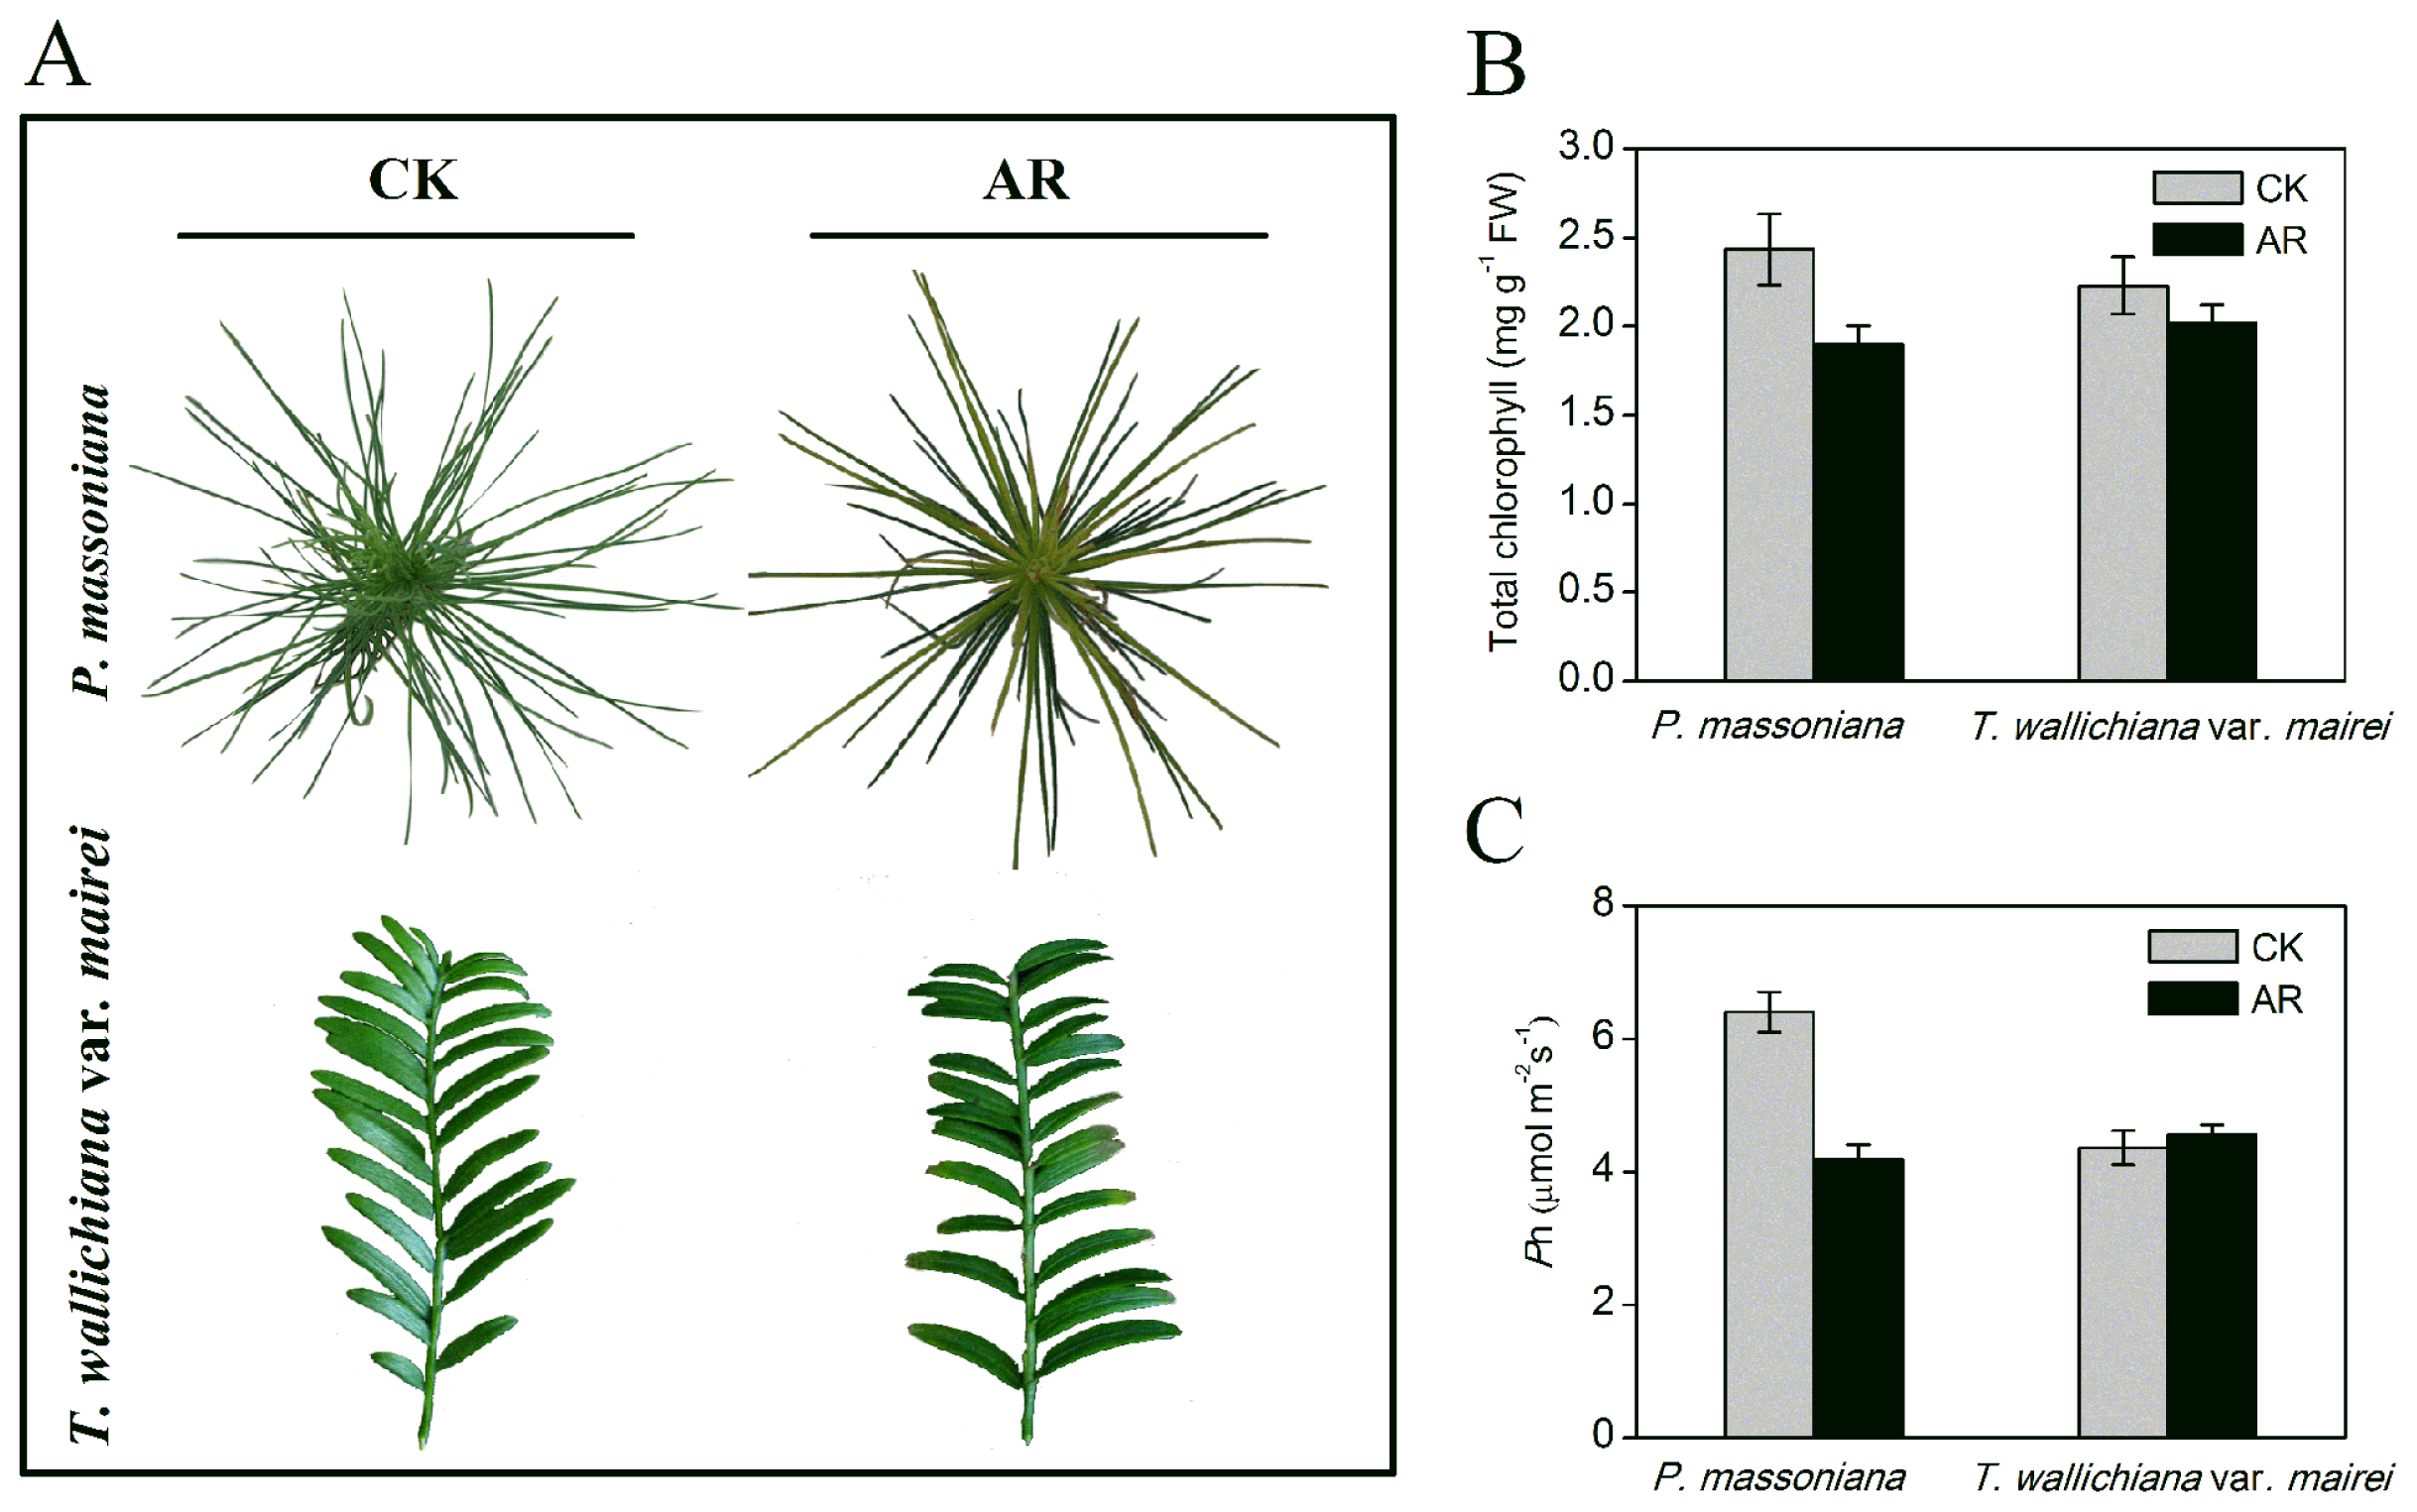
2.1.1. Phenotype and Physiological Changes in P. massoniana and T. wallichiana var. mairei under AR

In order to study the responses of woody plant to AR stress, P. massoniana and T. wallichiana var. mairei, an AR-sensitive and AR-tolerant tree species respectively, were treated with simulated AR (pH 3.0) for two months. First we investigated the detrimental phenotypical and physiological changes of these two species under AR stress. Morphological changes of both species are shown in Figure 1A, the chlorophyll content and net photosynthetic rate (Pn) of the saplings were also measured (Figure 1B,C). After two months of AR treatment, the significant necrosis and collapsed lesions were found in needles with remarkable yellowing and wilting tips in P. massoniana, whereas T. wallichiana var. mairei did not exhibit chlorosis and visible damage (Figure 1A). As shown in Figure 1B,C, the chlorophyll content and Pn were significantly decreased in P. massoniana under simulated AR treatment. Similar results were observed in AR-treated Arabidopsis and woody plants [10,14,17]. On the contrary, no significant changes in the chlorophyll content and Pn were found in T. wallichiana var. mairei (Figure 1B,C) under simulated AR, indicating that T. wallichiana var. mairei is more resistant than P. massoniana in response to AR stress.

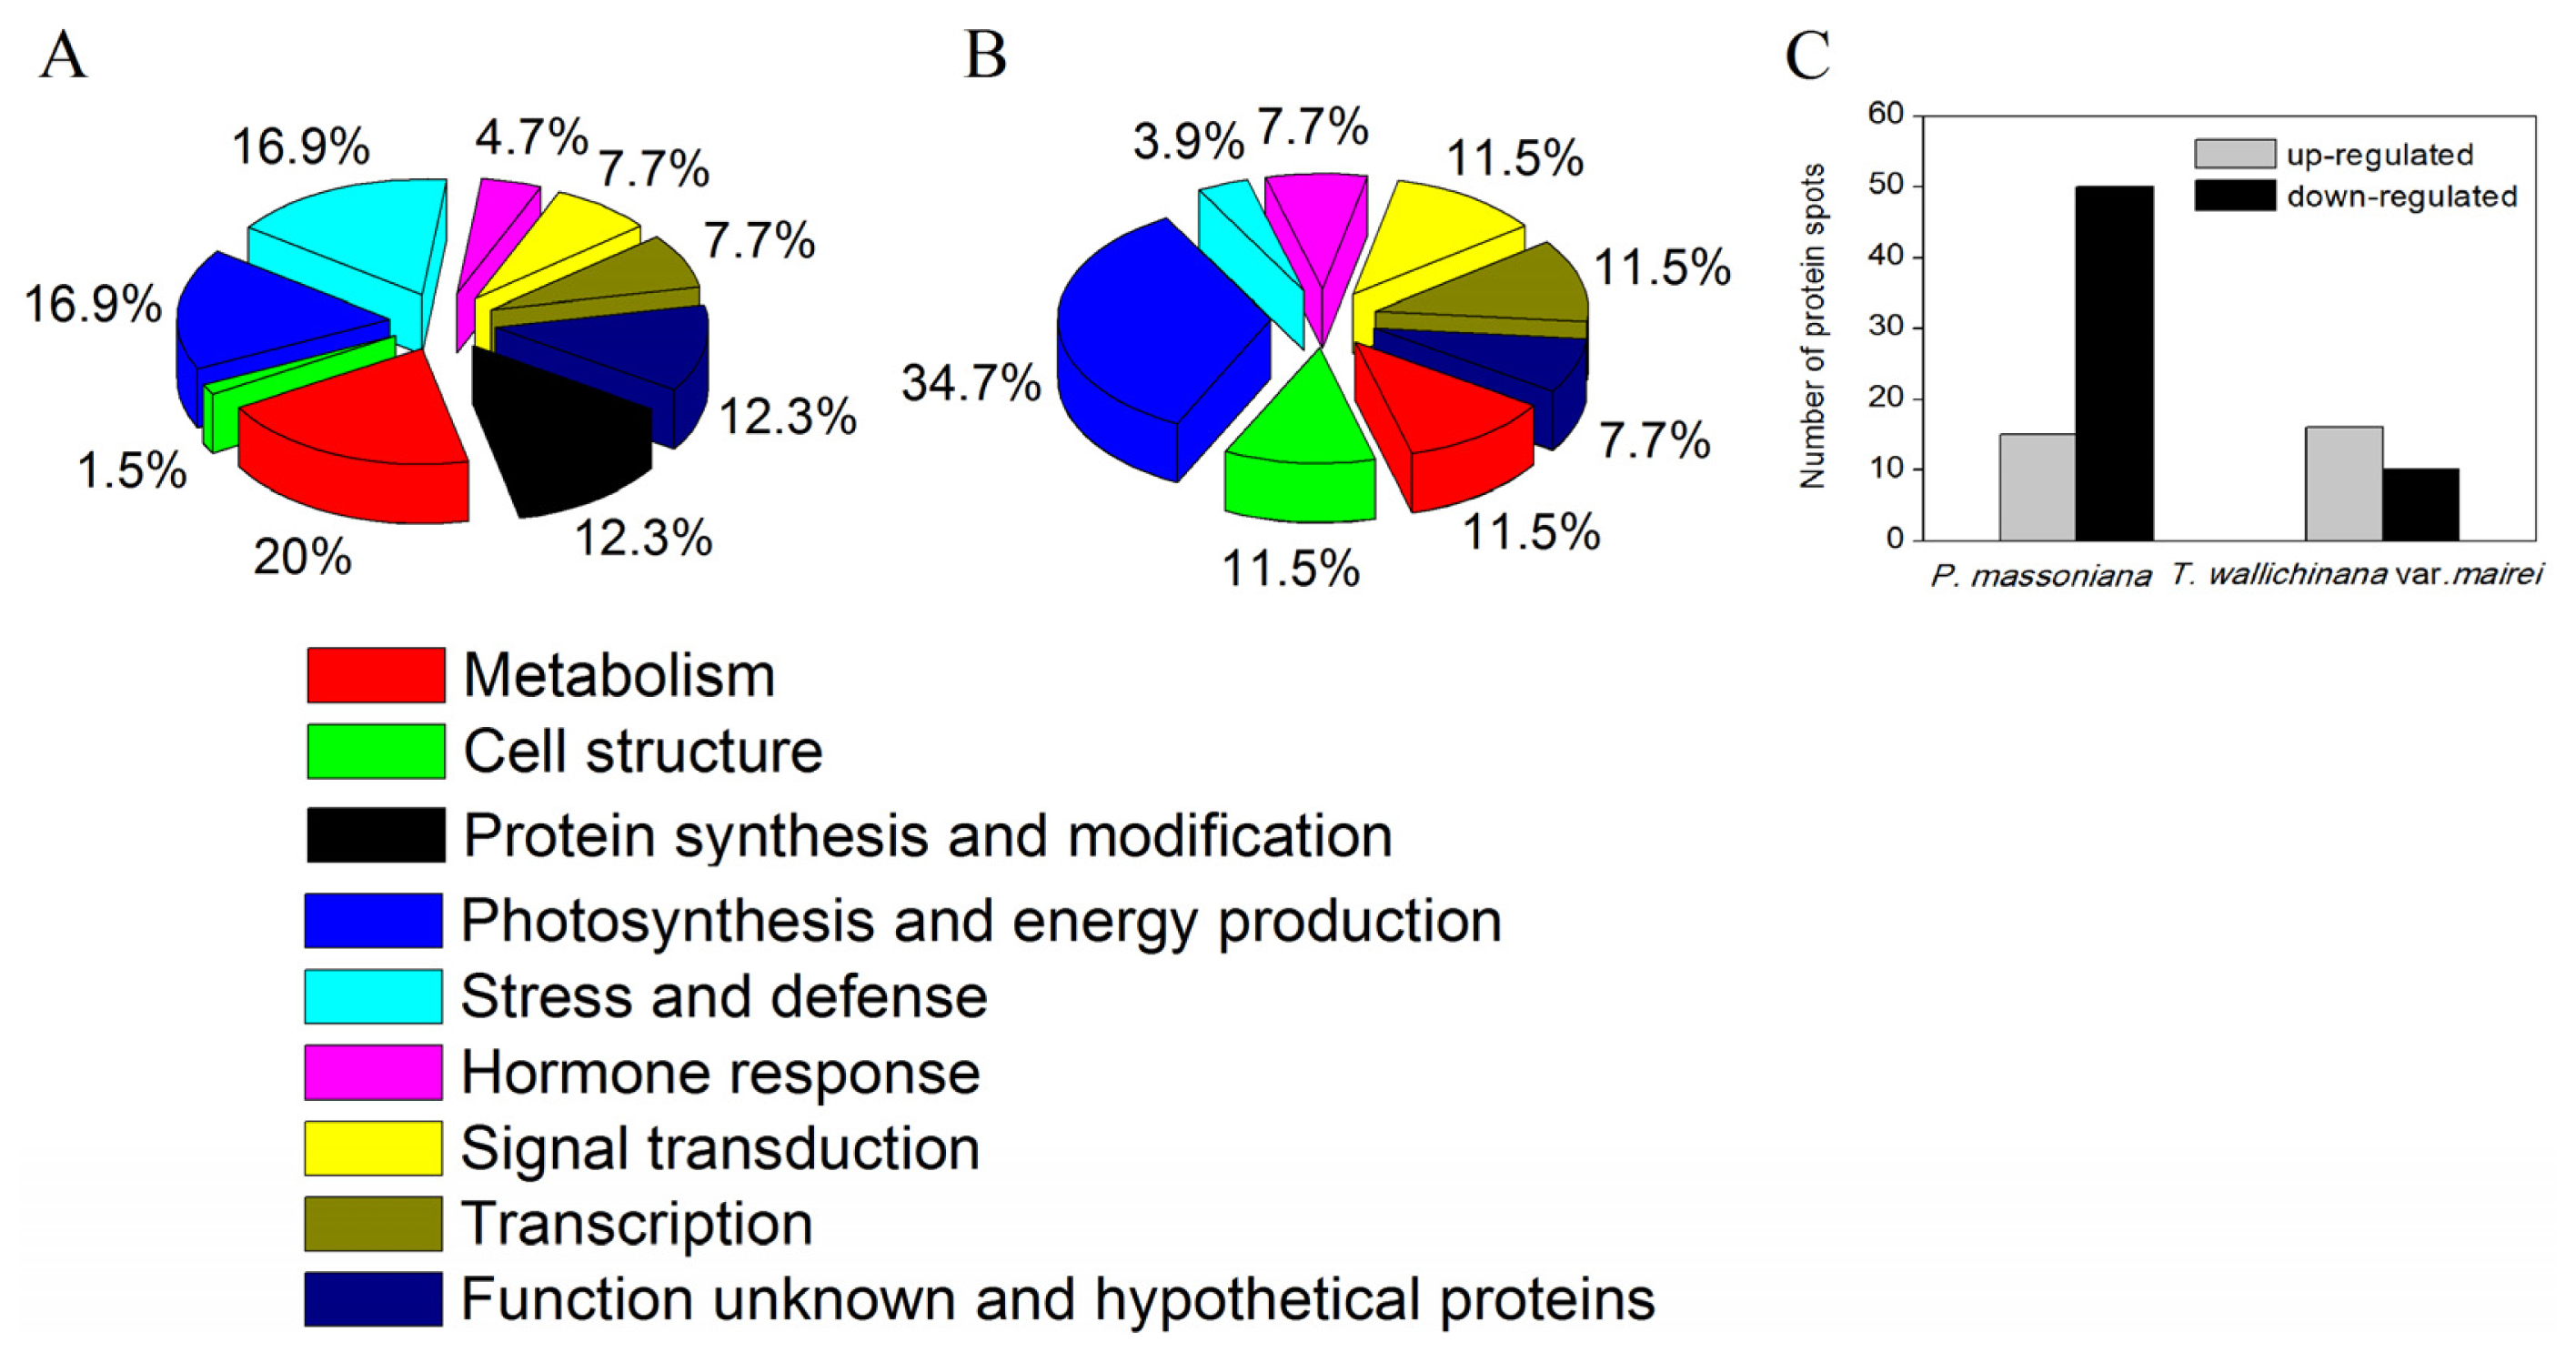
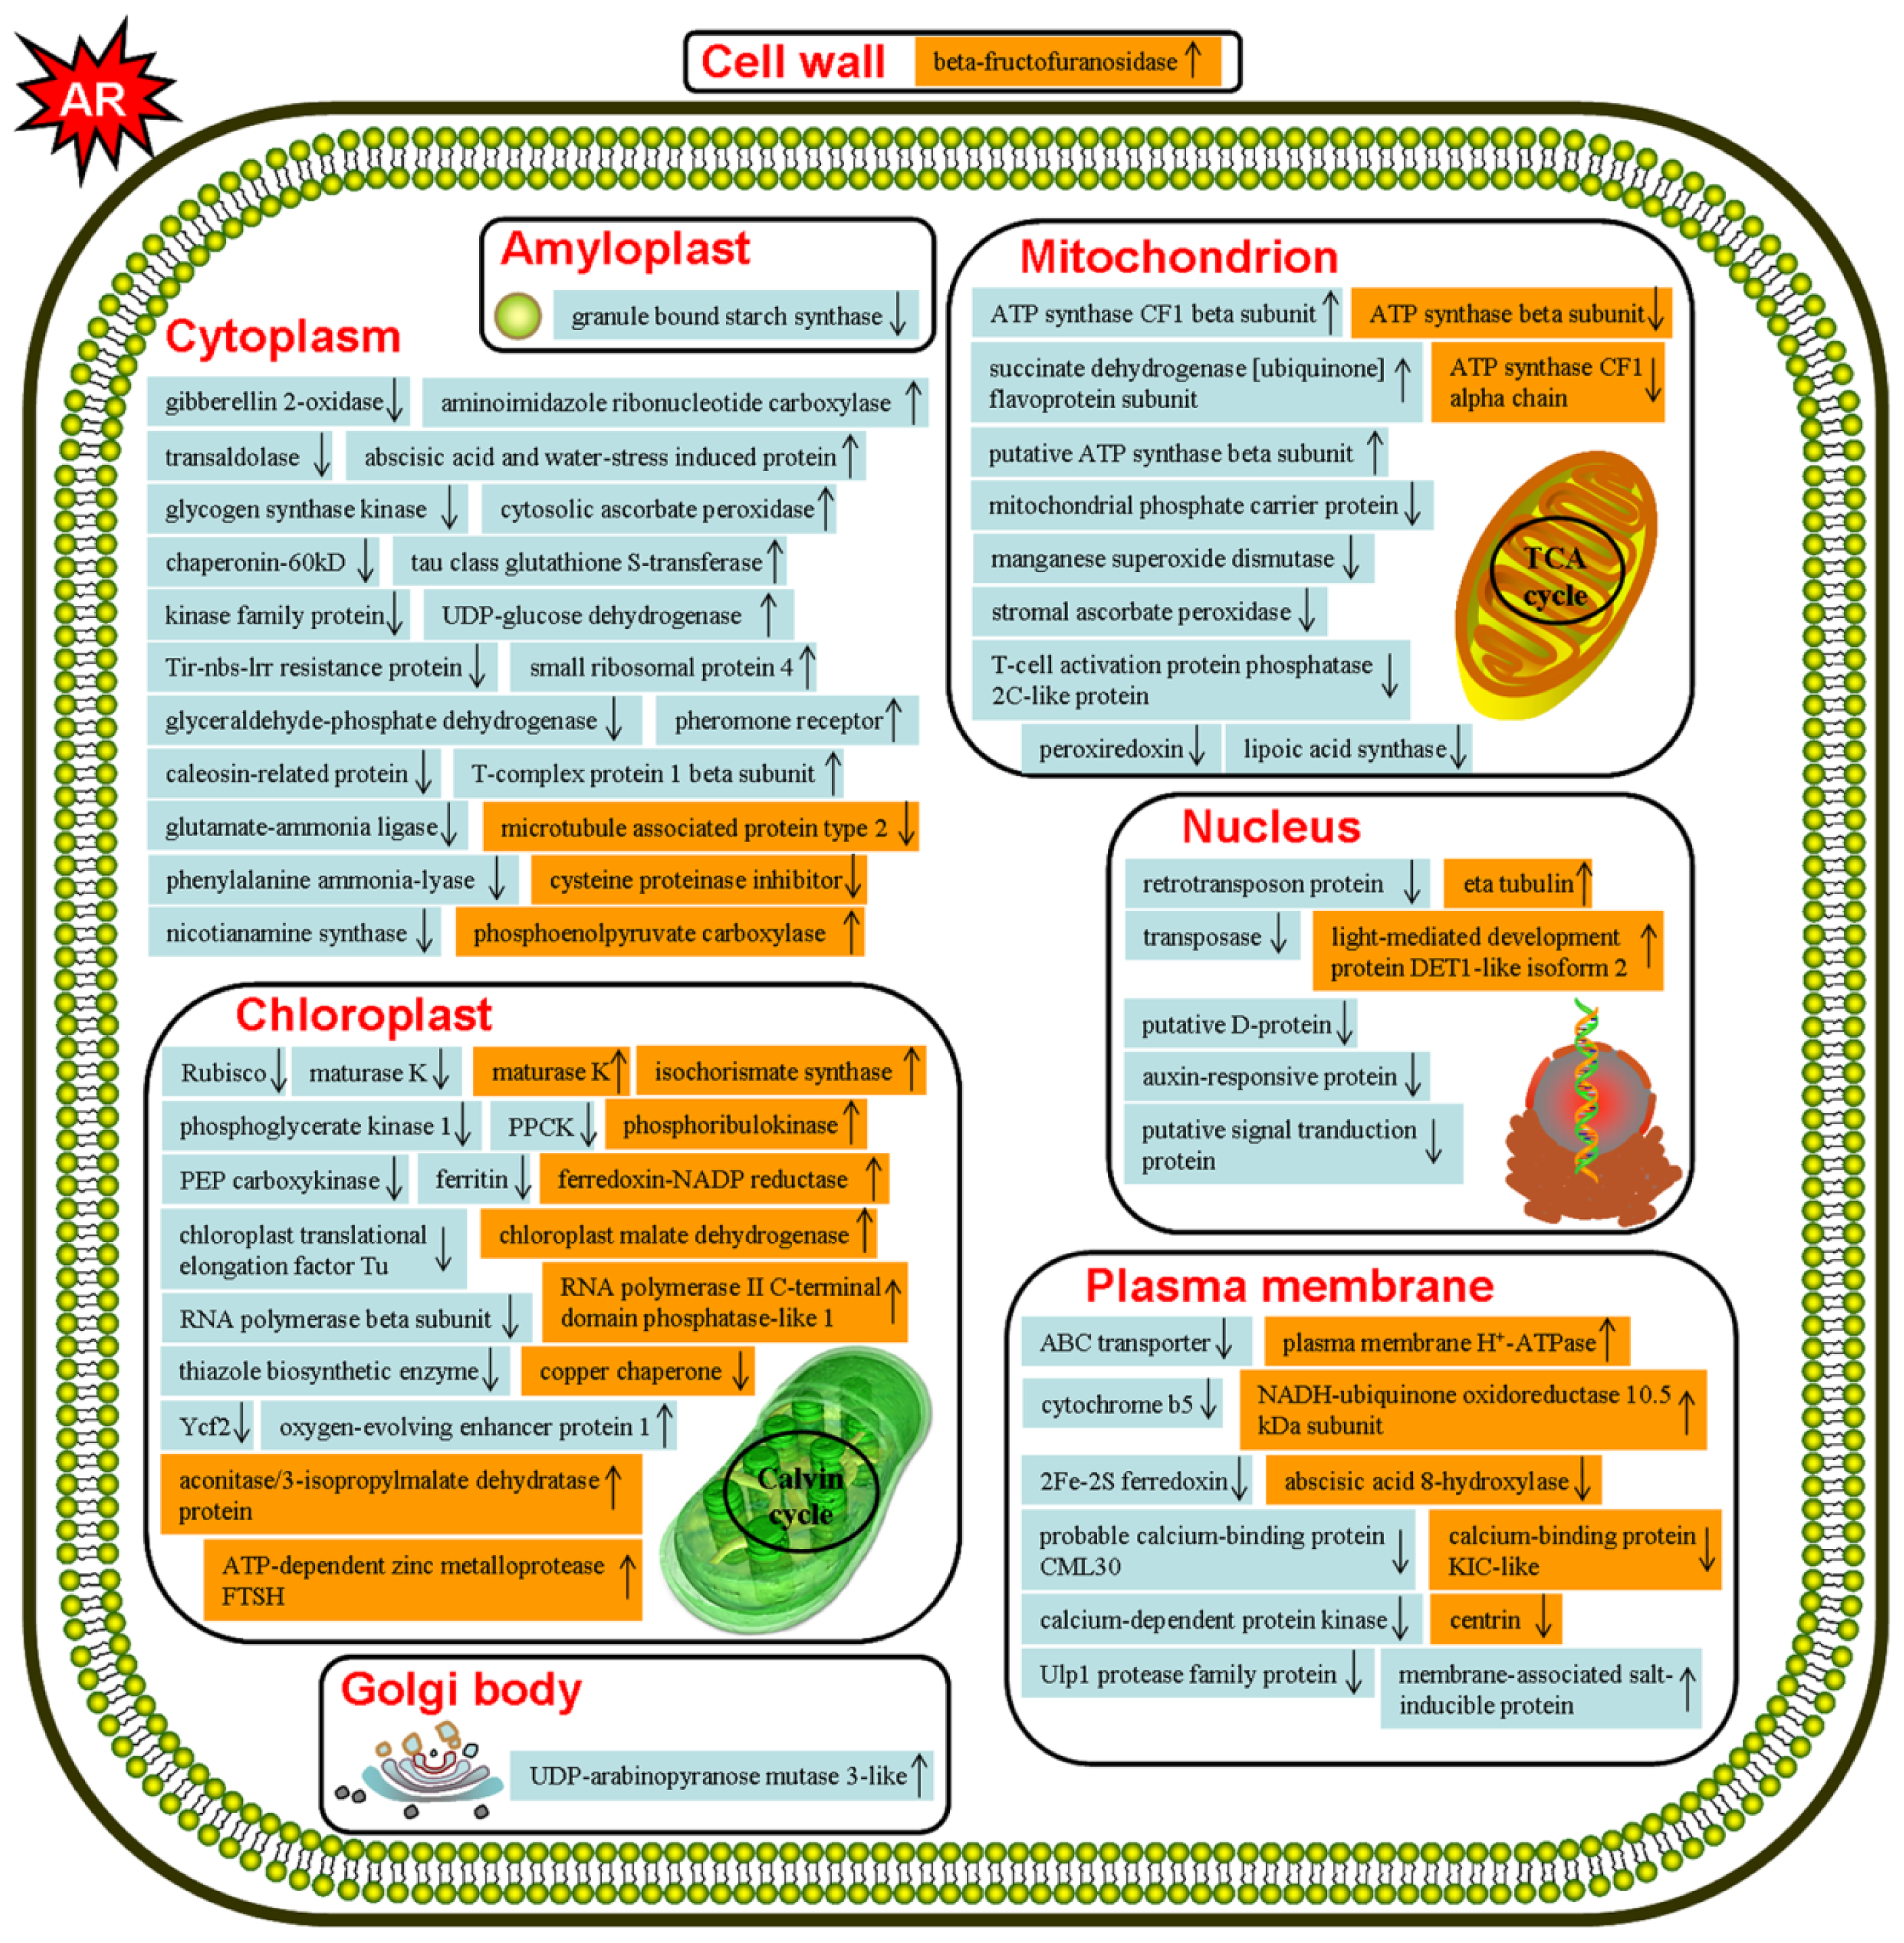
2.1.2. Identification and Functional Classification of AR-Responsive Proteins in P. massoniana and T. wallichiana var. mairei
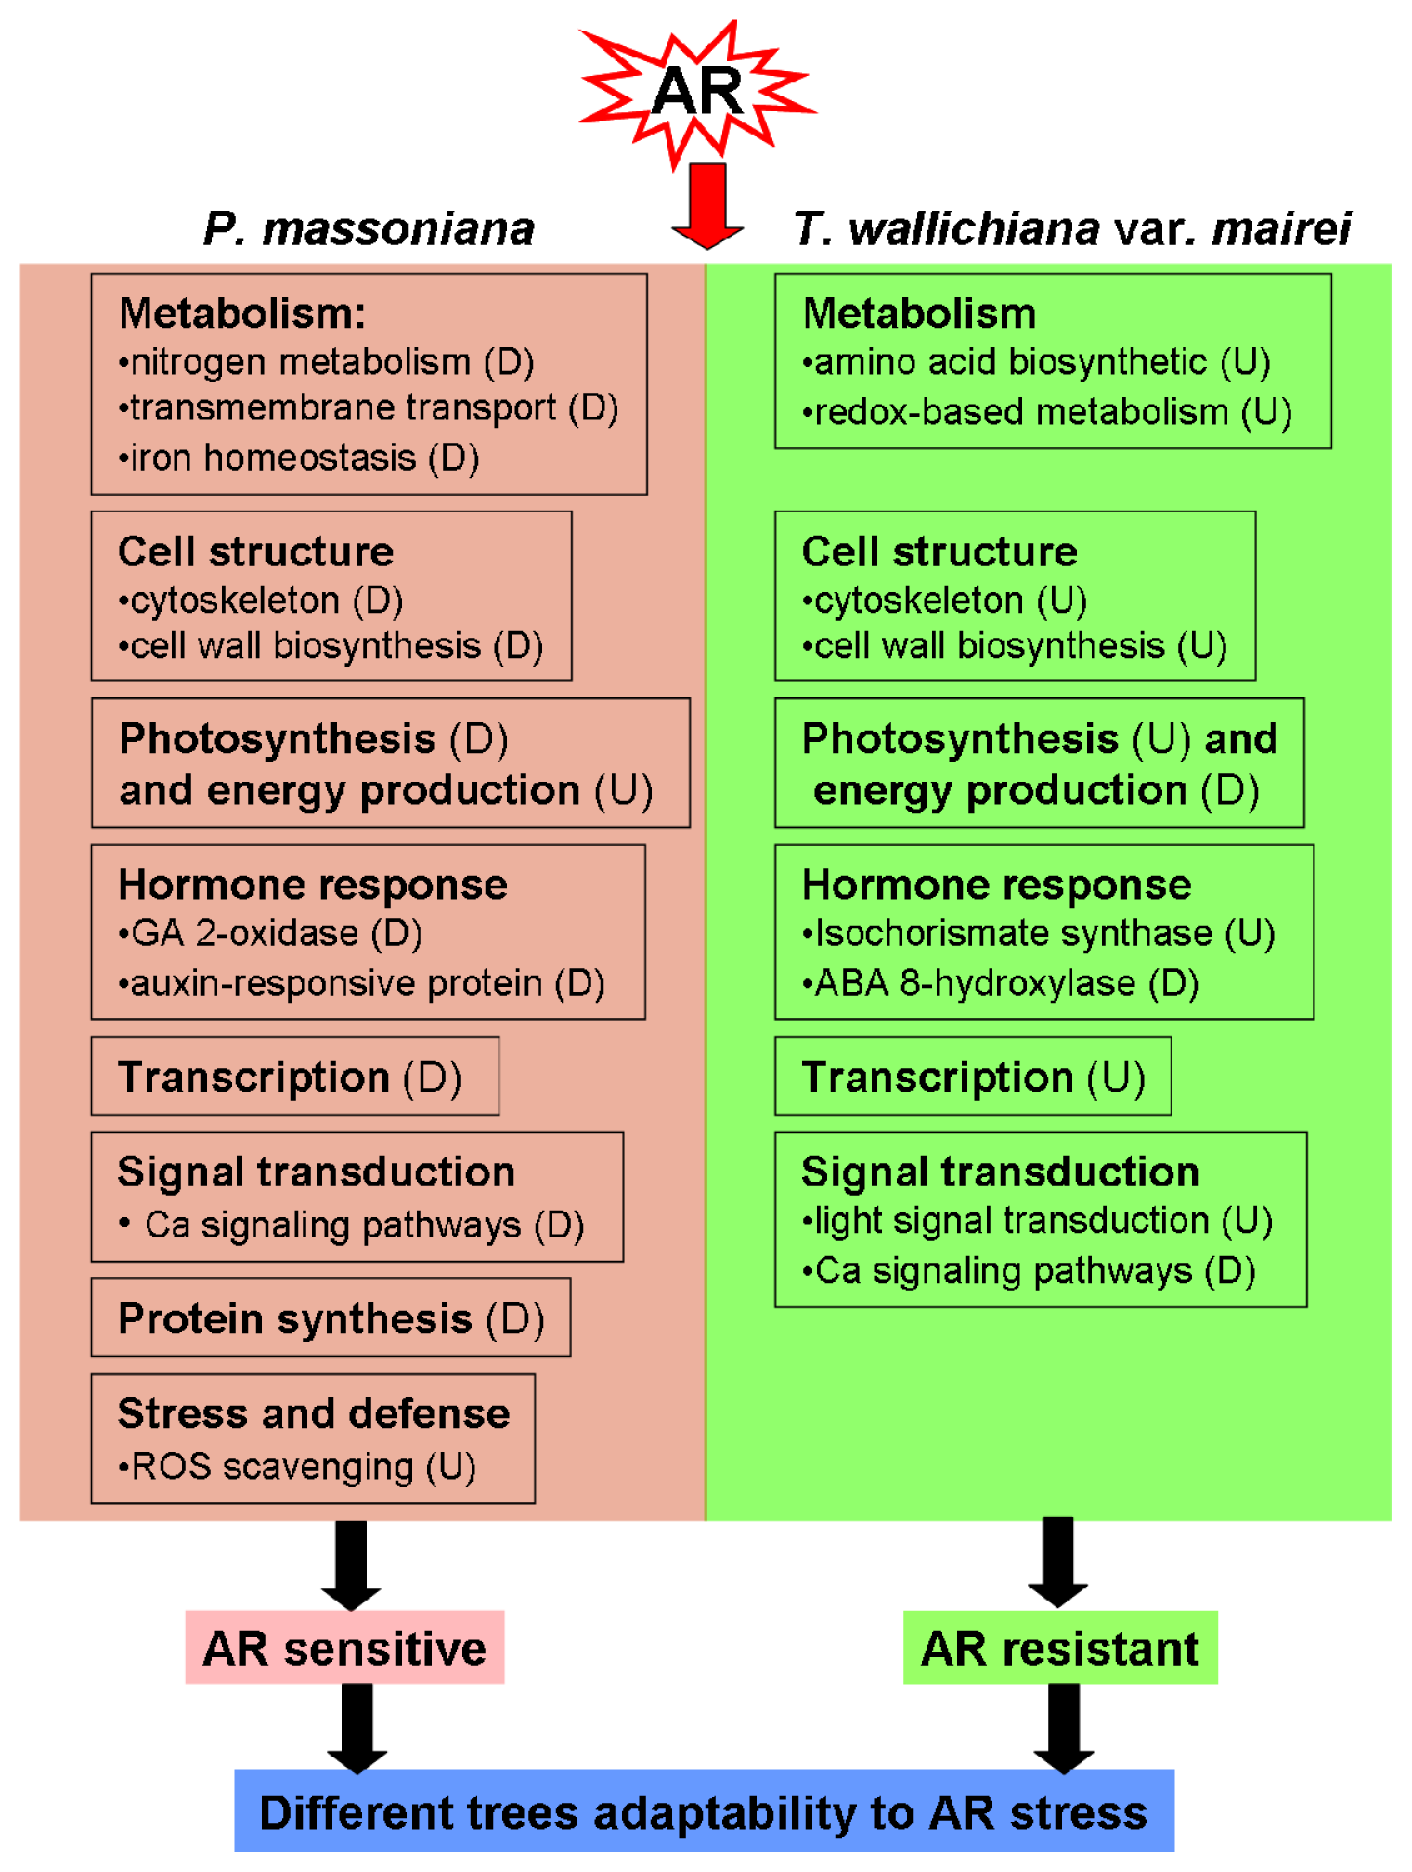
To further explore the proteome changes in P. massoniana and T. wallichiana var. mairei leaves under AR treatment, 2-DE was performed in this study. A total of 73 protein spots from P. massoniana gels and 31 protein spots from T. wallichiana var. maire gels showed significant changes. Tables S1 and S2 showed the details of identified proteins. Out of these spots, a total of 65 and 26 proteins were identified by mass spectrometry in P. massoniana and T. wallichiana var. mairei, respectively. Those with expression abundance changed more than 2-fold among three different repetitions, were identified as the differentially expressed proteins after AR treatment (Figure 2). Close-up views of several protein spots are shown in Figure 2B,D.
The identified proteins were divided into seven groups based on their biological functions in both P. massoniana and T. wallichiana var. mairei (Figure 3A,B). In P. massoniana, the largest group was metabolism (20%), the following groups were photosynthesis and energy production (16.9%), stress and defense (16.9%), protein synthesis and modification (12.3%), signal transduction (7.7%), transcription (7.7%), hormone response (4.7%), cell structure (1.5%), and function unknown and hypothetical proteins (12.3%) (Figure 3A). In T. wallichiana var. mairei, the identified proteins were involved in photosynthesis and energy production (34.7%), metabolism (11.5%), cell structure (11.5%), signal transduction (11.5%), transcription (11.5%), stress and defense (3.9%), hormone response (7.7%), and function unknown and hypothetical proteins (7.7%) (Figure 3B). This result suggests that proteins involved in metabolism, cell structure, protein synthesis-related proteins, stress response, signal transduction and transcription play an important role in AR tolerance.
As shown in Figure 3C, the number of differentially expressed protein spots was more than double in P. massoniana compared to those in T. wallichiana var. mairei under AR stress. In AR-treated P. massoniana, 15 proteins were increased and 50 proteins were decreased (Figure 3C). Interestingly, 16 proteins were increased and only 10 proteins were decreased in AR-treated T. wallichiana var. mairei (Figure 3C). Most members of protein families were expressed in cytoplasm, chloroplasts, mitochondria and plasma membrane (Figure 4). After AR treatment, some proteins in T. wallichiana var. mairei were found to exhibit different expression patterns compared to P. massoniana, suggesting that tolerant plants can equip themselves better to respond to AR stress by provoking related proteins expression.

2.2. Discussion

2.2.1. Metabolism Related Proteins

Environmental stresses severely affect the metabolism of plants [15]. Thirteen metabolism-related proteins were exclusively affected by AR stress, with eleven down-regulated and two up-regulated in P. massoniana (Table 1) in our study. As observed in T. wallichiana var. mairei, only four up-regulated and two down-regulated proteins involved in metabolism were identified with altered abundance at least two-fold in response to AR treatment (Table 2). Nitrogen is an essential building block of nucleic acids and proteins, and nitrate assimilation greatly contributes to plant primary productivity [18]. Previous studies showed that salinity and water deficit strongly affected nitrogen metabolism and uptake of nitrate in wheat and rice [19,20]. In our study, glutamate-ammonia ligase, a key enzyme for nitrogen metabolism, belonging to the glutamine synthetase family was identified [18]. Kong et al. reported that low pH could potentially decrease the efficiency of nitrogen availability in P. massoniana [8]. Consistent with previous results, the abundance of glutamate-ammonia ligase (spot 28, Table 1) was decreased in P. massoniana under AR stress indicating that AR affected the primary metabolism of nitrogen in P. massoniana, whereas no nitrogen metabolism-related proteins have been identified in T. wallichiana var. mairei.
Donation of electrons by ferredoxin (Fd) has been demonstrated in many other plastid enzymes, which is essential for multiple cellular processes, including nitrogen and sulfur assimilation, amino acid and fatty acid synthesis [21,22]. In this study, the abundance of 2Fe-2S ferredoxin (spot 48, Table 1) was decreased in AR-treated P. massoniana, indicating that nitrogen metabolism again, as well as sulfur metabolism, may be affected by AR treatment. Ferredoxin (flavodoxin)-NADP(H) reductases (FNRs) are ubiquitous flavoenzymes that deliver NADPH or low potential one-electron donors (ferredoxin) to redox-based metabolisms in plastids and mitochondria [23]. It is noteworthy that the overexpression of FNR can increase tolerance to oxidative stress in transgenic tobacco plants [24]. The up-regulation of FNR (spot 9, Table 2) in response to AR stress in T. wallichiana var. mairei reflects the role of this protein in basal metabolism under stress conditions. ABC transporters constitute one of the largest protein families with diverse functions in membrane transport [25]. Compared with control treatment, the abundance of ABC transporter (spot 39, Table 1) was decreased in P. massoniana under AR treatment. Earlier studies have detected a decrease in ABC transporter substrate binding protein in response to copper stress in Cannabis sativa roots, suggesting that the ABC transporter may play a very important role in the tolerance response of plant to environmental stresses [26]. Furthermore, the importance of ABC transporters has been reported for the integration of mitochondria in plant cellular iron homeostasis [25]. In plants, ferritin is an essential regulator of iron homeostasis, and the gene expression of ferritin is modulated by many environmental factors including drought and cold [27]. In our study, the abundance of ferritin (spot 57, Table 1) was decreased in P. massoniana under AR stress. The down-regulation of the protein related to transmembrane transport of molecules (e.g., the ABC transporter) and down-regulation of metal ion related proteins, is propitious for re-establishing cellular homeostasis in AR-treated P. massoniana. Based on the above results, we speculate that AR stress might affect more metabolic processes in P. massoniana than those in T. wallichiana var. mairei.

2.2.2. Cell Structure Related Proteins

The cytoskeleton is rapidly remodeled by various endogenous and external stimuli. We found that microtubule associated protein type 2 (spot 23, Table 2) decreased in abundance following AR treatment, while eta tubulin (spot 25, Table 2) was increased in T. wallichiana var. mairei under AR stress. Previous studies reported that the transverse orientation of cortical microtubule arrays in tobacco BY-2 cells was remodelled to a more random arrangement and the tubulin a-6 chain was induced in Arabidopsis roots after NaCl treatment [28]. Our results support that the accumulation of microtubule associated protein, rather than eta tubulin, could play a crucial role in the resistance to AR stress in T. wallichiana var. mairei. These universal cytoskeletal proteins may call into question their stronger tolerance in T. wallichiana var. mairei in response to AR than that in P. massoniana. Cell wall proteins are essential constituents of the plant cell wall, which are involved in modifications of cell wall components and structure, and signaling and interactions with plasma membrane proteins. Beta-fructofuranosidase is an enzyme involved in cell wall biosynthesis. In this study, the abundance of beta-fructofuranosidase (spot 14, Table 2) was increased in T. wallichiana var. mairei under AR treatment, indicating the stronger capacity of T. wallichiana var. mairei to recover from AR stress. In addition, UDP-glucose dehydrogenase, which is involved in cell wall pectin metabolic process, greatly contributes to AR-induced cell wall rigidification and physical barrier formation. The abundance of UDP-glucose dehydrogenase (spot 62, Table 1) was down-regulated in P. massoniana under AR treatment, which may result in perturbation of cell wall structure and more seriously damaged phenotypes in AR-treated P. massoniana.

2.2.3. Protein Synthesis and Modification Related Proteins

It is not surprising that AR stress also damaged the homeostasis of protein metabolism between biosynthesis and degradation. Singh et al. found that chloroplast translation elongation factor (EF-Tu) could play an important role in plant adaptation to environmental stresses in addition to its role in peptide elongation [29]. Indeed, our results provided additional evidence that a chloroplast translational elongation factor Tu (spot 31, Table 1) was down-regulated in P. massoniana after AR treatment, indicating that protein synthesizing machinery plays an important role in AR adaptation in this plant. Glycogen synthase kinase 3 (GSK-3) was originally identified as a regulator of glycogen synthesis in mammals. In plants, GSKs are reported to be involved in diverse important processes including hormone signaling, development, pathogenic stimuli and stress responses [30]. In this study, a glycogen synthase kinase (spot 45, Table 1) was down-regulated in P. massoniana under AR treatment. Indeed, our result provides extra evidence that GSKs play an important regulatory function under AR stress. Moreover, it is known that chaperonin is down-regulated under oxidative stress in rice [31]. Consistent with previous results, the decreased abundance of chaperonin-60kD (spot 49, Table 1) was observed in AR-treated P. massoniana. This finding suggests that chaperonin may be a general AR stress response element in P. massoniana. As a whole, these results suggest that AR treatment affected the biosynthesis and refolding of proteins and led to protein degradation, which is more pronounced in P. massoniana than in T. wallichiana var. mairei.

2.2.4. Photosynthesis and Energy Production Related Proteins

Photosynthesis is a key plant process affected by many environmental stresses. Physiological analysis showed the attenuation of photosynthesis in AR-stressed P. massoniana leaves, and similar patterns were also observed for most photosynthesis-related proteins (ribulose-1,5-bisphosphate carboxylase/oxygenase large subunit (Rubisco) (spots 44, 50, 55 and 60, Table 1), phosphoglycerate kinase (spot 53, Table 1)), whose abundances were deceased in AR-treated P. massoniana. Ohta et al. found that Rubisco was decreased in Synechocystis sp. PCC 6803 under acid condition [32]. Consistent with our previous results, AR could lead to a remarkable decrease in the efficiency of photosynthesis in plants, and proteomic studies demonstrated that Rubisco was decreased under AR stress in Arabidopsis [10,15]. On the other hand, it has been reported that the transcription of Calvin cycle enzymes were decreased in drought- and salt-stressed barley [33]. In P. massoniana, phosphoglycerate kinase (spot 53, Table 1) was found to be down-regulated under AR treatment. These results suggest that the photosynthesis apparatus is susceptible to AR stress, which may be one of the major reasons for decreased chlorophyll content and photosynthesis under AR stress in P. massoniana (Figure 1B,C). On the contrary, no significant change in AR-stressed T. wallichiana var. mairei leaves (Figure 1B,C), photosynthesis-related proteins including NADH-ubiquinone oxidoreductase 10.5 kDa subunit (spot 1, Table 2), phosphoribulokinase (spot 10, Table 2) and ATP-dependent zinc metalloprotease FTSH (spot 11, Table 2) were increased in T. wallichiana var. mairei under AR treatment. For example, phosphoribulokinase that catalyzes the final step in the regeneration of ribulose-1,5-bisphosphate in the Calvin cycle, was up-regulated by AR in T. wallichiana var. mairei in this study, which was different from what was found in P. massoniana. On the other hand, the expression of ATP-dependent zinc metalloprotease FTSH (spot 11, Table 2), a membrane bound protein located in thylakoids involved in the removal of a damaged D1 protein from PSII in plants, was also up-regulated in AR-treated T. wallichiana var. mairei. These findings indicated that the mechanisms of photosynthetic metabolism under AR stress are different between P. massoniana and T. wallichiana var. mairei. Photosynthesis apparatus is susceptible to AR stress, which may be one of the major reasons for decreased chlorophyll content and photosynthesis under AR stress in P. massoniana. On the contrary, photosynthesis-related proteins were increased in T. wallichiana var. mairei under AR treatment, which may compensate the impaired photosynthesis apparatus by AR. Thus, no significant changes in the chlorophyll content and Pn were found in T. wallichiana var. mairei under simulated AR treatment, indicating that T. wallichiana var. mairei is more resistant than P. massoniana in response to AR stress. We presumed that T. wallichiana var. mairei is an AR-tolerant species with a high capacity for regulating related proteins to enhance photosynthetic metabolism, and inhibit the impaired effect on photosynthesis by AR stress.
Different from photosynthesis, the accumulation of some energy production and conversion related proteins were increased in P. massoniana under AR treatment. Gao et al. reported that ATPase beta subunit and ATPase CF1 beta chain were up-regulated in leaves of wheat subjected to salt treatment [34]. Other evidence also indicates that sufficient ATP is necessary for plant growth, development and response to stress [28]. In P. massoniana, ATP synthase CF1 beta subunit (spot 3, Table 1), putative ATP synthase beta subunit (spot 17, Table 1) and succinate dehydrogenase (ubiquinone) flavoprotein subunit (spot 65, Table 1) were found to be up-regulated by AR stress in our study. These results indicated that more energy is required for reinforcing P. massoniana resistance to AR stress. On the contrary, energy conversion-related proteins including ATP synthase beta subunit (spots 3 and 5, Table 2) and ATP synthase CF1 alpha chain (spot 15, Table 2) showed lower expression in response to AR stress in T. wallichiana var. mairei, which suggests different mechanisms of energy production in T. wallichiana var. mairei exposed to AR treatment.

2.2.5. Stress and Hormone Response Related Proteins

Reactive oxygen species (ROS), which play a critical role in plant cellular signaling and stress responses, are readily produced by abiotic stresses [35]. Plants can regulate the ROS level through complex mechanisms such as scavenging ROS with ascorbate peroxidase (APX), and glutathione S-transferase (GST). In this study, both APX and GST (spots 10, 13 and 14, Table 1) were increased in abundance in AR-treated P. massoniana. In addition, we found that several other enzymes associated with stress and defense were increased in abundance in P. massoniana, including membrane-associated salt-inducible protein (spot 51, Table 1). Thus, the up-regulated expression of these proteins implies that the antioxidative defense system was provoked in AR-treated P. massoniana seedlings, and such a consistent induction is likely a consequence of antioxidative reactions in plants under AR stress. We speculate that P. massoniana needs to provoke more defense and stress related proteins against AR stress, and does not have similar protein accumulation such as that found in T. wallichiana var. mairei (AR-resistant). These results, together with the complex expression patterns of stress related proteins in both woody plants provide new insights into the relationships between the impacts of AR stress and defense and stress responses.
Plant hormones are not only involved in plant growth and development, but also important in response to abiotic and biotic stresses. Recent studies suggest that environmental stimuli can regulate endogenous gibberellin (GA) level through the changes of enzymes involved in GA biosynthesis and inactivation [36]. In this study, the abundance of gibberellin 2-oxidase (spot 40, Table 1) decreased in P. massoniana under AR stress, which is consistent with our previous results that AR stress led to a decrease in the abundance of gibberellin-responsive protein in Arabidopsis [15], suggesting the important roles of gibberellin 2-oxidase and GA in AR tolerance in P. massoniana. Moreover, the abundance of auxin-responsive protein (spot 47 Table 1) decreased in AR-treated P. massoniana, suggesting that the auxin pathway may play a role in mediating AR-sensitive woody plants responses to AR stress. Isochorismate synthase (ICS) is required to synthesize salicylic acid for plant defense [37]. Furthermore, it has been reported that the salicylic acid signaling pathway is implicated in the modulation of plant responses to AR stress [7]. Our results showed that the abundance of ICS (spot 4, Table 2) was up-regulated only in T. wallichiana var. mairei. Its presence may provide protection against AR stress and possibly endow T. wallichiana var. mairei with greater AR tolerance.

2.2.6. Signal Transduction Related Proteins

In this study, three out of four signal transduction-related proteins, including putative signal tranduction protein (spot 25, Table 1), T-cell activation protein phosphatase 2C-like protein (spot 42, Table 1) and calcium-dependent protein kinase (spot 63, Table 1) showed a down-regulated expression in P. massoniana under simulated AR, whereas the abundance of light-mediated development protein DET1-like isoform 2 (spot 2, Table 2) was increased in T. wallichiana var. mairei under AR stress. Free cytosolic Ca2+ is a universal second messenger in plants, acting as a mediator of stimulus–response coupling in the regulation of growth, development and responses to environmental stresses [38]. Modulation of intracellular Ca2+ levels is partly regulated by calcium related proteins. In the present study, the expression of caleosin-related protein (spot 8, Table 1) was significantly down-regulated in P. massoniana under AR stress, suggesting that caleosin-related protein plays an important role in response to AR which is consistent with the previous results in Arabidopsis [39]. Previous studies showed that AR impacts on Ca nutrition, which causes alteration in membrane-associated Ca, membrane destabilization and foliar injury of red spruce, thus affecting forest health [40]. In this study, AR also led to the decreased abundance of a probable calcium-binding protein CML30 (spot 52, Table 1), calcium-binding protein CML19 (spot 8, Table 2) and calcium-binding protein KIC-like (spot 17, Table 2) in P. massoniana and T. wallichiana var. mairei under AR stress. This change indicates that Ca-binding proteins have a cryptic correlation with AR tolerance, and their roles need to be further analyzed in woody plants. Furthermore, calcium-dependent protein kinases (CDPKs) are implicated as major primary Ca2+ sensors in plants, and CDPK-controlled signaling pathways regulate specific responses to biotic and abiotic stresses. Here, the abundances of CDPK (spot 63, Table 1) was also decreased in AR-treated P. massoniana, suggesting that the modulation of Ca signaling regulators might reduce AR tolerance of P. massoniana. These findings indicate that Ca-dependent signal transduction could be an important signal pathway under AR stress in P. massoniana and T. wallichiana var. mairei.

2.2.7. Transcription Related Proteins

Transcription is the first step in gene expression and a major point of regulation; transcriptional control on the expression of stress responsive genes is crucial for plant response to various abiotic and biotic stresses [28]. Five proteins including maturase K (spot 15), RNA polymerase beta subunit (spots 22, 23), transposase (spot 26) and retrotransposon protein (spot 56) in P. massoniana and three proteins including maturase K (spots 7, 26), RNA polymerase II C-terminal domain phosphatase-like 1 (spot 24) in T. wallichiana var. mairei were found to change their expression under AR stress (Tables 1 and 2). Maturase K catalyzes intron removal in RNA precursors and directly affects gene expression at the translation level. The DNA-dependent RNA polymerase (RNAP) is the central enzyme of the transcription cycle, and RNA polymerase beta subunit is one of the subunits composing the RNA polymerase catalytic core. In the current study, it is interesting that maturase K (spot 15, Table 1), RNA polymerase beta subunit (spots 22 and 23, Table 1) and auxin-responsive protein (spot 47, Table 1) were decreased in abundance in P. massoniana under AR treatment. However, the abundances of maturase K (spots 7 and 26, Table 2) and RNA polymerase II C-terminal domain phosphatase-like 1 (spot 24, Table 2) were increased in AR-treated T. wallichiana var. mairei, indicating that transcription related proteins play a critical role in response to AR stress through adjusting of basic genetic processes in plants. In our study, transcription related proteins showed decreases in abundance in AR-treated P. massoniana, whereas the abundance of transcription related proteins increased in AR-treated T. wallichiana var. mairei (Tables 1 and 2). These data suggest that the process of transcription may be different between P. massoniana and T. wallichiana var. mairei in response to AR.
In addition, transposase (spot 26, Table 1) and retrotransposon proteins (spot 56, Table 1) in transcription displayed down-regulated expression pattern in P. massoniana under AR stress. Further works on these proteins in woody plants under AR stress are needed to clarify their functions.

3. Experimental Section

3.1. Plant Materials and Experimental Procedure

The seedlings of P. massoniana and T. wallichiana var. mairei were grown in plastic pots containing 12 kg soil in a greenhouse with a light/dark regime of 16/8 h, temperature of 21/27 °C (night/day), relative humidity of 60%–70%, a light intensity of 390 μmol·m−2·s−1 photosynthetically active radiation (PAR). The seedlings were sprayed once each day with 200 mL·pot−1 distilled water as control (CK, pH 5.6) or simulated AR solution (AR, pH 3.0). The ion compositions of the CK solution were adopted from Liu et al., while AR solution was made from CK solution and the pH was adjusted with a mixture of H2SO4 and HNO3 in the ratio of 5 to 1 by chemical equivalents, which represents the average ion compositions of rainfall in southern China [10]. The final concentrations of SO42− and NO3 were 0.45 and 0.09 mM, respectively. After 2-month simulated AR treatment, the sapling needles were collected for physiological measurements and proteomics research.

3.2. Chlorophyll Content and Net Photosynthetic Rate Measurements

Plant leaves (0.1 g of fresh weight (FW)) were prepared, and chlorophyll was extracted with ice-cold 80% v/v acetone. Absorption of the extract was measured at 663 and 646 nm with a spectrometer (Varian Cary 50 UV-VIS, Varian, Palo Alto, CA, USA) and the chlorophyll content was calculated as described by Wellburn [41].
Leaf net photosynthetic rate (Pn) was measured with a portable photosynthesis system (Li-6400, Li-Cor, Lincoln, NE, USA). Air temperature, CO2 concentration, light intensity, and air relative humidity were maintained at 25 °C, 380 μ·L−1, 800 μmol·m−2·s−1 PAR, and 80%, respectively. At least ten saplings were randomly selected from the CK or AR treatment group for Pn measurement.

3.3. Protein Extraction, 2-DE and 2-DE Gel Data Analysis

Total proteins were extracted from plant leaves according to the method of phenol extraction [42]. Final washed pellets were vacuum-dried and dissolved in lysis buffer (8 M urea, 2 M thiourea, 4% CHAPS, 1% DTT, 1% IPG buffer pH 4–7) at room temperature. Three independent biological repetitions were performed for each treatment. The protein concentration was determined with a 2-D Quant Kit (GE Healthcare Amersham Bioscience, Little Chalfont, UK) according to the manufacturer’s instructions.
Two-dimensional electrophoresis (2-DE) was performed according to Hu et al. [43]. The sample containing 500 μg proteins was loaded onto an IPG strip holder with 18-cm long, pH 4–7 linear (GE Healthcare, Piscataway, NJ, USA) IPG strip, and rehydrated for 18 h at room temperature. IEF was carried out using an Ettan IPGphor isoelectric focusing system (GE Healthcare Amersham Bioscience, Little Chalfont, UK) as follows: 300 V for 60 min, 600 V for 60 min, 1000 V for 60 min, a gradient to 8000 V for 120 min, and kept at 8000 V for a total of 64 000 Vh at 20 °C. After IEF, the IPG strips were equilibrated using an equilibration solution (6 M urea, 30% glycerol, 2% SDS, 50 mM Tris-HCl, pH 8.8) containing 1% DTT for 15 min, followed by 2.5% iodoacetamide in the same equilibration solution for 15 min. Electrophoresis in the second dimension was performed on 12.5% SDS polyacrylamide gels using a protean apparatus (Bio-Rad, Hercules, CA, USA) according to the manufacturer’s instructions. The gels were stained using Coomassie Brilliant Blue (CBB) (Bio-Rad, Hercules, CA, USA) R-250 and gel images were acquired at 600 dots per inch (dpi) resolution by a scanner (Uniscan M3600, Beijing, China). Three independent gels from each treatment were produced. 2-D gel analysis was performed with PDQuest software (version 7.0, Bio-Rad, Hercules, CA, USA) according to Liu et al. [15]. The protein spots that changed more than two-fold and passed the Student’s t-test with p < 0.05 were considered significant.

3.4. Protein Digestion and Identification

In-gel protein digestion and protein identification was followed as described by Liu et al. [15]. Matrix-assisted laser desorption/ionization-time-of-flight mass spectrometry (MALDI-TOF MS) analysis (ReFlexTM III, Bruker, Bremen, Germany) was used to acquire the peptide mass fingerprint (PMF). Standard peptide mixture was spotted adjacent to all samples for external calibration followed by internal mass correction using peptide ions generated by trypsin autoprotolysis (m/z 842.5, and m/z 2211.10). The spectra were analyzed with the flex analysis software (Version 3.2, Bruker-Daltonics, Bremen, Germany). Since the P. massoniana and T. wallichiana var. mairei genome are still unsequenced, a homology-based search was performed. The measured tryptic peptide masses were searched against the National Center for Biotechnology Information non-redundant (NCBInr, Bethesda, MD, USA) database (release date: 16 July 2012), and selecting the taxonomy of green plants using MASCOT interface (Version 2.0; Matrix Science, London, UK). The following parameters were used for database search: MH+ monoisotopic mass values, a fragment ion mass tolerance of ±0.3 Da, permitting one missed cleavage, alkylation of cysteine by carba-midomethylation as a fixed modification, and oxidation of methionine as a variable modification. MASCOT Peptide Mass Fingerprint ( http://www.matrixscience.com) protein scores greater than 73 with the NCBInr database were considered significant (p < 0.05). A number of other criteria were further evaluated in the final assignment of protein and peptide identifications: the number of matching peptides (at least four), the coverage (a minimum of 9%), and the molecular weight (Mr) and isoelectric point (pI) of the protein. Furthermore, to avoid false positives, an additional in-house Basic Local Alignment Search Tool (BLAST) search against the NCBI protein database ( http://www.ncbi.nlm.nih.gov) was done to reconfirm all the matches.
The identified proteins were used to search for over/under-representation of the searched proteins adopting the AGI codes as input and then searched within the UniProt (Wellcome Trust Genome Campus, Cambridge, UK; Centre Medical Universitaire, Geneva, Switzerland; Georgetown University Medical Center, Washington, WA, USA, http://www.uniprot.org) and TAIR database (Carnegie Institution of Washington Department of Plant Biology 260, Stanford, CA, USA, http://www.arabidopsis.org) to find out if their functions are known, they were then further classified using Functional Catalogue software (Munich Information Center for Protein Sequences, Neuherberg, Germany, http://mips.gsf.de/projects/funcat).

3.5. Statistical Analysis

Values in figures and tables were expressed as means ± SE. The statistical significance of the data was analyzed using a univariate analysis of variance (p < 0.05) (Abacus Concepts, Berkeley, CA, USA, one-way ANOVA; SPSS for Windows, version 11.0, SPSS Inc., Chicago, IL, USA).

4. Conclusions

In this study, a comparative proteomics analysis was carried out to clarify the differentially expressed protein profiles of two tree species under AR treatment. Our data revealed that many more proteins altered their expression level in P. massoniana than in T. wallichiana var. mairei in response to simulated AR treatment. Taken together, metabolism, photosynthesis, signal transduction and transcription related proteins in P. massoniana, a sensitive species, were depressed by AR stress. However, the abundances of proteins participating in photosynthesis as well as in signal transduction and transcription were increased in T. wallichiana var. mairei, a tolerant species, under simulated AR. We presume that AR was a strongly oxidative situation experienced by P. massoniana but was of weak oxidative intensity in T. wallichiana var. mairei. On the other hand, AR stress influenced only part of the photosynthetic network and modified gene expression in such a way as to enhance metabolism systems and strengthen plant defense responses to maintain physiological and biochemical homeostasis in T. wallichiana var. mairei. This is likely one of the reasons P. massoniana is more sensitive to AR stress than T. wallichiana var. mairei. The proteins identified in this study might be useful in investigating the different defense mechanism of woody plants to AR stress.
Based on the putative functions and expression changes of the identified proteins in P. massoniana and T. wallichiana var. mairei, together with previous reports, we outlined a schematic overview model associated with the different systematic response of P. massoniana and T. wallichiana var. mairei to AR stress (Figure 5). These results depict a panoramic view of the adaptation strategies in P. massoniana and T. wallichiana var. mairei under AR challenge and deepen our understanding in AR tolerance in woody plants.

Supplementary Information

ijms-15-04333-s001.pdf

Acknowledgments

This study was supported by the National Natural Science Foundation of China (NSFC No. 30930076, 31300505, 31260057, 30770192, 30670317), the Foundation of the Chinese Ministry of Education (20070384033) and the Program for New Century Excellent Talents in Xiamen University (NCETXMU No. X07115), Zhejiang Provincial Natural Science Foundation (LY13C160014, Z3110443).

Conflicts of Interest

The authors declare no conflict of interest.

References

  1. Liu, J.; Diamond, J. China’s environment in a globalizing world. Nature 2005, 435, 1179–1186. [Google Scholar]
  2. Larssen, T.; Lydersen, E.; Tang, D.; He, Y.; Gao, J.; Liu, H.; Duan, L.; Seip, H.M.; Vogt, R.D.; Mulder, J. Acid rain in China. Environ. Sci. Technol. 2006, 40, 418–425. [Google Scholar]
  3. Likens, G.E.; Driscoll, C.T.; Buso, D.C. Long-term effects of acid rain: Response and recovery of a forest ecosystem. Science 1996, 272, 244–245. [Google Scholar]
  4. Malakoff, D. Taking the sting out of acid rain. Science 2010, 330, 910–911. [Google Scholar]
  5. Fan, H.B.; Wang, Y.H. Effects of simulated acid rain on germination foliar damage chlorophyll contents and seedling growth of five hardwood species growing in China. For. Ecol. Manag. 2000, 126, 321–329. [Google Scholar]
  6. Liu, J.; Zhou, G.; Yang, C.; Ou, Z.; Peng, C. Responses of chlorophyll fluorescence and xanthophyll cycle in leaves of Schima superba Gardn & Champ and Pinus massoniana Lamb to simulated acid rain at Dinghushan Biosphere Reserve China. Acta Physiol. Plant. 2007, 29, 33–38. [Google Scholar]
  7. Lee, Y.; Park, J.; Im, K.; Kim, K.; Lee, J.; Lee, K.; Park, J.A.; Lee, T.K.; Park, D.S.; Yang, J.S.; et al. Arabidopsis leaf necrosis caused by simulated acid rain is related to the salicylic acid signaling pathway. Plant Physiol. Biochem. 2006, 44, 38–42. [Google Scholar]
  8. Kong, F.; Liu, Y.; Hu, W.; Shen, P.; Zhou, C.; Wang, L. Biochemical responses of the mycorrhizae in Pinus massoniana to combined effects of Al Ca and low pH. Chemosphere 2000, 40, 311–318. [Google Scholar]
  9. Larssen, T.; Carmichael, G. Acid rain and acidification in China: The importance of base cation deposition. Environ. Pollut. 2000, 110, 89–102. [Google Scholar]
  10. Liu, T.W.; Wu, F.H.; Wang, W.H.; Chen, J.; Li, Z.J.; Dong, X.J.; Patton, J.; Pei, Z.M.; Zheng, H.L. Effects of calcium on seed germination seedling growth and photosynthesis of six forest tree species under simulated acid rain. Tree Physiol. 2011, 31, 402–413. [Google Scholar]
  11. Gao, L.; Möller, M.; Zhang, X.M.; Hollingsworth, M.; Liu, J.; Mill, R.; Gibby, M.; Li, D.Z. High variation and strong phylogeographic pattern among cpDNA haplotypes in Taxus wallichiana (Taxaceae) in China and North Vietnam. Mol. Ecol. 2007, 16, 4684–4698. [Google Scholar]
  12. Liu, K.; Yu, F.; Peng, S.; Fang, Y.; Li, F. Effects of simulated acid on saplings of Taxus species. Ecol. Environ. 2007, 16, 309–312. [Google Scholar]
  13. Liu, J.; Yang, C.; Wang, M. Effect of simulated acid rain on physiological characteristics in Taxus chinensis var. Mairei. Chin. J. Trop. Crop. 2012, 33, 1046–1050. [Google Scholar]
  14. Liu, T.; Jiang, X.; Shi, W.; Chen, J.; Pei, Z.; Zheng, H. Comparative proteomic analysis of differentially expressed proteins in β-aminobutyric acid enhanced Arabidopsis thaliana tolerance to simulated acid rain. Proteomics 2011, 11, 2079–2094. [Google Scholar]
  15. Liu, T.W.; Fu, B.; Niu, L.; Chen, J.; Wang, W.H.; He, J.X.; Pei, Z.M.; Zheng, H.L. Comparative proteomic analysis of proteins in response to simulated acid rain in Arabidopsis. J. Proteome Res. 2011, 10, 2579–2589. [Google Scholar]
  16. Wang, X.Q.; Liu, Z.; Niu, L.; Fu, B. Long-term effects of simulated acid rain stress on a staple forest plant Pinus massoniana Lamb: A proteomic analysis. Trees-Struct. Funct. 2013, 27, 297–309. [Google Scholar]
  17. Chen, J.; Wang, W.H.; Liu, T.W.; Wu, F.H.; Zheng, H.L. Photosynthetic and antioxidant responses of Liquidambar formosana and Schima superba seedlings to sulfuric-rich and nitric-rich simulated acid rain. Plant Physiol. Biochem. 2013, 64, 41–51. [Google Scholar]
  18. Bernard, S.M.; Habash, D.Z. The importance of cytosolic glutamine synthetase in nitrogen assimilation and recycling. New Phytol. 2009, 182, 608–620. [Google Scholar]
  19. Wang, H.; Ahan, J.; Wu, Z.; Shi, D.; Liu, B.; Yang, C. Alteration of nitrogen metabolism in rice variety ‘Nipponbare’ induced by alkali stress. Plant Soil 2012, 355, 131–147. [Google Scholar]
  20. Yousfi, S.; Serret, M.D.; Márquez, A.J.; Voltas, J.; Araus, J.L. Combined use of δ13C δ18O and δ15N tracks nitrogen metabolism and genotypic adaptation of durum wheat to salinity and water deficit. New Phytol. 2012, 194, 230–244. [Google Scholar]
  21. Hanke, G.T.; Kimata-Ariga, Y.; Taniguchi, I.; Hase, T. A post genomic characterization of Arabidopsis ferredoxins. Plant Physiol. 2004, 134, 255–264. [Google Scholar]
  22. Neuhaus, H.; Emes, M. Nonphotosynthetic metabolism in plastids. Annu. Rev. Plant Biol. 2000, 51, 111–140. [Google Scholar]
  23. Ceccarelli, E.A.; Arakaki, A.K.; Cortez, N.; Carrillo, N. Functional plasticity and catalytic efficiency in plant and bacterial ferredoxin-NADP (H) reductases. BBA-Proteins Proteom. 2004, 1698, 155–165. [Google Scholar]
  24. Rodriguez, R.E.; Lodeyro, A.; Poli, H.O.; Zurbriggen, M.; Peisker, M.; Palatnik, J.F.; Tognetti, V.B.; Tschiersch, H.; Hajirezaei, M.R.; Valle, E.M. Transgenic tobacco plants overexpressing chloroplastic ferredoxin-NADP (H) reductase display normal rates of photosynthesis and increased tolerance to oxidative stress. Plant Physiol. 2007, 143, 639–649. [Google Scholar]
  25. Kushnir, S.; Babiychuk, E.; Storozhenko, S.; Davey, M.W.; Papenbrock, J.; de Rycke, R.; Engler, G.; Stephan, U.W.; Lange, H.; Kispal, G. A mutation of the mitochondrial ABC transporter Sta1 leads to dwarfism and chlorosis in the Arabidopsis mutant starik. Plant Cell 2001, 13, 89–100. [Google Scholar]
  26. Bona, E.; Marsano, F.; Cavaletto, M.; Berta, G. Proteomic characterization of copper stress response in Cannabis sativa roots. Proteomics 2007, 7, 1121–1130. [Google Scholar]
  27. Ravet, K.; Touraine, B.; Boucherez, J.; Briat, J.F.; Gaymard, F.; Cellier, F. Ferritins control interaction between iron homeostasis and oxidative stress in Arabidopsis. Plant J. 2008, 57, 400–412. [Google Scholar]
  28. Jiang, Y.; Yang, B.; Harris, N.S.; Deyholos, M.K. Comparative proteomic analysis of NaCl stress-responsive proteins in Arabidopsis roots. J. Exp. Bot. 2007, 58, 3591–3607. [Google Scholar]
  29. Singh, B.; Mishra, R.; Agarwal, P.K.; Goswami, M.; Nair, S.; Sopory, S.; Reddy, M. A pea chloroplast translation elongation factor that is regulated by abiotic factors. Biochem. Biophys. Res. Commun. 2004, 320, 523–530. [Google Scholar]
  30. Jonak, C.; Hirt, H. Glycogen synthase kinase 3/SHAGGY-like kinases in plants: An emerging family with novel functions. Trends Plant Sci. 2002, 7, 457–461. [Google Scholar]
  31. Wan, X.Y.; Liu, J.Y. Comparative proteomics analysis reveals an intimate protein network provoked by hydrogen peroxide stress in rice seedling leaves. Mol. Cell. Proteomics 2008, 7, 1469–1488. [Google Scholar]
  32. Ohta, H.; Shibata, Y.; Haseyama, Y.; Yoshino, Y.; Suzuki, T.; Kagasawa, T.; Kamei, A.; Ikeuchi, M.; Enami, I. Identification of genes expressed in response to acid stress in Synechocystis sp PCC 6803 using DNA microarrays. Photosynth. Res. 2005, 84, 225–230. [Google Scholar]
  33. Ozturk, Z.N.; Talamé, V.; Deyholos, M.; Michalowski, C.B.; Galbraith, D.W.; Gozukirmizi, N.; Tuberosa, R.; Bohnert, H.J. Monitoring large-scale changes in transcript abundance in drought-and salt-stressed barley. Plant Mol. Biol. 2002, 48, 551–573. [Google Scholar]
  34. Gao, L.; Yan, X.; Li, X.; Guo, G.; Hu, Y.; Ma, W.; Yan, Y. Proteome analysis of wheat leaf under salt stress by two-dimensional difference gel electrophoresis (2D-DIGE). Phytochemistry 2011, 72, 1180–1191. [Google Scholar]
  35. Apel, K.; Hirt, H. Reactive oxygen species: Metabolism oxidative stress and signal transduction. Annu. Rev. Plant Biol. 2004, 55, 373–399. [Google Scholar]
  36. Magome, H.; Yamaguchi, S.; Hanada, A.; Kamiya, Y.; Oda, K. The DDF1 transcriptional activator upregulates expression of a gibberellin-deactivating gene GA2ox7 under high-salinity stress in Arabidopsis. Plant J. 2008, 56, 613–626. [Google Scholar]
  37. Wildermuth, M.C.; Dewdney, J.; Wu, G.; Ausubel, F.M. Isochorismate synthase is required to synthesize salicylic acid for plant defence. Nature 2001, 414, 562–565. [Google Scholar]
  38. Hepler, P.K. Calcium: A central regulator of plant growth and development. Plant Cell 2005, 17, 2142–2155. [Google Scholar]
  39. Kim, Y.Y.; Jung, K.W.; Yoo, K.S.; Jeung, J.U.; Shin, J.S. A stress-responsive caleosin-like protein AtCLO4 acts as a negative regulator of ABA responses in Arabidopsis. Plant Cell Physiol. 2011, 52, 874–884. [Google Scholar]
  40. DeHayes, D.H.; Schaberg, P.G.; Hawley, G.J.; Strimbeck, G.R. Acid rain impacts on calcium nutrition and forest health. BioScience 1999, 49, 789–800. [Google Scholar]
  41. Wellburn, R. The spectral determination of chlorophylls a and b as well as total carotenoids using various solvents with spectrophotometers of different resolution. J. Plant Physiol. 1994, 144, 307–313. [Google Scholar]
  42. Carpentier, S.C.; Witters, E.; Laukens, K.; Deckers, P.; Swennen, R.; Panis, B. Preparation of protein extracts from recalcitrant plant tissues: An evaluation of different methods for two-dimensional gel electrophoresis analysis. Proteomics 2005, 5, 2497–2507. [Google Scholar]
  43. Hu, W.J.; Chen, J.; Liu, T.W.; Liu, X.; Wu, F.H.; Wang, W.H.; He, J.X.; Xiao, Q.; Zheng, H.L. Comparative proteomic analysis on wild type and nitric oxide-overproducing mutant (nox1) of Arabidopsis thaliana. Nitric Oxide 2014, 36, 19–30. [Google Scholar]
Figure 1. Morphological and physiological changes of P. massoniana and T. wallichinana var. mairei under distilled water as control (CK) and simulated acid rain (AR) stress. (A) Injury phenotype; (B) total chlorophyll content; (C) photosynthesis (Pn). Data are means ± SE from measurements of five replicate experiments.
Ijms 15 04333f1
Figure 2. 2-DE image analysis of proteins extracted from P. massoniana and T. wallichinana var. mairei leaves. The numbers assigned to the proteins spots correspond to those listed in Tables 1 and 2. (A) A representative Coomassie Brilliant Blue (CBB) R250-stained 2D gel of total soluble proteins from P. massoniana. Arrows indicate 65 spots showing at least 2-fold changes (p < 0.05) were analyzed by Matrix-assisted laser desorption/ionization-time-of-flight mass spectrometry (MALDI-TOF MS); (B) Close-up view of some differentially expressed protein spots in P. massoniana; (C) A representative CBB R250-stained 2D gel of total soluble proteins from T. wallichinana var. mairei. Arrows indicate 26 spots showing at least 2-fold changes (p < 0.05) were analyzed by MALDI-TOF MS; (D) Close-up view of some differentially expressed protein spots in T. wallichinana var. mairei.
Ijms 15 04333f2
Figure 3. Functional category distribution of the identified proteins in P. massoniana and T. wallichinana var. mairei under the AR treatment. Each identified protein listed in Tables 1 and 2 was functionally classified based on their known and putative functions. The pie chart indicates the percentage of the AR-responsive proteins identified in each functional category. (A) AR-responsive proteins in P. massoniana; (B) AR-responsive proteins in T. wallichinana var. mairei; (C) Number of protein spots significantly up-regulated and down-regulated in P. massoniana and T. wallichinana var. mairei under AR stress.
Ijms 15 04333f3
Figure 4. Putative subcellular location model of AR stress response in P. massoniana and T. wallichinana var. mairei. The proteins marked in blue or orange represents they were found in P. massoniana or T. wallichinana var. mairei, respectively. Some of the AR-responsive proteins are indicated with those up-regulated marked by ↑ and those down-regulated marked by ↓. The abbreviations used in the Figure were explained in Tables 1 and 2.
Ijms 15 04333f4
Figure 5. A schematic representation of different AR-tolerance mechanisms in P. massoniana and T. wallichinana var. mairei by regulating diverse biological processes. “U” or “D” indicate increase or decrease, respectively.
Ijms 15 04333f5
Table 1. Identification of differentially expressed proteins using 2-DE and mass spectrometry analysis in Pinus massoniana.
Spot aNCBI accession bProtein identity cThero.kDa/pI dExper.kDa/pI eSC fMP/TP gScore hC iSpecies
Metabolism

4gi|308807529aminoimidazole ribonucleotide carboxylase62.31/6.227.37/5.1817%9/1497UOstreococcus tauri
12gi|90718161granule bound starch synthase37.38/7.1127.42/5.4431%7/1391DFicus hispidioides
16gi|357122042UDP-arabinopyranose mutase 3-like41.34/6.0248.06/5.4625%9/1295UBrachypodium distachyon
24gi|224122152mitochondrial phosphate carrier protein38.64/9.1844.04/5.5621%8/13103DPopulus trichocarpa
27gi|435103glyceraldehyde-phosphate dehydrogenase44.66/7.5551.45/6.6532%10/12145DPinus sylvestris
28gi|396547glutamate-ammonia ligase39.79/6.4252.00/6.5520%18/2386DPinus sylvestris
29gi|308806413putative D-protein22.80/6.7431.71/6.4232%7/998DOstreococcus tauri
34gi|357448955nicotianamine synthase32.03/8.1135.56/5.8825%6/6105DMedicago truncatula
39gi|303281782ABC transporter130.84/6.5585.07/5.8910%9/1192DMicromonas pusilla
41gi|13873338lipoic acid synthase41.75/8.6184.86/5.9523%6/791DBruguiera gymnorhiza
48gi|1908991642Fe-2S ferredoxin18.33/8.5220.94/6.2138%4/481DPopulus tremula
54gi|15240625transaldolase47.96/6.0849.44/6.6113%6/692DArabidopsis thaliana
57gi|126583387ferritin28.26/5.6649.03/5.2924%4/475DTriticum urartu

Cell structure

62gi|29028306UDP-glucose dehydrogenase53.52/6.0687.31/4.7021%7/8101DColocasia esculenta

Protein synthesis and modification

6gi|357111489oxygen-evolving enhancer protein 124.81/4.9737.64/4.7226%6/1091UBrachypodium distachyon
11gi|46811008small ribosomal protein 422.28/10.2433.33/5.4338%6/987UHaplomitrium blumei
20gi|308801835Ulp1 protease family protein68.17/9.2122.11/6.9022%12/15117DOstreococcus tauri
21gi|297830742kinase family protein43.77/5.7933.72/5.5531%7/1097DArabidopsis lyrata subsp
31gi|6525065chloroplast translational elongation factor Tu50.55/6.05139.96/5.7327%9/11109DOryza sativa Japonica Group
37gi|159477317T-complex protein 1 beta subunit57.40/5.3758.03/5.8830%14/18152UChlamydomonas reinhardtii
45gi|233142272glycogen synthase kinase47.06/8.6431.97/6.0025%8/12100DGlycine max
49gi|255560267chaperonin-60kD61.48/6.2024.54/6.2514%6/776DRicinus communis

Photosynthesis and energy production

3gi|228016009ATP synthase CF1 beta subunit52.92/5.1960.32/4.7943%18/30161UPinus resinosa
9gi|357481701Ycf2108.70/8.9832.16/6.1013%8/1088DMedicago truncatula
17gi|56784992putative ATP synthase beta subunit45.27/5.2664.05/5.0847%13/19167UOryza sativa Japonica Group
18gi|220938463phosphoenolpyruvate carboxykinase (PEP carboxykinase)55.85/6.6389.72/5.1919%7/995DHyparrhenia hirta
35gi|18073888phosphoenolpyruvate carboxylase(PPCK)41.34/7.7452.73/5.8824%6/794DLeptotes bicolor
44gi|31281466ribulose-1,5-bisphosphate carboxylase/oxygenase large subunit(Rubisco)52.11/6.0921.97/6.0516%8/1488DPinus monophylla
50gi|166714465ribulose-1,5-bisphosphate carboxylase/oxygenase large subunit(Rubisco)51.60/6.0059.41/6.1136%21/27223DPinus parviflora
53gi|332591479phosphoglycerate kinase 152.94/8.8450.50/6.7336%15/22153DPinus pinaster
55gi|34733684ribulose-1,5-bisphosphate carboxylase/oxygenase large subunit(Rubisco)48.97/6.3421.49/4.6314%6/690DGnetum hainanense
60gi|264160443ribulose 1,5-bisphosphate carboxylase46.11/6.0882.57/4.6614%8/1187DCallistephus chinensis
65gi|357111628succinate dehydrogenase [ubiquinone] flavoprotein subunit68.79/6.1884.59/5.9314%7/890UBrachypodium distachyon

Stress and defense

5gi|255575353peroxiredoxin23.94/7.6319.53/5.2322%5/683DRicinus communis
10gi|192912966cytosolic ascorbate peroxidase27.550/5.4233.28/5.2238%7/998UElaeis guineensis
13gi|289187423tau class glutathione S-transferase26.47/5.5629.44/5.4436%11/2295UPinus brutia
14gi|289187423tau class glutathione S-transferase26.47/5.5629.21/5.2535%10/14103UPinus brutia
30gi|66841104manganese superoxide dismutase13.31/5.8529.40/6.5246%5/697DLarix gmelinii
33gi|154101561phenylalanine ammonia-lyase24.86/6.5432.30/5.8627%5/784DScutellaria baicalensis
36gi|380863088stromal ascorbate peroxidase80.54/9.1063.15/5.8157%4/492DDimocarpus longan
43gi|357513733Tir-nbs-lrr resistance protein140.72/5.31140.40/5.9512%12/15110DMedicago truncatula
51gi|195620494membrane-associated salt-inducible protein43.66/9.02114.61/6.1920%7/9102UZea mays
59gi|308804281cytochrome b516.34/7.9055.92/5.8645%5/692DOstreococcus tauri
64gi|56481813thiazole biosynthetic enzyme36.63/6.0135.00/5.5129%8/1185DPseudotsuga menziesii

Hormone response

7gi|212725010abscisic acid and water-stress induced protein16.30/9.5540.39/4.9528%4/581UPinus sylvestris
40gi|224108798gibberellin 2-oxidase34.47/5.4484.30/5.9829%8/10106DPopulus trichocarpa
47gi|357485291auxin-responsive protein36.69/8.5221.95/6.1518%6/680DMedicago truncatula

Signal transduction

8gi|145336050caleosin-related protein23.89/9.62116.00/4.4740%6/797DArabidopsis thaliana
25gi|22128710putative signal tranduction protein97.72/6.1654.98/5.6213%9/11101DOryza sativa Japonica Group
42gi|226494574T-cell activation protein phosphatase 2C-like protein34.59/7.70140.00/5.8822%5/584DZea mays
52gi|225425656probable calcium-binding protein CML3020.64/4.6632.35/6.5530%5/597DVitis vinifera
63gi|357440111calcium-dependent protein kinase54.85/5.8521.74/5.4217%7/884DMedicago truncatula

Transcription

15gi|384584973maturase K31.08/10.1738.94/5.3130%6/8100DCynodon nlemfuensis
22gi|313199657RNA polymerase beta subunit120.90/6.4132.90/5.609%8/978DIsoetes flaccida
23gi|372482380RNA polymerase beta subunit158.24/9.3838.65/5.4611%14/20109DSansevieria trifasciata
26gi|18419497transposase15.77/8.9369.37/5.6944%5/689DOryza nivara
56gi|108862655retrotransposon protein21.22/8.6256.71/6.9332%6/893DOryza sativa Japonica Group

Function unknown and hypothetical proteins

1gi|326501884predicted protein53.01/5.3218.56/4.2018%7/1184DHordeum vulgare subsp
2gi|21593511pheromone receptor39.28/4.4433.13/4.5624%5/683DArabidopsis thaliana
19gi|118486611unknown43.94/6.4335.36/6.0719%6/978DPopulus trichocarpa
32gi|116780007unknown25.59/5.8230.20/5.9245%13/29120DPicea sitchensis
38gi|148906365unknown48.34/5.7863.66/5.9029%11/16109UPicea sitchensis
46gi|116789937unknown54.01/6.0057.72/6.0423%12/17116DPicea sitchensis
58gi|357488033hypothetical protein MTR_5g04793054.35/4.9247.79/5.2619%6/978DMedicago truncatula
61gi|242033729hypothetical protein SORBIDRAFT_01g01506018.87/4.7536.24/4.6732%5/685USorghum bicolor
aSpot. is the unique differentially expressed protein spot number;
bDatabase accession numbers according to NCBInr;
cThe name of the proteins identified by MALDI-TOF MS;
dTheoretical mass (kDa) and pI of identified proteins;
eExperimental mass (kDa) and pI of identified proteins;
fThe amino acid sequence coverage for the identified proteins;
gNumber of the matched peptides and the total searched peptides;
hThe Mascot searched score against the database NCBInr;
iSpot abundance change. U stands for increased abundance of protein, D stands for decreased abundance of protein.
Table 2. Identification of differentially expressed proteins using 2-DE and mass spectrometry analysis in Taxus wallichiana var.mairei.
Spot aNCBI accession bProtein identity cThero.kDa/pI dExper.kDa/pI eSC fMP/TP gScore hC iSpecies
Metabolism

9gi|3913651ferredoxin-NADP reductase40.71/8.3711.75/5.4035%6/988UNicotiana tabacum
13gi|15228869copper chaperone13.08/4.9139.62/5.5533%4/487DArabidopsis thaliana
21gi|334184891aconitase/3-isopropylmalate dehydratase protein23.88/6.1628.02/4.4736%6/896UArabidopsis thaliana

Cell structure

14gi|2500930beta-fructofuranosidase62.90/7.0746.39/5.4913%6/694UPisum sativum
23gi|357521323microtubule associated protein type 270.55/9.0539.64/5.4920%9/12102DMedicago truncatula
25gi|159490038eta tubulin35.80/7.7523.31/5.8029%6/894UChlamydomonas reinhardtii

Photosynthesis and energy production

1gi|226498532NADH-ubiquinone oxidoreductase 10.5 kDa subunit11.28/9.1515.08/4.6447%4/485UZea mays
3gi|138277483ATP synthase beta subunit51.67/5.1163.61/4.9042%18/30170DTaxus brevifolia
5gi|138277483ATP synthase beta subunit51.67/5.1162.00/5.0845%20/37167DTaxus brevifolia
10gi|357137138phosphoribulokinase45.31/5.9740.14/5.2127%7/1195UBrachypodium distachyon
11gi|225459844ATP-dependent zinc metalloprotease FTSH75.76/6.3684.83/5.3327%15/28124UVitis vinifera
12gi|7592732plasma membrane H+-ATPase22.04/8.9231.30/5.4738%6/6102UNepenthes alata
15gi|150251443ATP synthase CF1 alpha chain55.36/5.3857.82/5.5315%9/1299DCycas taitungensis
16gi|154146830phosphoenolpyruvate carboxylase49.31/6.2129.94/5.8229%8/10118UCymbopogon citratus
20gi|350536787chloroplast malate dehydrogenase47.79/5.9228.80/6.1923%8/8110USolanum lycopersicum

Stress and defense

6gi|357520455cysteine proteinase inhibitor25.78/7.7828.19/5.0421%6/684DMedicago truncatula

Hormone response

4gi|76009223isochorismate synthase13.34/8.4711.83/5.1132%4/482USolanum lycopersicum
19gi|335346406abscisic acid 8-hydroxylase53.18/8.7730.53/6.1717%7/988DIpomoea nil

Signal transduction

2gi|357132195light-mediated development protein DET1-like isoform 248.61/8.5349.88/4.7617%7/995UBrachypodium distachyon
8gi|384245525calcium-binding protein CML19 (centrin)19.59/4.7519.99/5.4431%4/478DCoccomyxa subellipsoidea
17gi|356573251calcium-binding protein KIC-like14.00/4.1828.30/5.7847%5/585DGlycine max

Transcription

7gi|154082680maturase K57.14/9.4010.70/5.3312%6/685UHaplophyllum buxbaumii
24gi|79481163RNA polymerase II C-terminal domain phosphatase-like 1109.15/5.8130.99/5.6215%10/13103UArabidopsis thaliana
26gi|15341050maturase K33.04/9.6525.36/5.8331%7/1199UPersicaria runcinata

Function unknown and hypothetical proteins

18gi|125547814hypothetical protein OsI_1542245.62/6.2038.91/6.0322%7/1094UOryza sativa Indica Group
22gi|296087931unnamed protein product79.30/7.3215.63/5.9620%11/16106DVitis vinifera
aSpot. is the unique differentially expressed protein spot number;
bDatabase accession numbers according to NCBInr;
cThe name of the proteins identified by MALDI-TOF MS;
dTheoretical mass (kDa) and pI of identified proteins;
eExperimental mass (kDa) and pI of identified proteins;
fThe amino acid sequence coverage for the identified proteins;
gNumber of the matched peptides and the total searched peptides;
hThe Mascot searched score against the database NCBInr;
iSpot abundance change. U stands for increased abundance of protein, D stands for decreased abundance of protein.

