
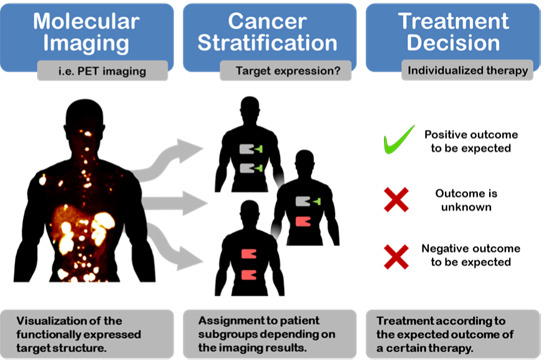
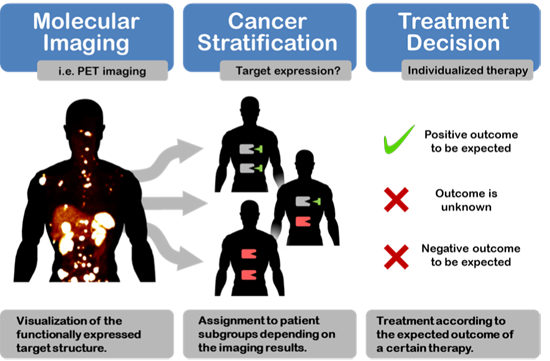
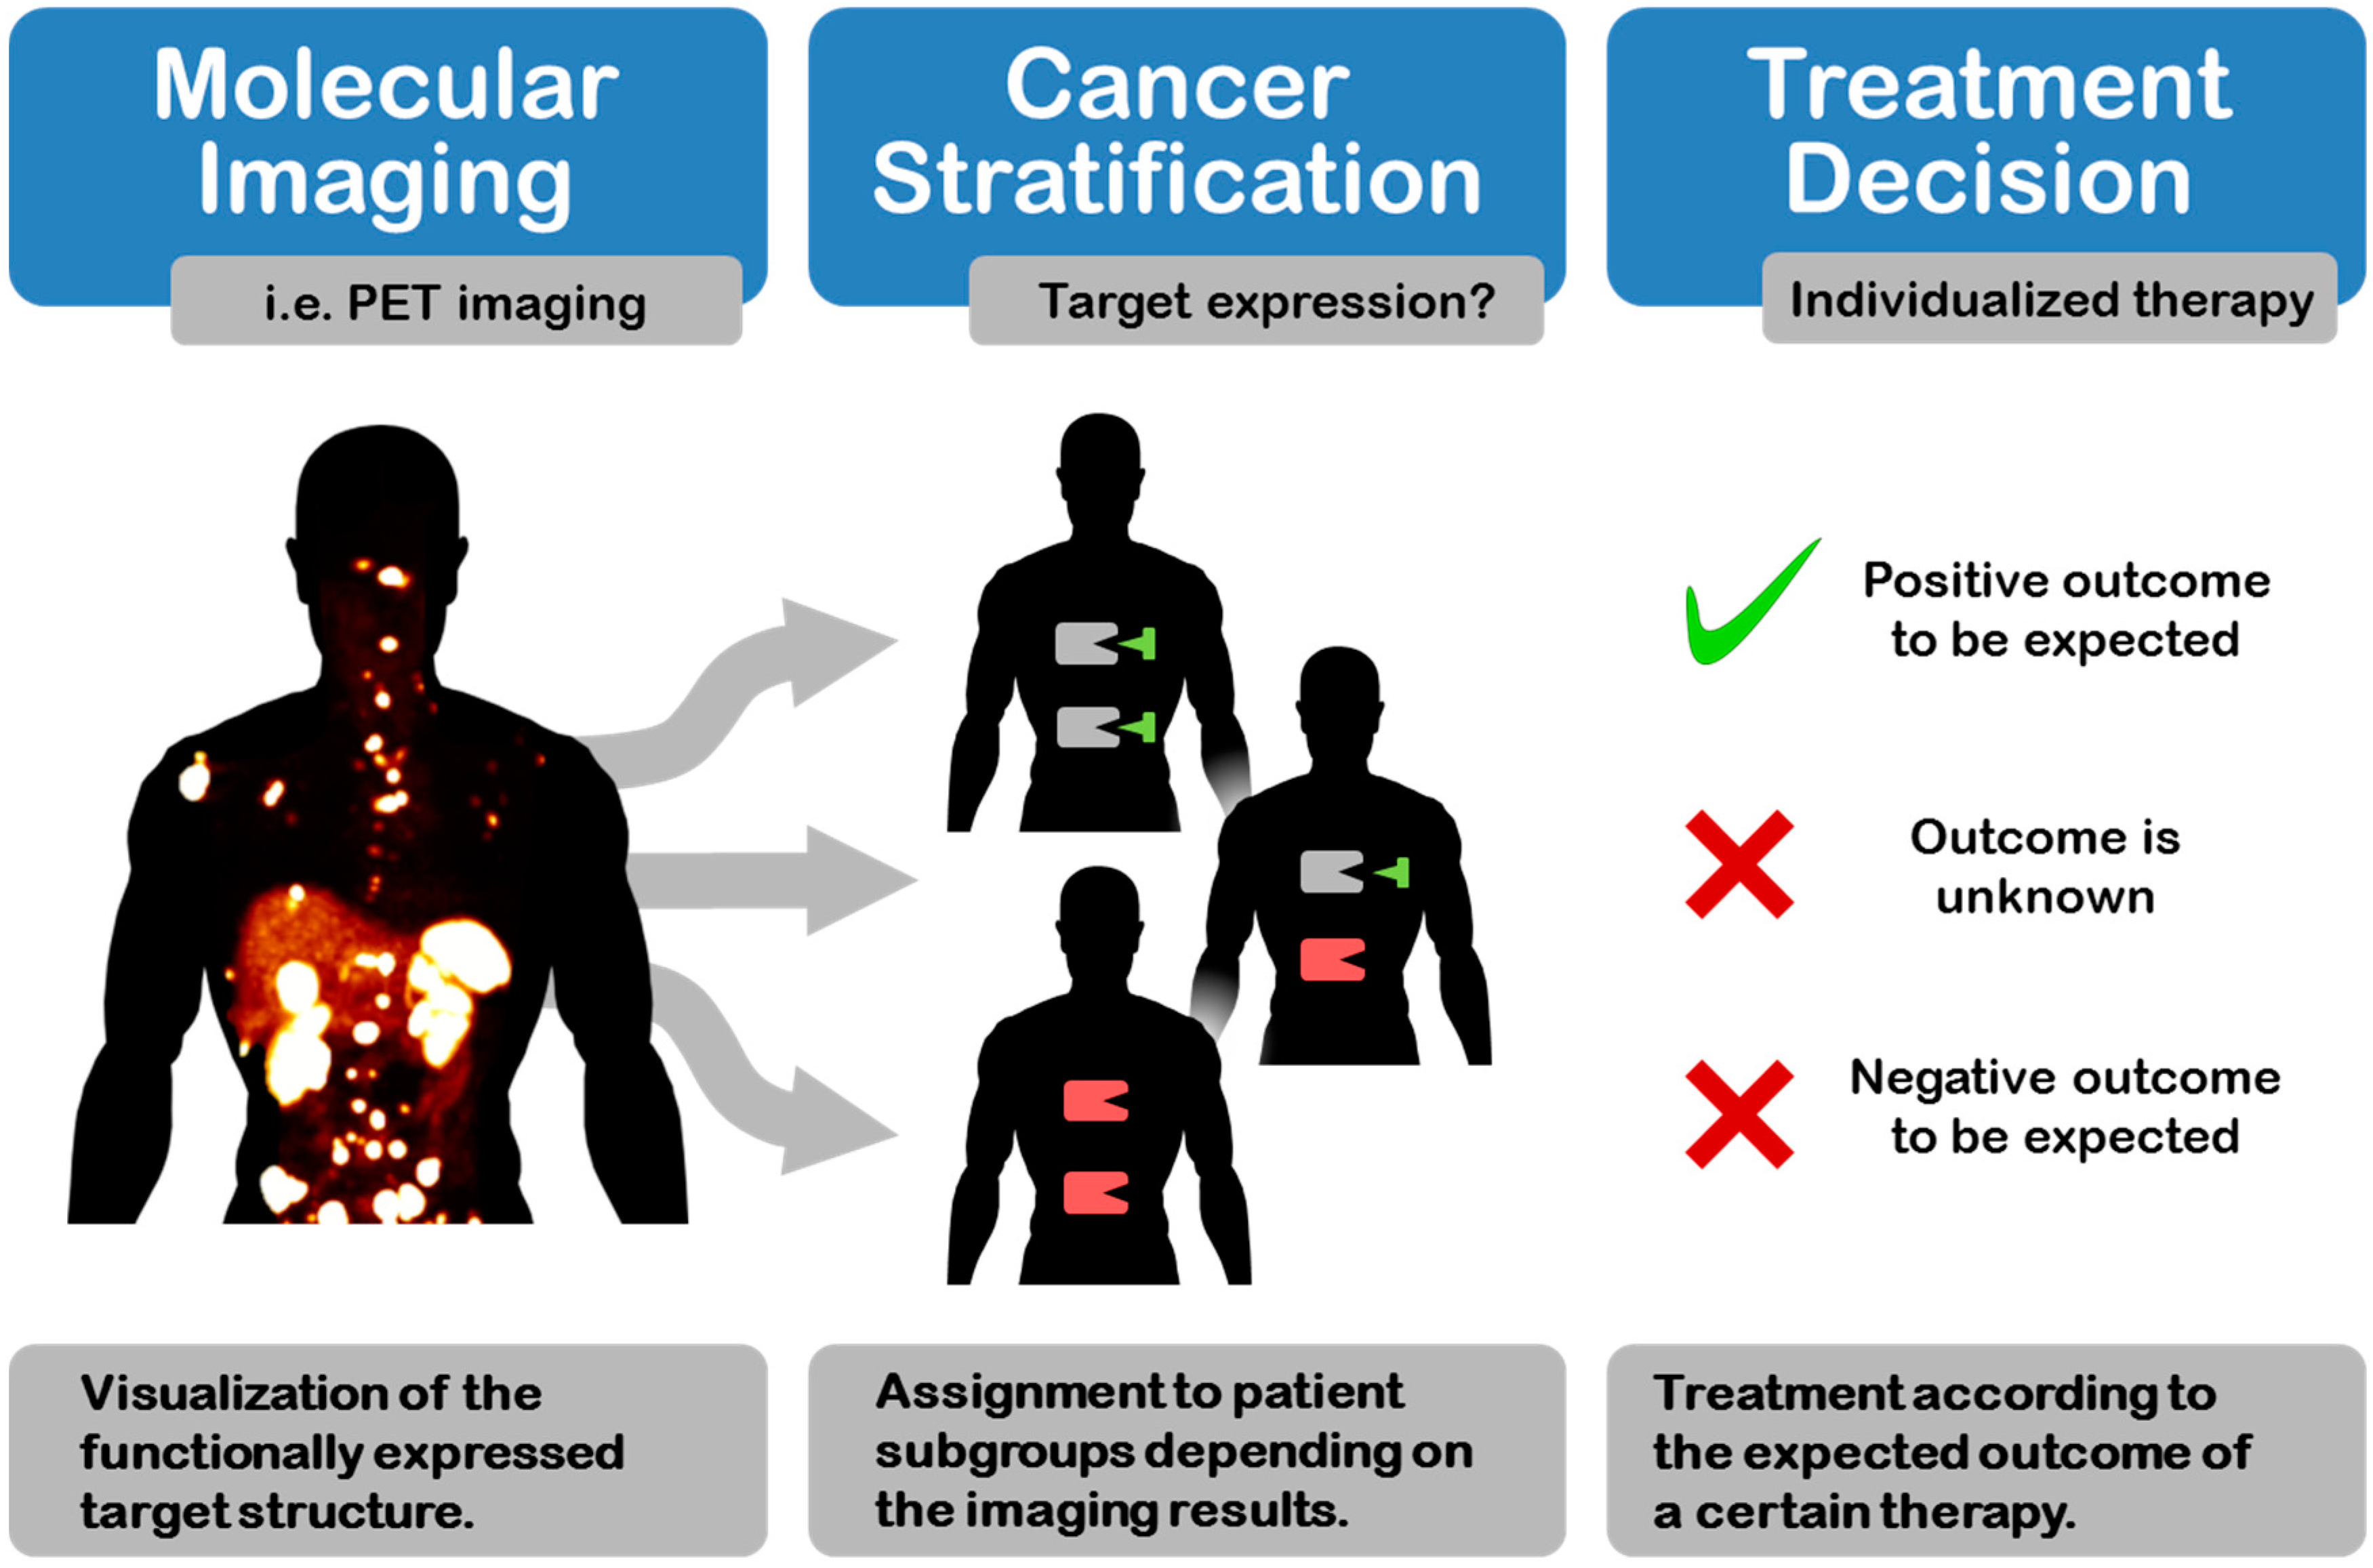
Cancer Stratification by Molecular Imaging

Abstract
:
1. Introduction

2. Targets for Cancer Stratification by Molecular Imaging
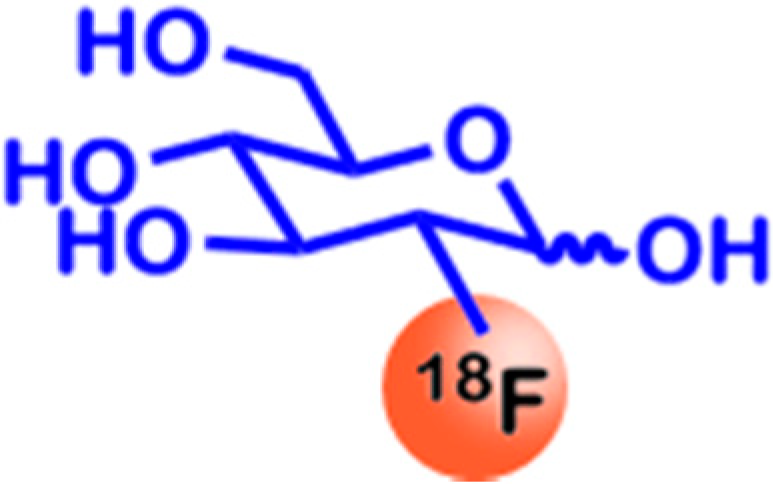
2.1. Glucose Utilization

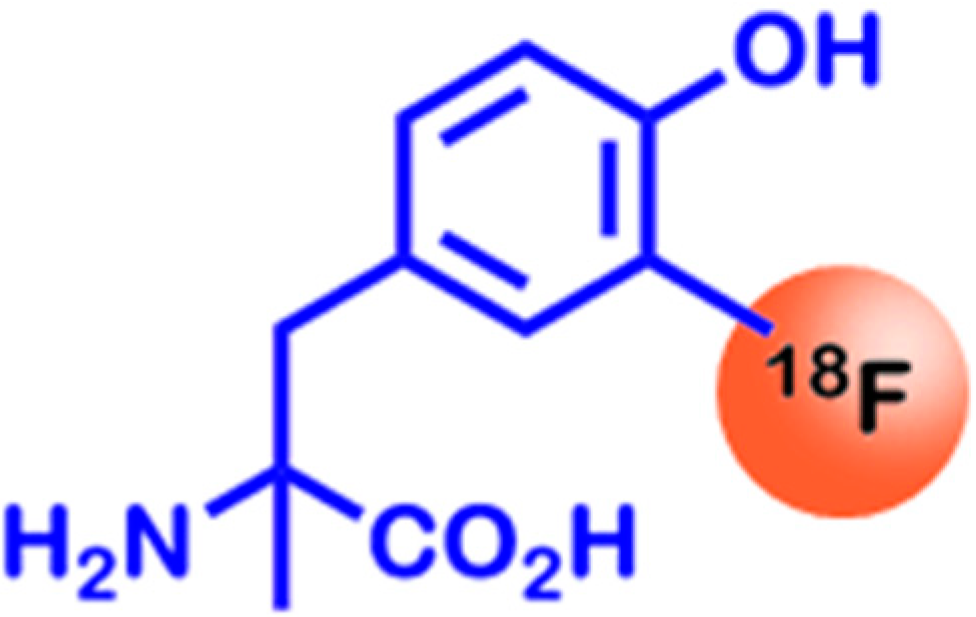
2.2. Amino Acid Utilization

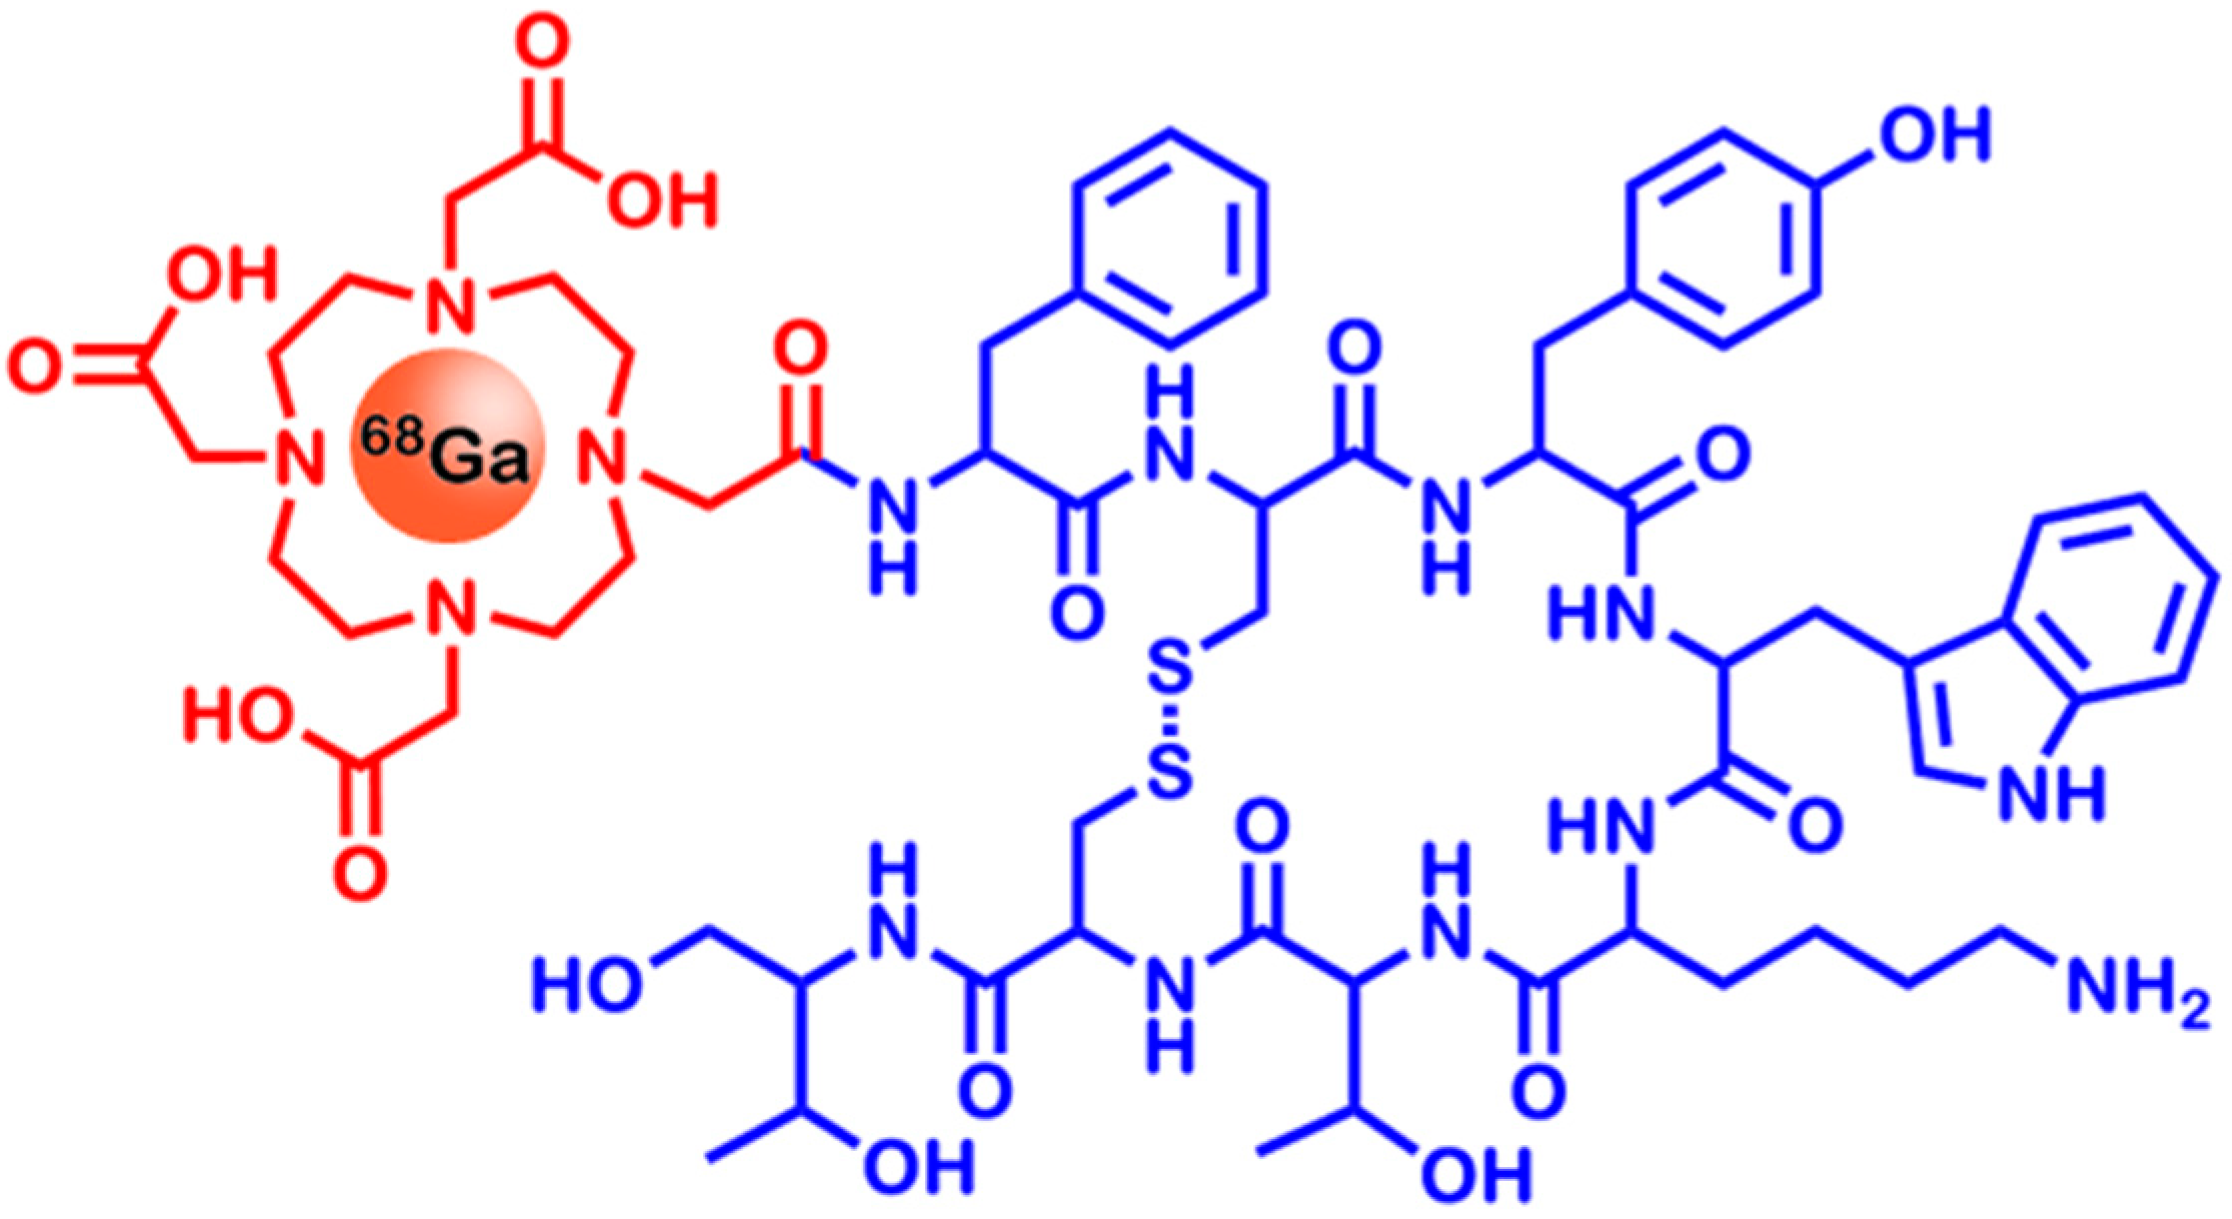
2.3. Somatostatin Receptors

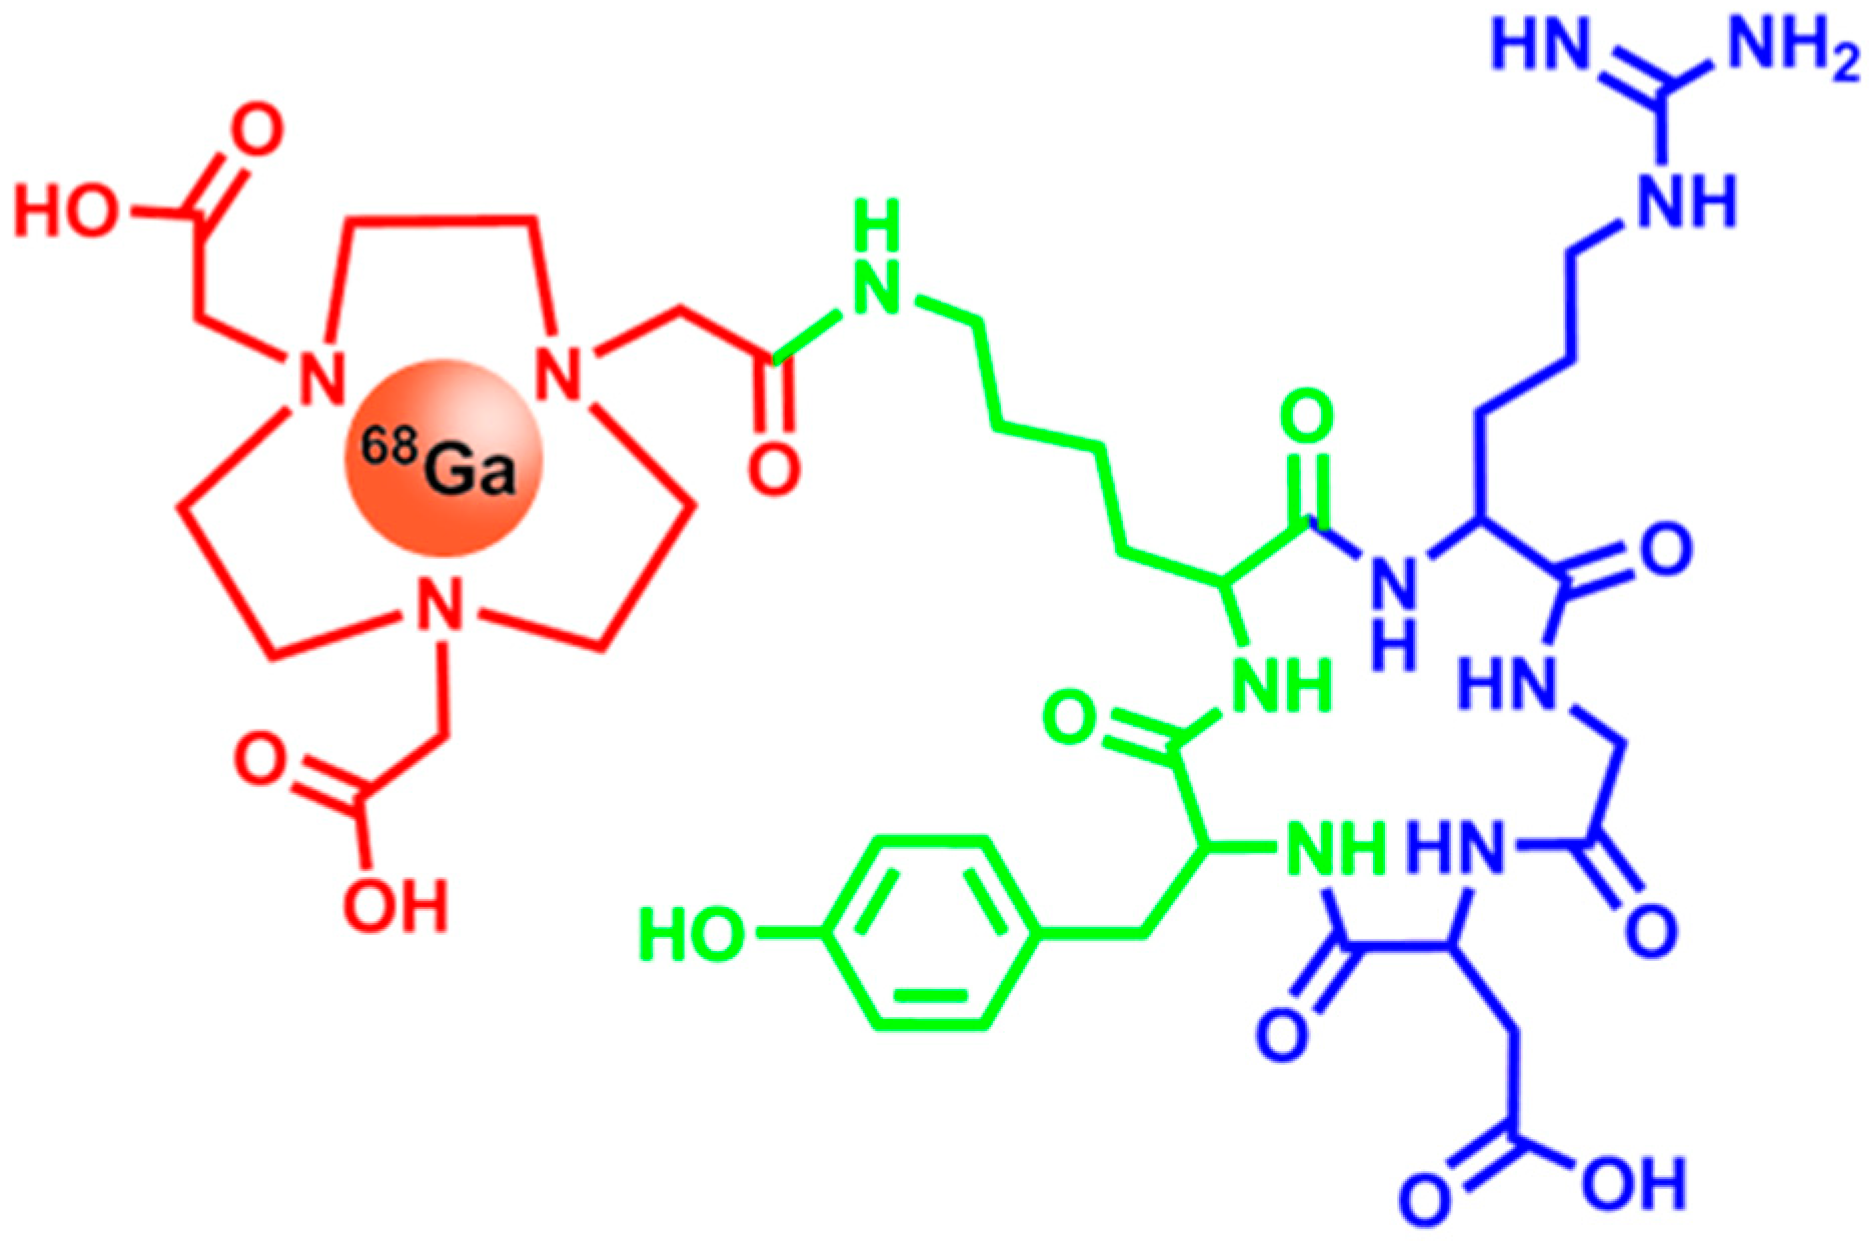
2.4. Integrins

2.5. Folate Receptors

| Cancer Type | Rate of FR Overexpression |
|---|---|
| Ovarian | 93% |
| Endometrial | 90% |
| Renal | 50% |
| Lung | 33% |
| Colorectal | 22% |
| Breast | 21% |

2.6. CD20

2.7. Her2
2.8. hNIS
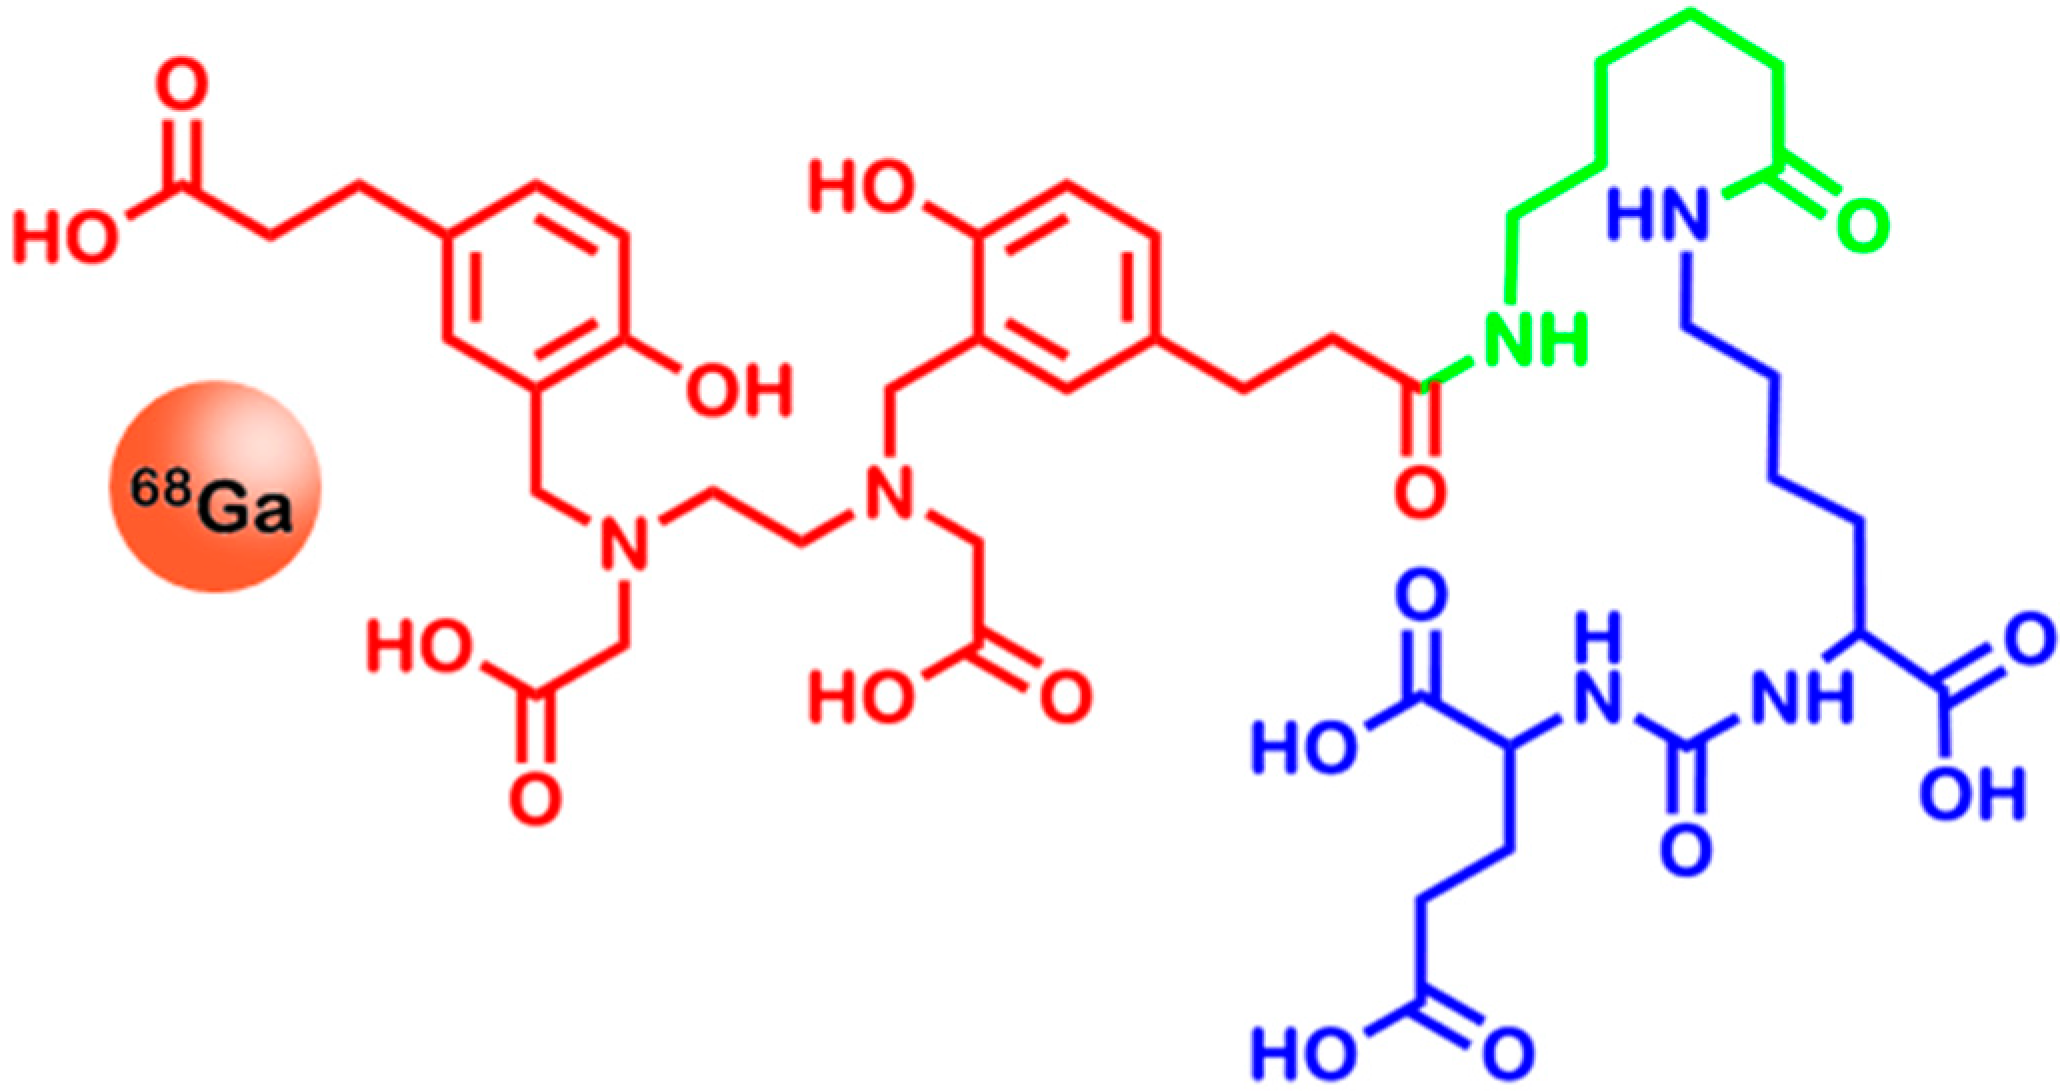
2.9. Prostate Specific Membrane Antigen

3. Methods for Molecular Imaging—An Overview
3.1. Computed Tomography (CT)
| Method | Spatial Resolution | Temporal Resolution | Sensitivity [mol/L] | Costs | Advantages | Drawbacks |
|---|---|---|---|---|---|---|
| CT | 50–200 µm | Minute | – | Low | Generation of anatomical images | It is difficult to generate functional, non-quantitative |
| MRI | 25–100 µm | Minute to hour | 10−3–10−5 | Very high | High spatial resolution, non-radioactive tracers | Low sensitivity |
| PET | 2–5 mm | Second to minute | 10−11–10−12 | Very high | The most sensitive imaging method, quantitative method, allows to use biologically relevant radionuclides | Imaging of large areas is expensive, low spatial resolution |
| SPECT | 7.5–10 mm | Minute | 10−10–10−11 | High | Simultaneous multi-probe imaging is possible | Low spatial resolution |
3.2. Magnetic Resonance Imaging (MRI)
3.3. Positron Emission Tomography (PET)
3.4. Single Photon Emission Computed Tomography (SPECT)
| Radionuclide | Decay | Half-Life | Energy | Application | Source |
|---|---|---|---|---|---|
| 11C | β+ | 20 min | 511 keV | Diagnosis (PET) | [7] |
| 13N | β+ | 10 min | 511 keV | Diagnosis (PET) | [7] |
| 18F | β+ | 110 min | 511 keV | Diagnosis (PET) | [7] |
| 64Cu | β+ | 12.7 h | 511 keV | Diagnosis (PET) | [7] |
| 67Ga | γ | 78 h | 93 keV | Diagnosis (SPECT) | [196] |
| 68Ga | β+ | 68 min | 511 keV | Diagnosis (PET) | [7] |
| 86Y | β+ | 14.7 h | 511 keV | Diagnosis (PET) | [197] |
| 89Zr | β+ | 3.3 days | 511 keV | Diagnosis (PET) | [127] |
| 90Y | β− | 2.7 days | 2.28 MeV | Therapy | [198] |
| 99mTc | γ | 6 h | 141 keV | Diagnosis (SPECT) | [199] |
| 111In | γ | 2.8 days | 171 keV | Diagnosis (SPECT) | [199] |
| 123I | γ | 13.2 h | 159 keV | Diagnosis (SPECT) | [200] |
| 124I | β+ | 4.18 days | 511 keV | Diagnosis (PET) | [7] |
| 131I | β− | 8 days | 0.61 MeV | Therapy | [201] |
| 177Lu | β− | 6.7 days | 0.5 MeV | Therapy | [198] |
| 201Tl | γ | 73 h | 80 keV | Diagnosis (SPECT) | [202] |
4. Conclusions
Author Contributions
Conflicts of Interest
References
- Shaw, E.C.; Johnson, P.W.M. Stratified medicine for cancer therapy. Drug Discov. Today 2012, 17, 261–268. [Google Scholar] [CrossRef] [PubMed]
- Kulasingam, V.; Diamandis, E.P. Strategies for discovering novel cancer biomarkers through utilization of emerging technologies. Nat. Clin. Pract. Oncol. 2008, 5, 588–599. [Google Scholar] [CrossRef] [PubMed]
- Ummanni, R.; Mundt, F.; Pospisil, H.; Venz, S.; Scharf, C.; Barett, C.; Falth, M.; Kollermann, J.; Walther, R.; Schlomm, T.; et al. Identification of clinically relevant protein targets in prostate cancer with 2D-DIGE coupled mass spectrometry and systems biology network platform. PLoS One 2011, 6, e16833. [Google Scholar] [CrossRef] [PubMed]
- Palma, P.; Cano, C.; Conde-Muino, R.; Comino, A.; Bueno, P.; Ferron, J.A.; Cuadros, M. Expression profiling of rectal tumors defines response to neoadjuvant treatment related genes. PLoS One 2014, 9, e112189. [Google Scholar] [CrossRef] [PubMed]
- Tan, H.T.; Lee, Y.H.; Chung, M.C. Cancer proteomics. Mass Spectrom. Rev. 2012, 31, 583–605. [Google Scholar] [CrossRef] [PubMed]
- Uhl, P.; Fricker, G.; Haberkorn, U.; Mier, W. Radionuclides in drug development. Drug Discov. Today 2014, 20, 198–208. [Google Scholar] [CrossRef] [PubMed]
- Ametamey, S.M.; Honer, M.; Schubiger, P.A. Molecular imaging with PET. Chem. Rev. 2008, 108, 1501–1516. [Google Scholar] [CrossRef] [PubMed]
- Massoud, T.F.; Gambhir, S.S. Molecular imaging in living subjects: Seeing fundamental biological processes in a new light. Genes Dev. 2003, 17, 545–580. [Google Scholar] [CrossRef] [PubMed]
- Weissleder, R.; Mahmood, U. Molecular imaging. Radiology 2001, 219, 316–333. [Google Scholar] [CrossRef] [PubMed]
- Wright, E.M.; Turk, E. The sodium/glucose cotransport family SLC5. Pflugers Arch. 2004, 447, 510–518. [Google Scholar] [CrossRef] [PubMed]
- Macheda, M.L.; Rogers, S.; Best, J.D. Molecular and cellular regulation of glucose transporter (GLUT) proteins in cancer. J. Cell. Physiol. 2005, 202, 654–662. [Google Scholar] [CrossRef] [PubMed]
- Joost, H.G.; Bell, G.I.; Best, J.D.; Birnbaum, M.J.; Charron, M.J.; Chen, Y.T.; Doege, H.; James, D.E.; Lodish, H.F.; Moley, K.H.; et al. Nomenclature of the GLUT/SLC2A family of sugar/polyol transport facilitators. Am. J. Physiol. Endocrinol. Metab. 2002, 282, E974–E976. [Google Scholar] [CrossRef] [PubMed]
- El Sayed, S.M.; Mahmoud, A.A.; El Sawy, S.A.; Abdelaal, E.A.; Fouad, A.M.; Yousif, R.S.; Hashim, M.S.; Hemdan, S.B.; Kadry, Z.M.; Abdelmoaty, M.A.; et al. Warburg effect increases steady-state ROS condition in cancer cells through decreasing their antioxidant capacities (anticancer effects of 3-bromopyruvate through antagonizing Warburg effect). Med. Hypotheses 2013, 81, 866–870. [Google Scholar] [CrossRef] [PubMed]
- Jang, M.; Kim, S.S.; Lee, J. Cancer cell metabolism: Implications for therapeutic targets. Exp. Mol. Med. 2013, 45, e45. [Google Scholar] [CrossRef] [PubMed]
- Mamede, M.; Higashi, T.; Kitaichi, M.; Ishizu, K.; Ishimori, T.; Nakamoto, Y.; Yanagihara, K.; Li, M.; Tanaka, F.; Wada, H.; et al. [18F]FDG uptake and PCNA, Glut-1, and Hexokinase-II expressions in cancers and inflammatory lesions of the lung. Neoplasia 2005, 7, 369–379. [Google Scholar] [CrossRef] [PubMed]
- Meller, J.; Sahlmann, C.O.; Scheel, A.K. 18F-FDG PET and PET/CT in fever of unknown origin. J. Nucl. Med. 2007, 48, 35–45. [Google Scholar] [PubMed]
- Horsman, M.R. Measurement of tumor oxygenation. Int. J. Radiat. Oncol. Biol. Phys. 1998, 42, 701–704. [Google Scholar] [CrossRef] [PubMed]
- Ganapathy, V.; Thangaraju, M.; Prasad, P.D. Nutrient transporters in cancer: Relevance to Warburg hypothesis and beyond. Pharmacol. Ther. 2009, 121, 29–40. [Google Scholar] [CrossRef] [PubMed]
- Teicher, B.A. Hypoxia and drug resistance. Cancer Metastasis Rev. 1994, 13, 139–168. [Google Scholar] [CrossRef] [PubMed]
- Hockel, M.; Schlenger, K.; Aral, B.; Mitze, M.; Schaffer, U.; Vaupel, P. Association between tumor hypoxia and malignant progression in advanced cancer of the uterine cervix. Cancer Res. 1996, 56, 4509–4515. [Google Scholar] [PubMed]
- Berg, J.M.; Tymoczko, J.L.; L., S. Section 17.3, The citric acid cycle is a source of biosynthetic precursors. In Biochemistry; W.H. Freeman and Company: New York, NY, USA, 2002. [Google Scholar]
- Gatenby, R.A.; Gillies, R.J. Why do cancers have high aerobic glycolysis? Nat. Rev. Cancer 2004, 4, 891–899. [Google Scholar] [CrossRef] [PubMed]
- Gatenby, R. Altered glucose metabolism and the invasive tumor phenotype. Int. J. Oncol. 1996, 8, 597–601. [Google Scholar] [PubMed]
- Vegran, F.; Boidot, R.; Michiels, C.; Sonveaux, P.; Feron, O. Lactate influx through the endothelial cell monocarboxylate transporter MCT1 supports an NF-κB/IL-8 pathway that drives tumor angiogenesis. Cancer Res. 2011, 71, 2550–2560. [Google Scholar] [CrossRef] [PubMed]
- Yamamoto, T.; Seino, Y.; Fukumoto, H.; Koh, G.; Yano, H.; Inagaki, N.; Yamada, Y.; Inoue, K.; Manabe, T.; Imura, H. Over-expression of facilitative glucose transporter genes in human cancer. Biochem. Biophys. Res. Commun. 1990, 170, 223–230. [Google Scholar] [CrossRef] [PubMed]
- Hennipman, A.; van Oirschot, B.A.; Smits, J.; Rijksen, G.; Staal, G.E. Glycolytic enzyme activities in breast cancer metastases. Tumour Biol. 1988, 9, 241–248. [Google Scholar] [CrossRef] [PubMed]
- Brophy, S.; Sheehan, K.M.; McNamara, D.A.; Deasy, J.; Bouchier-Hayes, D.J.; Kay, E.W. GLUT-1 expression and response to chemoradiotherapy in rectal cancer. Int. J. Cancer 2009, 125, 2778–2782. [Google Scholar] [CrossRef] [PubMed]
- Smith, T.A. FDG uptake, tumour characteristics and response to therapy: A review. Nucl. Med. Commun. 1998, 19, 97–105. [Google Scholar] [CrossRef] [PubMed]
- Pauwels, E.K.; Ribeiro, M.J.; Stoot, J.H.; McCready, V.R.; Bourguignon, M.; Maziere, B. FDG accumulation and tumor biology. Nucl. Med. Biol. 1998, 25, 317–322. [Google Scholar] [CrossRef] [PubMed]
- Nelson, C.A.; Wang, J.Q.; Leav, I.; Crane, P.D. The interaction among glucose transport, hexokinase, and glucose-6-phosphatase with respect to 3H-2-deoxyglucose retention in murine tumor models. Nucl. Med. Biol. 1996, 23, 533–541. [Google Scholar] [CrossRef] [PubMed]
- Baumann, M.; Jezussek, D.; Lang, T.; Richter, R.T.; Brand, K. Activities of phosphohexose isomerase and other glycolytic enzymes in normal and tumor tissue of patients with neoplastic diseases: Comparison with serum activities and correlation to tumor staging and grading. Tumour Biol. 1988, 9, 281–286. [Google Scholar] [CrossRef] [PubMed]
- Im, H.J.; Pak, K.; Cheon, G.J.; Kang, K.W.; Kim, S.J.; Kim, I.J.; Chung, J.K.; Kim, E.E.; Lee, D.S. Prognostic value of volumetric parameters of 18F-FDG PET in non-small-cell lung cancer: A meta-analysis. Eur. J. Nucl. Med. Mol. Imaging 2014, 42, 241–251. [Google Scholar] [CrossRef] [PubMed]
- Iakovou, I.P.; Giannoula, E. [Nuclear medicine in diagnosis of breast cancer]. Hell. J. Nucl. Med. 2014, 17, 221–227. [Google Scholar] [PubMed]
- Win, A.Z. Renal cell carcinoma metastasis to the gallbladder detected by FDG-PET/CT. J. Clin Med. Res. 2014, 6, 482–486. [Google Scholar] [PubMed]
- Gallamini, A.; Zwarthoed, C.; Borra, A. Positron emission tomography (PET) in oncology. Cancers (Basel) 2014, 6, 1821–1889. [Google Scholar] [CrossRef]
- Hawkins, R.A.; Hoh, C.K. PET FDG studies in oncology. Nucl. Med. Biol. 1994, 21, 739–747. [Google Scholar] [CrossRef] [PubMed]
- Fotiadis, D.; Kanai, Y.; Palacin, M. The SLC3 and SLC7 families of amino acid transporters. Mol. Asp. Med. 2013, 34, 139–158. [Google Scholar] [CrossRef]
- Closs, E.I.; Boissel, J.P.; Habermeier, A.; Rotmann, A. Structure and function of cationic amino acid transporters (CATs). J. Membr. Biol. 2006, 213, 67–77. [Google Scholar] [CrossRef] [PubMed]
- Closs, E.I. Expression, regulation and function of carrier proteins for cationic amino acids. Curr. Opin. Nephrol. Hypertens. 2002, 11, 99–107. [Google Scholar] [CrossRef] [PubMed]
- Closs, E.I.; Lyons, C.R.; Kelly, C.; Cunningham, J.M. Characterization of the third member of the MCAT family of cationic amino acid transporters. Identification of a domain that determines the transport properties of the MCAT proteins. J. Biol. Chem. 1993, 268, 20796–20800. [Google Scholar] [PubMed]
- Yanagida, O.; Kanai, Y.; Chairoungdua, A.; Kim, D.K.; Segawa, H.; Nii, T.; Cha, S.H.; Matsuo, H.; Fukushima, J.; Fukasawa, Y.; et al. Human l-type amino acid transporter 1 (LAT1): Characterization of function and expression in tumor cell lines. Biochim. Biophys. Acta 2001, 1514, 291–302. [Google Scholar] [CrossRef] [PubMed]
- Kanai, Y.; Segawa, H.; Miyamoto, K.; Uchino, H.; Takeda, E.; Endou, H. Expression cloning and characterization of a transporter for large neutral amino acids activated by the heavy chain of 4F2 antigen (CD98). J. Biol. Chem. 1998, 273, 23629–23632. [Google Scholar] [CrossRef] [PubMed]
- Fort, J.; de la Ballina, L.R.; Burghardt, H.E.; Ferrer-Costa, C.; Turnay, J.; Ferrer-Orta, C.; Uson, I.; Zorzano, A.; Fernandez-Recio, J.; Orozco, M.; et al. The structure of human 4F2hc ectodomain provides a model for homodimerization and electrostatic interaction with plasma membrane. J. Biol. Chem. 2007, 282, 31444–31452. [Google Scholar] [CrossRef] [PubMed]
- Palacin, M.; Kanai, Y. The ancillary proteins of HATs: SLC3 family of amino acid transporters. Pflugers Arch. 2004, 447, 490–494. [Google Scholar] [CrossRef] [PubMed]
- Uno, K.; Kuwabara, H.; Terado, Y.; Kojima, K.; Kawakami, T.; Kamma, H.; Sakurai, H.; Sakamoto, A.; Kurata, A. Divergent expression of l-type amino acid transporter 1 during uterine cervical carcinogenesis. Hum. Pathol. 2011, 42, 1660–1666. [Google Scholar] [CrossRef] [PubMed]
- Ichinoe, M.; Mikami, T.; Yoshida, T.; Igawa, I.; Tsuruta, T.; Nakada, N.; Anzai, N.; Suzuki, Y.; Endou, H.; Okayasu, I. High expression of l-type amino-acid transporter 1 (LAT1) in gastric carcinomas: Comparison with non-cancerous lesions. Pathol. Int. 2011, 61, 281–289. [Google Scholar] [CrossRef] [PubMed]
- Yoon, J.H.; Kim, I.J.; Kim, H.; Kim, H.J.; Jeong, M.J.; Ahn, S.G.; Kim, S.A.; Lee, C.H.; Choi, B.K.; Kim, J.K.; et al. Amino acid transport system L is differently expressed in human normal oral keratinocytes and human oral cancer cells. Cancer Lett. 2005, 222, 237–245. [Google Scholar] [CrossRef] [PubMed]
- Kaira, K.; Oriuchi, N.; Imai, H.; Shimizu, K.; Yanagitani, N.; Sunaga, N.; Hisada, T.; Tanaka, S.; Ishizuka, T.; Kanai, Y.; et al. Prognostic significance of l-type amino acid transporter 1 expression in resectable stage I–III nonsmall cell lung cancer. Br. J. Cancer 2008, 98, 742–748. [Google Scholar] [CrossRef] [PubMed]
- Kaira, K.; Oriuchi, N.; Takahashi, T.; Nakagawa, K.; Ohde, Y.; Okumura, T.; Murakami, H.; Shukuya, T.; Kenmotsu, H.; Naito, T.; et al. l-type amino acid transporter 1 (LAT1) expression in malignant pleural mesothelioma. Anticancer Res. 2011, 31, 4075–4082. [Google Scholar] [PubMed]
- Kekuda, R.; Prasad, P.D.; Fei, Y.J.; Torres-Zamorano, V.; Sinha, S.; Yang-Feng, T.L.; Leibach, F.H.; Ganapathy, V. Cloning of the sodium-dependent, broad-scope, neutral amino acid transporter Bo from a human placental choriocarcinoma cell line. J. Biol. Chem. 1996, 271, 18657–18661. [Google Scholar] [CrossRef] [PubMed]
- Fuchs, B.C.; Bode, B.P. Amino acid transporters ASCT2 and LAT1 in cancer: Partners in crime? Semin. Cancer Biol. 2005, 15, 254–266. [Google Scholar] [CrossRef] [PubMed]
- Li, R.; Younes, M.; Frolov, A.; Wheeler, T.M.; Scardino, P.; Ohori, M.; Ayala, G. Expression of neutral amino acid transporter ASCT2 in human prostate. Anticancer Res. 2003, 23, 3413–3418. [Google Scholar] [PubMed]
- Sundin, A.; Garske, U.; Orlefors, H. Nuclear imaging of neuroendocrine tumours. Best Pract. Res. Clin. Endocrinol. Metab. 2007, 21, 69–85. [Google Scholar] [CrossRef] [PubMed]
- Huang, C.; McConathy, J. Radiolabeled amino acids for oncologic imaging. J. Nucl. Med. 2013, 54, 1007–1010. [Google Scholar] [CrossRef] [PubMed]
- McConathy, J.; Yu, W.; Jarkas, N.; Seo, W.; Schuster, D.M.; Goodman, M.M. Radiohalogenated nonnatural amino acids as PET and SPECT tumor imaging agents. Med. Res. Rev. 2012, 32, 868–905. [Google Scholar] [CrossRef] [PubMed]
- Shikano, N.; Kanai, Y.; Kawai, K.; Inatomi, J.; Kim, D.K.; Ishikawa, N.; Endou, H. Isoform selectivity of 3–125I-iodo-α-methyl-l-tyrosine membrane transport in human l-type amino acid transporters. J. Nucl. Med. 2003, 44, 244–246. [Google Scholar] [PubMed]
- Pauleit, D.; Floeth, F.; Tellmann, L.; Hamacher, K.; Hautzel, H.; Muller, H.W.; Coenen, H.H.; Langen, K.J. Comparison of O-(2–18F-fluoroethyl)-l-tyrosine PET and 3–123I-iodo-α-methyl-l-tyrosine SPECT in brain tumors. J. Nucl. Med. 2004, 45, 374–381. [Google Scholar] [PubMed]
- Wiriyasermkul, P.; Nagamori, S.; Tominaga, H.; Oriuchi, N.; Kaira, K.; Nakao, H.; Kitashoji, T.; Ohgaki, R.; Tanaka, H.; Endou, H.; et al. Transport of 3-fluoro-l-α-methyl-tyrosine by tumor-upregulated l-type amino acid transporter 1: A cause of the tumor uptake in PET. J. Nucl. Med. 2012, 53, 1253–1261. [Google Scholar] [CrossRef] [PubMed]
- Kaira, K.; Oriuchi, N.; Shimizu, K.; Ishikita, T.; Higuchi, T.; Imai, H.; Yanagitani, N.; Sunaga, N.; Hisada, T.; Ishizuka, T.; et al. Correlation of angiogenesis with 18F-FMT and 18F-FDG uptake in non-small cell lung cancer. Cancer Sci. 2009, 100, 753–758. [Google Scholar] [CrossRef] [PubMed]
- Imai, H.; Kaira, K.; Oriuchi, N.; Shimizu, K.; Tominaga, H.; Yanagitani, N.; Sunaga, N.; Ishizuka, T.; Nagamori, S.; Promchan, K.; et al. Inhibition of l-type amino acid transporter 1 has antitumor activity in non-small cell lung cancer. Anticancer Res. 2010, 30, 4819–4828. [Google Scholar] [PubMed]
- Brazeau, P.; Vale, W.; Burgus, R.; Ling, N.; Butcher, M.; Rivier, J.; Guillemin, R. Hypothalamic polypeptide that inhibits the secretion of immunoreactive pituitary growth hormone. Science 1973, 179, 77–79. [Google Scholar] [CrossRef] [PubMed]
- Reichlin, S. Secretion of somatostatin and its physiologic function. J. Lab. Clin. Med. 1987, 109, 320–326. [Google Scholar] [PubMed]
- Reubi, J.C.; Waser, B.; Liu, Q.; Laissue, J.A.; Schonbrunn, A. Subcellular distribution of somatostatin sst2A receptors in human tumors of the nervous and neuroendocrine systems: Membranous versus intracellular location. J. Clin. Endocrinol. Metab. 2000, 85, 3882–3891. [Google Scholar] [PubMed]
- Lüllmann, H.; Mohr, K.; Hein, L. Hormonsystem. In Pharmakologie und Toxikologie; 2010; Volume 17, pp. 395–451. [Google Scholar]
- Reubi, J.C.; Waser, B.; Schaer, J.C.; Laissue, J.A. Somatostatin receptor sst1–sst5 expression in normal and neoplastic human tissues using receptor autoradiography with subtype-selective ligands. Eur. J. Nucl. Med. 2001, 28, 836–846. [Google Scholar] [CrossRef] [PubMed]
- Nouel, D.; Gaudriault, G.; Houle, M.; Reisine, T.; Vincent, J.P.; Mazella, J.; Beaudet, A. Differential internalization of somatostatin in COS-7 cells transfected with SST1 and SST2 receptor subtypes: A confocal microscopic study using novel fluorescent somatostatin derivatives. Endocrinology 1997, 138, 296–306. [Google Scholar] [PubMed]
- Reichlin, S. Somatostatin. N. Engl. J. Med. 1983, 309, 1495–1501. [Google Scholar] [CrossRef] [PubMed]
- Delaunoit, T.; Rubin, J.; Neczyporenko, F.; Erlichman, C.; Hobday, T.J. Somatostatin analogues in the treatment of gastroenteropancreatic neuroendocrine tumors. Mayo Clin. Proc. 2005, 80, 502–506. [Google Scholar] [CrossRef] [PubMed]
- Vale, W.; Rivier, J.; Ling, N.; Brown, M. Biologic and immunologic activities and applications of somatostatin analogs. Metabolism 1978, 27, 1391–1401. [Google Scholar] [CrossRef] [PubMed]
- Bauer, W.; Briner, U.; Doepfner, W.; Haller, R.; Huguenin, R.; Marbach, P.; Petcher, T.J.; Pless, J. SMS 201–995: A very potent and selective octapeptide analogue of somatostatin with prolonged action. Life Sci. 1982, 31, 1133–1140. [Google Scholar] [CrossRef] [PubMed]
- Modlin, I.M.; Pavel, M.; Kidd, M.; Gustafsson, B.I. Review article: Somatostatin analogues in the treatment of gastroenteropancreatic neuroendocrine (carcinoid) tumours. Aliment. Pharmacol. Ther. 2010, 31, 169–188. [Google Scholar] [PubMed]
- Frilling, A.; Weber, F.; Saner, F.; Bockisch, A.; Hofmann, M.; Mueller-Brand, J.; Broelsch, C.E. Treatment with (90)Y- and (177)Lu-DOTATOC in patients with metastatic neuroendocrine tumors. Surgery 2006, 140, 968–976. [Google Scholar] [CrossRef] [PubMed]
- Antunes, P.; Ginj, M.; Zhang, H.; Waser, B.; Baum, R.P.; Reubi, J.C.; Maecke, H. Are radiogallium-labelled DOTA-conjugated somatostatin analogues superior to those labelled with other radiometals? Eur. J. Nucl. Med. Mol. Imaging 2007, 34, 982–993. [Google Scholar] [CrossRef] [PubMed]
- Froidevaux, S.; Eberle, A.N.; Christe, M.; Sumanovski, L.; Heppeler, A.; Schmitt, J.S.; Eisenwiener, K.; Beglinger, C.; Macke, H.R. Neuroendocrine tumor targeting: Study of novel gallium-labeled somatostatin radiopeptides in a rat pancreatic tumor model. Int. J. Cancer 2002, 98, 930–937. [Google Scholar] [CrossRef] [PubMed]
- Bruns, C.; Lewis, I.; Briner, U.; Meno-Tetang, G.; Weckbecker, G. SOM230: A novel somatostatin peptidomimetic with broad somatotropin release inhibiting factor (SRIF) receptor binding and a unique antisecretory profile. Eur. J. Endocrinol. 2002, 146, 707–716. [Google Scholar] [CrossRef] [PubMed]
- Takada, Y.; Ye, X.; Simon, S. The integrins. Genome Biol. 2007, 8, 215. [Google Scholar] [CrossRef] [PubMed]
- Hynes, R.O. Integrins: Bidirectional, allosteric signaling machines. Cell 2002, 110, 673–687. [Google Scholar] [CrossRef] [PubMed]
- Luo, B.H.; Carman, C.V.; Springer, T.A. Structural basis of integrin regulation and signaling. Annu. Rev. Immunol. 2007, 25, 619–647. [Google Scholar] [CrossRef] [PubMed]
- Barczyk, M.; Carracedo, S.; Gullberg, D. Integrins. Cell. Tissue Res. 2010, 339, 269–280. [Google Scholar] [CrossRef] [PubMed]
- Guo, W.; Giancotti, F.G. Integrin signalling during tumour progression. Nat. Rev. Mol. Cell. Biol. 2004, 5, 816–826. [Google Scholar] [CrossRef] [PubMed]
- Miranti, C.K.; Brugge, J.S. Sensing the environment: A historical perspective on integrin signal transduction. Nat. Cell. Biol. 2002, 4, E83–E90. [Google Scholar] [CrossRef] [PubMed]
- Hsu, M.Y.; Shih, D.T.; Meier, F.E.; van Belle, P.; Hsu, J.Y.; Elder, D.E.; Buck, C.A.; Herlyn, M. Adenoviral gene transfer of β3 integrin subunit induces conversion from radial to vertical growth phase in primary human melanoma. Am. J. Pathol. 1998, 153, 1435–1442. [Google Scholar] [CrossRef] [PubMed]
- Cai, W.; Niu, G.; Chen, X. Imaging of integrins as biomarkers for tumor angiogenesis. Curr. Pharm. Des. 2008, 14, 2943–2973. [Google Scholar] [CrossRef] [PubMed]
- Gladson, C.L.; Cheresh, D.A. Glioblastoma expression of vitronectin and the αvβ3 integrin. Adhesion mechanism for transformed glial cells. J. Clin. Investig. 1991, 88, 1924–1932. [Google Scholar] [CrossRef] [PubMed]
- Albelda, S.M.; Mette, S.A.; Elder, D.E.; Stewart, R.; Damjanovich, L.; Herlyn, M.; Buck, C.A. Integrin distribution in malignant melanoma: Association of the β3 subunit with tumor progression. Cancer Res. 1990, 50, 6757–6764. [Google Scholar] [PubMed]
- Sutcliffe-Goulden, J.L.; O’Doherty, M.J.; Marsden, P.K.; Hart, I.R.; Marshall, J.F.; Bansal, S.S. Rapid solid phase synthesis and biodistribution of 18F-labelled linear peptides. Eur. J. Nucl. Med. Mol. Imaging 2002, 29, 754–759. [Google Scholar] [CrossRef] [PubMed]
- Cai, H.; Conti, P.S. RGD-based PET tracers for imaging receptor integrin αvβ3 expression. J. Label. Compd. Radiopharm. 2013, 56, 264–279. [Google Scholar] [CrossRef]
- Aumailley, M.; Gurrath, M.; Muller, G.; Calvete, J.; Timpl, R.; Kessler, H. Arg-Gly-Asp constrained within cyclic pentapeptides. Strong and selective inhibitors of cell adhesion to vitronectin and laminin fragment P1. FEBS Lett. 1991, 291, 50–54. [Google Scholar] [CrossRef] [PubMed]
- Haubner, R.H.; Wester, H.J.; Weber, W.A.; Schwaiger, M. Radiotracer-based strategies to image angiogenesis. Q. J. Nucl. Med. 2003, 47, 189–199. [Google Scholar] [PubMed]
- Wadas, T.J.; Wong, E.H.; Weisman, G.R.; Anderson, C.J. Coordinating radiometals of copper, gallium, indium, yttrium, and zirconium for PET and SPECT imaging of disease. Chem. Rev. 2010, 110, 2858–2902. [Google Scholar] [CrossRef] [PubMed]
- Decristoforo, C.; Hernandez Gonzalez, I.; Carlsen, J.; Rupprich, M.; Huisman, M.; Virgolini, I.; Wester, H.J.; Haubner, R. 68Ga- and 111In-labelled DOTA-RGD peptides for imaging of αvβ3 integrin expression. Eur. J. Nucl. Med. Mol. Imaging 2008, 35, 1507–1515. [Google Scholar] [CrossRef] [PubMed]
- Knetsch, P.A.; Petrik, M.; Griessinger, C.M.; Rangger, C.; Fani, M.; Kesenheimer, C.; von Guggenberg, E.; Pichler, B.J.; Virgolini, I.; Decristoforo, C.; et al. [68Ga]NODAGA-RGD for imaging αvβ3 integrin expression. Eur. J. Nucl. Med. Mol. Imaging 2011, 38, 1303–1312. [Google Scholar] [CrossRef] [PubMed]
- Davis, R.E.; Nicol, D.J. Folic acid. Int. J. Biochem. 1988, 20, 133–139. [Google Scholar] [CrossRef] [PubMed]
- Zhao, R.; Matherly, L.H.; Goldman, I.D. Membrane transporters and folate homeostasis: Intestinal absorption and transport into systemic compartments and tissues. Expert Rev. Mol. Med. 2009, 11, e4. [Google Scholar] [CrossRef] [PubMed]
- Westerhof, G.R.; Rijnboutt, S.; Schornagel, J.H.; Pinedo, H.M.; Peters, G.J.; Jansen, G. Functional activity of the reduced folate carrier in KB, MA104, and IGROV-I cells expressing folate-binding protein. Cancer Res. 1995, 55, 3795–3802. [Google Scholar] [PubMed]
- Qiu, A.; Jansen, M.; Sakaris, A.; Min, S.H.; Chattopadhyay, S.; Tsai, E.; Sandoval, C.; Zhao, R.; Akabas, M.H.; Goldman, I.D. Identification of an intestinal folate transporter and the molecular basis for hereditary folate malabsorption. Cell 2006, 127, 917–928. [Google Scholar] [CrossRef] [PubMed]
- Wang, X.; Shen, F.; Freisheim, J.H.; Gentry, L.E.; Ratnam, M. Differential stereospecificities and affinities of folate receptor isoforms for folate compounds and antifolates. Biochem. Pharmacol. 1992, 44, 1898–1901. [Google Scholar] [CrossRef] [PubMed]
- Rothberg, K.G.; Ying, Y.S.; Kolhouse, J.F.; Kamen, B.A.; Anderson, R.G. The glycophospholipid-linked folate receptor internalizes folate without entering the clathrin-coated pit endocytic pathway. J. Cell Biol. 1990, 110, 637–649. [Google Scholar] [CrossRef] [PubMed]
- Toffoli, G.; Cernigoi, C.; Russo, A.; Gallo, A.; Bagnoli, M.; Boiocchi, M. Overexpression of folate binding protein in ovarian cancers. Int. J. Cancer 1997, 74, 193–198. [Google Scholar] [CrossRef] [PubMed]
- Garin-Chesa, P.; Campbell, I.; Saigo, P.E.; Lewis, J.L., Jr.; Old, L.J.; Rettig, W.J. Trophoblast and ovarian cancer antigen LK26. Sensitivity and specificity in immunopathology and molecular identification as a folate-binding protein. Am. J. Pathol. 1993, 142, 557–567. [Google Scholar] [PubMed]
- Sudimack, J.; Lee, R.J. Targeted drug delivery via the folate receptor. Adv. Drug Deliv. Rev. 2000, 41, 147–162. [Google Scholar] [CrossRef] [PubMed]
- Gigant, B.; Wang, C.; Ravelli, R.B.; Roussi, F.; Steinmetz, M.O.; Curmi, P.A.; Sobel, A.; Knossow, M. Structural basis for the regulation of tubulin by vinblastine. Nature 2005, 435, 519–522. [Google Scholar] [CrossRef] [PubMed]
- Marchetti, C.; Palaia, I.; Giorgini, M.; de Medici, C.; Iadarola, R.; Vertechy, L.; Domenici, L.; di Donato, V.; Tomao, F.; Muzii, L.; et al. Targeted drug delivery via folate receptors in recurrent ovarian cancer: A review. OncoTargets Ther. 2014, 7, 1223–1236. [Google Scholar] [CrossRef]
- Maurer, A.H.; Elsinga, P.; Fanti, S.; Nguyen, B.; Oyen, W.J.; Weber, W.A. Imaging the folate receptor on cancer cells with 99mTc-etarfolatide: Properties, clinical use, and future potential of folate receptor imaging. J. Nucl. Med. 2014, 55, 701–704. [Google Scholar] [CrossRef] [PubMed]
- Morris, R.T.; Joyrich, R.N.; Naumann, R.W.; Shah, N.P.; Maurer, A.H.; Strauss, H.W.; Uszler, J.M.; Symanowski, J.T.; Ellis, P.R.; Harb, W.A. Phase II study of treatment of advanced ovarian cancer with folate-receptor-targeted therapeutic (vintafolide) and companion SPECT-based imaging agent (99mTc-etarfolatide). Ann. Oncol. 2014, 25, 852–858. [Google Scholar] [CrossRef] [PubMed]
- Naumann, R.W.; Coleman, R.L.; Burger, R.A.; Sausville, E.A.; Kutarska, E.; Ghamande, S.A.; Gabrail, N.Y.; Depasquale, S.E.; Nowara, E.; Gilbert, L.; et al. PRECEDENT: A randomized phase II trial comparing vintafolide (EC145) and pegylated liposomal doxorubicin (PLD) in combination versus PLD alone in patients with platinum-resistant ovarian cancer. J. Clin. Oncol. 2013, 31, 4400–4406. [Google Scholar] [CrossRef] [PubMed]
- Reff, M.E.; Carner, K.; Chambers, K.S.; Chinn, P.C.; Leonard, J.E.; Raab, R.; Newman, R.A.; Hanna, N.; Anderson, D.R. Depletion of B cells in vivo by a chimeric mouse human monoclonal antibody to CD20. Blood 1994, 83, 435–445. [Google Scholar] [PubMed]
- Anderson, K.C.; Bates, M.P.; Slaughenhoupt, B.L.; Pinkus, G.S.; Schlossman, S.F.; Nadler, L.M. Expression of human B cell-associated antigens on leukemias and lymphomas: A model of human B cell differentiation. Blood 1984, 63, 1424–1433. [Google Scholar] [PubMed]
- Tedder, T.F.; Boyd, A.W.; Freedman, A.S.; Nadler, L.M.; Schlossman, S.F. The B cell surface molecule B1 is functionally linked with B cell activation and differentiation. J. Immunol. 1985, 135, 973–979. [Google Scholar] [PubMed]
- Golay, J.T.; Clark, E.A.; Beverley, P.C. The CD20 (Bp35) antigen is involved in activation of B cells from the G0 to the G1 phase of the cell cycle. J. Immunol. 1985, 135, 3795–3801. [Google Scholar] [PubMed]
- Kanzaki, M.; Shibata, H.; Mogami, H.; Kojima, I. Expression of calcium-permeable cation channel CD20 accelerates progression through the G1 phase in Balb/c 3T3 cells. J. Biol. Chem. 1995, 270, 13099–13104. [Google Scholar] [CrossRef] [PubMed]
- Kanzaki, M.; Lindorfer, M.A.; Garrison, J.C.; Kojima, I. Activation of the calcium-permeable cation channel CD20 by α subunits of the Gi protein. J. Biol. Chem. 1997, 272, 14733–14739. [Google Scholar] [CrossRef] [PubMed]
- Golay, J.; Cusmano, G.; Introna, M. Independent regulation of c-myc, B-myb, and c-myb gene expression by inducers and inhibitors of proliferation in human B lymphocytes. J. Immunol. 1992, 149, 300–308. [Google Scholar] [PubMed]
- White, M.W.; McConnell, F.; Shu, G.L.; Morris, D.R.; Clark, E.A. Activation of dense human tonsilar B cells. Induction of c-myc gene expression via two distinct signal transduction pathways. J. Immunol. 1991, 146, 846–853. [Google Scholar] [PubMed]
- Von Schilling, C. Immunotherapy with anti-CD20 compounds. Semin. Cancer Biol. 2003, 13, 211–222. [Google Scholar] [CrossRef] [PubMed]
- Maloney, D.G. Anti-CD20 antibody therapy for B-cell lymphomas. N. Engl. J. Med. 2012, 366, 2008–2016. [Google Scholar] [CrossRef] [PubMed]
- Gatter, K.; Warnke, R. Diffuse large B cell lymphoma. In Pathology and Genetics of Tumors of Haematopoietic and Lymphoid Tissues; Jaffe, E., Harris, N., Stein, H., Vardiman, J., Eds.; IARC Press: Lyon, France, 2001. [Google Scholar]
- Goldsmith, S.J. Radioimmunotherapy of lymphoma: Bexxar and Zevalin. Semin. Nucl. Med. 2010, 40, 122–135. [Google Scholar] [CrossRef] [PubMed]
- Witzig, T.E.; Gordon, L.I.; Cabanillas, F.; Czuczman, M.S.; Emmanouilides, C.; Joyce, R.; Pohlman, B.L.; Bartlett, N.L.; Wiseman, G.A.; Padre, N.; et al. Randomized controlled trial of yttrium-90-labeled ibritumomab tiuxetan radioimmunotherapy versus rituximab immunotherapy for patients with relapsed or refractory low-grade, follicular, or transformed B-cell non-Hodgkin’s lymphoma. J. Clin. Oncol. 2002, 20, 2453–2463. [Google Scholar] [CrossRef] [PubMed]
- Conti, P.S.; White, C.; Pieslor, P.; Molina, A.; Aussie, J.; Foster, P. The role of imaging with 111In-ibritumomab tiuxetan in the ibritumomab tiuxetan (Zevalin) regimen: Results from a Zevalin imaging registry. J. Nucl. Med. 2005, 46, 1812–1818. [Google Scholar] [PubMed]
- Citri, A.; Yarden, Y. EGF-ERBB signalling: Towards the systems level. Nat. Rev. Mol. Cell. Biol. 2006, 7, 505–516. [Google Scholar] [CrossRef] [PubMed]
- Hynes, N.E.; Lane, H.A. ERBB receptors and cancer: The complexity of targeted inhibitors. Nat. Rev. Cancer 2005, 5, 341–354. [Google Scholar] [CrossRef] [PubMed]
- Scholl, S.; Beuzeboc, P.; Pouillart, P. Targeting HER2 in other tumor types. Ann. Oncol. 2001, 12, S81–S87. [Google Scholar] [CrossRef] [PubMed]
- Ignatiadis, M.; Desmedt, C.; Sotiriou, C.; de Azambuja, E.; Piccart, M. HER-2 as a target for breast cancer therapy. Clin. Cancer Res. 2009, 15, 1848–1852. [Google Scholar] [CrossRef] [PubMed]
- Capala, J.; Bouchelouche, K. Molecular imaging of HER2-positive breast cancer: A step toward an individualized “image and treat” strategy. Curr. Opin. Oncol. 2010, 22, 559–566. [Google Scholar] [CrossRef] [PubMed]
- Chari, R.V.; Miller, M.L.; Widdison, W.C. Antibody-drug conjugates: An emerging concept in cancer therapy. Angew. Chem. Int. Ed. Engl. 2014, 53, 3796–3827. [Google Scholar] [CrossRef] [PubMed]
- Zhang, Y.; Hong, H.; Cai, W. PET tracers based on Zirconium-89. Curr. Radiopharm. 2011, 4, 131–139. [Google Scholar] [CrossRef] [PubMed]
- Dijkers, E.C.; Kosterink, J.G.; Rademaker, A.P.; Perk, L.R.; van Dongen, G.A.; Bart, J.; de Jong, J.R.; de Vries, E.G.; Lub-de Hooge, M.N. Development and characterization of clinical-grade 89Zr-trastuzumab for HER2/neu immunoPET imaging. J. Nucl. Med. 2009, 50, 974–981. [Google Scholar] [CrossRef] [PubMed]
- Dijkers, E.C.; Oude Munnink, T.H.; Kosterink, J.G.; Brouwers, A.H.; Jager, P.L.; de Jong, J.R.; van Dongen, G.A.; Schroder, C.P.; Lub-de Hooge, M.N.; de Vries, E.G. Biodistribution of 89Zr-trastuzumab and PET imaging of HER2-positive lesions in patients with metastatic breast cancer. Clin. Pharmacol. Ther. 2010, 87, 586–592. [Google Scholar] [CrossRef] [PubMed]
- Tamura, K.; Kurihara, H.; Yonemori, K.; Tsuda, H.; Suzuki, J.; Kono, Y.; Honda, N.; Kodaira, M.; Yamamoto, H.; Yunokawa, M.; et al. 64Cu-DOTA-trastuzumab PET imaging in patients with HER2-positive breast cancer. J. Nucl. Med. 2013, 54, 1869–1875. [Google Scholar] [CrossRef] [PubMed]
- Lofblom, J.; Feldwisch, J.; Tolmachev, V.; Carlsson, J.; Stahl, S.; Frejd, F.Y. Affibody molecules: Engineered proteins for therapeutic, diagnostic and biotechnological applications. FEBS Lett. 2010, 584, 2670–2680. [Google Scholar] [CrossRef] [PubMed]
- Uhlen, M.; Guss, B.; Nilsson, B.; Gatenbeck, S.; Philipson, L.; Lindberg, M. Complete sequence of the staphylococcal gene encoding protein A. A gene evolved through multiple duplications. J. Biol. Chem. 1984, 259, 1695–1702. [Google Scholar] [PubMed]
- Nilsson, B.; Moks, T.; Jansson, B.; Abrahmsen, L.; Elmblad, A.; Holmgren, E.; Henrichson, C.; Jones, T.A.; Uhlen, M. A synthetic IgG-binding domain based on staphylococcal protein A. Protein Eng. 1987, 1, 107–113. [Google Scholar] [CrossRef] [PubMed]
- Feldwisch, J.; Tolmachev, V.; Lendel, C.; Herne, N.; Sjoberg, A.; Larsson, B.; Rosik, D.; Lindqvist, E.; Fant, G.; Hoiden-Guthenberg, I.; et al. Design of an optimized scaffold for affibody molecules. J. Mol. Biol. 2010, 398, 232–247. [Google Scholar] [CrossRef] [PubMed]
- Lundberg, E.; Hoiden-Guthenberg, I.; Larsson, B.; Uhlen, M.; Graslund, T. Site-specifically conjugated anti-HER2 Affibody molecules as one-step reagents for target expression analyses on cells and xenograft samples. J. Immunol. Methods 2007, 319, 53–63. [Google Scholar] [CrossRef] [PubMed]
- Baum, R.P.; Prasad, V.; Muller, D.; Schuchardt, C.; Orlova, A.; Wennborg, A.; Tolmachev, V.; Feldwisch, J. Molecular imaging of HER2-expressing malignant tumors in breast cancer patients using synthetic 111In- or 68Ga-labeled affibody molecules. J. Nucl. Med. 2010, 51, 892–897. [Google Scholar] [CrossRef] [PubMed]
- Tolmachev, V.; Velikyan, I.; Sandstrom, M.; Orlova, A. A HER2-binding Affibody molecule labelled with 68Ga for PET imaging: Direct in vivo comparison with the 111In-labelled analogue. Eur. J. Nucl. Med. Mol. Imaging 2010, 37, 1356–1367. [Google Scholar] [CrossRef] [PubMed]
- Ahlgren, S.; Orlova, A.; Wallberg, H.; Hansson, M.; Sandstrom, M.; Lewsley, R.; Wennborg, A.; Abrahmsen, L.; Tolmachev, V.; Feldwisch, J. Targeting of HER2-expressing tumors using 111In-ABY-025, a second-generation affibody molecule with a fundamentally reengineered scaffold. J. Nucl. Med. 2010, 51, 1131–1138. [Google Scholar] [CrossRef] [PubMed]
- Sorensen, J.; Sandberg, D.; Sandstrom, M.; Wennborg, A.; Feldwisch, J.; Tolmachev, V.; Astrom, G.; Lubberink, M.; Garske-Roman, U.; Carlsson, J.; et al. First-in-human molecular imaging of HER2 expression in breast cancer metastases using the 111In-ABY-025 affibody molecule. J. Nucl. Med. 2014, 55, 730–735. [Google Scholar] [CrossRef] [PubMed]
- Rodriguez, A.M.; Perron, B.; Lacroix, L.; Caillou, B.; Leblanc, G.; Schlumberger, M.; Bidart, J.M.; Pourcher, T. Identification and characterization of a putative human iodide transporter located at the apical membrane of thyrocytes. J. Clin. Endocrinol. Metab. 2002, 87, 3500–3503. [Google Scholar] [CrossRef] [PubMed]
- Jung, H. The sodium/substrate symporter family: Structural and functional features. FEBS Lett. 2002, 529, 73–77. [Google Scholar] [CrossRef] [PubMed]
- De La Vieja, A.; Dohan, O.; Levy, O.; Carrasco, N. Molecular analysis of the sodium/iodide symporter: Impact on thyroid and extrathyroid pathophysiology. Physiol. Rev. 2000, 80, 1083–1105. [Google Scholar] [PubMed]
- Dohan, O.; Carrasco, N. Advances in Na+/I− symporter (NIS) research in the thyroid and beyond. Mol. Cell. Endocrinol. 2003, 213, 59–70. [Google Scholar] [CrossRef] [PubMed]
- Dadachova, E.; Carrasco, N. The Na/I symporter (NIS): Imaging and therapeutic applications. Semin. Nucl. Med. 2004, 34, 23–31. [Google Scholar] [CrossRef] [PubMed]
- Mitchell, A.M.; Manley, S.W.; Morris, J.C.; Powell, K.A.; Bergert, E.R.; Mortimer, R.H. Sodium iodide symporter (NIS) gene expression in human placenta. Placenta 2001, 22, 256–258. [Google Scholar] [CrossRef] [PubMed]
- Jhiang, S.M.; Cho, J.Y.; Ryu, K.Y.; de Young, B.R.; Smanik, P.A.; McGaughy, V.R.; Fischer, A.H.; Mazzaferri, E.L. An immunohistochemical study of Na+/I− symporter in human thyroid tissues and salivary gland tissues. Endocrinology 1998, 139, 4416–4419. [Google Scholar] [PubMed]
- La Perle, K.M.; Kim, D.C.; Hall, N.C.; Bobbey, A.; Shen, D.H.; Nagy, R.S.; Wakely, P.E., Jr.; Lehman, A.; Jarjoura, D.; Jhiang, S.M. Modulation of sodium/iodide symporter expression in the salivary gland. Thyroid 2013, 23, 1029–1036. [Google Scholar] [CrossRef] [PubMed]
- Russo, D.; Scipioni, A.; Durante, C.; Ferretti, E.; Gandini, L.; Maggisano, V.; Paoli, D.; Verrienti, A.; Costante, G.; Lenzi, A.; et al. Expression and localization of the sodium/iodide symporter (NIS) in testicular cells. Endocrine 2011, 40, 35–40. [Google Scholar] [CrossRef] [PubMed]
- Nicola, J.P.; Basquin, C.; Portulano, C.; Reyna-Neyra, A.; Paroder, M.; Carrasco, N. The Na+/I− symporter mediates active iodide uptake in the intestine. Am. J. Physiol. Cell. Physiol. 2009, 296, C654–C662. [Google Scholar] [CrossRef] [PubMed]
- Saito, T.; Endo, T.; Kawaguchi, A.; Ikeda, M.; Katoh, R.; Kawaoi, A.; Muramatsu, A.; Onaya, T. Increased expression of the sodium/iodide symporter in papillary thyroid carcinomas. J. Clin. Investig. 1998, 101, 1296–1300. [Google Scholar] [CrossRef] [PubMed]
- Chatterjee, S.; Malhotra, R.; Varghese, F.; Bukhari, A.B.; Patil, A.; Budrukkar, A.; Parmar, V.; Gupta, S.; De, A. Quantitative immunohistochemical analysis reveals association between sodium iodide symporter and estrogen receptor expression in breast cancer. PLoS One 2013, 8, e54055. [Google Scholar] [CrossRef] [PubMed]
- Dohan, O.; Baloch, Z.; Banrevi, Z.; Livolsi, V.; Carrasco, N. Rapid communication: Predominant intracellular overexpression of the Na+/I− symporter (NIS) in a large sampling of thyroid cancer cases. J. Clin. Endocrinol. Metab. 2001, 86, 2697–2700. [Google Scholar] [PubMed]
- Luster, M.; Clarke, S.E.; Dietlein, M.; Lassmann, M.; Lind, P.; Oyen, W.J.; Tennvall, J.; Bombardieri, E. Guidelines for radioiodine therapy of differentiated thyroid cancer. Eur. J. Nucl. Med. Mol. Imaging 2008, 35, 1941–1959. [Google Scholar] [CrossRef] [PubMed]
- Wapnir, I.L.; van de Rijn, M.; Nowels, K.; Amenta, P.S.; Walton, K.; Montgomery, K.; Greco, R.S.; Dohan, O.; Carrasco, N. Immunohistochemical profile of the sodium/iodide symporter in thyroid, breast, and other carcinomas using high density tissue microarrays and conventional sections. J. Clin. Endocrinol. Metab. 2003, 88, 1880–1888. [Google Scholar] [CrossRef] [PubMed]
- Chung, J.K. Sodium iodide symporter: Its role in nuclear medicine. J. Nucl. Med. 2002, 43, 1188–1200. [Google Scholar] [PubMed]
- Klein, H.A.; DiSibio, K.J.; Sims, D.; Singleton, H.C.; Worthy, L.J. I-123 whole body scanning: Case report and discussion. Clin. Nucl. Med. 2005, 30, 312–316. [Google Scholar] [CrossRef] [PubMed]
- Gerard, S.K.; Cavalieri, R.R. I-123 diagnostic thyroid tumor whole-body scanning with imaging at 6, 24, and 48 hours. Clin. Nucl. Med. 2002, 27, 1–8. [Google Scholar] [CrossRef] [PubMed]
- Mandel, S.J.; Shankar, L.K.; Benard, F.; Yamamoto, A.; Alavi, A. Superiority of iodine-123 compared with iodine-131 scanning for thyroid remnants in patients with differentiated thyroid cancer. Clin. Nucl. Med. 2001, 26, 6–9. [Google Scholar] [CrossRef] [PubMed]
- Cancroft, E.T.; Goldsmith, S.J. 99mTc-pertechnetate scintigraphy as an aid in the diagnosis of breast masses. Radiology 1973, 106, 441–444. [Google Scholar] [CrossRef] [PubMed]
- Joseph, J.K.; Patel, R.B.; Damle, A.A.; Nair, N.; Badwe, R.A.; Basu, S. Functional radionuclide imaging, in-vitro radioiodine uptake estimation and RT-PCR in the evaluation of sodium iodide symporter (NIS) expression and functionality in breast cancer: A pilot study. Indian J. Surg. Oncol. 2013, 4, 80–91. [Google Scholar] [CrossRef] [PubMed]
- Pinto, J.T.; Suffoletto, B.P.; Berzin, T.M.; Qiao, C.H.; Lin, S.; Tong, W.P.; May, F.; Mukherjee, B.; Heston, W.D. Prostate-specific membrane antigen: A novel folate hydrolase in human prostatic carcinoma cells. Clin. Cancer Res. 1996, 2, 1445–1451. [Google Scholar] [PubMed]
- Silver, D.A.; Pellicer, I.; Fair, W.R.; Heston, W.D.; Cordon-Cardo, C. Prostate-specific membrane antigen expression in normal and malignant human tissues. Clin. Cancer Res. 1997, 3, 81–85. [Google Scholar] [PubMed]
- Wright, G.L., Jr.; Haley, C.; Beckett, M.L.; Schellhammer, P.F. Expression of prostate-specific membrane antigen in normal, benign, and malignant prostate tissues. Urol. Oncol. 1995, 1, 18–28. [Google Scholar] [CrossRef] [PubMed]
- Mhawech-Fauceglia, P.; Zhang, S.; Terracciano, L.; Sauter, G.; Chadhuri, A.; Herrmann, F.R.; Penetrante, R. Prostate-specific membrane antigen (PSMA) protein expression in normal and neoplastic tissues and its sensitivity and specificity in prostate adenocarcinoma: An immunohistochemical study using mutiple tumour tissue microarray technique. Histopathology 2007, 50, 472–483. [Google Scholar] [CrossRef] [PubMed]
- Israeli, R.S.; Powell, C.T.; Corr, J.G.; Fair, W.R.; Heston, W.D. Expression of the prostate-specific membrane antigen. Cancer Res. 1994, 54, 1807–1811. [Google Scholar] [PubMed]
- Chang, S.S.; Reuter, V.E.; Heston, W.D.; Hutchinson, B.; Grauer, L.S.; Gaudin, P.B. Short term neoadjuvant androgen deprivation therapy does not affect prostate specific membrane antigen expression in prostate tissues. Cancer 2000, 88, 407–415. [Google Scholar] [CrossRef] [PubMed]
- Wernicke, A.G.; Edgar, M.A.; Lavi, E.; Liu, H.; Salerno, P.; Bander, N.H.; Gutin, P.H. Prostate-specific membrane antigen as a potential novel vascular target for treatment of glioblastoma multiforme. Arch. Pathol. Lab. Med. 2011, 135, 1486–1489. [Google Scholar] [CrossRef] [PubMed]
- Haffner, M.C.; Kronberger, I.E.; Ross, J.S.; Sheehan, C.E.; Zitt, M.; Muhlmann, G.; Ofner, D.; Zelger, B.; Ensinger, C.; Yang, X.J.; et al. Prostate-specific membrane antigen expression in the neovasculature of gastric and colorectal cancers. Hum. Pathol. 2009, 40, 1754–1761. [Google Scholar] [CrossRef] [PubMed]
- Rajasekaran, A.K.; Anilkumar, G.; Christiansen, J.J. Is prostate-specific membrane antigen a multifunctional protein? Am. J. Physiol. Cell. Physiol. 2005, 288, C975–C981. [Google Scholar] [CrossRef] [PubMed]
- Rajasekaran, S.A.; Anilkumar, G.; Oshima, E.; Bowie, J.U.; Liu, H.; Heston, W.; Bander, N.H.; Rajasekaran, A.K. A novel cytoplasmic tail MXXXL motif mediates the internalization of prostate-specific membrane antigen. Mol. Biol. Cell. 2003, 14, 4835–4845. [Google Scholar] [CrossRef] [PubMed]
- Eder, M.; Eisenhut, M.; Babich, J.; Haberkorn, U. PSMA as a target for radiolabelled small molecules. Eur. J. Nucl. Med. Mol. Imaging 2013, 40, 819–823. [Google Scholar] [CrossRef] [PubMed]
- Murphy, G.P.; Elgamal, A.A.; Su, S.L.; Bostwick, D.G.; Holmes, E.H. Current evaluation of the tissue localization and diagnostic utility of prostate specific membrane antigen. Cancer 1998, 83, 2259–2269. [Google Scholar] [CrossRef] [PubMed]
- Troyer, J.K.; Beckett, M.L.; Wright, G.L., Jr. Detection and characterization of the prostate-specific membrane antigen (PSMA) in tissue extracts and body fluids. Int. J. Cancer 1995, 62, 552–558. [Google Scholar] [CrossRef] [PubMed]
- Luthi-Carter, R.; Barczak, A.K.; Speno, H.; Coyle, J.T. Molecular characterization of human brain N-acetylated α-linked acidic dipeptidase (NAALADase). J. Pharmacol. Exp. Ther. 1998, 286, 1020–1025. [Google Scholar] [PubMed]
- Tiffany, C.W.; Lapidus, R.G.; Merion, A.; Calvin, D.C.; Slusher, B.S. Characterization of the enzymatic activity of PSM: Comparison with brain NAALADase. Prostate 1999, 39, 28–35. [Google Scholar] [CrossRef] [PubMed]
- Tang, H.; Brown, M.; Ye, Y.; Huang, G.; Zhang, Y.; Wang, Y.; Zhai, H.; Chen, X.; Shen, T.Y.; Tenniswood, M. Prostate targeting ligands based on N-acetylated α-linked acidic dipeptidase. Biochem. Biophys. Res. Commun. 2003, 307, 8–14. [Google Scholar] [CrossRef] [PubMed]
- Oliver, A.J.; Wiest, O.; Helquist, P.; Miller, M.J.; Tenniswood, M. Conformational and SAR analysis of NAALADase and PSMA inhibitors. Bioorg. Med. Chem. 2003, 11, 4455–4461. [Google Scholar] [CrossRef] [PubMed]
- Eder, M.; Neels, O.; Muller, M.; Bauder-Wust, U.; Remde, Y.; Schafer, M.; Hennrich, U.; Eisenhut, M.; Afshar-Oromieh, A.; Haberkorn, U.; et al. Novel preclinical and radiopharmaceutical aspects of [68Ga]Ga-PSMA-HBED-CC: A new PET tracer for imaging of prostate cancer. Pharmaceuticals (Basel) 2014, 7, 779–796. [Google Scholar] [CrossRef]
- Eder, M.; Wangler, B.; Knackmuss, S.; LeGall, F.; Little, M.; Haberkorn, U.; Mier, W.; Eisenhut, M. Tetrafluorophenolate of HBED-CC: A versatile conjugation agent for 68Ga-labeled small recombinant antibodies. Eur. J. Nucl. Med. Mol. Imaging 2008, 35, 1878–1886. [Google Scholar] [CrossRef] [PubMed]
- Eder, M.; Schafer, M.; Bauder-Wust, U.; Hull, W.E.; Wangler, C.; Mier, W.; Haberkorn, U.; Eisenhut, M. 68Ga-complex lipophilicity and the targeting property of a urea-based PSMA inhibitor for PET imaging. Bioconjug. Chem. 2012, 23, 688–697. [Google Scholar] [CrossRef] [PubMed]
- Flohr, T. Messprinzip, Bildrekonstruktion, Gerätetyp und Aufnahmetechniken. In Wie funktioniert CT? Alkadhi, H., Ed.; Springer-Verlag Berlin Heidelberg: New York, NY, USA, 2011. (In German) [Google Scholar]
- Zhang, B.C.; Hou, L.; Lv, B.; Xu, Y.W. Post-marketing surveillance study with iodixanol in 20,185 Chinese patients from routine clinical practices. Br. J. Radiol. 2014, 87, 20130325. [Google Scholar] [CrossRef] [PubMed]
- Hasebroock, K.M.; Serkova, N.J. Toxicity of MRI and CT contrast agents. Expert Opin. Drug Metab. Toxicol. 2009, 5, 403–416. [Google Scholar] [CrossRef] [PubMed]
- Kuchmiy, A.A.; Efimov, G.A.; Nedospasov, S.A. Methods for in vivo molecular imaging. Biochemistry (Moscow) 2012, 77, 1339–1353. [Google Scholar] [CrossRef]
- Histed, S.N.; Lindenberg, M.L.; Mena, E.; Turkbey, B.; Choyke, P.L.; Kurdziel, K.A. Review of functional/anatomical imaging in oncology. Nucl. Med. Commun. 2012, 33, 349–361. [Google Scholar] [CrossRef] [PubMed]
- Lukaski, H.C. Methods for the assessment of human body composition: Traditional and new. Am. J. Clin. Nutr. 1987, 46, 537–556. [Google Scholar] [PubMed]
- Hansen, G.; Crooks, L.E.; Davis, P.; de Groot, J.; Herfkens, R.; Margulis, A.R.; Gooding, C.; Kaufman, L.; Hoenninger, J.; Arakawa, M.; et al. In vivo imaging of the rat anatomy with nuclear magnetic resonance. Radiology 1980, 136, 695–700. [Google Scholar] [CrossRef] [PubMed]
- Caravan, P.; Ellison, J.J.; McMurry, T.J.; Lauffer, R.B. Gadolinium(III) chelates as MRI contrast agents: Structure, dynamics, and applications. Chem. Rev. 1999, 99, 2293–2352. [Google Scholar] [CrossRef] [PubMed]
- Lee, S.H.; Kim, B.H.; Na, H.B.; Hyeon, T. Paramagnetic inorganic nanoparticles as T1 MRI contrast agents. Wiley Interdiscip. Rev. Nanomed. Nanobiotechnol. 2014, 6, 196–209. [Google Scholar] [CrossRef] [PubMed]
- Na, H.B.; Song, I.C.; Hyeon, T. Inorganic nanoparticles for MRI contrast agents. Adv. Mate. 2009, 21, 2133–2148. [Google Scholar] [CrossRef]
- Bar-Shalom, R.; Valdivia, A.Y.; Blaufox, M.D. PET imaging in oncology. Semin. Nucl. Med. 2000, 30, 150–185. [Google Scholar] [CrossRef] [PubMed]
- Moses, W.W. Recent advances and future advances in time-of-flight PET. Nucl. Instrum. Methods Phys. Res. A 2007, 580, 919–924. [Google Scholar] [CrossRef] [PubMed]
- Yankeelov, T.E.; Abramson, R.G.; Quarles, C.C. Quantitative multimodality imaging in cancer research and therapy. Nat. Rev. Clin. Oncol. 2014, 11, 670–680. [Google Scholar] [CrossRef] [PubMed]
- Kauhanen, S.P.; Komar, G.; Seppanen, M.P.; Dean, K.I.; Minn, H.R.; Kajander, S.A.; Rinta-Kiikka, I.; Alanen, K.; Borra, R.J.; Puolakkainen, P.A.; et al. A prospective diagnostic accuracy study of 18F-fluorodeoxyglucose positron emission tomography/computed tomography, multidetector row computed tomography, and magnetic resonance imaging in primary diagnosis and staging of pancreatic cancer. Ann. Surg. 2009, 250, 957–963. [Google Scholar] [CrossRef] [PubMed]
- Rosenthal, M.S.; Cullom, J.; Hawkins, W.; Moore, S.C.; Tsui, B.M.; Yester, M. Quantitative SPECT imaging: A review and recommendations by the Focus Committee of the Society of Nuclear Medicine Computer and Instrumentation Council. J. Nucl. Med. 1995, 36, 1489–1513. [Google Scholar] [PubMed]
- Alirezapour, B.; Jalilian, A.R.; Bolourinovin, F.; Moradkhani, S. Production and quality control of [(67)Ga]-DOTA-trastuzumab for radioimmunoscintigraphy. Iran. J. Pharm. Res. 2013, 12, 355–366. [Google Scholar] [PubMed]
- Pentlow, K.S.; Finn, R.D.; Larson, S.M.; Erdi, Y.E.; Beattie, B.J.; Humm, J.L. Quantitative imaging of yttrium-86 with PET. The occurrence and correction of anomalous apparent activity in high density regions. Clin. Positron Imaging 2000, 3, 85–90. [Google Scholar] [CrossRef] [PubMed]
- Forrer, F.; Valkema, R.; Kwekkeboom, D.J.; de Jong, M.; Krenning, E.P. Neuroendocrine tumors. Peptide receptor radionuclide therapy. Best Pract. Res. Clin. Endocrinol. Metab. 2007, 21, 111–129. [Google Scholar] [CrossRef] [PubMed]
- Khalil, M.M.; Tremoleda, J.L.; Bayomy, T.B.; Gsell, W. Molecular SPECT imaging: An overview. Int. J. Mol. Imaging 2011, 2011, 796025. [Google Scholar] [CrossRef] [PubMed]
- Ohya, S.; Tamura, T. Nuclear Data: I-123. Available online: http://crete.homeip.net/show_nuclide/530123/ (accessed on 26 February 2015).
- NCHPS. Nuclide Safety Data Sheet Iodine-131. Available online: http://hpschapters.org/northcarolina/NSDS/131IPDF.pdf (accessed on 23 November 2014).
- McKillop, J.H. Thallium 201 scintigraphy. West. J. Med. 1980, 133, 26–43. [Google Scholar] [PubMed]
© 2015 by the authors; licensee MDPI, Basel, Switzerland. This article is an open access article distributed under the terms and conditions of the Creative Commons Attribution license (http://creativecommons.org/licenses/by/4.0/).
Share and Cite
Weber, J.; Haberkorn, U.; Mier, W. Cancer Stratification by Molecular Imaging. Int. J. Mol. Sci. 2015, 16, 4918-4946. https://doi.org/10.3390/ijms16034918
Weber J, Haberkorn U, Mier W. Cancer Stratification by Molecular Imaging. International Journal of Molecular Sciences. 2015; 16(3):4918-4946. https://doi.org/10.3390/ijms16034918
Chicago/Turabian StyleWeber, Justus, Uwe Haberkorn, and Walter Mier. 2015. "Cancer Stratification by Molecular Imaging" International Journal of Molecular Sciences 16, no. 3: 4918-4946. https://doi.org/10.3390/ijms16034918