
Autistic Children Exhibit Decreased Levels of Essential Fatty Acids in Red Blood Cells

Abstract
:1. Introduction

2. Results and Discussion
2.1. Fatty Acid Profiling

| Fatty Acids | Autism (n = 121) | Control (n = 110) | p | ||
|---|---|---|---|---|---|
| Mean | SD | Mean | SD | ||
| Saturates | |||||
| C12:0 | 0.12 | 0.15 | 0.08 | 0.11 | 0.01 * |
| C14:0 | 0.66 | 0.40 | 0.57 | 0.29 | 0.06 |
| C15:0 | 0.19 | 0.08 | 0.17 | 0.08 | 0.03 * |
| C16:0 | 27.63 | 3.14 | 26.37 | 2.47 | 0.001 * |
| C17:0 | 0.42 | 0.14 | 0.39 | 0.10 | 0.11 |
| C18:0 | 19.63 | 2.23 | 19.66 | 2.18 | 0.93 |
| C20:0 | 0.48 | 0.11 | 0.52 | 0.11 | 0.004 * |
| C22:0 | 1.28 | 0.42 | 1.30 | 0.32 | 0.58 |
| C24:0 | 2.23 | 0.88 | 2.27 | 0.72 | 0.69 |
| Total SFA | 52.63 | 4.05 | 51.33 | 3.68 | 0.011 * |
| Monounsaturates | |||||
| C14:1 | 0.01 | 0.04 | 0.00 | 0.00 | 0.01 * |
| C16:1 | 0.39 | 0.38 | 0.36 | 0.30 | 0.44 |
| C17:1 | 1.92 | 0.88 | 1.80 | 0.99 | 0.35 |
| C18:1 | 13.35 | 2.88 | 12.96 | 2.11 | 0.25 |
| C20:1 | 0.20 | 0.10 | 0.22 | 0.09 | 0.24 |
| C22:1 | 0.22 | 0.24 | 0.17 | 0.12 | 0.04 * |
| C24:1 | 1.94 | 0.66 | 2.10 | 0.59 | 0.05 |
| Total MUFA | 18.03 | 5.18 | 17.61 | 4.21 | 0.23 |
| Polyunsaturates | |||||
| C18:2 n-6 | 11.25 | 2.11 | 11.00 | 2.13 | 0.36 |
| C18:3 n-6 | 0.01 | 0.03 | 0.01 | 0.02 | 0.3 |
| C18:3 n-3 | 0.15 | 0.14 | 0.23 | 0.51 | 0.12 |
| C20:2 n-6 | 0.20 | 0.11 | 0.22 | 0.09 | 0.37 |
| C20:3 n-6 | 1.44 | 0.41 | 1.64 | 0.55 | 0.003 * |
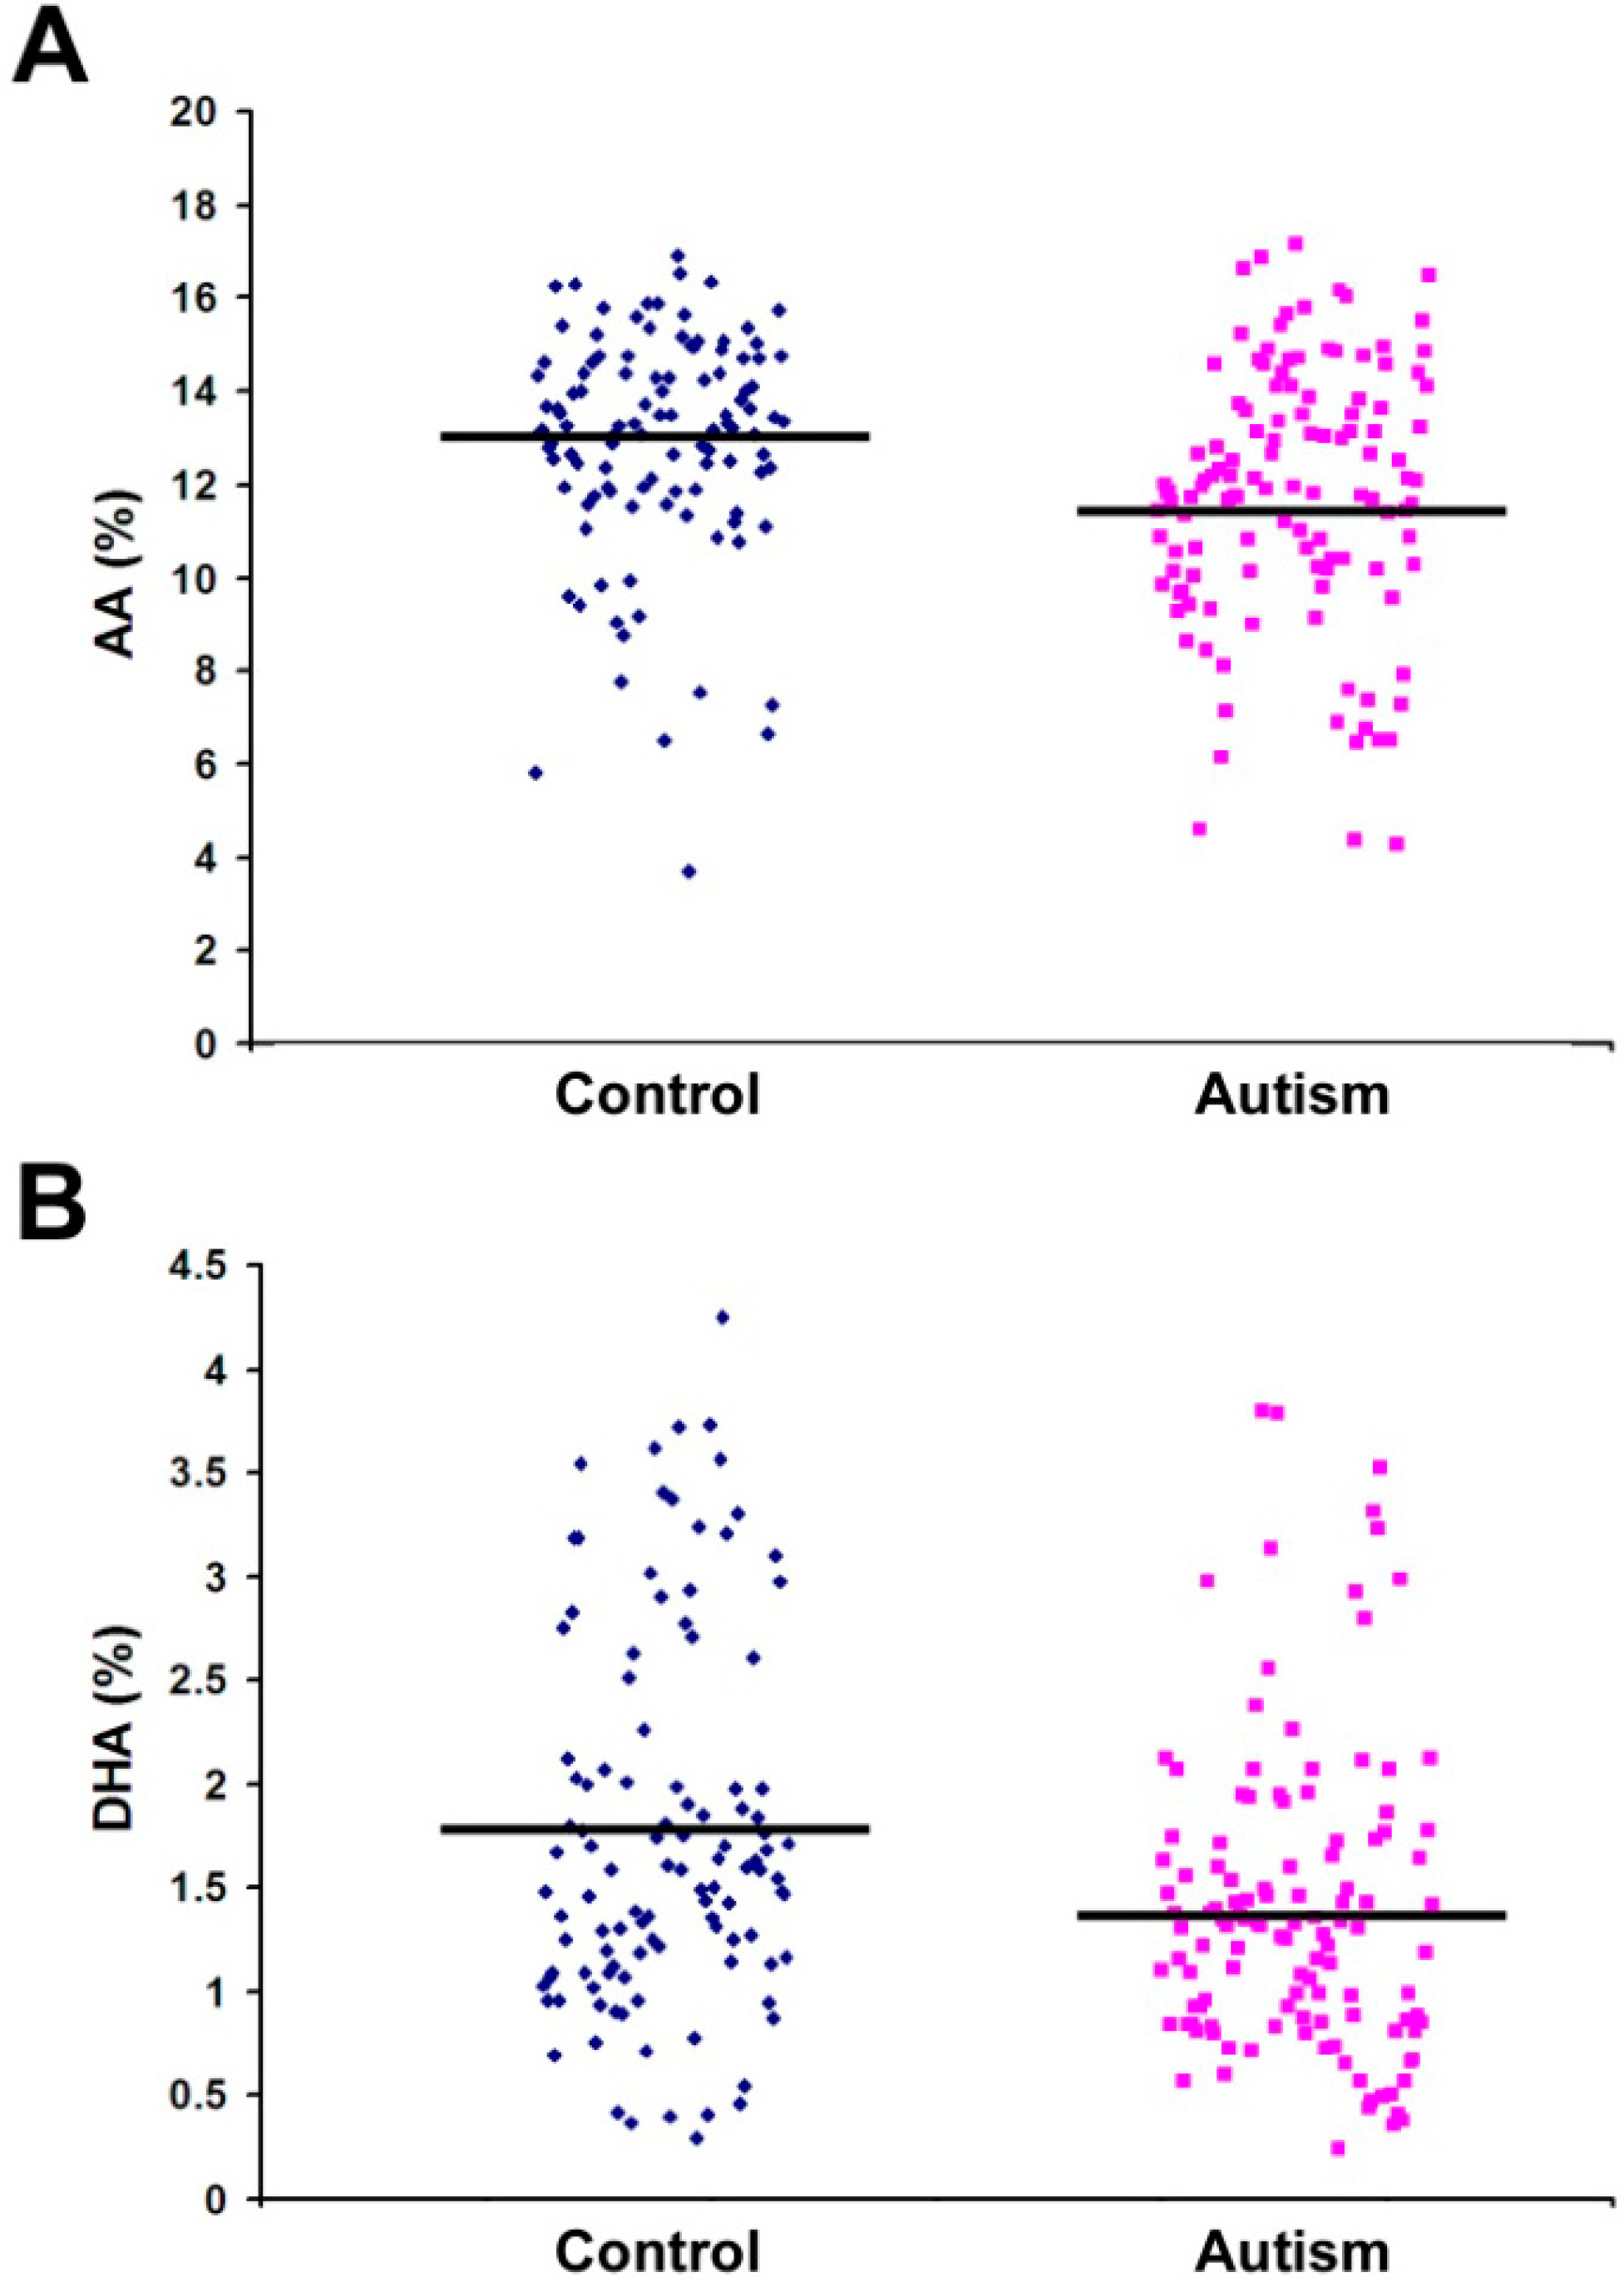
| C20:4 n-6 (AA) | 11.74 | 2.79 | 12.90 | 2.43 | 0.001 * |
| C20:3 n-3 | 0.01 | 0.06 | 0.00 | 0.01 | 0.36 |
| C20:5 n-3 | 0.22 | 0.22 | 0.22 | 0.22 | 0.98 |
| C22:2 n-6 | 0.01 | 0.03 | 0.02 | 0.06 | 0.04 * |
| C22:4 n-6 | 1.93 | 0.72 | 2.11 | 0.73 | 0.07 |
| C22:5 n-3 | 0.97 | 0.39 | 0.97 | 0.39 | 0.97 |
| C22:6 n-3 (DHA) | 1.40 | 0.74 | 1.76 | 0.89 | 0.001 * |
| Total n-6 | 26.59 | 4.75 | 27.89 | 4.02 | 0.026 * |
| Total n-3 | 2.75 | 1.14 | 3.18 | 1.17 | 0.005 * |
| Total n-6:n-3 | 11.02 | 4.06 | 10.05 | 4.00 | 0.068 |
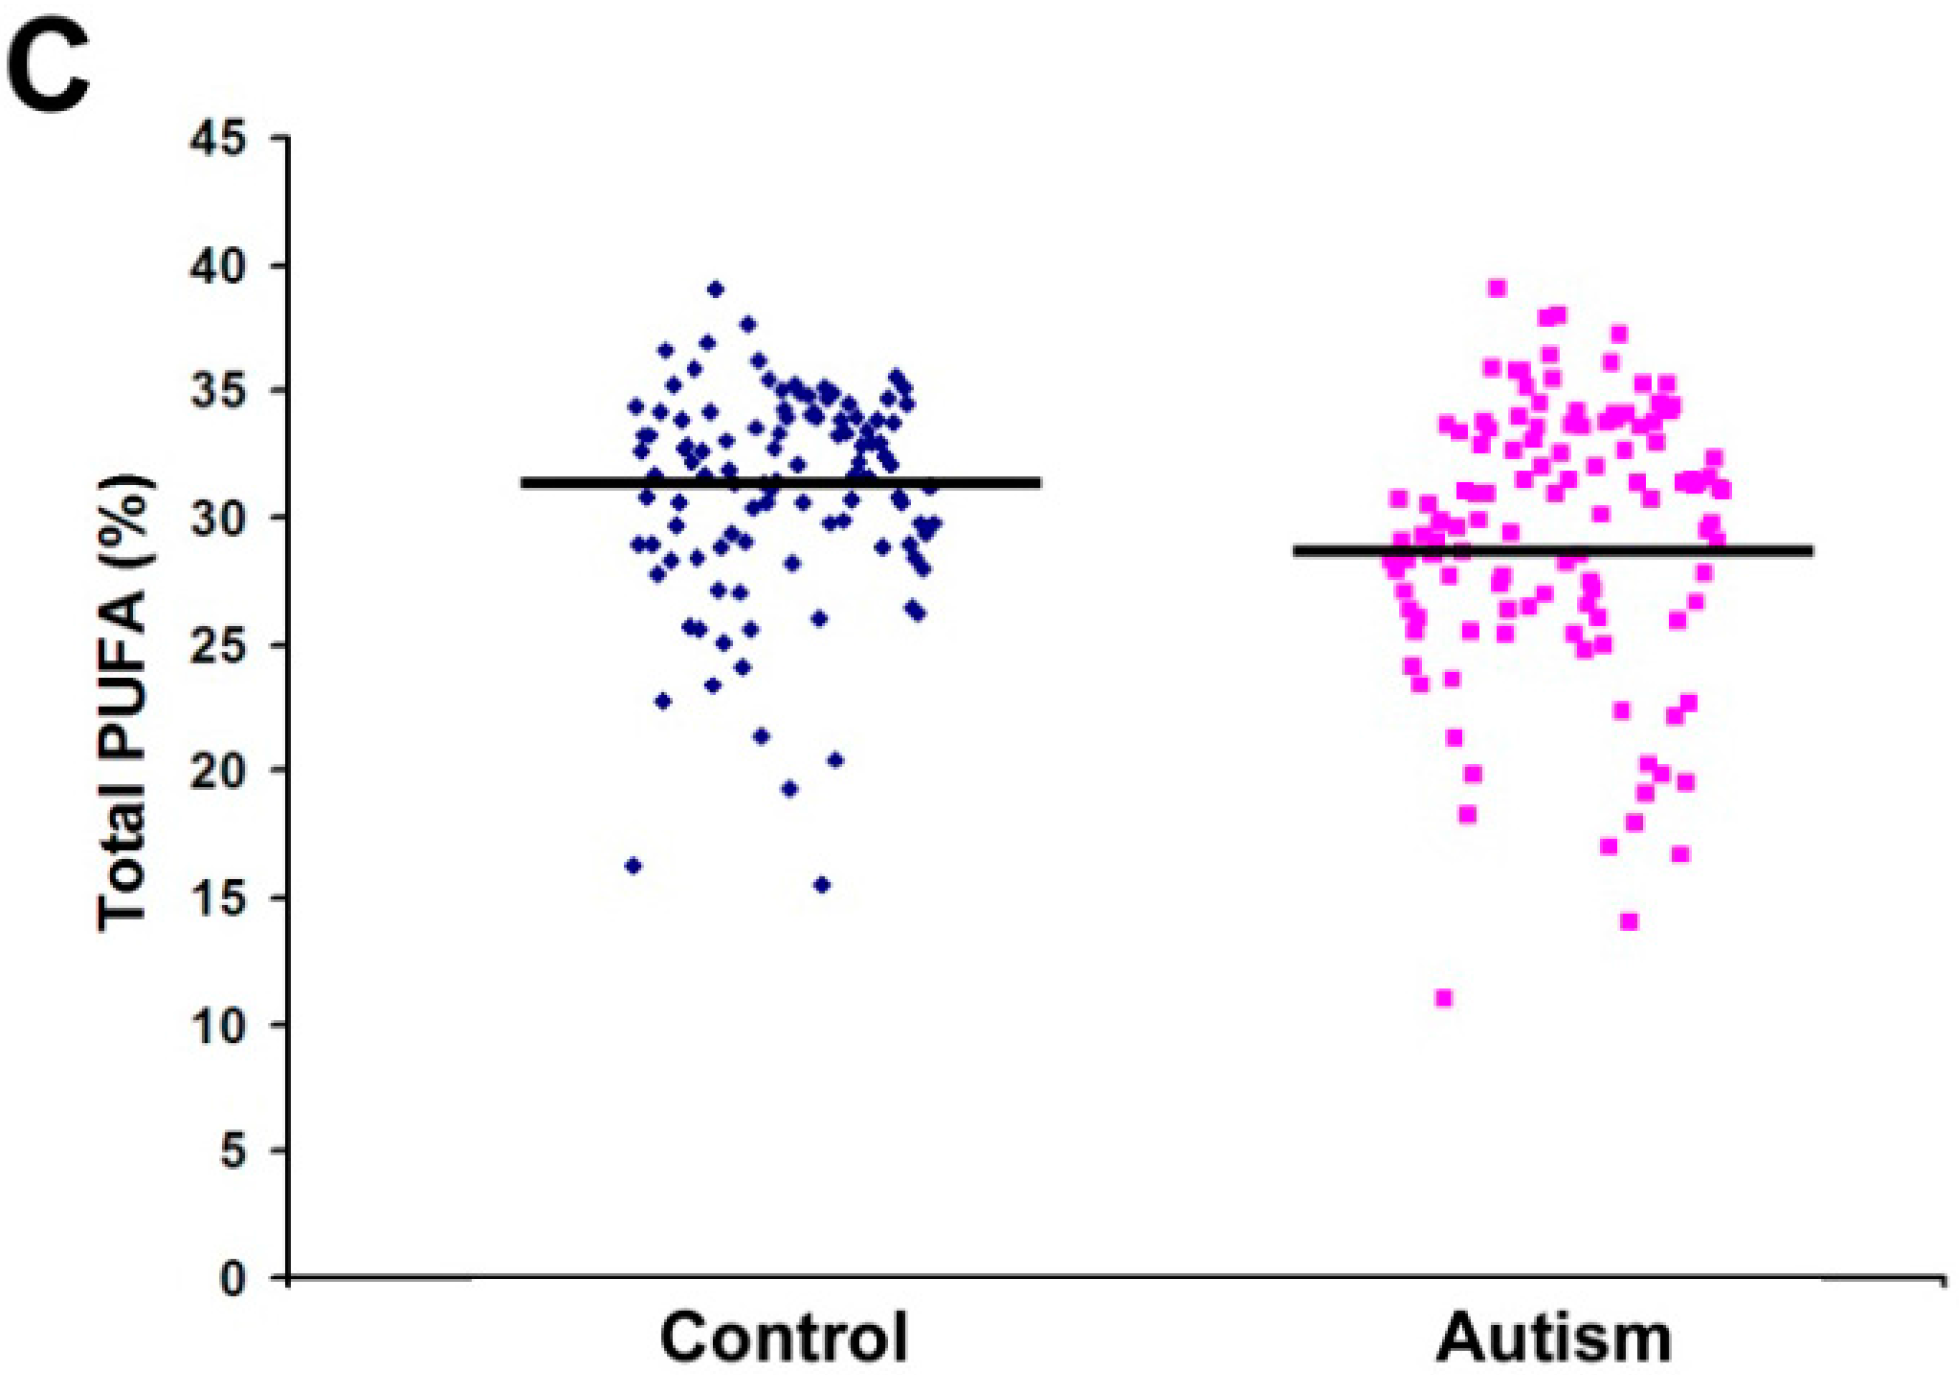
| Total PUFA | 29.34 | 5.31 | 31.06 | 4.21 | 0.007 * |


2.2. Quantification of PGE2 Concentration

3. Experimental Section
3.1. Collection and Transportation of Blood Samples
3.2. Lipid Analysis of RBC Membrane Phospholipids
3.2.1. Lipid Extraction
3.2.2. Thin Layer Chromatography (TLC)
3.2.3. Fatty Acid Methylation
3.2.4. Gas Chromatography
3.2.5. Statistical Analysis
3.3. Quantification of PGE2 from Human Plasma Samples
3.3.1. Extraction
3.3.2. LC/MS Condition
3.3.3. Quantification of PGE2
3.3.4. Reagent Information
Acknowledgments
Author Contributions
Conflicts of Interest
References
- Duchan, E.; Patel, D.R. Epidemiology of autism spectrum disorders. Pediatr. Clin. N. Am. 2012, 59, 27–43. [Google Scholar] [CrossRef]
- Silver, W.G.; Rapin, I. Neurobiological basis of autism. Pediatr. Clin. N. Am. 2012, 59, 45–61. [Google Scholar] [CrossRef]
- Verhoeven, J.S.; de Cock, P.; Lagae, L.; Sunaert, S. Neuroimaging of autism. Neuroradiology 2010, 52, 3–14. [Google Scholar] [CrossRef] [PubMed]
- Gadad, B.S.; Lewitson, L.; Young, K.A.; German, D.C. Neuropathology and animal models of autism: Genetic and environmental factors. Autism Res. Treat. 2013, 2013. [Google Scholar] [CrossRef]
- Weist, M.M.; German, J.B.; Harvey, D.J.; Watkins, S.M.; Hertz-Picciotto, I. Plasma fatty acid profiles in autism: A case-control study. Prostaglandins Leukot. Essent. Fatty Acids 2009, 80, 221–227. [Google Scholar] [CrossRef] [PubMed]
- Hallmayer, J.; Cleaveland, S.; Torres, A.; Phillips, J.; Cohen, B.; Torigoe, T.; Miller, J.; Fedele, A.; Collins, J.; Smith, K.; et al. Genetic heritability and shared environmental factors among twin pairs with autism. Arch. Gen. Psychiatry 2011, 68, 1095–1102. [Google Scholar] [CrossRef] [PubMed]
- Lyall, K.; Munger, K.L.; O’Reilly, E.J.; Santangelo, S.L.; Ascherio, A. Maternal dietary fat intake in association with autism spectrum disorders. Am. J. Epidemiol. 2013, 178, 209–220. [Google Scholar] [CrossRef] [PubMed]
- Zerbo, O.; Qian, Y.; Yoshida, C.; Grether, J.K.; van de Water, J.; Croen, L.A. Maternal infection during pregnancy and autism spectrum disorders. J. Autism Dev. Disord. 2013, in press. [Google Scholar]
- Raz, R.; Roberts, A.L.; Lyall, K.; Hart, J.E.; Just, A.C.; Laden, F.; Weisskopf, M.G. Autism Spectrum Disorder and particular matter before, during, and after pregnancy: A nested case-control analysis within the nurses’ health study II cohort. Environ. Health Perspect. 2015, 123, 264–270. [Google Scholar] [PubMed]
- Innis, S.M. The role of dietary n-6 and n-3 fatty acids in the developing brain. Dev. Neurosci. 2008, 22, 474–480. [Google Scholar] [CrossRef]
- Piras, I.S.; Haapanen, L.; Napolioni, V.; Sacco, R.; van de Water, J.; Persico, A.M. Anti-brain antibodies are associated with more severe cognitive and behavioral profiles in Italian children with Autism Spectrum Disorder. Brain Behav. Immun. 2014, 38, 91–99. [Google Scholar] [CrossRef] [PubMed]
- Das, U.N. Autism as a disorder of deficiency of brain-derived neurotrophic factor and altered metabolism of polyunsaturated fatty acids. Nutrition 2013, 29, 1175–1185. [Google Scholar] [CrossRef] [PubMed]
- Richardson, A.J. Long-chain polyunsaturated fatty acids in childhood developmental and psychiatric disorders. Lipids 2004, 39, 1215–1222. [Google Scholar] [CrossRef] [PubMed]
- Vancassel, S.; Durand, G.; Barthelemy, C.; Lejeune, B.; Martineau, J.; Guilloteau, D.; Andrès, C.; Chalon, S. Plasma fatty acid levels in autistic children. Prostaglandins Leukot. Essent. Fatty Acids 2001, 65, 1–7. [Google Scholar] [CrossRef] [PubMed]
- Meguid, N.A.; Atta, H.M.; Gouda, A.S.; Khalil, R.O. Role of polyunsaturated fatty acids in the management of Egyptian children with autism. Clin. Biochem. 2008, 41, 1044–1048. [Google Scholar] [CrossRef] [PubMed]
- Bradbury, J. Docosahexaenoic acid (DHA): An ancient nutrient for the modern human brain. Nutrients 2011, 3, 529–554. [Google Scholar] [CrossRef] [PubMed]
- Schudardt, J.P.; Huss, M.; Stauss-Grabo, M.; Hahn, A. Significance of long-chain polyunsaturated fatty acids (PUFAs) for the development and behaviour of children. Eur. J. Pediatr. 2010, 169, 149–164. [Google Scholar] [CrossRef] [PubMed]
- Bell, J.G.; MacKinlay, E.E.; Dick, J.R.; MacDonald, D.J.; Boyle, R.M.; Glen, A.C. Essential fatty acids and phospholipase A2 in autistic spectrum disorders. Prostaglandins Leukot. Essent. Fatty Acids 2004, 71, 201–204. [Google Scholar] [CrossRef] [PubMed]
- Sun, Q.; Ma, J.; Campos, H.; Hankinson, S.E.; Hu, F.B. Comparison between plasma and erythrocyte fatty acid content as biomarkers of fatty acid intake in US women. Am. J. Clin. Nutr. 2007, 86, 74–81. [Google Scholar] [PubMed]
- Kuratko, C.N.; Salem, N., Jr. Biomarkers of DHA status. Prostaglandins Leukot. Essent. Fatty Acids 2009, 81, 111–118. [Google Scholar] [CrossRef] [PubMed]
- Bell, J.G.; Miller, D.; MacDonald, D.J.; MacKinlay, E.E.; Dick, J.R.; Cheseldine, S.; Boyle, R.M.; Graham, C.; O’Hare, A.E. The fatty acid compositions of erythrocyte and plasma polar lipids in children with autism, developmental delay or typically developing controls and the effect of fish oil intake. Br. J. Nutr. 2010, 103, 1160–1167. [Google Scholar] [PubMed]
- Bu, B.; Ashwood, P.; Harvey, D.; King, I.B.; van de Water, J.; Jin, L.W. Fatty acid compositions of red blood cell phospholipids in children with autism. Prostaglandins Leukot. Essent. Fatty Acids 2006, 74, 215–221. [Google Scholar] [CrossRef] [PubMed]
- Vlaardingerbroek, H.; Hornstra, G. Essential fatty acids in erythrocyte phospholipids during pregnancy and at delivery in mothers and their neonates: Comparison with plasma phospholipids. Prostaglandins Leukot. Essent. Fatty Acids 2004, 71, 363–374. [Google Scholar] [CrossRef] [PubMed]
- Tamiji, J.; Crawford, D.A. The neurobiology of lipid metabolism in autism spectrum disorders. Neurosignals 2010, 18, 98–112. [Google Scholar] [CrossRef] [PubMed]
- Khan, M.M.; Evans, D.R.; Gunna, V.; Scheffer, R.E.; Parikh, V.V.; Mahadik, S.P. Reduced erythrocyte membrane essential fatty acids and increased lipid peroxides in schizophrenia at the never-medicated first-episode of psychosis and after years of treatment with antipsychotics. Schizophr. Res. 2002, 58, 1–10. [Google Scholar] [CrossRef] [PubMed]
- Stevens, L.J.; Zentall, S.S.; Deck, J.L. Essential fatty acid metabolism in boys with attention-deficit hyperactivity disorder. Am. J. Clin. Nutr. 1995, 62, 761–768. [Google Scholar] [PubMed]
- Chauhan, A.; Chauhan, V.; Brown, W.T.; Cohen, I. Oxidative stress in autism: Increased lipid peroxidation and reduced serum levels of ceruloplasmin and transferrin-the antioxidant proteins. Life Sci. 2004, 75, 2539–2549. [Google Scholar] [CrossRef] [PubMed]
- Pastural, E.; Ritchie, S.; Lu, Y.; Jin, W.; Kavianpour, A.; Khine Su-Myat, K.; Heath, D.; Wood, P.L.; Fisk, M.; Goodenowe, D.B. Novel plasma phospholipid biomarkers of autism: Mitochondrial dysfunction as a putative causative mechanism. Prostaglandins Leukot. Essent. Fatty Acids 2009, 81, 253–264. [Google Scholar] [CrossRef] [PubMed]
- El-Ansary, A.; Al-Ayadhi, L. Lipid mediators in plasma of autism spectrum disorders. Lipids Health Dis. 2012, 11. [Google Scholar] [CrossRef]
- Meguid, N.A.; Dardir, A.A.; Abdel-Raouf, E.R.; Hashish, A. Evaluation of oxidative stress in autism: Defective antioxidant enzymes and increased lipid peroxidation. Biol. Trace Elem. Res. 2011, 143, 58–65. [Google Scholar] [CrossRef] [PubMed]
- Tassoni, D.; Kaur, G.; Weisinger, R.S.; Sinclair, A.J. The role of eicosanoids in the brain. Asia Pac. J. Clin. Nutr. 2008, 17, 220–228. [Google Scholar] [PubMed]
- Laryea, M.; Cieslicki, P.; Diekmann, E.; Wendel, U. Age-dependent fatty acid composition of erythrocyte membrane phospholipids in healthy children. Z Ernahrungswiss 1990, 29, 284–294. [Google Scholar] [CrossRef] [PubMed]
- Schreck, K.A.; Williams, K.; Smith, A.F. A comparison of eating behaviors between children with and without autism. J. Autism Dev. Disord. 2004, 34, 433–438. [Google Scholar] [CrossRef] [PubMed]
- Marshall, J.; Hill, R.J.; Ziviani, J.; Dodrill, P. Features of feeding difficulty in children with Autism Spectrum Disorder. Int. J. Speech Lang. Pathol. 2013, 16, 151–158. [Google Scholar] [CrossRef] [PubMed]
- Kelley, D.S.; Taylor, P.C.; Nelson, G.J.; Mackey, B.E. Arachidonic acid supplementation enhances synthesis of eicosanoids without suppressing immune functions in young healthy men. Lipids 1998, 33, 125–130. [Google Scholar] [CrossRef] [PubMed]
- Elmes, M.; Green, L.R.; Poore, K.; Newman, J.; Burrage, D.; Abayasekara, D.R.; Cheng, Z.; Hanson, M.A.; Wathes, D.C. Raised dietary n-6 polyunsaturated fatty acid intake increases 2-series prostaglandin production during labour in the ewe. J. Physiol. 2005, 562, 583–592. [Google Scholar] [CrossRef] [PubMed]
- Vargas, D.L.; Nascimbene, C.; Krishnan, C.; Zimmerman, A.W.; Pardo, C.A. Neuroglial activation and neuroinflammation in the brain of patients with autism. Ann. Neurol. 2005, 57, 67–81. [Google Scholar] [CrossRef] [PubMed]
- Hagberg, H.; Gressens, P.; Mallard, C. Inflammation during fetal and neonatal life: Implications for neurologic and neuropsychiatric disease in children and adults. Ann. Neurol. 2012, 71, 444–457. [Google Scholar] [CrossRef] [PubMed]
- El-Ansary, A.; Al-Ayadhi, L. Neuroinflammation in autism spectrum disorders. J. Neuroinflamm. 2012, 9, 265. [Google Scholar] [CrossRef]
- Essa, M.M.; Guillemin, G.J.; Waly, M.I.; Al-Sharbati, M.M.; Al-Farsi, Y.M.; Hakkim, F.L.; Ali, A.; Al-Shafaee, M.S. Increased markers of oxidative stress in autistic children of the Sultanate of Oman. Biol. Trace Elem. Res. 2012, 147, 25–27. [Google Scholar] [CrossRef] [PubMed]
- Frolich, J.C.; Wilson, T.W.; Sweetman, B.J.; Smigel, M.; Nies, A.S.; Carr, K.; Watson, J.T.; Oates, J.A. Urinary prostaglandins: Identification and origin. J. Clin. Investig. 1975, 55, 763–770. [Google Scholar] [CrossRef] [PubMed]
- Wasilewska, J.; Jarocka-Cyrta, E.; Kaczmarski, M. Gastrointestinal abnormalities in children with autism. Pol. Merkur. Lekarski. 2009, 27, 40–43. [Google Scholar] [PubMed]
- Verma, G.; Marella, A.; Shaquiquzzaman, M.; Alam, M.M. Immunoinflammatory responses in gastrointestinal tract injury and recovery. Acta Biochim. Pol. 2013, 60, 143–149. [Google Scholar] [PubMed]
- Yui, K.; Koshiba, M.; Nakamura, S.; Kobayashi, Y. Effects of large doses of arachidonic acid added to docosahexaenoic acid on social impairment in individuals with autism spectrum disorders: A double-blind, placebo-controlled, randomized trial. J. Clin. Psychopharmacol. 2012, 32, 200–206. [Google Scholar] [CrossRef] [PubMed]
- James, S.; Montgomery, P.; Williams, K. Omega-3 fatty acids supplementation for autism spectrum disorders (ASD). Cochrane Database Syst. Rev. 2011, 11. [Google Scholar] [CrossRef]
- Jones, K.L.; Will, M.J.; Hecht, P.M.; Parker, C.L.; Beversdorf, D.Q. Maternal diet rich in omega-6 polyunsaturated fatty acids during gestation and lactation produces autistic-like sociability deficits in adult offspring. Behav. Brain Res. 2013, 238, 193–199. [Google Scholar] [CrossRef] [PubMed]
- Kang, J.X.; Wang, J. A simplified method for analysis of polyunsaturated fatty acids. BMC Biochem. 2005, 6, 5. [Google Scholar] [CrossRef] [PubMed] [Green Version]
© 2015 by the authors; licensee MDPI, Basel, Switzerland. This article is an open access article distributed under the terms and conditions of the Creative Commons Attribution license (http://creativecommons.org/licenses/by/4.0/).
Share and Cite
Brigandi, S.A.; Shao, H.; Qian, S.Y.; Shen, Y.; Wu, B.-L.; Kang, J.X. Autistic Children Exhibit Decreased Levels of Essential Fatty Acids in Red Blood Cells. Int. J. Mol. Sci. 2015, 16, 10061-10076. https://doi.org/10.3390/ijms160510061
Brigandi SA, Shao H, Qian SY, Shen Y, Wu B-L, Kang JX. Autistic Children Exhibit Decreased Levels of Essential Fatty Acids in Red Blood Cells. International Journal of Molecular Sciences. 2015; 16(5):10061-10076. https://doi.org/10.3390/ijms160510061
Chicago/Turabian StyleBrigandi, Sarah A., Hong Shao, Steven Y. Qian, Yiping Shen, Bai-Lin Wu, and Jing X. Kang. 2015. "Autistic Children Exhibit Decreased Levels of Essential Fatty Acids in Red Blood Cells" International Journal of Molecular Sciences 16, no. 5: 10061-10076. https://doi.org/10.3390/ijms160510061