1. Introduction
Evidence suggests that fatty acids (FAs) can modulate adipokine production, thus accelerating and influencing an individual’s inflammatory response [
1]. Omega-3 (
n-3) FAs have potent anti-inflammatory effects.
n-3 FAs may affect inflammatory processes through modulation of eicosanoid metabolism and by regulating transcription factors genes involved in inflammation [
2]. The resolution of inflammation involves active biochemical compounds, termed resolvins and protectins, which enable inflamed tissues to restore homeostasis [
3]. However, these effects have been demonstrated in
in vitro studies [
4,
5]. The extent of these effects
in vivo is not clearly established and remains unclear. Dietary FAs, in particular saturated FAs in addition to
n-3 and omega-6 FAs could potentially modulate the expression of genes encoding cytokines, possibly altering plasma cytokine levels as well [
6].
A review by Joffe
et al. suggested that polymorphisms (SNPs) within inflammation-related genes may interact with environmental factors, such as dietary intakes, to modulate an individual’s susceptibility to develop obesity and its comorbidities [
6]. Interaction effects between dietary FAs and variations in inflammation-related genes such as
tumor necrosis factor α (
TNF-α) and
interleukin 6 (
IL6) may influence obesity phenotypes [
6]. A growing body of literature suggest that SNPs from inflammation-related genes could possibly play a role in cytokine production and then interact with dietary
n-3 FAs to modulate inflammation [
7].
n-3 FAs are beneficial for inflammation-related diseases such as rheumatoid arthritis, inflammatory bowel diseases and asthma [
8]. Accordingly, marine
n-3 FAs have been shown to decrease expression levels of inflammation-related genes as well as plasma concentrations of cytokine and C-reactive protein (CRP) [
6]. However, there are no extensive studies showing a strong relationship between expression of inflammation-related genes and
n-3 FA supplementation. Previous research from our laboratory has demonstrated changes in inflammatory pathways in human peripheral blood mononuclear cells (PBMCs) after an
n-3 FA supplementation via a transcriptomic approach [
9]. Similarly, Bouwens
et al. (2009), have examined the effects of high doses of
n-3 FA supplementation on whole-genome gene expression profiles in PBMCs, and reported a decrease in expression of genes involved in inflammatory- and atherogenic-related pathways. Although, according to their results,
TNF-α and
IL6 gene expression levels were not underexpressed after the supplementation [
10].
The aim of the present study was to test whether gene expression of inflammation-related genes is altered following an n-3 FA supplementation and to test for possible gene–diet interactions with SNPs within these genes modulating plasma inflammatory biomarker levels. We hypothesized that a 6-week marine n-3 FA supplementation decreases gene expression of selected inflammation-related genes and also decreases plasma levels of inflammatory biomarkers such as CRP, TNF-α and IL-6 under the influence of SNPs within inflammation-related genes.
2. Results
Population characteristics have been previously described here [
11] for the total cohort and here [
12] for this specific population included in this reanalysis. Briefly, participants have a higher BMI following the 6-week
n-3 FA supplementation (
p = 0.006), but the absolute difference remains extremely low at 0.1 kg/m
2, with no effects on waist circumference. After the supplementation, TG levels decreased, as expected (
p < 0.0001).
Table 1 reports the descriptive characteristics of study participants at baseline.
Pre- and post-supplementation inflammatory marker levels are presented in
Table 2. There was no significant difference observed in inflammatory marker levels. However, a large inter-individual variability was observed in the inflammatory response to a fish oil supplementation. For instance, 45.0%, 47.6% and 48.2% of study participants increased their plasma levels of CRP, TNF-α and IL-6 respectively after the 6-week supplementation.
Energy intakes were lower after the
n-3 FA supplementation (
p = 0.003) as shown in
Table 3. When looking at macronutrient distribution, there was a shift towards an increase in total fat together with a decrease in carbohydrates (absolute difference of 24.8 g/day) and proteins (absolute difference of 5.4 g/day). In fat intake, PUFA intakes were higher (
p = 0.001) as a result of taking 5 g/day of fish oil supplements while saturated FA intakes were lower with an absolute difference of 3.7 g/day.
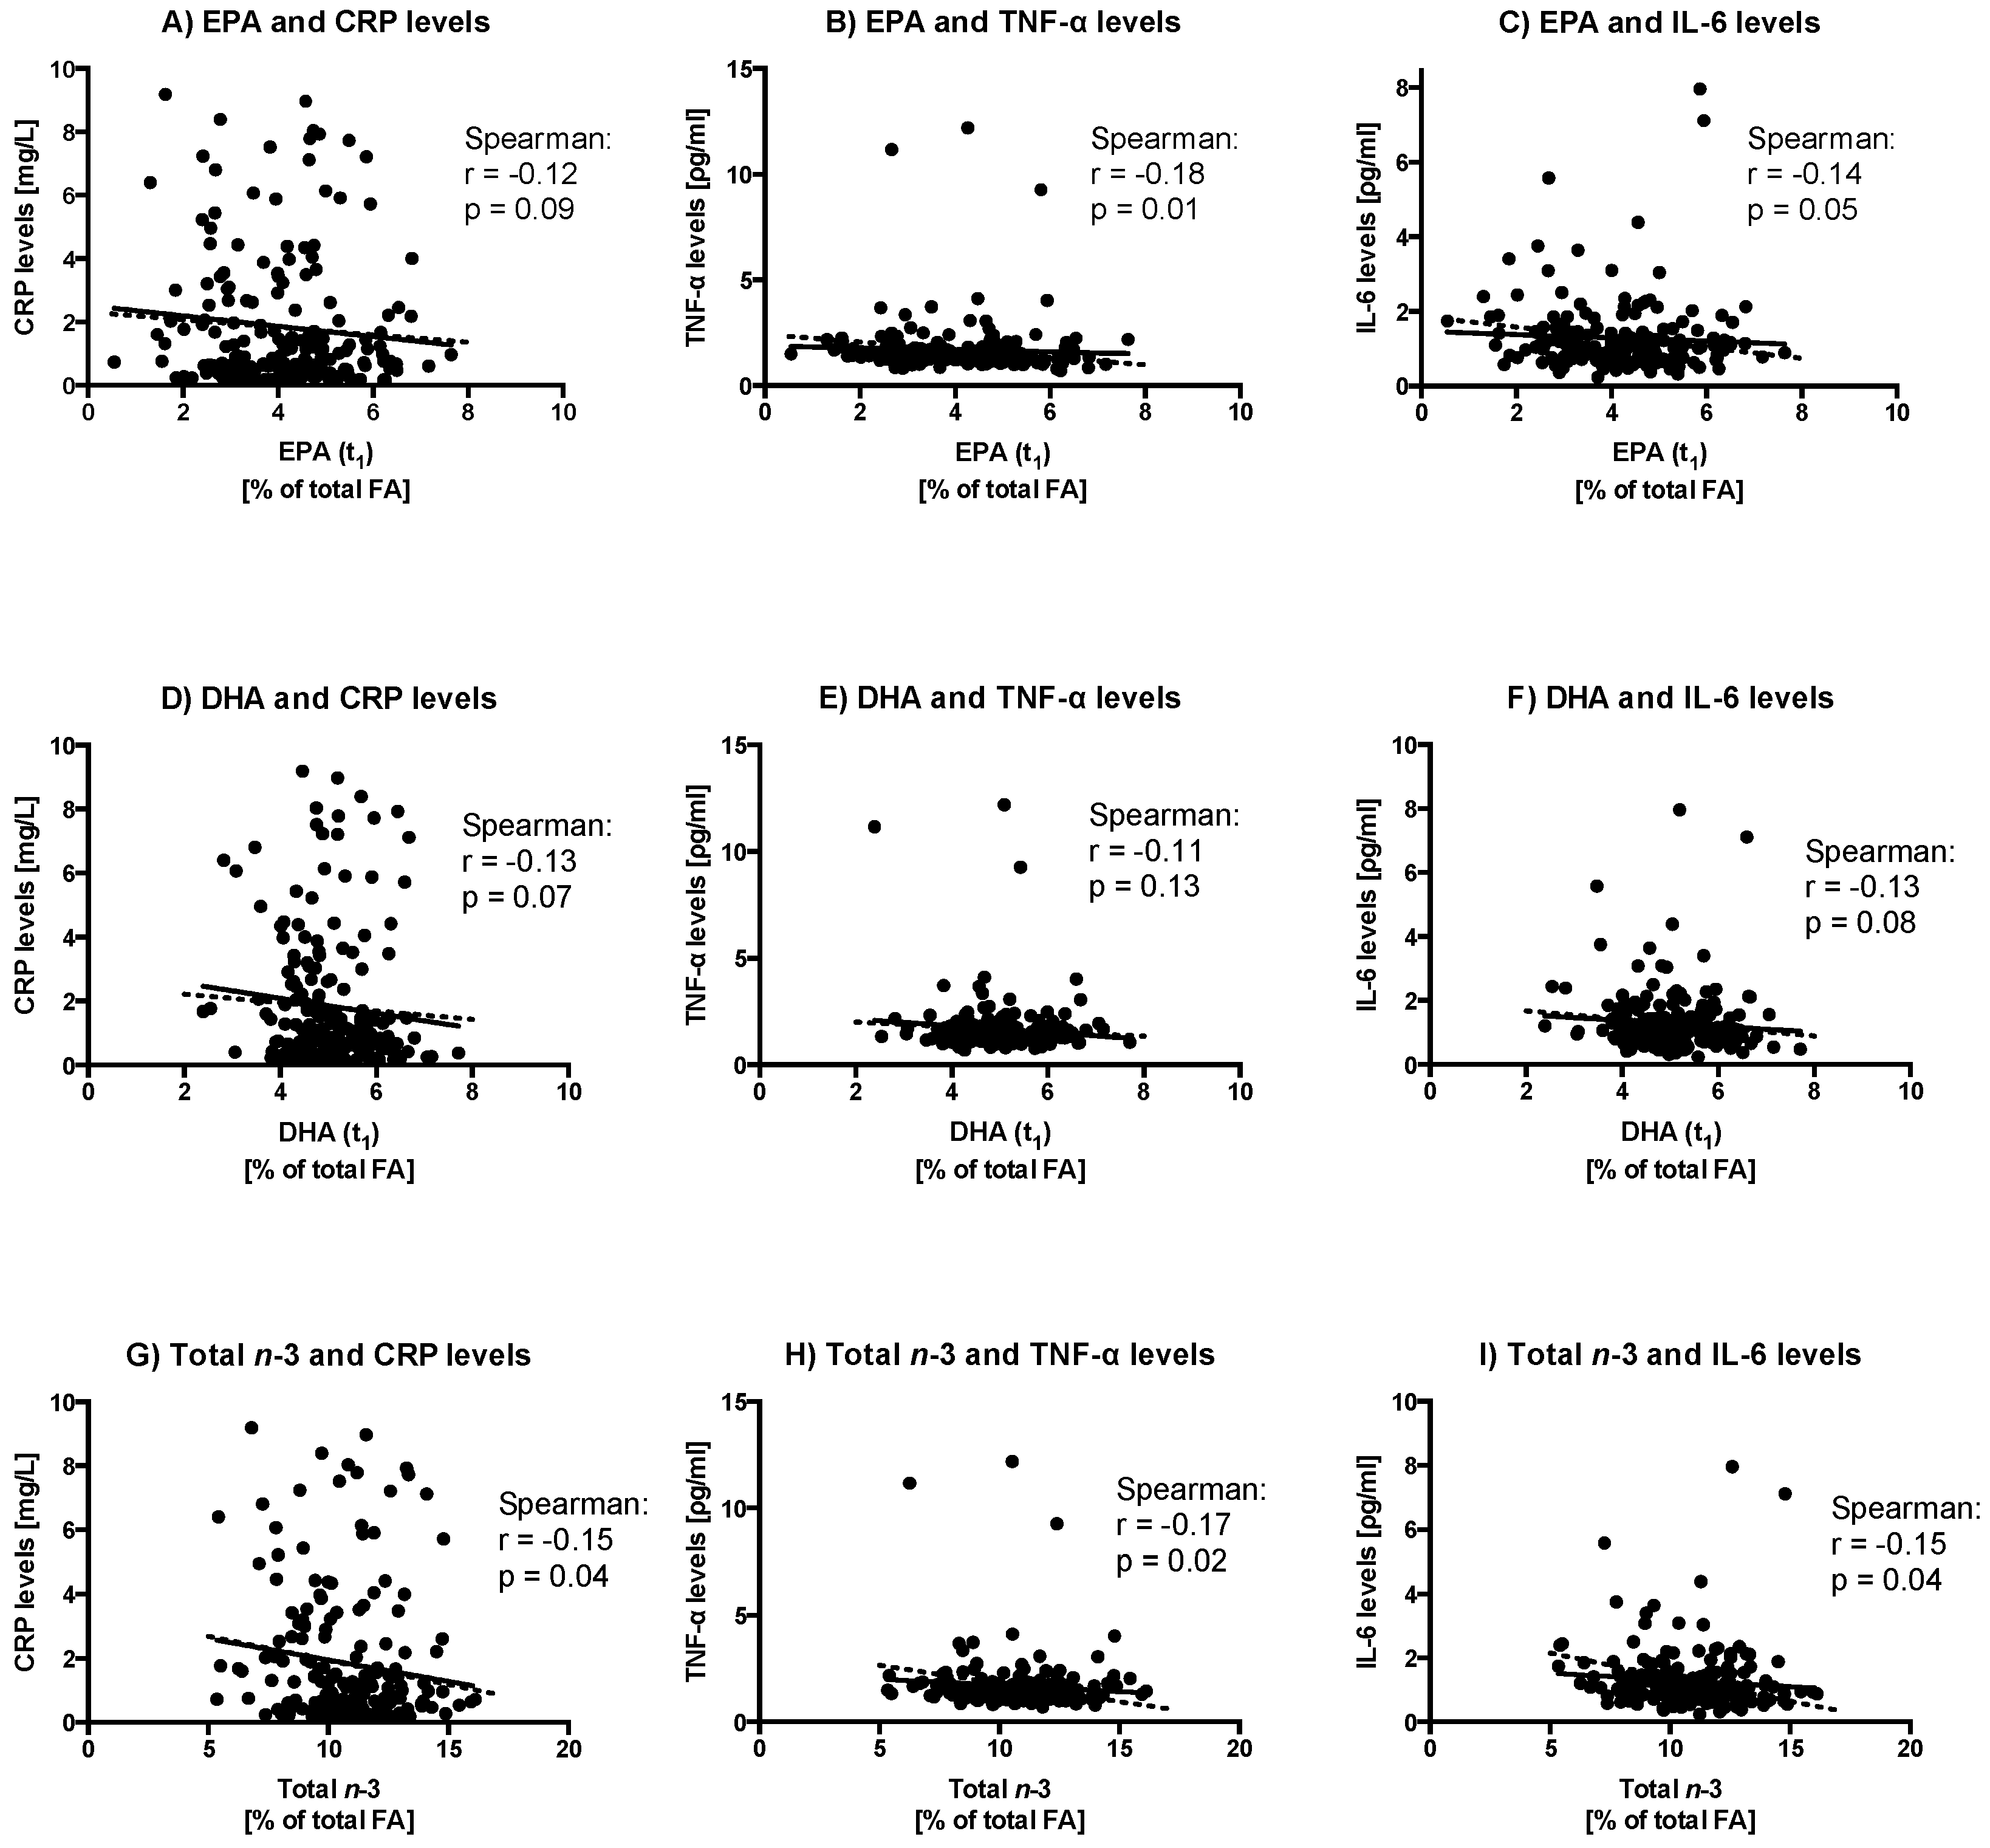
Partial Spearman correlations between EPA, DHA or total
n-3 FA levels (in % of total FA) from plasma phospholipids and inflammatory marker levels adjusted for baseline data (both FAs and inflammatory marker levels), age, sex and BMI are presented in
Figure 1. Briefly, total plasma
n-
3 FA levels negatively correlates with CRP (
r = −0.15,
p = 0.04), TNF-α (
r = −0.17,
p = 0.02), and IL-6 levels (
r = −0.15,
p = 0.04). Looking only at plasma EPA levels, a negative correlation was found with TNF-α levels (
r = −0.18,
p = 0.01) while trends were observed with CRP and IL-6 levels. Plasma DHA levels tended to be negatively correlated with CRP and IL-6 levels (
p < 0.10, for all).
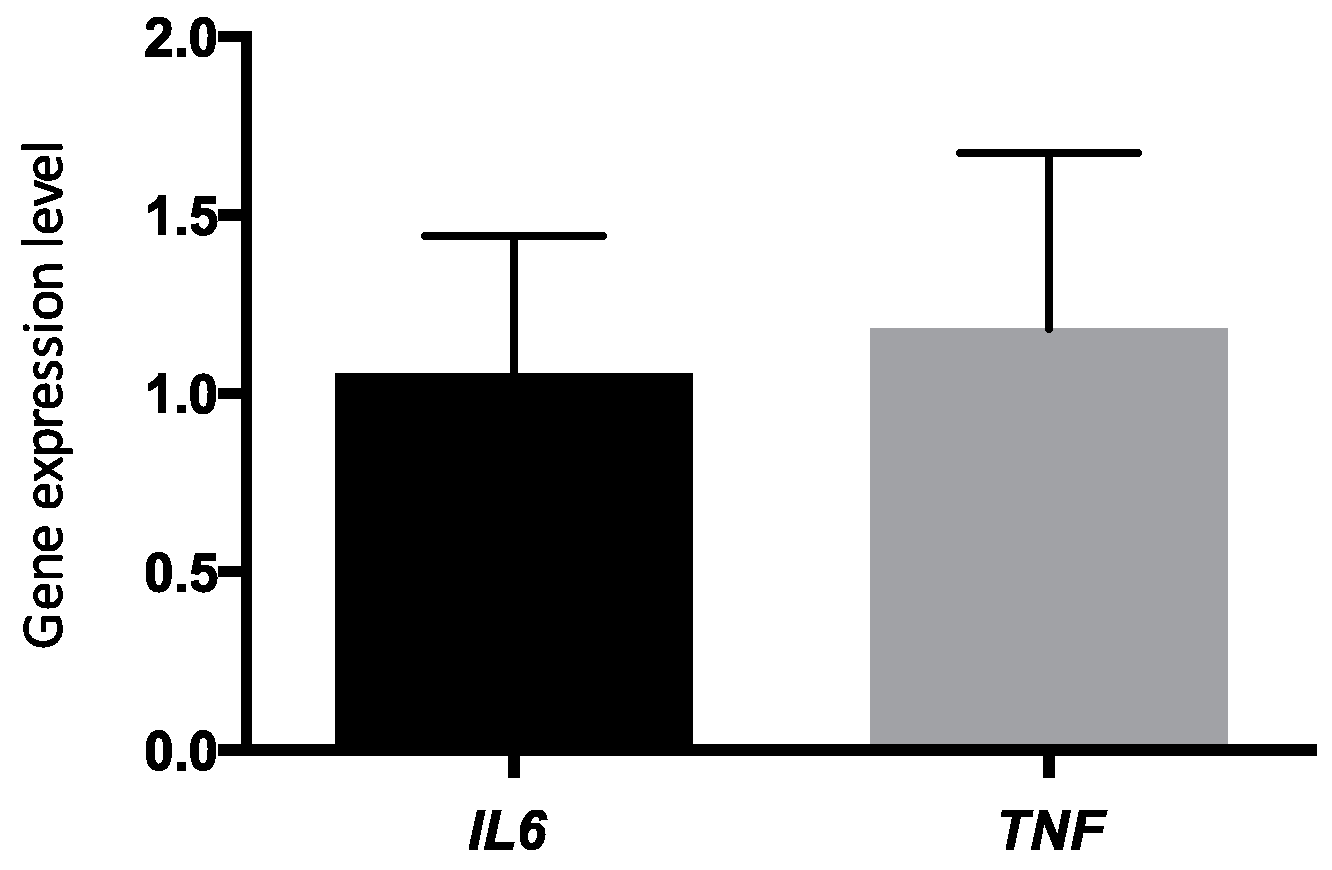
Figure 2 shows a change in the expression of inflammation-related genes. Indeed, using the 2
−ΔΔCT calculation method,
TNF-α and
IL6 were slightly overexpressed in PBMCs after the 6-week
n-3 FA supplementation (fold changes of 1.05 ± 0.38 and 1.18 ± 0.49, respectively), but relative quantification (RQ) within the −0.5 to 2.0 fold are considered as non-significant.
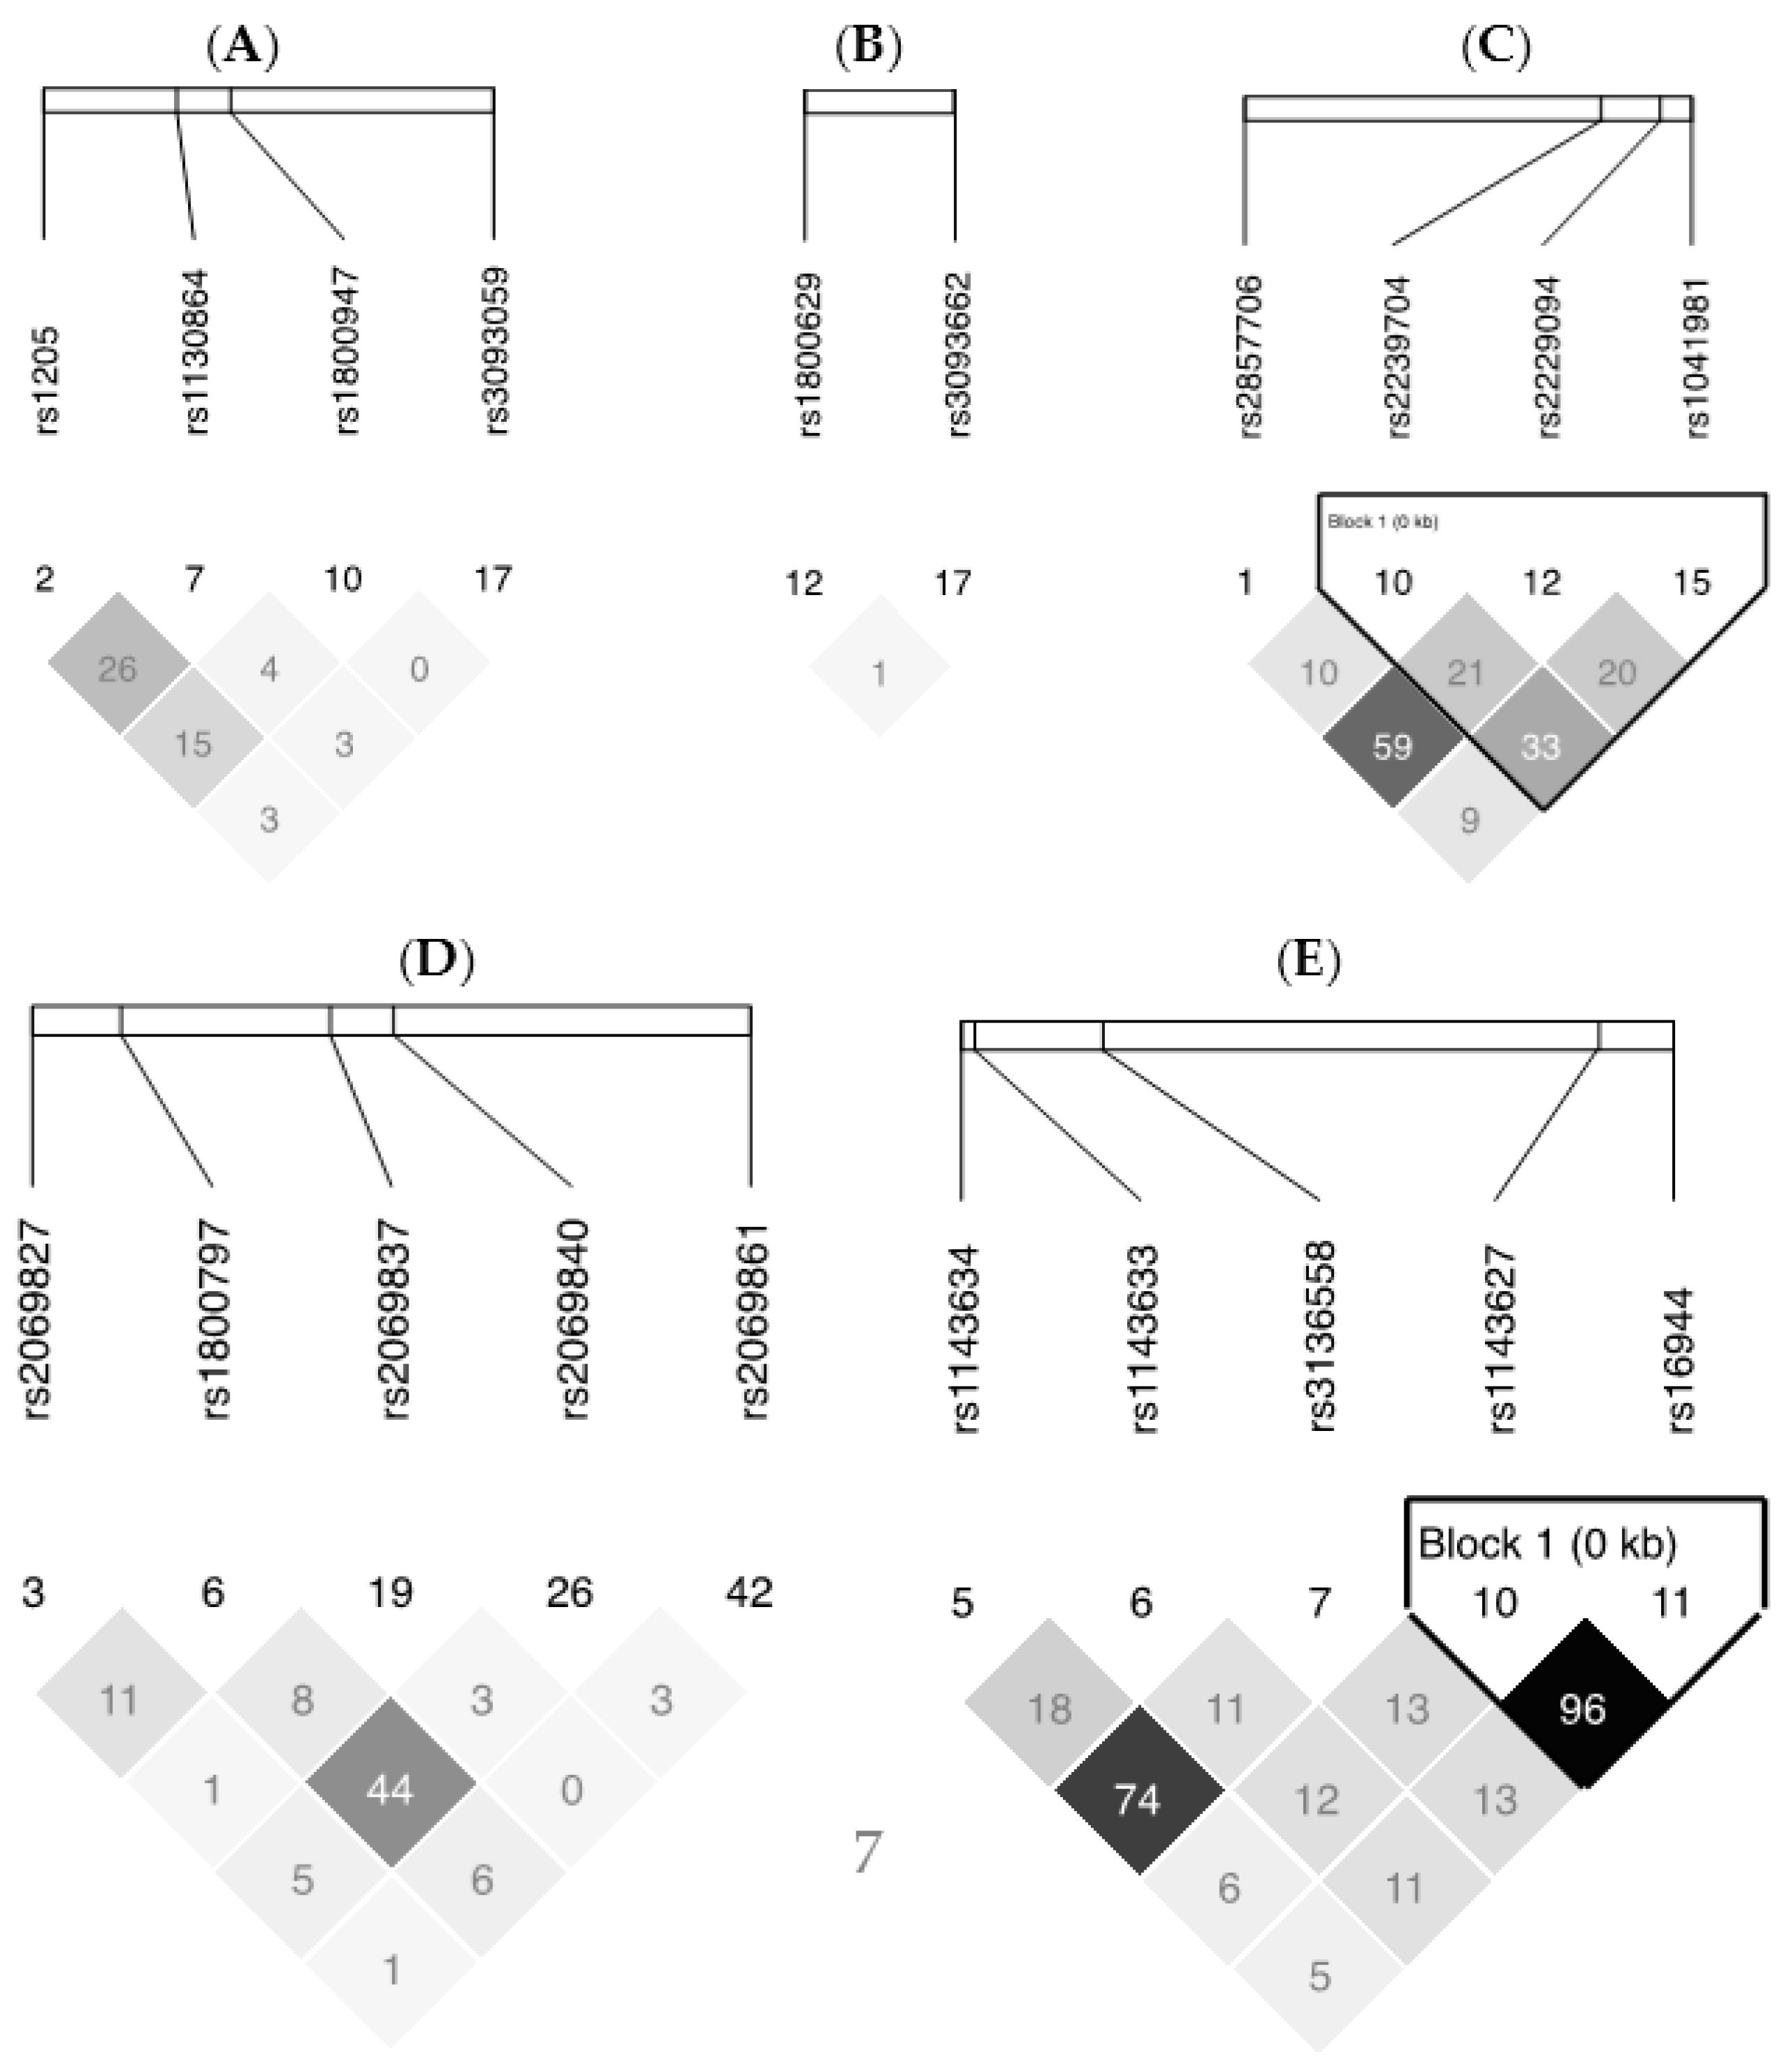
All selected SNPs were in HWE and LD plots from Haploview v4.2 for each gene are presented in
Figure 3. For SNPs within the
TNF-
LTA gene cluster, 6 SNPS covered 93% of the known genetic variability, for
IL6, 5 SNPS covered 100%, for
IL-1β, 5 SNPs covered 100%, and for
CRP, 4 SNPs covered 100%.
Table 4 reports all the selected SNPs within the five inflammation-related genes studied.
In a repeated MIXED model adjusted for the effects of age, sex, and BMI, several gene–diet interactions impacting inflammatory marker levels were observed following the
n-3 FA supplementation, as shown in
Table 5.
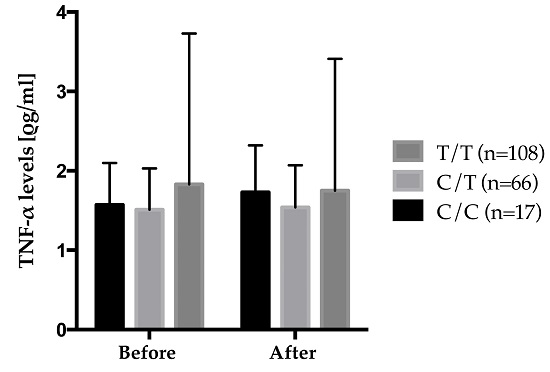
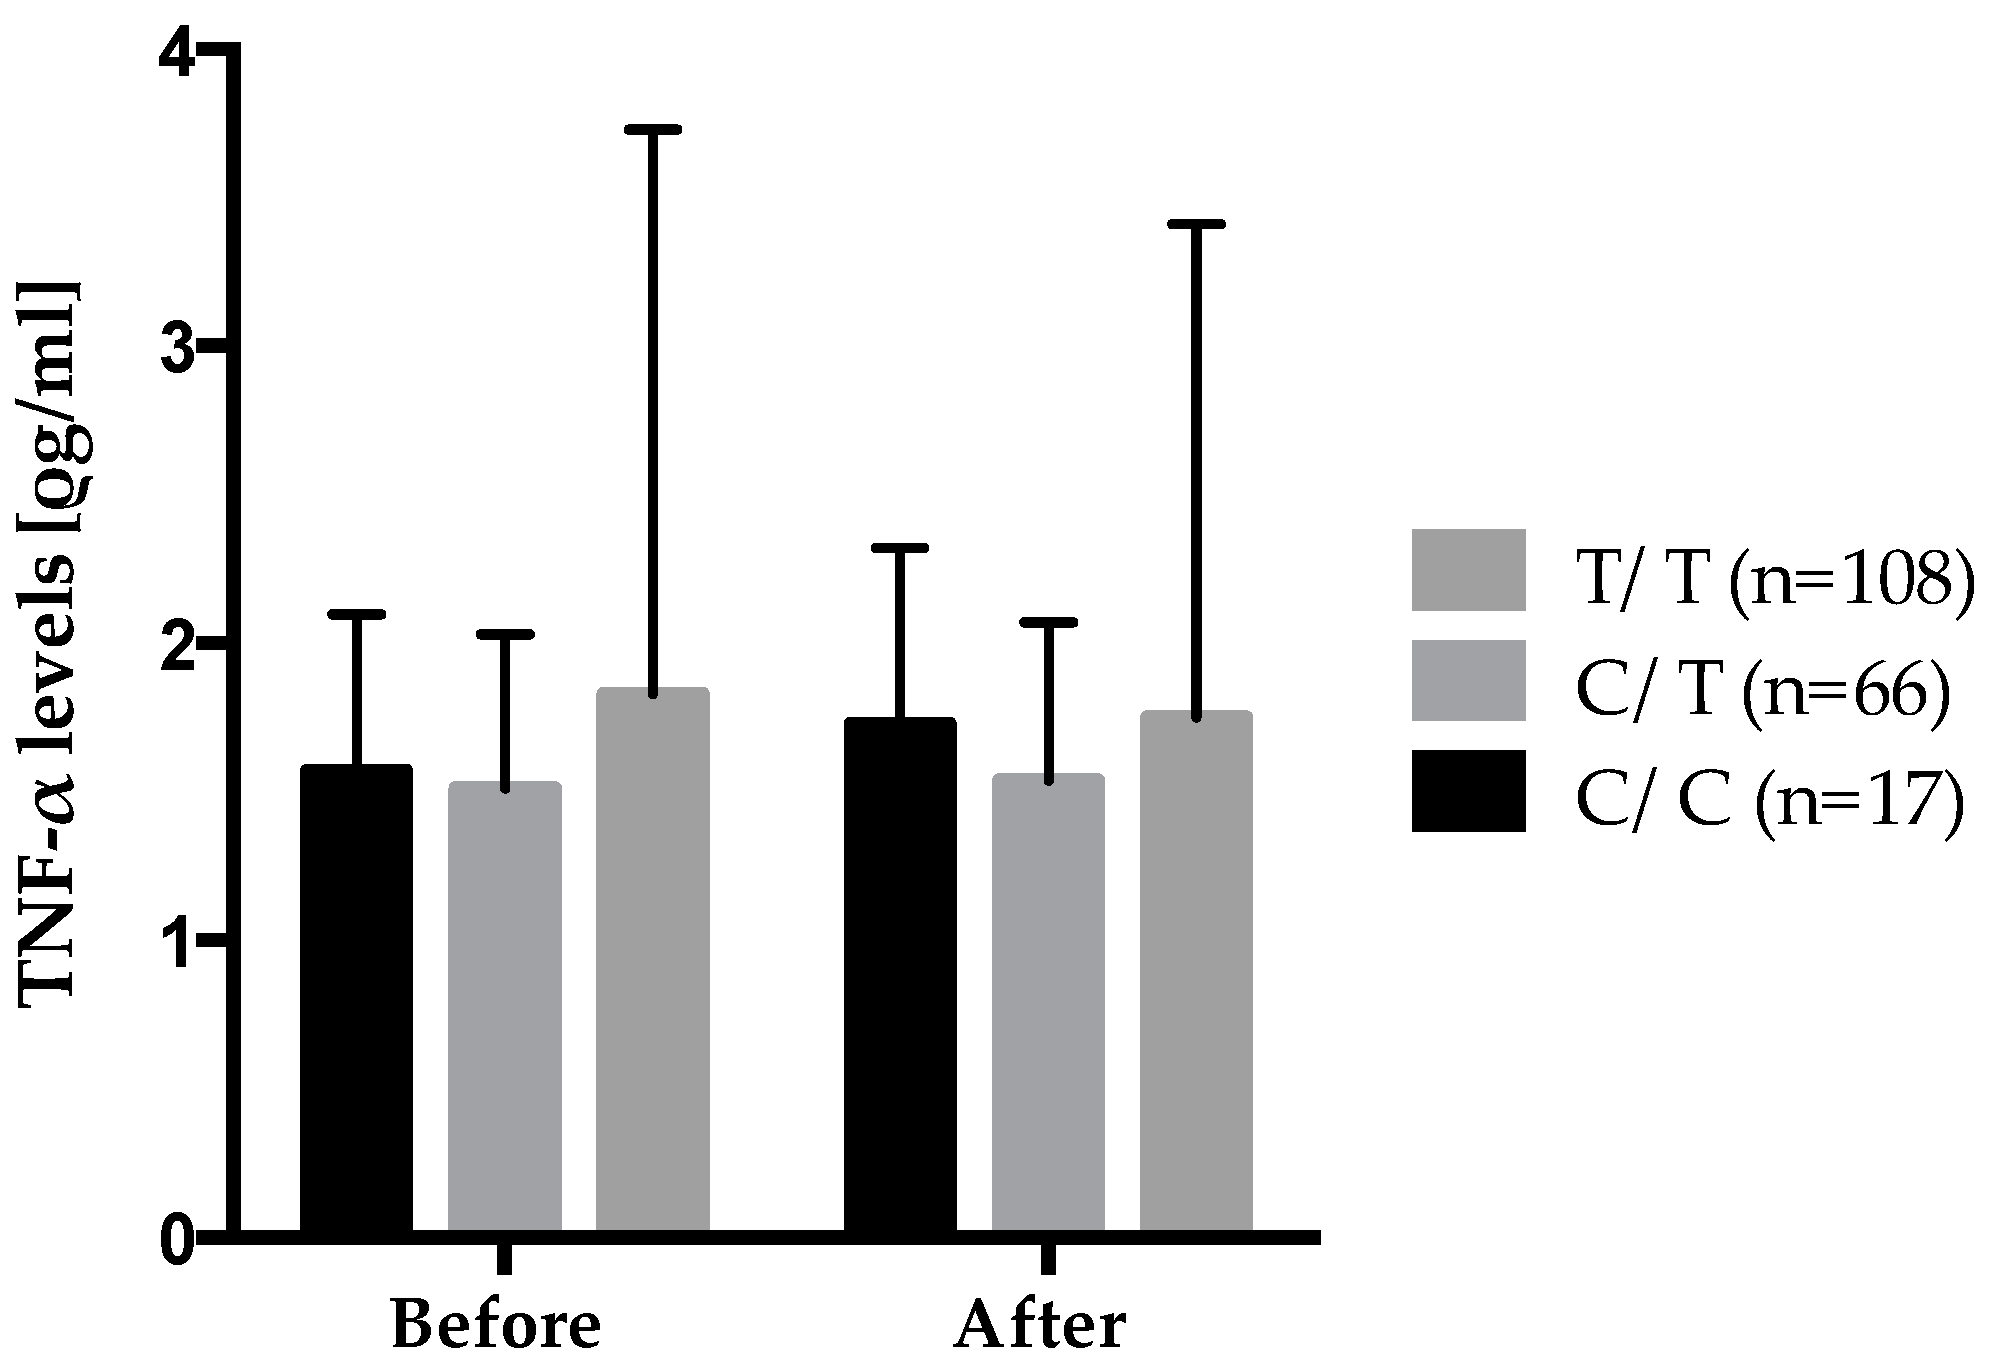
Figure 4 shows the gene–diet interaction on plasma TNF-α levels according to rs2229094 where carriers of the mutated allele increased their plasma TNF-α levels after the 6-week
n-3 FA supplementation while wild type homozygotes decreased theirs. Also, significant differences were observed in the genotype distribution of rs2229094 between positive and negative responders according to delta TNF-α levels where positive responders decreased their plasma TNF-α levels after the supplementation were an increase was observed in negative responders. There was a higher proportion of C/C HMZ that were negative responders (6.8%)
vs. positive responders (2.1%) (
p = 0.0003). An interaction between rs2229094 (
TNF-LTA) and the 6-week
n-3 FA supplementation is of particular interest because that SNP is located in an exon and is responsible for an amino acid change (Cys13Arg). Moreover, analyses with SIFT argue for potential functional effect of this SNP as the amino acid change was considered damaged using homologues in protein alignment (score = 0.04), but tolerated using orthologues in protein alignment.
3. Discussion
We observed in the present study that
n-3 FAs may interact with SNPs from inflammation-related genes to modulate plasma cytokine levels. There was no reduction of plasma IL-6 and TNF-α as well as CRP levels, but several gene–diet interactions with SNPs within inflammation-related genes and
n-3 FAs have been found potentially modulating inflammatory marker levels. These findings are consistent with the well-known anti-inflammatory properties of
n-3 FAs, but the amplitude of the results may differ according to an individual’s genotype. In addition to nutrigenetic effects, baseline plasma EPA, DHA or total
n-3 FA levels are negatively associated with plasma cytokine and CRP levels (
Figure 1).
Ferrucci
et al. have reported that plasma levels of
n-3 FAs were independently associated with lower levels of pro-inflammatory markers and higher levels of anti-inflammatory markers independent of confounders such as age, sex, BMI, smoking status, education, energy intake, and potentially confounding drug treatment among others [
13]. They observed that lower EPA and total
n-3 FAs were associated with higher IL-6 and TNF-α levels (for total
n-3 FAs only) [
13]. Our results are moving in the same direction as shown by the correlations between baseline FA levels with the principal inflammatory biomarkers (
Figure 1).
Trebble
et al. have shown in 16 healthy subjects, that the dose-response relationships between
n-3 FA, phospholipid composition and cytokine production by PBMCs is U-shaped meaning that an intermediate levels of EPA within plasma and cell membrane phospholipids, resulting from an
n-3 FA supplementation of <2.0 g/day, may be associated with a greater inhibitory effect on TNF-α release than higher EPA concentrations resulting from
n-3 FA supplementary intakes of >2.0 g/day [
14]. Rees
et al. have suggested that there is a threshold for an anti-inflammatory effect of EPA somewhere between 1.35 and 2.7 g/day [
15]. However, in the present study, there was no significant reduction in plasma CRP, IL-6 or TNF-α levels despite the high doses of
n-3 FAs used during the protocol (
Table 4). This could be explained by low baseline levels of inflammatory markers, by the exclusion of individuals with plasma CRP levels >10.0 mg/L, or by the intermediate doses of EPA given to study participants. Moreover, there could be a differential effect of each of the
n-3 FAs impacting inflammatory marker levels.
Moreover, besides the independent influence of dietary FAs on cytokine levels, some SNPs in the
TNF-LTA gene family may be related to the inter-individual variability observed in plasma TNF-α levels and
TNF-α gene expression [
6]. In this study, rs2229094 (
TNF-α
) is associated with plasma TNF-α levels. This SNP is of particular interest due to its exonic location and the presence of a missense mutation (Cys13Arg) that is located at a conserved residue. Recent studies have shown that rs2229094 was associated with type 2 diabetes [
16], CRP levels [
16], sepsis [
17], Crohn’s disease [
18], and cancer risk [
19]. According to Huang
et al., four functional SNPs of the LTA gene, including rs2229094, may exert possible regulatory effects on gene expression and cytokine production [
19].
Another SNPs in the
TNF-LTA gene family was associated with inflammatory responses. Indeed, we observed an interaction between rs1800629 and
n-3 FAs modulating CRP levels where carriers of the mutated allele had significantly higher CRP levels than the wild-type genotype after fish oil supplementation (
Table 5). Song
et al. have found that the mutated allele of rs1800629 was associated with increased TNF-α production in PBMCs from healthy subjects after stimulation with LPS [
20]. Studies have reported that dietary fat intake could alter the relationship between
TNF −308G>A (also referred to as rs1800629) with adiposity and serum lipid concentrations. The main results of these studies are that
TNF −308G>A was associated with an increased risk of obesity and dyslipidaemia, and carriers of the mutated allele appeared to be more responsive to dietary fat intake [
21,
22]. Meydani
et al. reported that the production of the cytokines IL-1β, TNF-α, and IL-6 by mononuclear cells was reduced after the consumption of the low-fat, high-fish diet [
23].
Evidence have shown that carriers of the mutated allele had a 2-fold increase in the
TNF-α transcriptional activity, thus playing a role in the altered
TNF-α gene expression possibly leading to an increase in cytokine production [
24]. Moreover, Wilson
et al. have found that rs1800629 may exert direct effects on
TNF-α gene regulation, potentially leading to high TNF-α phenotype (expression levels, transcriptional activity, inflammatory marker levels) and more severe infection diseases in TNF2 homozygotes [
25]. For example, Antonicelli
et al. reported that carriers of
TNF-α gene −308G>A were more likely to be affected by severe ischemic damage in a case-control study including elderly Italian individuals with and without coronary heart disease [
26]. However, in this study, there were no significant differences observed in
TNF-α gene expression nor in plasma TNF-α levels according to the rs1800629 genotype both in dominant and additive models. Although the relative change in TNF-α levels after the supplementation was not statistically significant between genotype groups owning to the small sample size, the difference was clinically relevant and seems to be in agreement with the actual literature (delta TNF-α→G/G: 28.0%
vs. A/G: 3.3%
vs. A/A 1.3%). This heterogeneity observed in the response to fish oil could be partly explained by the replacement of arachidonic acids by
n-3 FAs into cell membranes leading to the production of diverse eicosanoids. Accordingly, Grimble
et al. have suggested that the overall effect on TNF-α production (inhibition or stimulation) probably depends on the balance among the different stimulatory and inhibitory eicosanoids produced from arachidonic acid and EPA [
7].
Although gene expression of inflammation-related genes is often decreased following an increase of the
n-
3 FAs in the diet [
27,
28,
29], several studies reported no significant decrease in plasmatic levels of inflammatory biomarkers, such as TNF-α, IL-6 or CRP [
13,
30]. In the present study,
TNF-α and
IL6 genes were slightly overexpressed in PBMCs after the 6-week
n-3 FA supplementation, but relative quantification (RQ) within the −0.5 to 2.0 fold are considered not significant. There was no clear effect of the 6-week
n-3 FA supplementation on the expression of the two selected inflammation-related genes (
IL6 and
TNF-α) on a metabolically healthy, but slightly overweight population, even with the use of triplicates to ensure a better reduction in biological variance. These results failed to demonstrate changes in expression levels of
TNF-α and
IL6 when looking at these two genes specifically using a real-time PCR approach. However, Rudkowska
et al. and Bouwens
et al. have shown using transcriptomic approaches that inflammation-related pathways in PBMCs were changed to the anti-inflammatory direction after an
n-3 FA supplementation [
9,
10].
Strengths and Limitations
Several limitations of the present study need to be addressed. Participants were relatively young (mean age of 30.8 ± 8.7 years) and they had low inflammatory biomarker levels at baseline. The patients were healthy and we excluded participants having plasma CRP levels > 10 mg/L. We did not observe difference in gene expression of inflammation-related genes after the supplementation. This could be attributable to the use of the 2−ΔΔCT calculation method assuming that the endogenous control gene and target gene have both similar efficiencies. Also, this study did not allow to isolate the effect of a single FA and its potential gene–diet interactions on inflammatory markers due to the composition of the n-3 FA fish oil capsules given to participants that contained EPA and DHA.


