Article

Clinical Role of ASCT2 (SLC1A5) in KRAS-Mutated Colorectal Cancer

Department of Surgery, Graduate School of Medicine, Kyoto University, Kyoto 606-8507, Japan
*
Author to whom correspondence should be addressed.
These authors contributed equally to this work.
Int. J. Mol. Sci. 2017, 18(8), 1632; https://doi.org/10.3390/ijms18081632
Submission received: 29 June 2017 / Revised: 24 July 2017 / Accepted: 24 July 2017 / Published: 27 July 2017
(This article belongs to the Special Issue Chemical and Molecular Approach to Tumor Metastases)

Abstract

:
Mutation in the KRAS gene induces prominent metabolic changes. We have recently reported that KRAS mutations in colorectal cancer (CRC) cause alterations in amino acid metabolism. However, it remains to be investigated which amino acid transporter can be regulated by mutated KRAS in CRC. Here, we performed a screening of amino acid transporters using quantitative reverse-transcription polymerase chain reaction (RT-PCR) and then identified that ASCT2 (SLC1A5) was up-regulated through KRAS signaling. Next, immunohistochemical analysis of 93 primary CRC specimens revealed that there was a significant correlation between KRAS mutational status and ASCT2 expression. In addition, the expression level of ASCT2 was significantly associated with tumor depth and vascular invasion in KRAS-mutant CRC. Notably, significant growth suppression and elevated apoptosis were observed in KRAS-mutant CRC cells upon SLC1A5-knockdown. ASCT2 is generally known to be a glutamine transporter. Interestingly, SLC1A5-knockdown exhibited a more suppressive effect on cell growth than glutamine depletion. Furthermore, SLC1A5-knockdown also resulted in the suppression of cell migration. These results indicated that ASCT2 (SLC1A5) could be a novel therapeutic target against KRAS-mutant CRC.

Graphical Abstract

1. Introduction

Colorectal cancer (CRC) is one of the most common cancers worldwide; therefore, development of novel diagnostic measures and treatment is very important [1]. KRAS mutations are found in approximately 40% of CRC cases [2,3,4]. A number of clinical trials have shown that KRAS mutations in CRC can predict a lack of responses towards anti-epidermal growth factor receptor (EGFR)-based therapy [2,3,4]. Therefore, development of new therapy for CRC with mutated KRAS has been desired clinically. Some studies have investigated the correlation between KRAS mutations and metabolic alterations in pancreatic and lung cancers [5,6,7,8,9] as well as in CRC [10,11,12,13,14,15]. We have recently reported that, using metabolome analysis, concentration of amino acids is elevated in CRC cells with mutated KRAS compared to CRC cells with wild-type KRAS [12]. The increase in glucose transporter 1 (GLUT1) expression and glucose uptake was critically dependent on mutated KRAS [16,17,18]. However, it remains to be investigated which amino acid transporter is specifically regulated by mutated KRAS in CRC. In the present study, we performed a screening of amino acid transporters in KRAS-mutant CRC cells transfected by siKRAS and found that ASCT2 (SLC1A5) was particularly up-regulated through KRAS signaling.
The SLC1A5 gene encodes alanine-serine-cysteine amino acid transporter (ASCT2), which is an essential glutamine transporter. ASCT2 over-expression has been reported in several cancers [19,20,21,22,23,24,25,26,27,28,29,30,31]. However, the role of ASCT2 in CRC has not yet been reported. In addition to glucose, glutamine is an essential source of cellular building blocks to fuel cell proliferation. Recent studies have established a better understanding about the importance of glutamine as a critical nutrient in fast growing cancer cells [32,33,34]. In the present study, we investigated the significance of ASCT2 expression in CRC using in vitro cultures and clinical samples.

2. Results

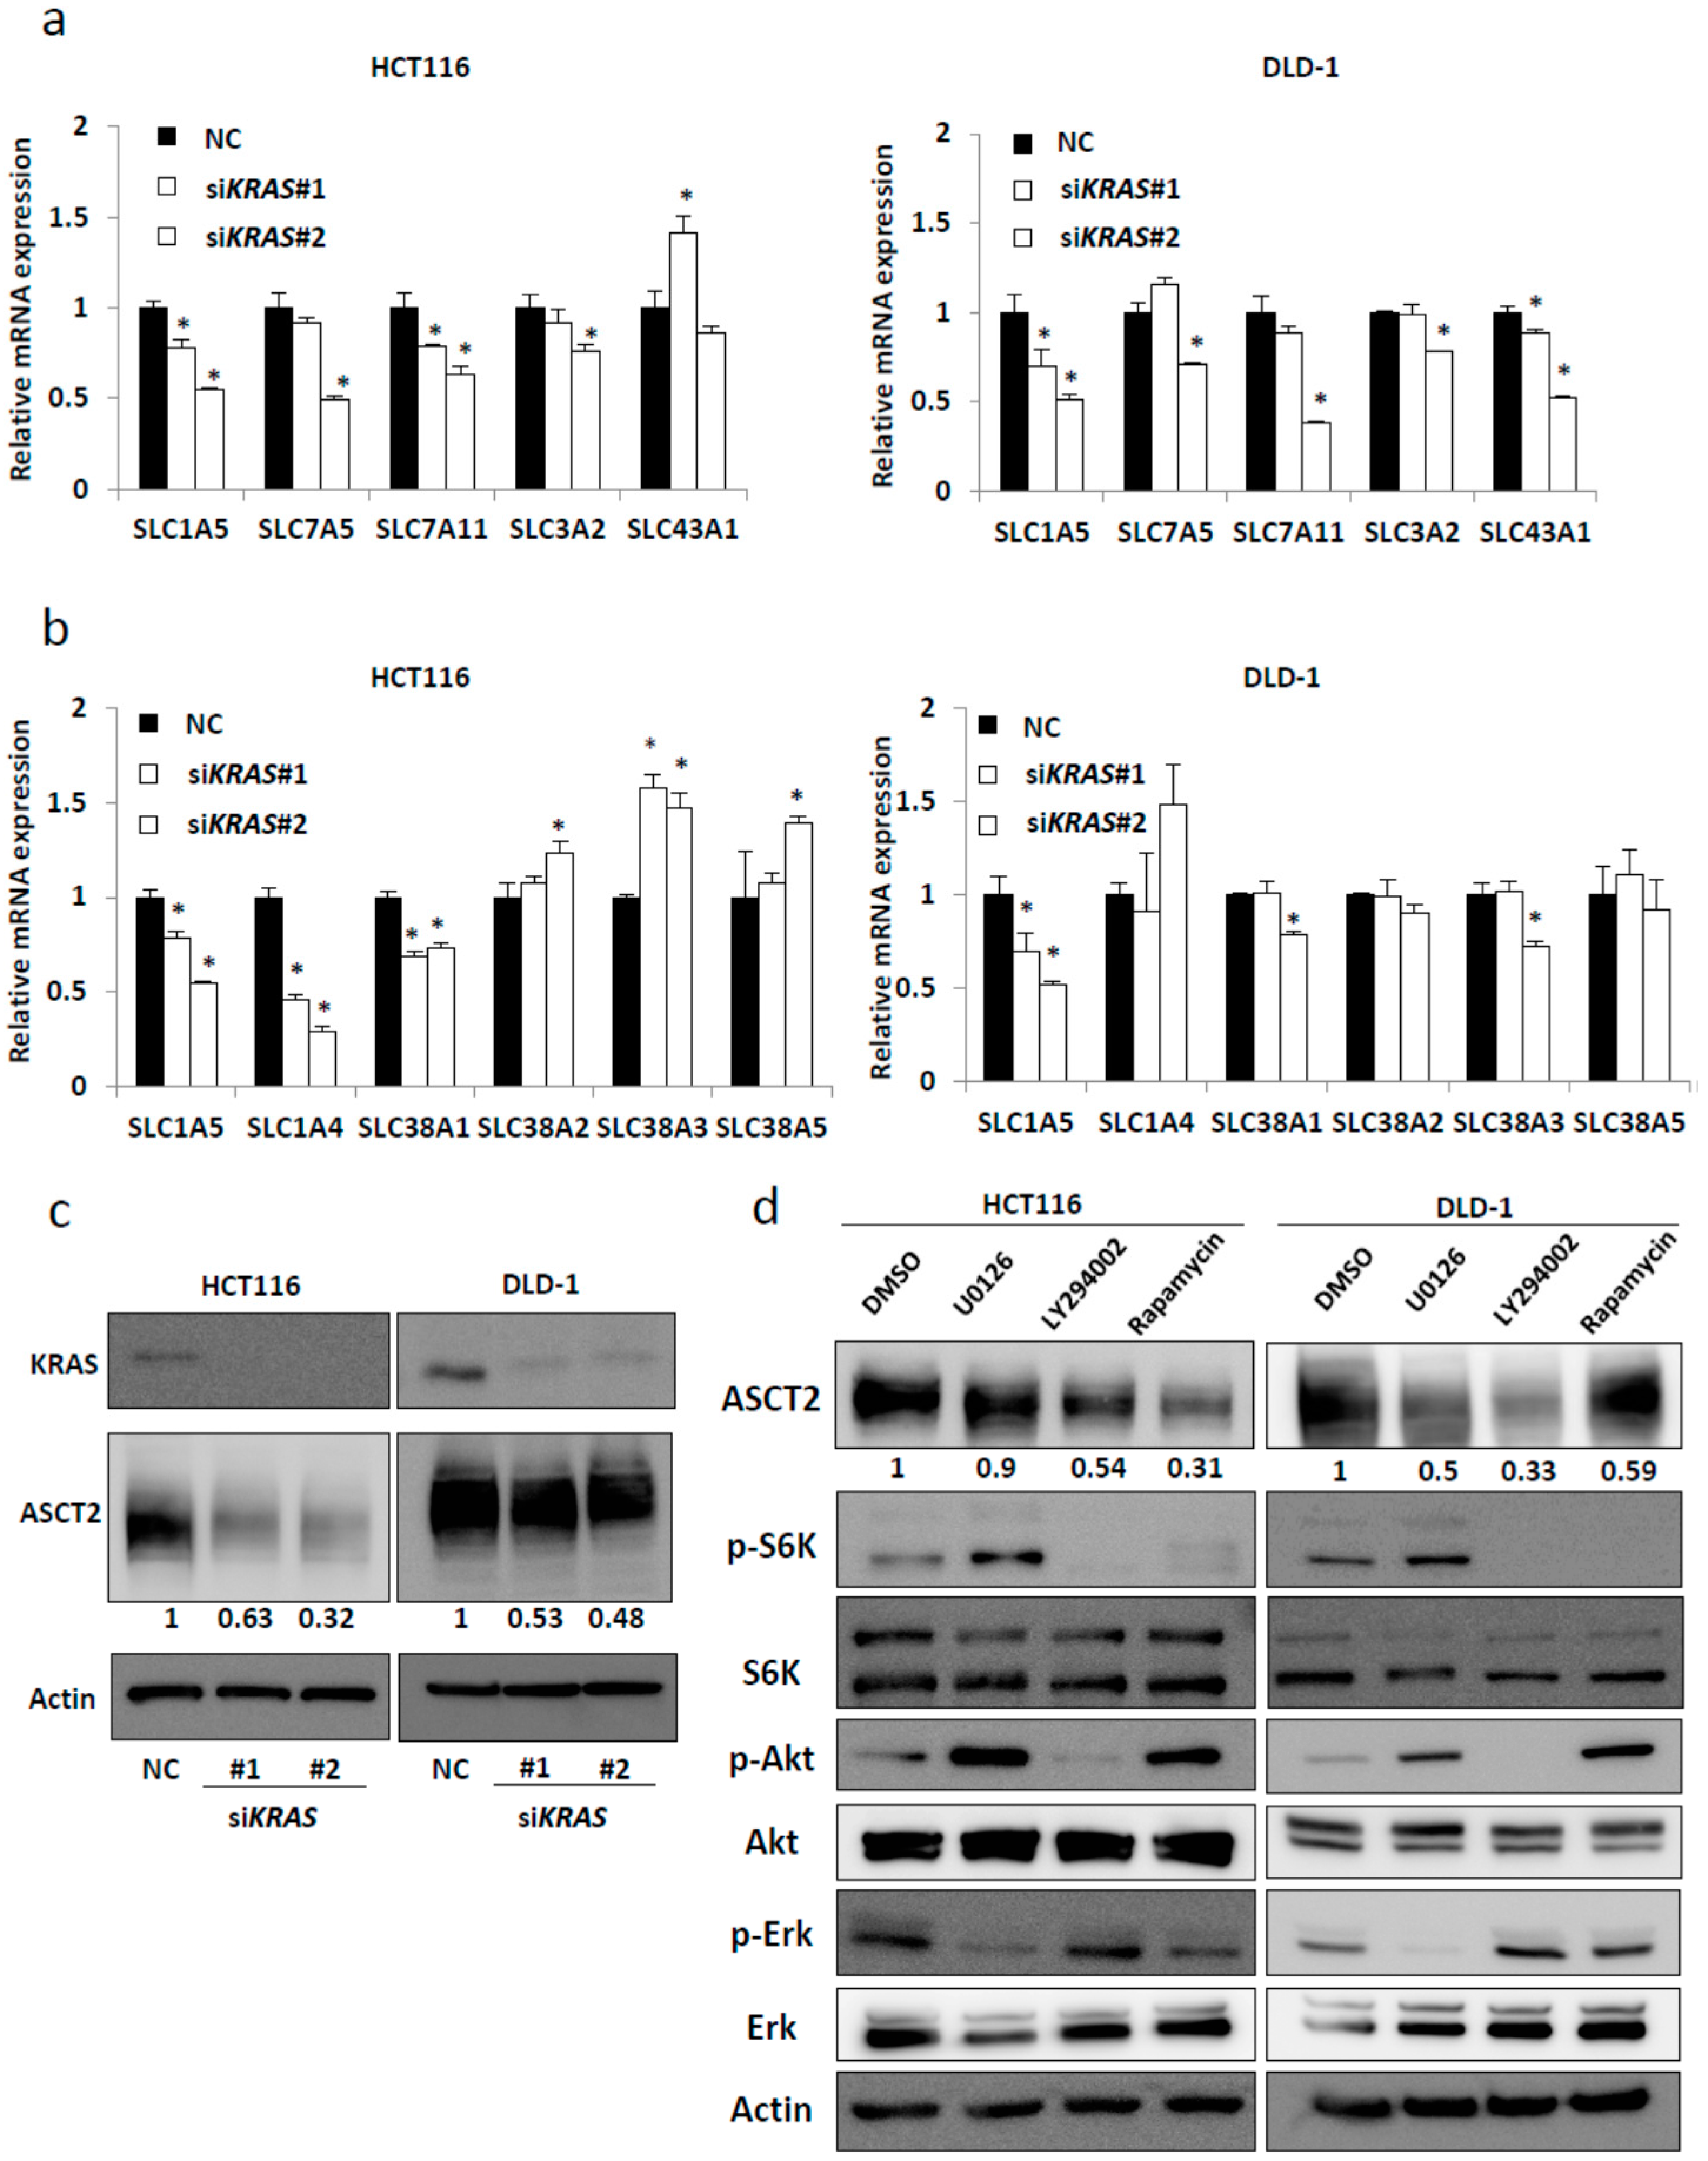
2.1. SLC1A5 (ASCT2) Is Regulated through KRAS Signaling in KRAS-Mutant CRC Cells

We have recently reported that mutated KRAS induces metabolic alterations in many amino acids [12]. Therefore, we hypothesized that the expression of amino acid transporters might be regulated by mutated KRAS. Several amino acid transporters (SLC1A5, SLC7A5, SLC7A11, SLC3A2, and SLC43A1) have been reported to be up-regulated in different cancers [32]. To determine the specific transporter that could be regulated by mutated KRAS, we introduced two different small interfering RNAs (siRNAs) targeting KRAS in KRAS-mutant CRC cell lines (HCT116 and DLD-1). We confirmed that siKRAS significantly reduced the mRNA levels of KRAS in both cell lines (Figure S1a). Interestingly, KRAS-knockdown significantly reduced SLC1A5 expression in both KRAS-mutant cell lines (Figure 1a). SLC1A5 (ASCT2) is a known glutamine transporter. Next, we investigated whether glutamine transporters other than SLC1A5 (i.e., SLC1A4, SLC38A1, SLC38A2, SLC38A3, and SLC38A5) could be regulated by KRAS signaling [33]. Expression levels of SLC1A4 and SLC38A1 were decreased after KRAS-knockdown in HCT116; however, their expression was not decreased in DLD-1 (Figure 1b). We also found that KRAS-knockdown significantly reduced protein expression of ASCT2 in both KRAS-mutant cell lines (Figure 1c). The mutated KRAS continuously activates both Raf/MEK/ERK and PI3K/Akt/mTOR pathways. To investigate which pathway regulates ASCT2 expression, we used specific inhibitors of each pathway. Western blot analysis revealed that ASCT2 expression was dramatically reduced in KRAS-mutant CRC cell lines by addition of LY 294002 (PI3K inhibitor) or rapamycin (mTOR inhibitor), which suggested that KRAS signaling may regulate ASCT2 expression in CRC mainly via the PI3–Akt–mTOR pathway (Figure 1d).

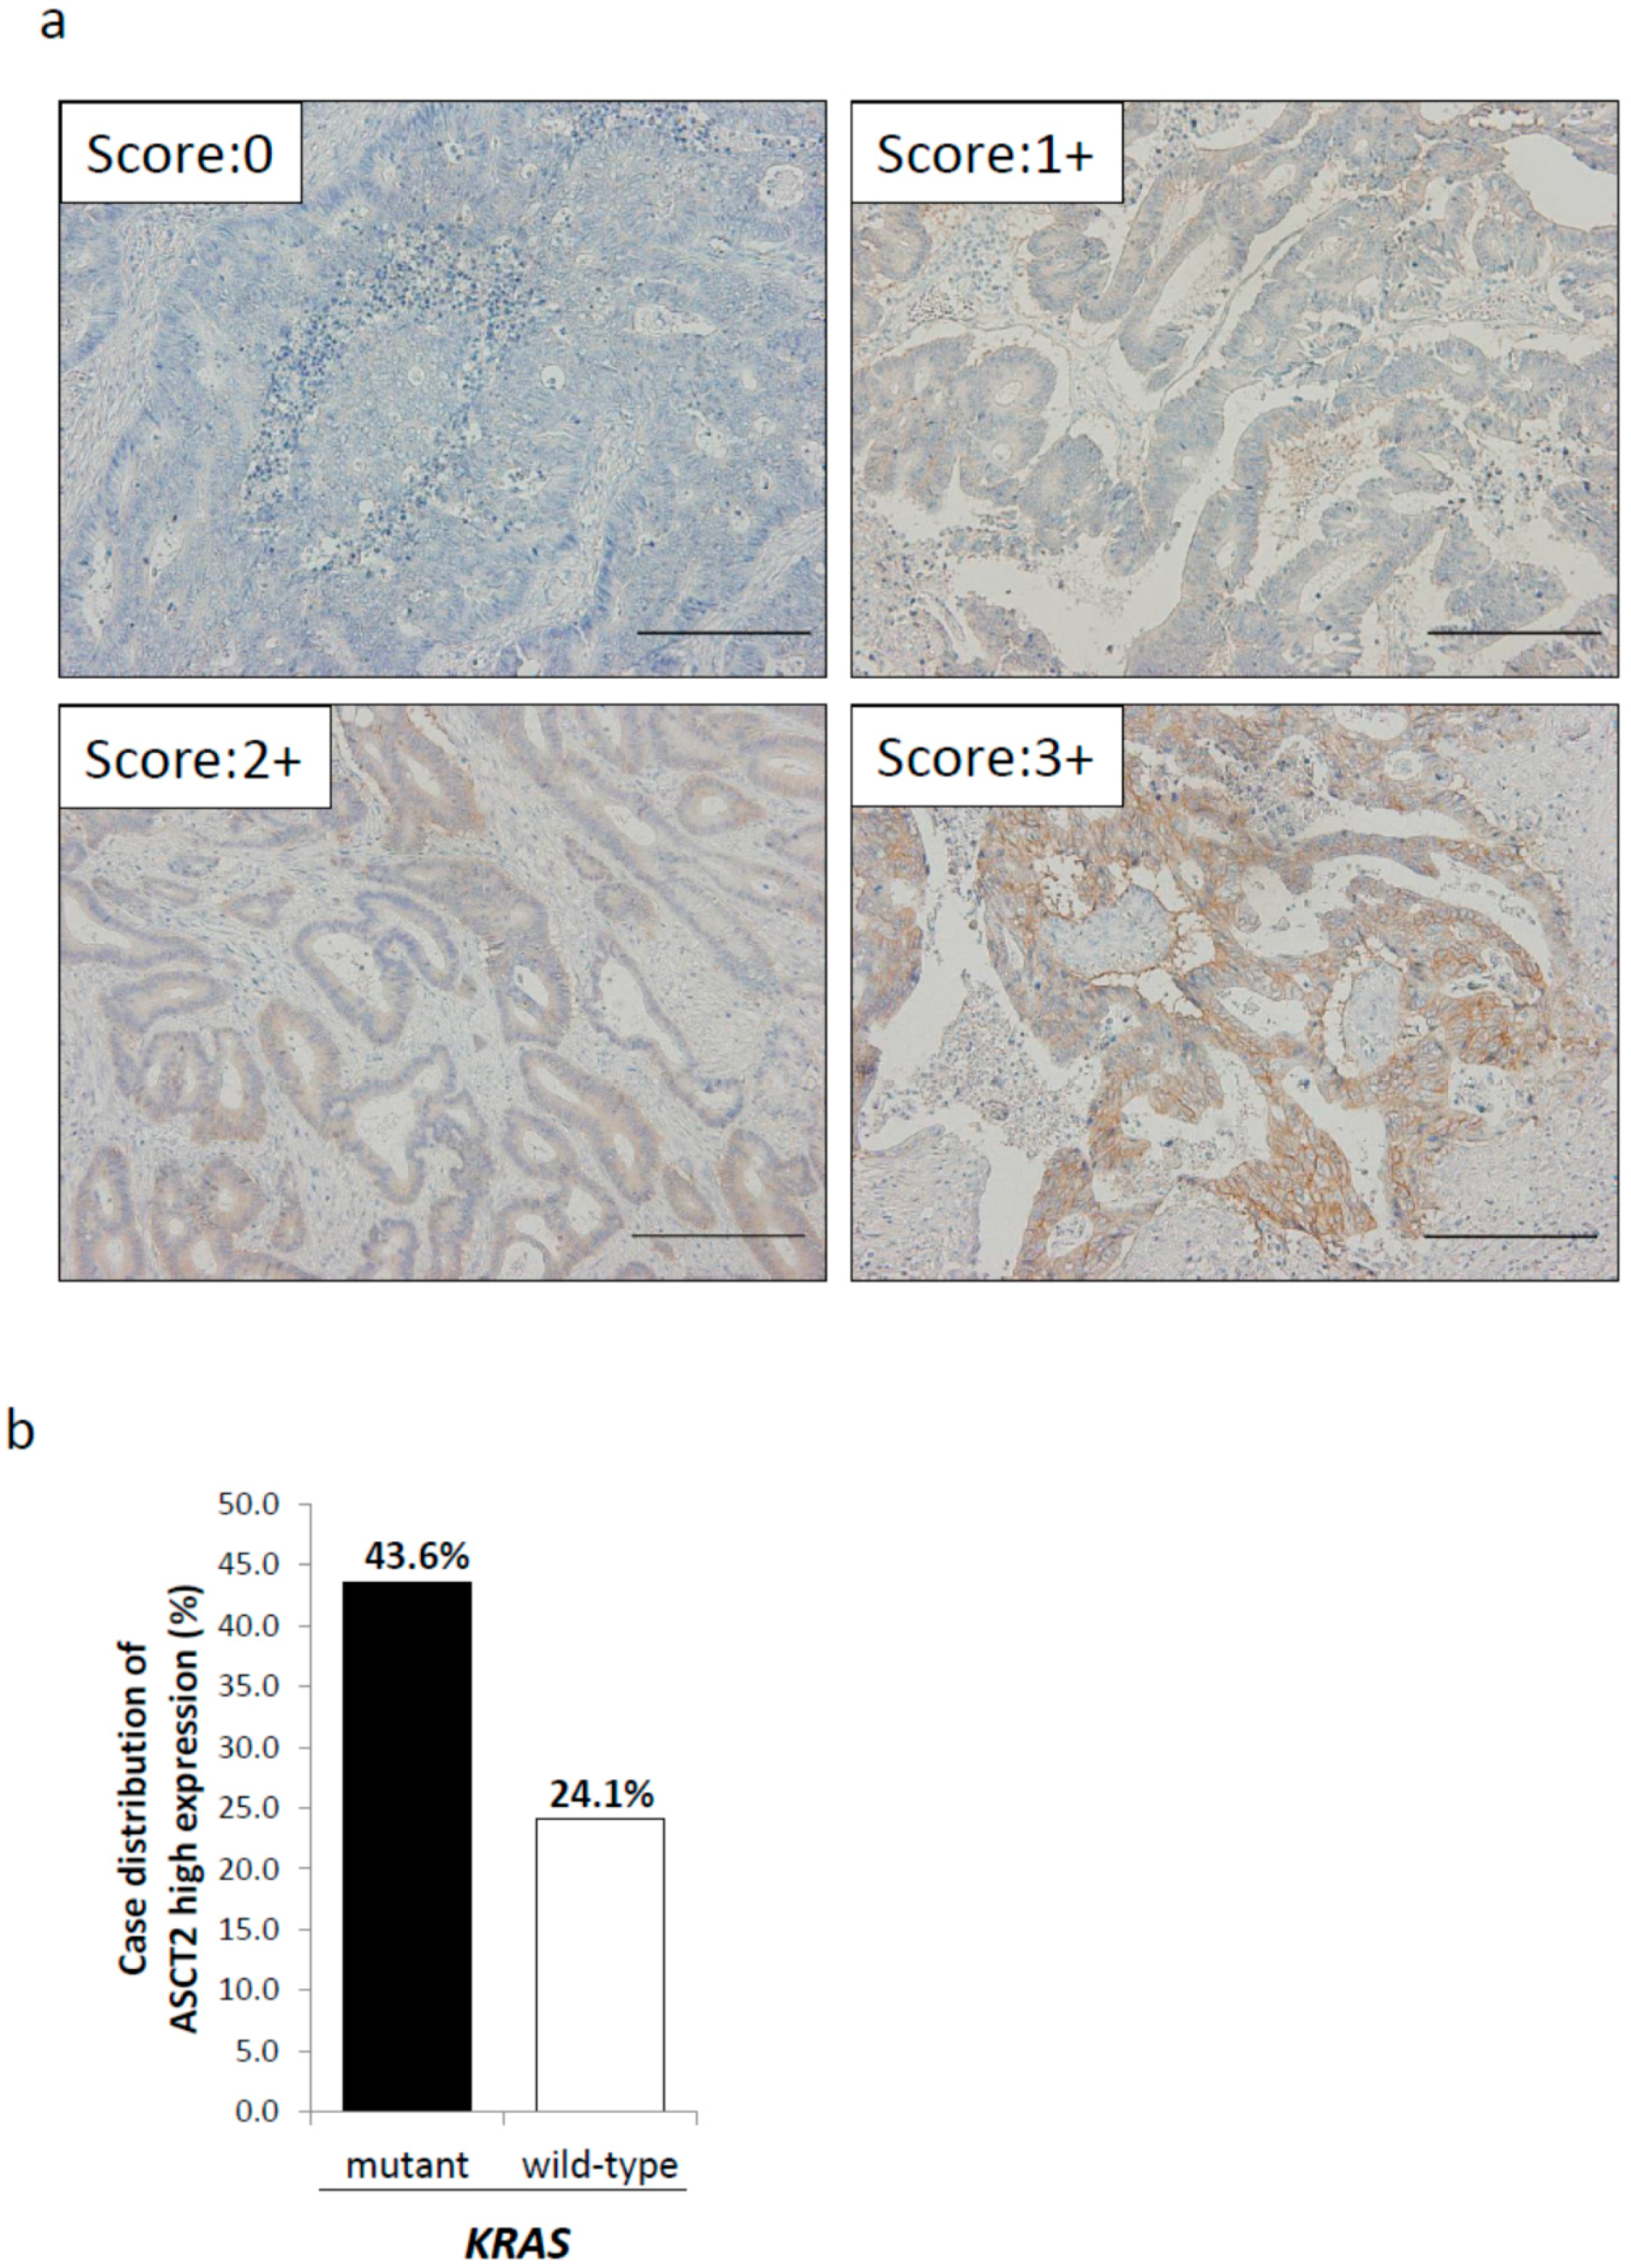
2.2. Relationship between ASCT2 Expression and KRAS Mutational Status in CRC Clinical Samples

We next performed immunohistochemistry (IHC) to evaluate the relationship between ASCT2 expression and KRAS mutational status in clinical specimens of human primary CRC. Regarding the expression levels of ASCT2, we classified the clinical specimens into four groups; score 0 (0–10%), score 1+ (10–40%), score 2+ (40–70%), and score 3+ (≥70%). Score 0 was found in 12 patients (12.9%), score 1+ in 22 patients (23.6%), score 2+ in 29 patients (31.2%), and score 3+ in 30 patients (32.3%) (Figure 2a). We defined score 3+ as the high expression group, while score 0, 1+, and 2+ were categorized as the low expression group. Regarding KRAS mutational status, mutated KRAS and wild-type KRAS were found in 39 and 54 patients, respectively. ASCT2 expression was high in 43.6% (17 of 39) of CRC patients with mutated KRAS, whereas in 24.1% (13 of 54) of CRC patients with wild-type KRAS, which indicated that there was a significant correlation between high ASCT2 expression and KRAS mutation (risk ratio: 1.62, 95%; confidence interval (CI): 1.02–2.57, p = 0.047, Figure 2b).

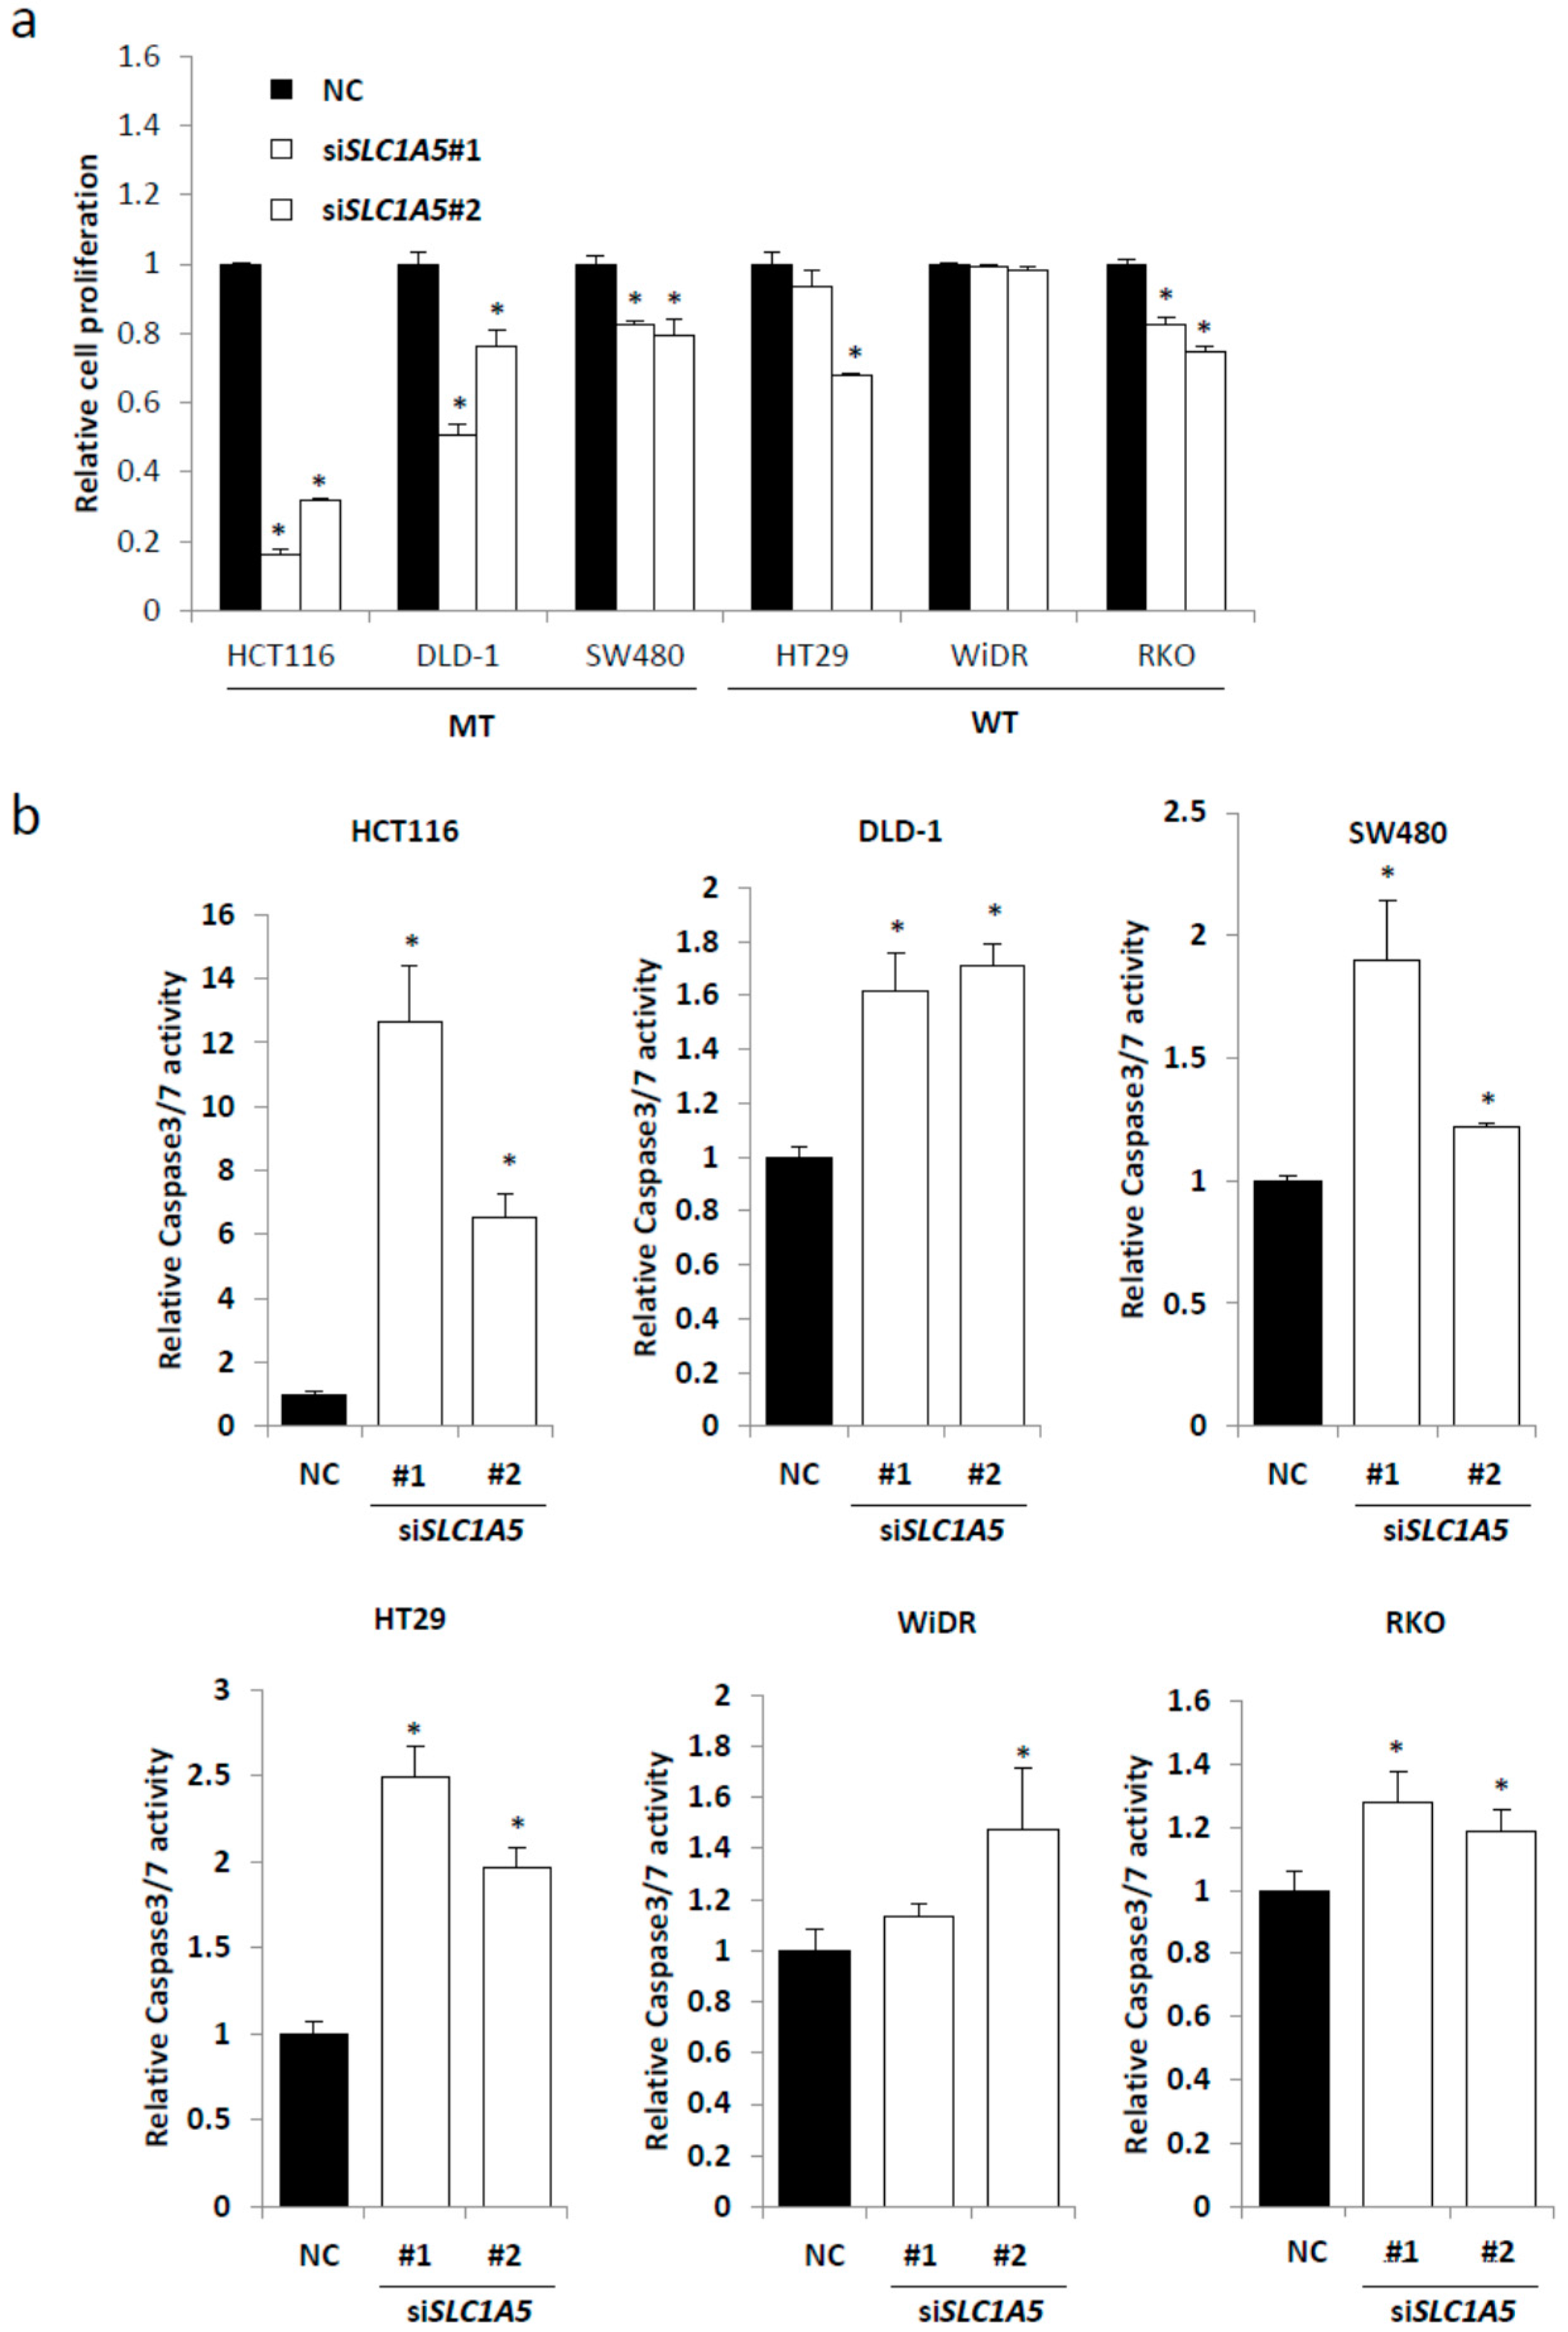
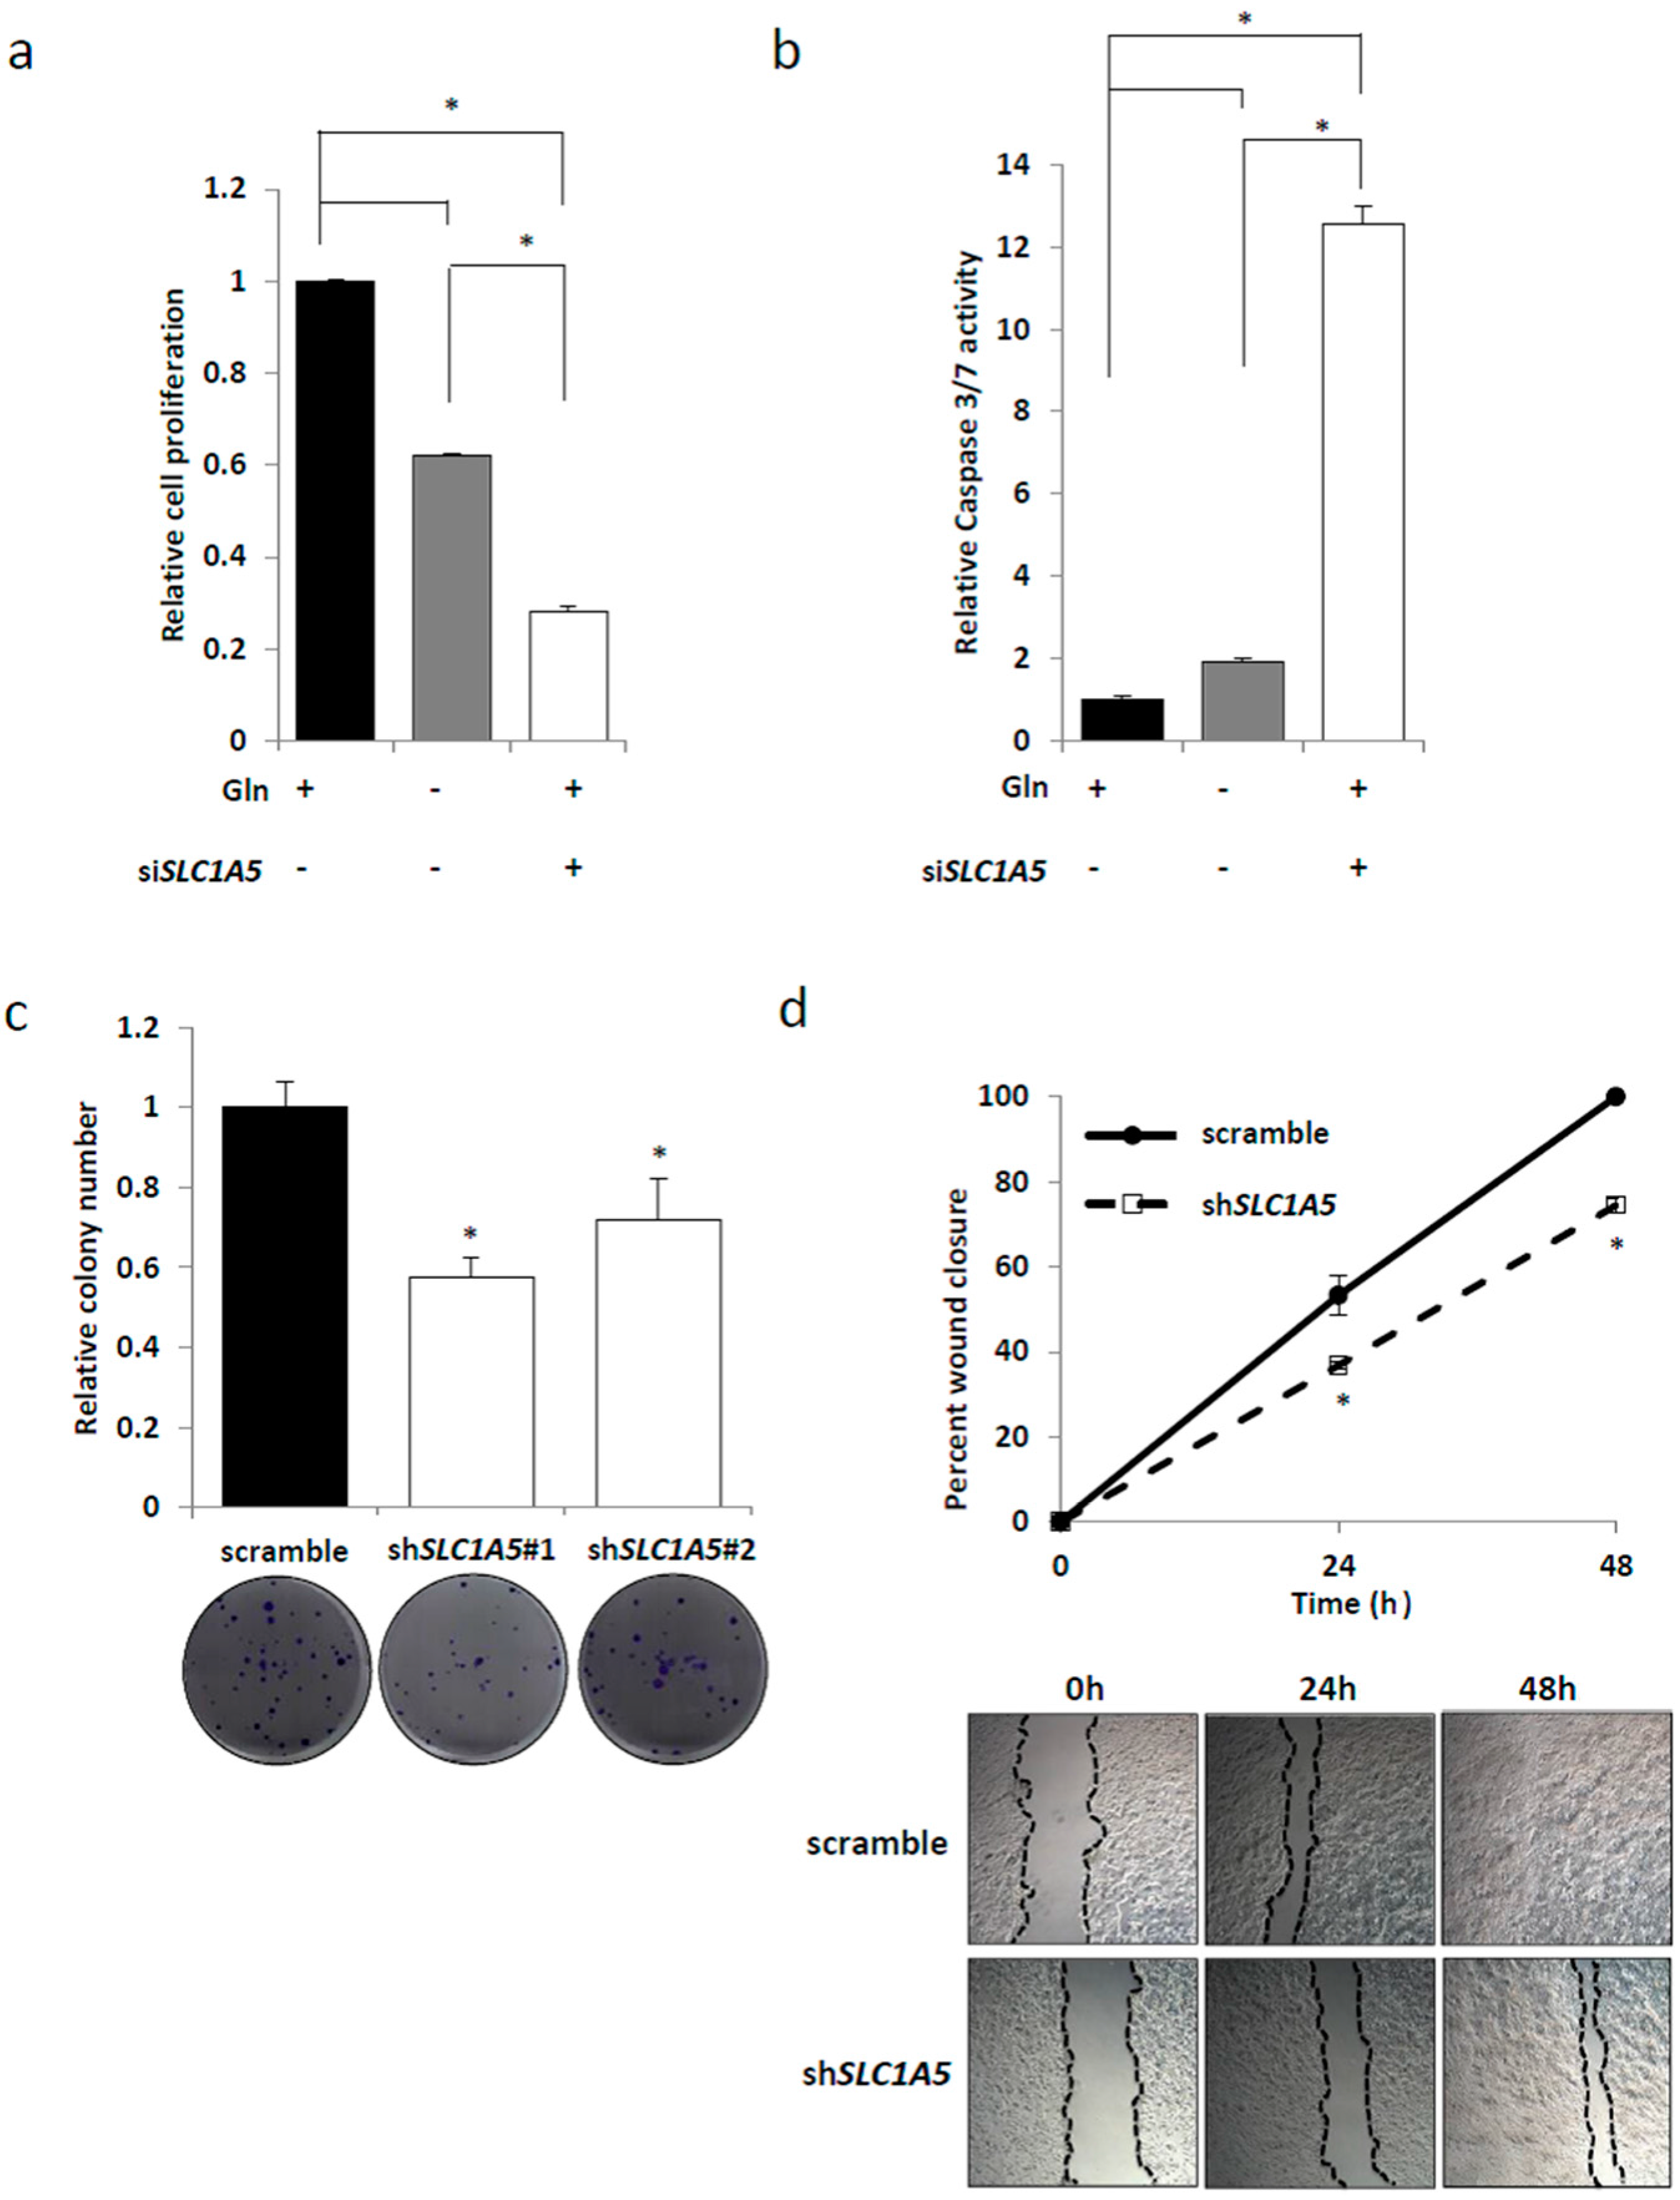
2.3. Knockdown of SLC1A5 (ASCT2) Results in Suppression of Cell Growth

To investigate the role of SLC1A5 (ASCT2) in CRC cell lines with mutated KRAS, we introduced non-silencing siRNA and two different siRNAs targeting SLC1A5 (referred as siSLC1A5#1 and siSLC1A5#2) into CRC cell lines (Figure S2). Knockdown of SLC1A5 (ASCT2) significantly suppressed the cell growth in all the 3 cell lines with mutated KRAS (HCT116, DLD-1, and SW480), whereas in 1 out of 3 cell lines with wild-type KRAS (RKO) (Figure 3a). Furthermore, we investigated the knockdown effect of SLC1A5 on cell apoptosis. Knockdown of SLC1A5 induced a significant increase in caspase 3/7 activities in all the 3 cell lines with mutated KRAS (HCT116, DLD-1, and SW480), whereas in 2 out of 3 cell lines with wild-type KRAS (HT29 and RKO) (Figure 3b). Oncogenic PIK3CA mutations were reported to reprogram glutamine metabolism in CRC [35]. PIK3CA mutations are observed in HCT116 (a H1047R mutation), DLD-1 (E545K; D549N mutations), HT29 (a P449T mutation), WiDR (a P449T mutation), and RKO (a H1047R mutation), whereas the PIK3CA status is wild-type in SW480. The PIK3CA status might be related to the differences in the knockdown effect of SLC1A5 between cell lines.

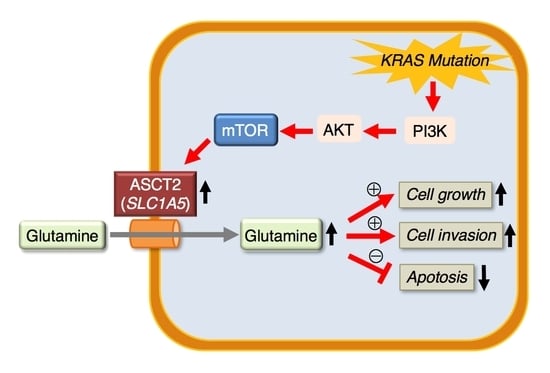
2.4. Role of SLC1A5 (ASCT2) in KRAS-Mutant CRC Cells

SLC1A5 (ASCT2) is generally regarded as a glutamine transporter. In a KRAS-mutant CRC cell line (HCT116), glutamine depletion resulted in decreased cell proliferation and enhanced caspase 3/7 activities. Importantly, even in the presence of glutamine, siSLC1A5 dramatically suppressed cell proliferation and up-regulated caspase 3/7 activities (Figure 4a,b), which indicated that the effect of SLC1A5-knockdown was more prominent on cell growth and apoptosis than glutamine depletion. To further investigate the functional role of SLC1A5, we established stable HCT116 transfectant cell lines in which SLC1A5 was knocked down by shRNA constructs targeting SLC1A5 (referred as shSLC1A5#1 and shSLC1A5#2) (Figure S3). In the clonogenic assay, SLC1A5-knockdown significantly suppressed colony number as compared to the control (Figure 4c). Moreover, in the wound healing assay, SLC1A5-knockdown significantly inhibited wound closure as compared to the control (Figure 4d). Taken together, these results indicate that the inhibition of SLC1A5 (ASCT2) could be a therapeutic target in KRAS-mutant CRC.

2.5. Tumor Characteristics and ASCT2 Expression in CRC Clinical Samples

Table 1 shows the relationship between ASCT2 expression and clinicopathologic variables. ASCT2 expression was significantly correlated with tumor location, but not with age, sex, tumor size, stage, T-/N-/M-category, lymphatic invasion, or vascular invasion. We further investigated the clinical significance of ASCT2, based on the KRAS mutational status. Interestingly, we found that high ASCT2 expression was significantly associated with tumor depth and vascular invasion in KRAS-mutant CRC, which was not observed in wild-type KRAS CRC.

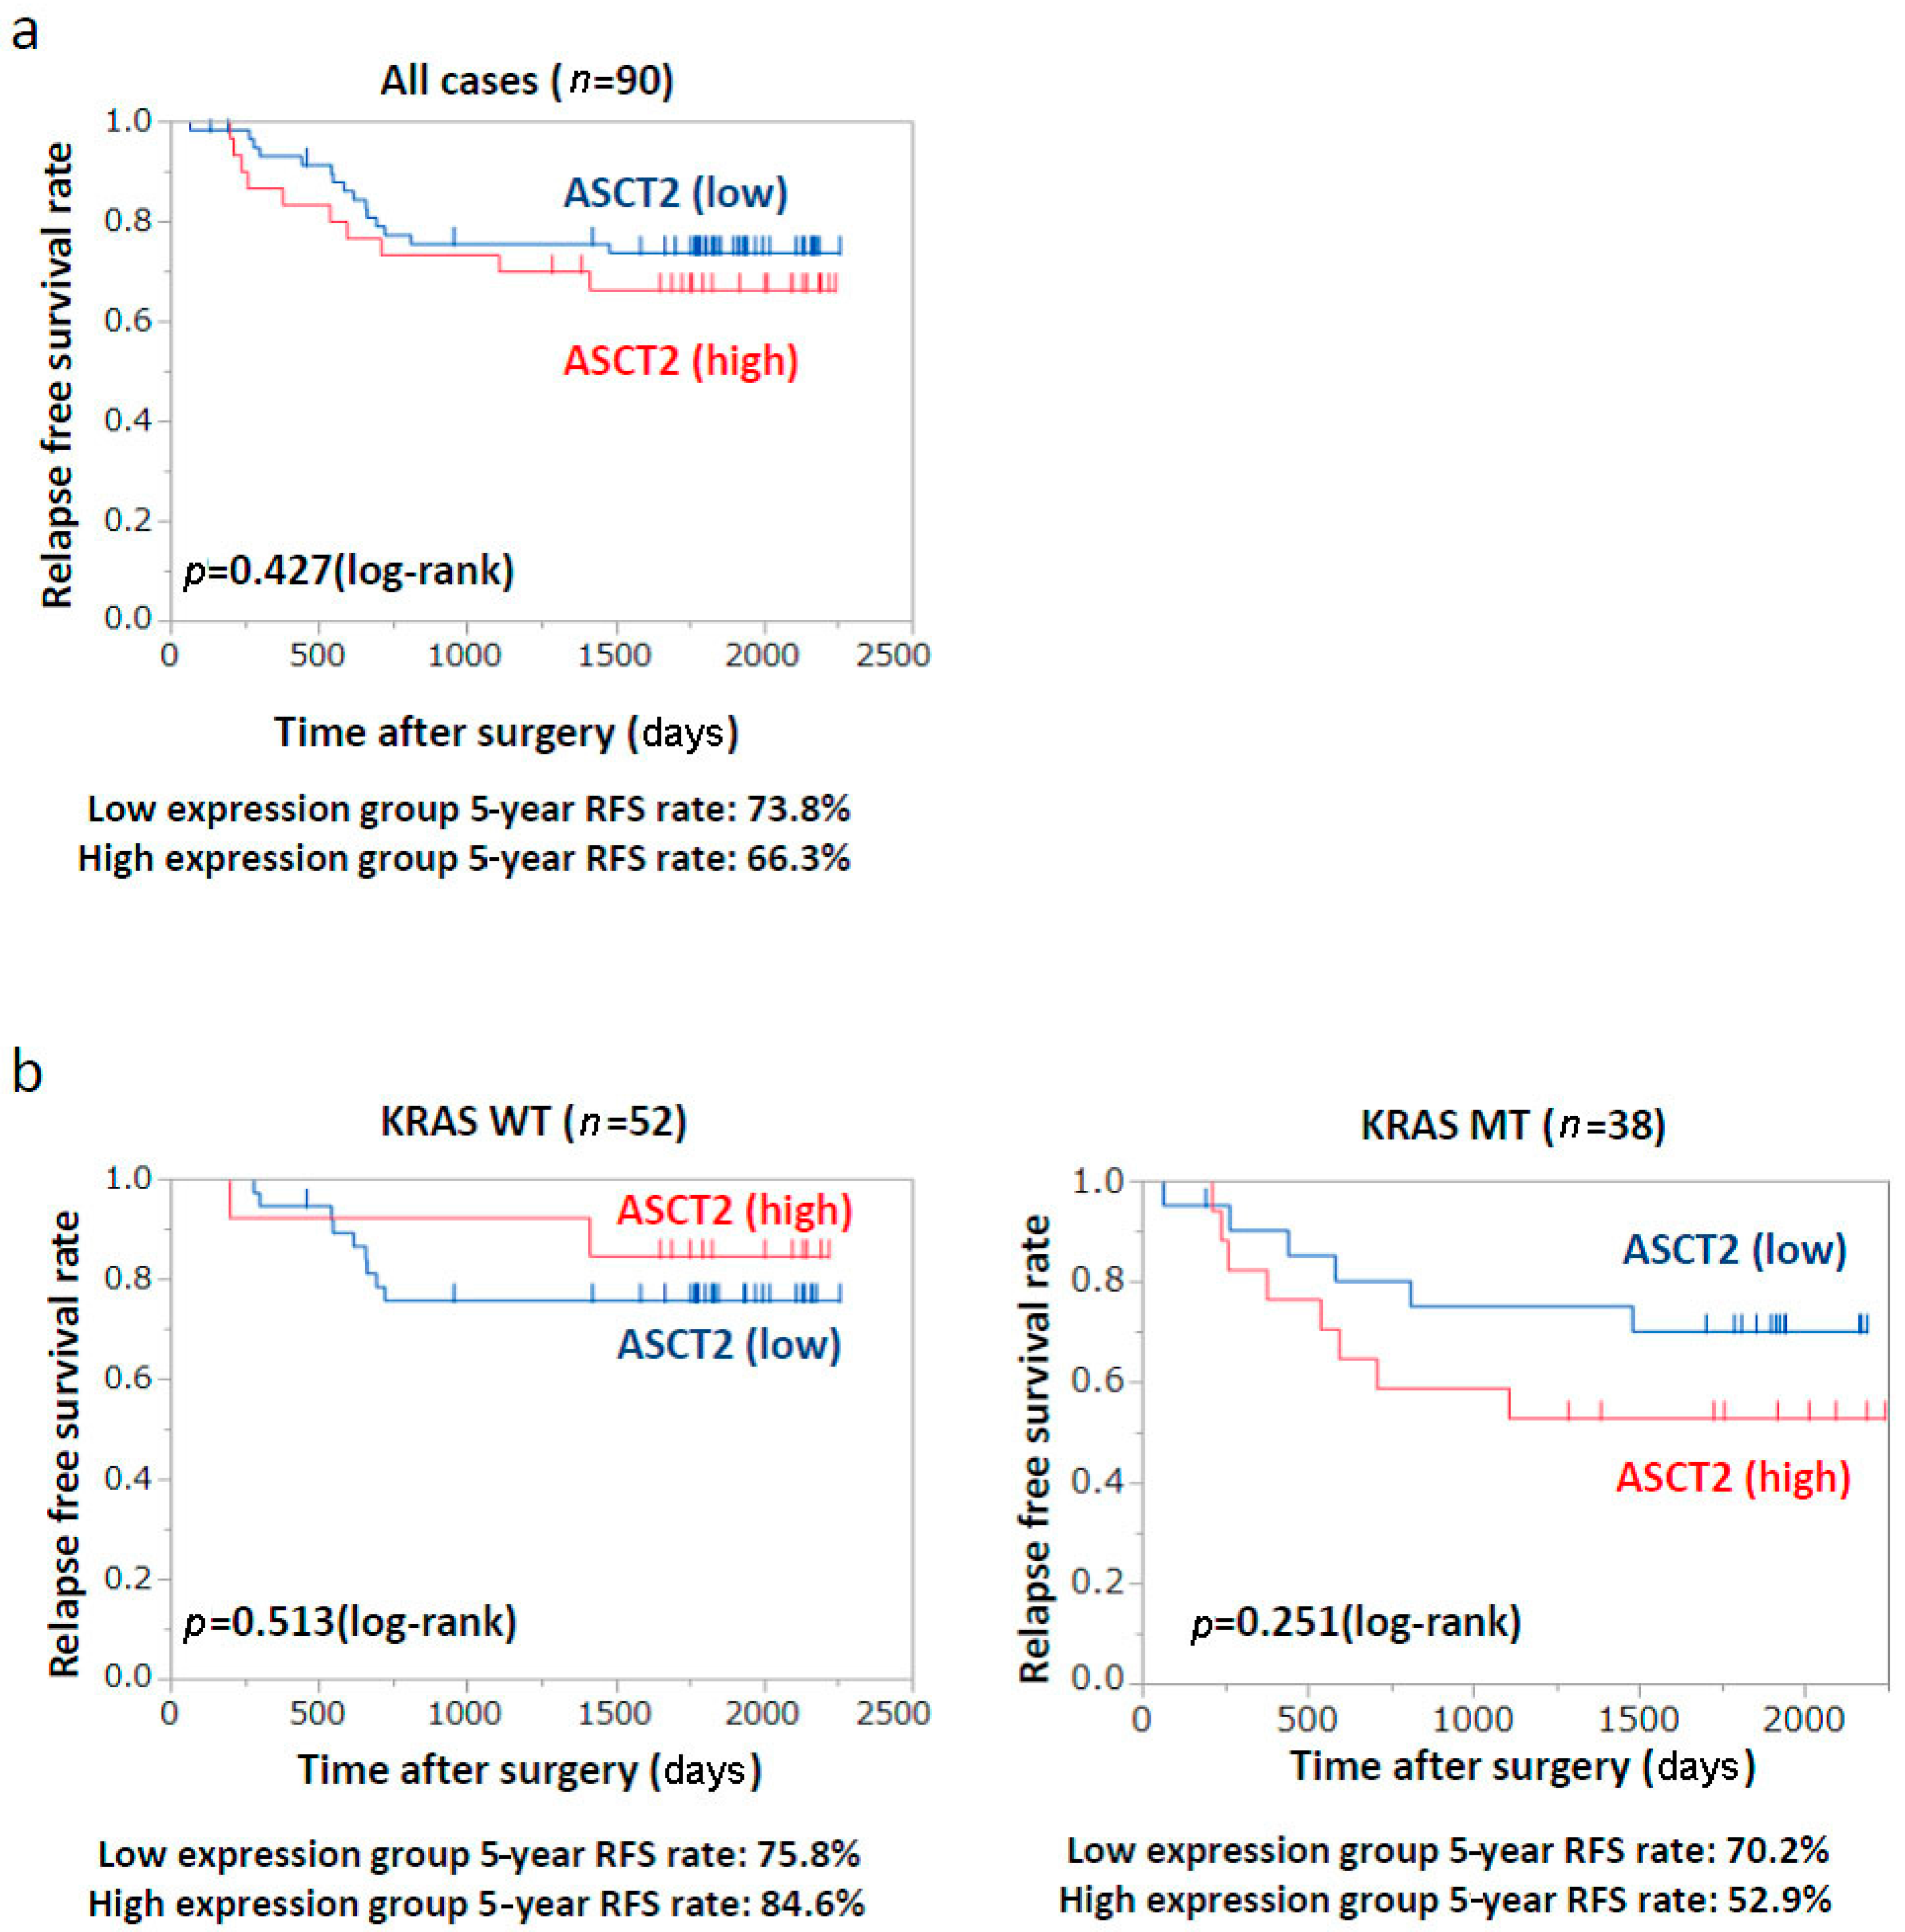
2.6. Patients’ Prognosis

To evaluate the relationship between ASCT2 expression and patients’ prognosis, we performed the log-rank test analysis with CRC patients who underwent curative resection of primary CRC (n = 90). Kaplan–Meier survival curves indicated that ASCT2 expression was not significantly correlated with recurrence-free survival (RFS) in all cases (Figure 5a). However, in KRAS-mutant CRC cases (n = 38), the estimated RFS rate at 5-year tended to be lower in the high ASCT2 group than in the low ASCT2 group (52.9% vs. 70.2%; p = 0.251) (Figure 5b, right). On the other hand, in wild-type KRAS CRC cases (n = 52), the estimated RFS rate at 5-year was almost similar between the high and low ASCT2 groups (84.6% vs. 75.8%; p = 0.513) (Figure 5b, left). Taken together, high ASCT2 expression can be one of the crucial prognostic factors in KRAS-mutant CRC.

3. Discussion

KRAS mutations are found in a variety of human cancers, including pancreatic cancer, non-small cell lung cancer, and CRC. Recent studies have shown that mutated KRAS promotes metabolic reprogramming through nutrients uptake, glycolysis, glutaminolysis, and synthesis of nucleotides and fatty acids. The mechanism by which mutated KRAS coordinates the metabolic reprogramming to promote tumor growth remains to be investigated. The International CRC Subtyping Consortium has suggested that CRC can be divided into four subtypes with distinguished features: CMS1, CMS2, CMS3, and CMS4 [15]. Notably, CMS3 is characterized by metabolic dysregulation and is strongly associated with KRAS mutations. Using a comprehensive metabolomics analysis with isogenic CRC cell lines harboring mutated or wild-type KRAS, we have recently reported that mutated KRAS induces some metabolic alterations in glycolysis, the pentose phosphate pathway (PPP), the tricarboxylic acid (TCA) cycle, and most significantly in the amino acid pathway [12]. We identified that mutated KRAS regulated asparagine synthetase (ASNS), an enzyme that is involved in de novo synthesis of asparagine from aspartate, and that KRAS-mutant CRC cells could become adaptive to glutamine depletion through ASNS-dependent asparagine biosynthesis. There is also some evidence from other groups that KRAS mutations in CRC are associated with glutamine metabolism. Wong et al. reported that SLC25A22 (a mitochondrial glutamine transporter) was a synthetic lethal metabolic gene in KRAS-mutant CRC cells and that expression of SLC25A22 was correlated with poor prognosis in patients harboring KRAS mutations [11]. Miyo et al. reported that glutamine dehydrogenase 1 (GLUD1) and SLC25A13 (a mitochondrial aspartate-glutamate carrier) played an essential role in cell survival of CRC cells under glucose-deprived conditions, and that combined expression of GLUD1 and SLC25A13 was significantly associated with tumor aggressiveness and poorer prognosis in CRC patients [13]. These results indicate that the amino acid metabolism including glutaminolysis is more essential for cell survival in KRAS-mutant CRC than in wild-type KRAS CRC.
In this study, we focused on the amino acid transporter which was exclusively regulated by mutated KRAS, although several amino acid transporters have been reported to be up-regulated in cancer [32]. Herein, we identified SLC1A5 as a novel target gene regulated by mutated KRAS in CRC. Expressions of SLC25A22 and SLC25A13 were not affected by KRAS-knockdown in our experiments (Figure S1b). Up-regulation of SLC1A5 (ASCT2) and its clinical significance has been reported in a variety of human cancers [19,20,21,22,23,24,25,26,27,28,29,30,31]. In the present study, we demonstrated that SLC1A5 (ASCT2) expression was regulated through KRAS signaling, and that SLC1A5-knockdown resulted in reduced cell growth and increased cell apoptosis in KRAS-mutant CRC cells (Figure 1 and Figure 3). Importantly, the effect of SLC1A5-knockdown was more prominent on cell growth and apoptosis than that of glutamine depletion (Figure 4a,b), which indicates that SLC1A5 (ASCT2) plays a critical role in the malignant progression of KRAS-mutant CRC. Furthermore, SLC1A5-knockdown resulted in the suppression of cell migration (Figure 4d). In primary CRC clinical specimens, we found that ASCT2 expression was significantly associated with tumor depth and vascular invasion in KRAS-mutant CRC, but not in wild-type KRAS CRC (Table 1). In conclusion, our data indicates that SLC1A5 (ASCT2) could be a novel biomarker as well as a potential therapeutic target in KRAS-mutant CRC.

4. Materials and Methods

4.1. Cell Lines and Reagents

HCT116, DLD-1, SW480, SW620, HT29, RKO, and WiDR cells were obtained from American Type Culture Collection. All cell lines were cultured in Dulbecco’s Modified Eagle Medium (DMEM) (glucose 25 mM, glutamine 4 mM) (043-30085, Wako, Tokyo, Japan) supplemented with 10% FBS and penicillin–streptomycin. Media without glutamine were prepared by using glutamine-free DMEM (glucose 25 mM, glutamine 0 mM) (045-32245, Wako) supplemented with 10% FBS. The identity of each cell line was confirmed by STR analysis (Takara Bio, Shiga, Japan). U0126 was purchased from Calbiochem, LY294002 and rapamycin were from Wako.

4.2. Quantitative Reverse Transcription Polymerase Chain Reaction (RT-PCR) Analysis

Total RNAs were extracted from cells with High Pure RNA Isolation Kit (Roche, Mannheim, Germany) according to the manufacturer’s instructions. RNA was reverse transcribed to cDNA with Transcriptor First Strand cDNA Synthesis Kit (Roche) according to the manufacturer’s instructions. The relative levels of respective genes were quantified using StepOnePlusTM Real-Time PCR System (Applied Biosystems, Foster City, CA, USA). The respective mRNA levels were normalized to that for ACTB. Primer sequences were found in Table S1.

4.3. Western Blot Analysis

Cells were washed with ice-cold phosphate-buffered saline and lysed in sodium dodecyl sulfate lysis buffer supplemented with inhibitor cocktails of protease and phosphatase. Primary antibodies can be found in Table S2.

4.4. Small Interfering RNA and Short Hairpin RNA

FlexiTube GeneSolutions for siSLC1A5 (#1: SI05141017, #2: SI00079730) and non-silencing control siRNA (AllStars negative control siRNA, SI03650318) were purchased from Qiagen (Hilden, Germany). The siRNA (10 nM) was transfected with Lipofectamine RNAiMAX (Invitrogen, Carlsbad, CA, USA) according to the manufacturer’s reverse-transfection protocol. SLC1A5 shRNA vectors were made from the same sequence of siSLC1A5 (#1, #2), and cloned into pLKO.1 vectors. pLKO.1-scramble vector (Addgene) was used as control.

4.5. Cell Proliferation Assay

A cell proliferation assay was measured by Cell Counting Kit-8 (Dojindo, Kumamoto, Japan) according to the manufacturer’s instruction. Cells transfected with siRNA were cultured in 96-well plates at a density of 5000 cells/well for 72 h.

4.6. Clonogenic Assay

Cells were seeded in 6-well plates at a density of 100 cells per well in complete media. At the end point, colonies were fixed in 1% glutaraldehyde and stained with 0.2% crystal violet for 30 min, and number of colonies was counted. A colony was defined as a cluster of at least 50 cells.

4.7. Apoptosis Assay

The activity of Caspase-3 and -7 was measured by using Caspase-Glo 3/7 assay (Promega, Madison, WI, USA) according to the manufacturer’s protocol. Caspase activity was normalized to the cell number counted by CCK-8 cell proliferation assay under the same density and conditions.

4.8. Wound Healing Assay

Cell lines were seeded into 12-well plates and grew until 80–90% confluence. Confluent cultures were scratched with sterile tips, washed with PBS, and cultured in DMEM containing 5% FBS. Cells were photographed by a 50× magnification at 0, 24, and 48 h. Wound closure (%) was evaluated using the ImageJ software.

4.9. Immunohistochemistry

Formalin-fixed, paraffin-embedded sections were stained with anti-rabbit ASCT2 (Sigma-Aldrich, St. Louis, MO, USA) antibody. Antigen retrieval was achieved with microwave in citrate buffer (pH: 6.0). For primary CRC tissue, ASCT2 immunoreactivity score was determined by the proportion, as previously described [30]. The proportion was scored based on the positively rate as “0” (0–10%), “1” (10–40%), “2” (40–70%), “3” (>70%). Scores of 0, 1, and 2 were defined as low expression, whereas 3 was high expression.
Two researchers (Kosuke Toda and Gen Nishikawa) independently evaluated all immunohistochemistry samples without prior knowledge of other data. The slides with different evaluations among them were reinterpreted at a conference to reach the consensus.

4.10. Patients, Clinicopathological Data

93 patients were collected from patients who underwent primary colorectal cancer resection at Kyoto University Hospital between April 2009 and September 2013.
No patients received chemotherapy and/or radiation therapy. KRAS mutational status in all patients was analyzed by using an ABI 3130 Genetic Analyzer (Applied Biosystems, foster City, CA, USA), as described previously. Pathologic staging was categorized in accordance with the 7th edition of Union for International Cancer Control (UICC) classification of malignant tumors.

4.11. Statistical Analysis

All values were expressed as mean ± standard deviation (SD). Statistical analyses were conducted with the JMP Pro 12 (SAS Institute, Inc., Cary, NC, USA). Student’s t-test was used for comparing means between two groups. In clinical data, the statistical significance of differences between variables of two groups was determined by student’s t-test, chi-squared test, or Fisher’s exact test. Relapse-free survival (RFS) rates were evaluated by the Kaplan–Meier survival curve and log-rank test. All analyses were two-sided, and differences with a p value of less than 0.05 were considered statistically significant in all analyses.

Supplementary Materials

Supplementary materials can be found at www.mdpi.com/1422-0067/18/8/1632/s1.

Acknowledgments

This work was supported by grants from the Ministry of Education, Culture, Sports, Science and Technology of Japan, and from KOTOSUGI CO. Ltd.

Author Contributions

Kenji Kawada and Kosuke Toda contributed to the planning of study design and interpretation of the data; Kosuke Toda and Gen Nishikawa performed the experiments; Kenji Kawada, Kosuke Toda and Gen Nishikawa performed the data analysis; Kenji Kawada, Kosuke Toda, and Gen Nishikawa wrote the manuscript; Masayoshi Iwamoto, Yoshiro Itatani, Ryo Takahashi and Yoshiharu Sakai reviewed the manuscript for important intellectual content.

Conflicts of Interest

The authors declare no conflict of interest.

Abbreviations

ASCT2Alanine-serine-cysteine amino acid transporter
ASNSAsparagine synthetase
CRCColorectal cancer
EGFREpidermal growth factor receptor
GLUD1Glutamine dehydrogenase 1
GLUT1Glucose transporter 1
PPPPentose phosphate pathway
RFSRecurrence-free survival (RFS)
RT-PCRReverse-transcription polymerase chain reaction
siRNASmall interfering RNA
TCA cycleTricarboxylic acid cycle

References

  1. Siegel, R.L.; Miller, K.D.; Jemal, A. Cancer statistics, 2017. CA Cancer J. Clin. 2017, 67, 7–30. [Google Scholar] [CrossRef] [PubMed]
  2. Misale, S.; Yaeger, R.; Hobor, S.; Scala, E.; Janakiraman, M.; Liska, D.; Valtorta, E.; Schiavo, R.; Buscarino, M.; Siravegna, G.; et al. Emergence of KRAS mutations and acquired resistance to anti-EGFR therapy in colorectal cancer. Nature 2012, 486, 532–536. [Google Scholar] [CrossRef] [PubMed]
  3. Bokemeyer, C.; Bondarenko, I.; Makhson, A.; Hartmann, J.T.; Aparicio, J.; de Braud, F.; Donea, S.; Ludwig, H.; Schuch, G.; Stroh, C.; et al. Fluorouracil, leucovorin, and oxaliplatin with and without cetuximab in the first-line treatment of metastatic colorectal cancer. J. Clin. Oncol. 2009, 27, 663–671. [Google Scholar] [CrossRef] [PubMed]
  4. Karapetis, C.S.; Khambata-Ford, S.; Jonker, D.J.; O’Callaghan, C.J.; Tu, D.; Tebbutt, N.C.; Simes, R.J.; Chalchal, H.; Shapiro, J.D.; Robitaille, S.; et al. K-Ras mutations and benefit from cetuximab in advanced colorectal cancer. N. Engl. J. Med. 2008, 359, 1757–1765. [Google Scholar] [CrossRef] [PubMed]
  5. Bryant, K.L.; Mancias, J.D.; Kimmelman, A.C.; Der, C.J. KRAS: Feeding pancreatic cancer proliferation. Trends Biochem. Sci. 2014, 39, 91–100. [Google Scholar] [CrossRef] [PubMed]
  6. Son, J.; Lyssiotis, C.A.; Ying, H.; Wang, X.; Hua, S.; Ligorio, M.; Perera, R.M.; Ferrone, C.R.; Mullarky, E.; Shyh-Chang, N.; et al. Glutamine supports pancreatic cancer growth through a KRAS-regulated metabolic pathway. Nature 2013, 496, 101–105. [Google Scholar] [CrossRef] [PubMed] [Green Version]
  7. Ying, H.; Kimmelman, A.C.; Lyssiotis, C.A.; Hua, S.; Chu, G.C.; Fletcher-Sananikone, E.; Locasale, J.W.; Son, J.; Zhang, H.; Coloff, J.L.; et al. Oncogenic Kras maintains pancreatic tumors through regulation of anabolic glucose metabolism. Cell 2012, 149, 656–670. [Google Scholar] [CrossRef] [PubMed]
  8. Davidson, S.M.; Papagiannakopoulos, T.; Olenchock, B.A.; Heyman, J.E.; Keibler, M.A.; Luengo, A.; Bauer, M.R.; Jha, A.K.; O’Brien, J.P.; Pierce, K.A.; et al. Environment impacts the metabolic dependencies of Ras-driven non-small cell lung cancer. Cell Metab. 2016, 23, 517–528. [Google Scholar] [CrossRef] [PubMed]
  9. Kimmelman, A.C. Metabolic dependencies in RAS-driven cancers. Clin. Cancer Res. 2015, 21, 1828–1834. [Google Scholar] [CrossRef] [PubMed]
  10. Yun, J.; Rago, C.; Cheong, I.; Pagliarini, R.; Angenendt, P.; Rajagopalan, H.; Schmidt, K.; Willson, J.K.; Markowitz, S.; Zhou, S.; et al. Glucose deprivation contributes to the development of KRAS pathway mutations in tumor cells. Science 2009, 325, 1555–1559. [Google Scholar] [CrossRef] [PubMed]
  11. Wong, C.C.; Qian, Y.; Li, X.; Xu, J.; Kang, W.; Tong, J.H.; To, K.F.; Jin, Y.; Li, W.; Chen, H.; et al. SLC25A22 Promotes proliferation and survival of colorectal cancer cells with KRAS mutations and xenograft tumor progression in mice via intracellular synthesis of aspartate. Gastroenterology 2016, 151, 945–960. [Google Scholar] [CrossRef] [PubMed]
  12. Toda, K.; Kawada, K.; Iwamoto, M.; Inamoto, S.; Sasazuki, T.; Shirasawa, S.; Hasegawa, S.; Sakai, Y. Metabolic alterations caused by KRAS mutations in colorectal cancer contribute to cell adaptation to glutamine depletion by upregulation of asparagine synthetase. Neoplasia 2016, 18, 654–665. [Google Scholar] [CrossRef] [PubMed]
  13. Miyo, M.; Konno, M.; Nishida, N.; Sueda, T.; Noguchi, K.; Matsui, H.; Colvin, H.; Kawamoto, K.; Koseki, J.; Haraguchi, N.; et al. Metabolic adaptation to nutritional stress in human colorectal cancer. Sci. Rep. 2016, 6, 38415. [Google Scholar] [CrossRef] [PubMed]
  14. Yun, J.; Mullarky, E.; Lu, C.; Bosch, K.N.; Kavalier, A.; Rivera, K.; Roper, J.; Chio, I.I.; Giannopoulou, E.G.; Rago, C.; et al. Vitamin C selectively kills KRAS and BRAF mutant colorectal cancer cells by targeting GAPDH. Science 2015, 350, 1391–1396. [Google Scholar] [CrossRef] [PubMed]
  15. Guinney, J.; Dienstmann, R.; Wang, X.; de Reynies, A.; Schlicker, A.; Soneson, C.; Marisa, L.; Roepman, P.; Nyamundanda, G.; Angelino, P.; et al. The consensus molecular subtypes of colorectal cancer. Nat. Med. 2015, 21, 1350–1356. [Google Scholar] [CrossRef] [PubMed]
  16. Kawada, K.; Toda, K.; Nakamoto, Y.; Iwamoto, M.; Hatano, E.; Chen, F.; Hasegawa, S.; Togashi, K.; Date, H.; Uemoto, S.; et al. Relationship between 18F-FDG PET/CT scans and KRAS mutations in metastatic colorectal cancer. J. Nucl. Med. 2015, 56, 1322–1327. [Google Scholar] [CrossRef] [PubMed]
  17. Iwamoto, M.; Kawada, K.; Nakamoto, Y.; Itatani, Y.; Inamoto, S.; Toda, K.; Kimura, H.; Sasazuki, T.; Shirasawa, S.; Okuyama, H.; et al. Regulation of 18F-FDG accumulation in colorectal cancer cells with mutated KRAS. J. Nucl. Med. 2014, 55, 2038–2044. [Google Scholar] [CrossRef] [PubMed]
  18. Kawada, K.; Nakamoto, Y.; Kawada, M.; Hida, K.; Matsumoto, T.; Murakami, T.; Hasegawa, S.; Togashi, K.; Sakai, Y. Relationship between 18F-fluorodeoxyglucose accumulation and KRAS/BRAF mutations in colorectal cancer. Clin. Cancer Res. 2012, 18, 1696–1703. [Google Scholar] [CrossRef] [PubMed]
  19. Van Geldermalsen, M.; Wang, Q.; Nagarajah, R.; Marshall, A.D.; Thoeng, A.; Gao, D.; Ritchie, W.; Feng, Y.; Bailey, C.G.; Deng, N.; et al. ASCT2/SLC1A5 controls glutamine uptake and tumour growth in triple-negative basal-like breast cancer. Oncogene 2016, 35, 3201–3208. [Google Scholar] [CrossRef] [PubMed]
  20. Sun, H.W.; Yu, X.J.; Wu, W.C.; Chen, J.; Shi, M.; Zheng, L.; Xu, J. GLUT1 and ASCT2 as predictors for prognosis of hepatocellular carcinoma. PLoS ONE 2016, 11, e0168907. [Google Scholar] [CrossRef] [PubMed]
  21. Honjo, H.; Kaira, K.; Miyazaki, T.; Yokobori, T.; Kanai, Y.; Nagamori, S.; Oyama, T.; Asao, T.; Kuwano, H. Clinicopathological significance of LAT1 and ASCT2 in patients with surgically resected esophageal squamous cell carcinoma. J. Surg. Oncol. 2016, 113, 381–389. [Google Scholar] [CrossRef] [PubMed]
  22. Yazawa, T.; Shimizu, K.; Kaira, K.; Nagashima, T.; Ohtaki, Y.; Atsumi, J.; Obayashi, K.; Nagamori, S.; Kanai, Y.; Oyama, T.; et al. Clinical significance of coexpression of l-type amino acid transporter 1 (LAT1) and ASC amino acid transporter 2 (ASCT2) in lung adenocarcinoma. Am. J. Transl. Res. 2015, 7, 1126–1139. [Google Scholar] [PubMed]
  23. Ren, P.; Yue, M.; Xiao, D.; Xiu, R.; Gan, L.; Liu, H.; Qing, G. ATF4 and N-Myc coordinate glutamine metabolism in MYCN-amplified neuroblastoma cells through ASCT2 activation. J. Pathol. 2015, 235, 90–100. [Google Scholar] [CrossRef] [PubMed]
  24. Nikkuni, O.; Kaira, K.; Toyoda, M.; Shino, M.; Sakakura, K.; Takahashi, K.; Tominaga, H.; Oriuchi, N.; Suzuki, M.; Iijima, M.; et al. Expression of amino acid transporters (LAT1 and ASCT2) in patients with stage III/IV laryngeal squamous cell carcinoma. Pathol. Oncol. Res. 2015, 21, 1175–1181. [Google Scholar] [CrossRef] [PubMed]
  25. Liu, Y.; Yang, L.; An, H.; Chang, Y.; Zhang, W.; Zhu, Y.; Xu, L.; Xu, J. High expression of solute carrier family 1, member 5 (SLC1A5) is associated with poor prognosis in clear-cell renal cell carcinoma. Sci. Rep. 2015, 5, 16954. [Google Scholar] [CrossRef] [PubMed]
  26. Hassanein, M.; Qian, J.; Hoeksema, M.D.; Wang, J.; Jacobovitz, M.; Ji, X.; Harris, F.T.; Harris, B.K.; Boyd, K.L.; Chen, H.; Clark, J.E.; et al. Targeting SLC1a5-mediated glutamine dependence in non-small cell lung cancer. Int. J. Cancer 2015, 137, 1587–1597. [Google Scholar] [CrossRef] [PubMed]
  27. Toyoda, M.; Kaira, K.; Ohshima, Y.; Ishioka, N.S.; Shino, M.; Sakakura, K.; Takayasu, Y.; Takahashi, K.; Tominaga, H.; Oriuchi, N.; et al. Prognostic significance of amino-acid transporter expression (LAT1, ASCT2, and xCT) in surgically resected tongue cancer. Br. J. Cancer 2014, 110, 2506–2513. [Google Scholar] [CrossRef] [PubMed]
  28. Shimizu, K.; Kaira, K.; Tomizawa, Y.; Sunaga, N.; Kawashima, O.; Oriuchi, N.; Tominaga, H.; Nagamori, S.; Kanai, Y.; Yamada, M.; et al. ASC amino-acid transporter 2 (ASCT2) as a novel prognostic marker in non-small cell lung cancer. Br. J. Cancer 2014, 110, 2030–2039. [Google Scholar] [CrossRef] [PubMed]
  29. Scalise, M.; Pochini, L.; Panni, S.; Pingitore, P.; Hedfalk, K.; Indiveri, C. Transport mechanism and regulatory properties of the human amino acid transporter ASCT2 (SLC1A5). Amino Acids 2014, 46, 2463–2475. [Google Scholar] [CrossRef] [PubMed]
  30. Huang, F.; Zhao, Y.; Zhao, J.; Wu, S.; Jiang, Y.; Ma, H.; Zhang, T. Upregulated SLC1A5 promotes cell growth and survival in colorectal cancer. Int. J. Clin. Exp. Pathol. 2014, 7, 6006–6014. [Google Scholar] [PubMed]
  31. Wang, Q.; Hardie, R.A.; Hoy, A.J.; van Geldermalsen, M.; Gao, D.; Fazli, L.; Sadowski, M.C.; Balaban, S.; Schreuder, M.; Nagarajah, R.; et al. Targeting ASCT2-mediated glutamine uptake blocks prostate cancer growth and tumour development. J. Pathol. 2015, 236, 278–289. [Google Scholar] [CrossRef] [PubMed] [Green Version]
  32. Bhutia, Y.D.; Babu, E.; Ramachandran, S.; Ganapathy, V. Amino acid transporters in cancer and their relevance to “glutamine addiction”: Novel targets for the design of a new class of anticancer drugs. Cancer Res. 2015, 75, 1782–1788. [Google Scholar] [CrossRef] [PubMed]
  33. Wise, D.R.; Thompson, C.B. Glutamine addiction: A new therapeutic target in cancer. Trends Biochem. Sci. 2010, 35, 427–433. [Google Scholar] [CrossRef] [PubMed]
  34. DeBerardinis, R.J.; Cheng, T. Q’s next: The diverse functions of glutamine in metabolism, cell biology and cancer. Oncogene 2010, 29, 313–324. [Google Scholar] [CrossRef] [PubMed]
  35. Hao, Y.; Samuels, Y.; Li, Q.; Krokowski, D.; Guan, B.J.; Wang, C.; Jin, Z.; Dong, B.; Cao, B.; Feng, X.; et al. Oncogenic PIK3CA mutations reprogram glutamine metabolism in colorectal cancer. Nat. Commun. 2016, 7, 11971. [Google Scholar] [CrossRef] [PubMed]
Figure 1. Identification of the amino acid transporter regulated by mutated KRAS. (a) Relative mRNA levels of amino acid transporters that are reported to be associated with cancer; (b) relative mRNA levels of amino acid transporters that are involved in glutamine transport. HCT116 cells (left) and DLD-1 cells (right) were treated separately with two independent siRNA constructs (#1 and #2) targeting KRAS and negative control (NC) siRNA. Mean; bars, ± SD, n = 3 (Student’s t-test; * p < 0.05); (c) Western blotting for KRAS, ASCT2, and β-actin (Actin). The relative ASCT2 expression levels for three independent experiments are shown by quantitative analysis normalized to β-actin (Actin); (d) CRC cells (HCT116 and DLD-1) were treated with 0.1% dimethyl sulfoxide (DMSO), 20 μM U0126 (MEK inhibitor), and 50 μM LY294002 (PI3K inhibitor) or 20 nM rapamycin (mTOR inhibitor) for 48 h. Protein levels of ASCT2 were normalized to β-actin (Actin). Densitometry values were expressed as fold change compared with DMSO-treated cells.
Ijms 18 01632 g001
Figure 2. Immunohistochemical staining for ASCT2 of primary colorectal cancer (CRC) specimens. (a) Representative picture. Scale bar, 200 μm (200× magnification); (b) Relationship between KRAS mutational status and ASCT2 expression.
Ijms 18 01632 g002
Figure 3. SLC1A5 knockdown inhibits cell proliferation and induces cell apoptosis of CRC cells. (a) Cell proliferation measured by CCK-8 assay. CRC cells were transfected with negative control (NC) or two independent siSLC1A5 and cultured for 72 h. Viability in each siSLC1A5 was normalized to that in NC. Student’s t-test; * p < 0.05; (b) caspase 3/7 activities measured by Caspase-Glo assay. CRC cells transfected with negative control (NC) or two independent siSLC1A5 were cultured for 72 h. Caspase 3/7 activity was normalized to the cell viability measured by CCK-8 assay under the same density and conditions. Mean; bars, ± SD, n = 3 (Student’s t-test; * p < 0.05).
Ijms 18 01632 g003
Figure 4. The role of SLC1A5 (ASCT2) in KRAS-mutant CRC cells. SLC1A5 knockdown exhibited more effective on suppressing cell growth (a) and inducing apoptosis (b) than under glutamine deprivation. Mean; bars, ± SD, n = 3 (Student’s t-test; * p < 0.05); (c) clonogenic assay with HCT116 transfected with control or two independent shSLC1A5 vectors. Cells were maintained under 4 mM glutamine condition containing 10% fetal bovine serum (FBS) for 10 days. Mean; bars, ± SD, n = 3 (Student’s t-test; * p < 0.05); (d) wound healing assay with HCT116 transfected with control or shSLC1A5 vector. Cells were photographed at 50× magnification at 0, 24, and 48 h. Wound closure (%) was evaluated. Mean; bars, ± SD, n = 3 (Student’s t-test; * p < 0.05).
Ijms 18 01632 g004
Figure 5. Kaplan–Meier analysis of relapse-free survival (RFS) according to ASCT2 expression and KRAS status. (a) RFS according to ASCT2 expression in total patients; (b) RFS according to ASCT2 expression in KRAS-mutant cases (right) and wild-type KRAS cases (left).
Ijms 18 01632 g005
Table 1. Correlation between ASCT2 expression and clinicopathological variables (* p < 0.05).
VariablesTotal KRAS Wild-Type KRAS Mutant
ASCT2 ASCT2 ASCT2
High (n = 30)Low (n = 63)p-valueHigh (n = 13)Low (n = 41)p-valueHigh (n = 17)Low (n = 22)p-value
Age, mean ± SD (y)71.2 ± 9.468.0 ± 10.70.1669.8 ± 10.567.2 ± 10.60.4272.2 ± 9.869.4 ± 11.10.41
Sex
Male16390.438280.658110.86
Female1424 513 911
Location
Left18500.049 *9330.459170.11
Right1213 48 85
Tumor size (mm)
≥5012250.985150.912250.98
<501838 826 1838
UICC-TMN stage
I/II14330.617230.897100.79
III/IV1630 618 1012
T-category
1/25250.164100.72190.024 *
3/42544 931 1613
M-category
Negative25530.9210350.6715180.75
Positive510 36 24
N-category
Negative16350.848230.738120.64
Positive1428 518 910
Lymphatic invasion
Negative18390.866250.3512140.65
Positive1224 716 58
Vascular invasion
Negative6190.33813110.049 *
Positive2444 1033 1411

