Article

Transcriptome Analysis Reveals Increases in Visceral Lipogenesis and Storage and Activation of the Antigen Processing and Presentation Pathway during the Mouth-Opening Stage in Zebrafish Larvae

1
College of Animal Science and Technology, Southwest University, Chongqing 400715, China
2
The Key Laboratory of Freshwater Fish Reproduction and Development (Ministry of Education), Southwest University, Chongqing 400715, China
3
Institute of Three Gorges Ecological Fisheries of Chongqing, Chongqing 400715, China
*
Author to whom correspondence should be addressed.
Int. J. Mol. Sci. 2017, 18(8), 1634; https://doi.org/10.3390/ijms18081634
Submission received: 4 July 2017 / Revised: 20 July 2017 / Accepted: 21 July 2017 / Published: 31 July 2017
(This article belongs to the Section Biochemistry)

Abstract

:
The larval phase of the fish life cycle has the highest mortality, particularly during the transition from endogenous to exogenous feeding. However, the transcriptional events underlying these processes have not been fully characterized. To understand the molecular mechanisms underlying mouth-opening acclimation, RNA-seq was used to investigate the transcriptional profiles of the endogenous feeding, mixed feeding and exogenous feeding stages of zebrafish larvae. Differential expression analysis showed 2172 up-regulated and 2313 down-regulated genes during this stage. Genes associated with the assimilation of exogenous nutrients such as the arachidonic acid metabolism, linoleic acid metabolism, fat digestion and absorption, and lipogenesis were activated significantly, whereas dissimilation including the cell cycle, homologous recombination, and fatty acid metabolism were inhibited, indicating a physiological switch for energy storage occurred during the mouth-opening stage. Moreover, the immune recognition involved in the antigen processing and presentation pathway was activated and nutritional supply seemed to be required in this event confirmed by qPCR. These results suggested the energy utilization during the mouth-opening stage is more tended to be reserved or used for some important demands, such as activity regulation, immune defense, and lipid deposition, instead of rapid growth. The findings of this study are important for understanding the physiological switches during the mouth-opening stage.

Graphical Abstract

1. Introduction

In oviparous fish, the mouth-opening stage is a crucial physiological switch period [1]. During this phase, fish larvae undergo a rapid ontogenetic switch in nutritional strategies from endogenous feeding (utilization of only the yolk-sac reserves) via mixed feeding (simultaneous utilization of yolk reserves and exogenous food) to exogenous feeding (exclusively relying on external feeds) [2]. The change in the nutritional source is accompanied by significant morphological changes, including changes to the eyes [3], gills [4], fin rays [5], muscle tissue [6], and adipose tissue [7]. These changes facilitate the development of physiological capacities that enable the fish to manage various environmental stresses at later stages, such as salinity, temperature, prey and predators [8]. Moreover, with the development of the digestive tract, rapid ontogenesis occurs, which promotes microflora colonization in the gut [9]. Studies have shown that host and microflora are interdependent. The majority of species cannot be survival when removed from their niches [10]. Conversely, the host takes advantage of the special functions of the microflora to complete certain essential physiological processes in the early mouth-opening stage, including angiogenesis [11], epithelial renewal [12], immune system development [13], and nutrient absorption [14]. Overall, oviparous fish have developed methods of supporting many physiological functions during the transition from the endogenous to the exogenous feeding phase. Nevertheless, compared with other developmental phases, fish larvae at the mouth-opening stage are more vulnerable, and associated with high mortality [1,15]. In aquaculture practice, hunger stress as one of the most common lethal factors during the mouth-opening stage has been avoided as far as possible [16]. We believe that the reason for the high mortality at the mouth-opening stage is closely related to the physiological characteristics in this period. These characteristics are involved in the establishment of the immune system, the maturation of assimilation function and the accumulation of macromolecular energy resources. However, the details of the molecular regulation process associated with energy metabolism, immune response and growth regulation are poorly understood in this phase.
The development of high-throughput techniques, such as RNA-seq, prompted us to explore the molecular mechanisms associated with the transition that occurs during the mouth-opening stage in oviparous fish. The understanding of physiological changes in this process is not only a problem involved in developmental biology, but also is directly related to aquaculture. Because of the rapid development, short generation time and easy genetic manipulation of zebrafish, this species is applied widely as a model organism in many different research fields [17,18,19,20,21]. Abundant genetic resources and biological data have been accumulated for this species; thus, zebrafish exhibit many advantages over other fish, especially the availability of comprehensive data on this species’ molecular mechanisms. Similar to other oviparous fish, zebrafish undergo a rapid switch in nutritional strategies during their mouth-opening stage; thus, the study of the molecular mechanisms involved in this stage in zebrafish larvae will benefit the development of aquaculture technology.
In the present study, zebrafish was used as a model to investigate the molecular regulation of the transition from endogenous to exogenous feeding. RNA-seq was used to select three sample populations: the endogenous feeding group (ENDO) at 96 h post fertilization (hpf), mixed feeding group (MIX) at 120 hpf, and exogenous feeding group (EXO) at 192 hpf. The sampling points were determined by the clear differentiation of nutritional sources. At 96 hpf, the fish larvae start swimming after hatching and yolk is the exclusive nutritional source of development. At 120 hpf, yolk-sac reserves and exogenous food sources are consumed concurrently. At 192 hpf, the yolk-sac reserves have been completely consumed and exogenous foods are the exclusive source of nutrition. By comparing the gene expression profiles of the ENDO, MIX, and EXO groups and performing further quantitative real time polymerase chain reaction (PCR) validation, the energy utilization, growth regulation and immune responses were found to change most strikingly during the mouth-opening stage. An intrinsic physiological switch during the mouth-opening stage was observed in zebrafish larvae that caused the build-up of lipid reserves via the increased uptake and reduced metabolism of fatty acids. Moreover, the antigen recognized pathway was also significantly activated following mouth opening, and the qPCR analysis confirmed that the nutritional supply was required. These data provide a framework for future investigations of the mechanisms underlying the immune regulation and energy distribution processes that occur during the transition from the endogenous to exogenous feeding stages, and such insights will be beneficial for the fish farming industry.

2. Results

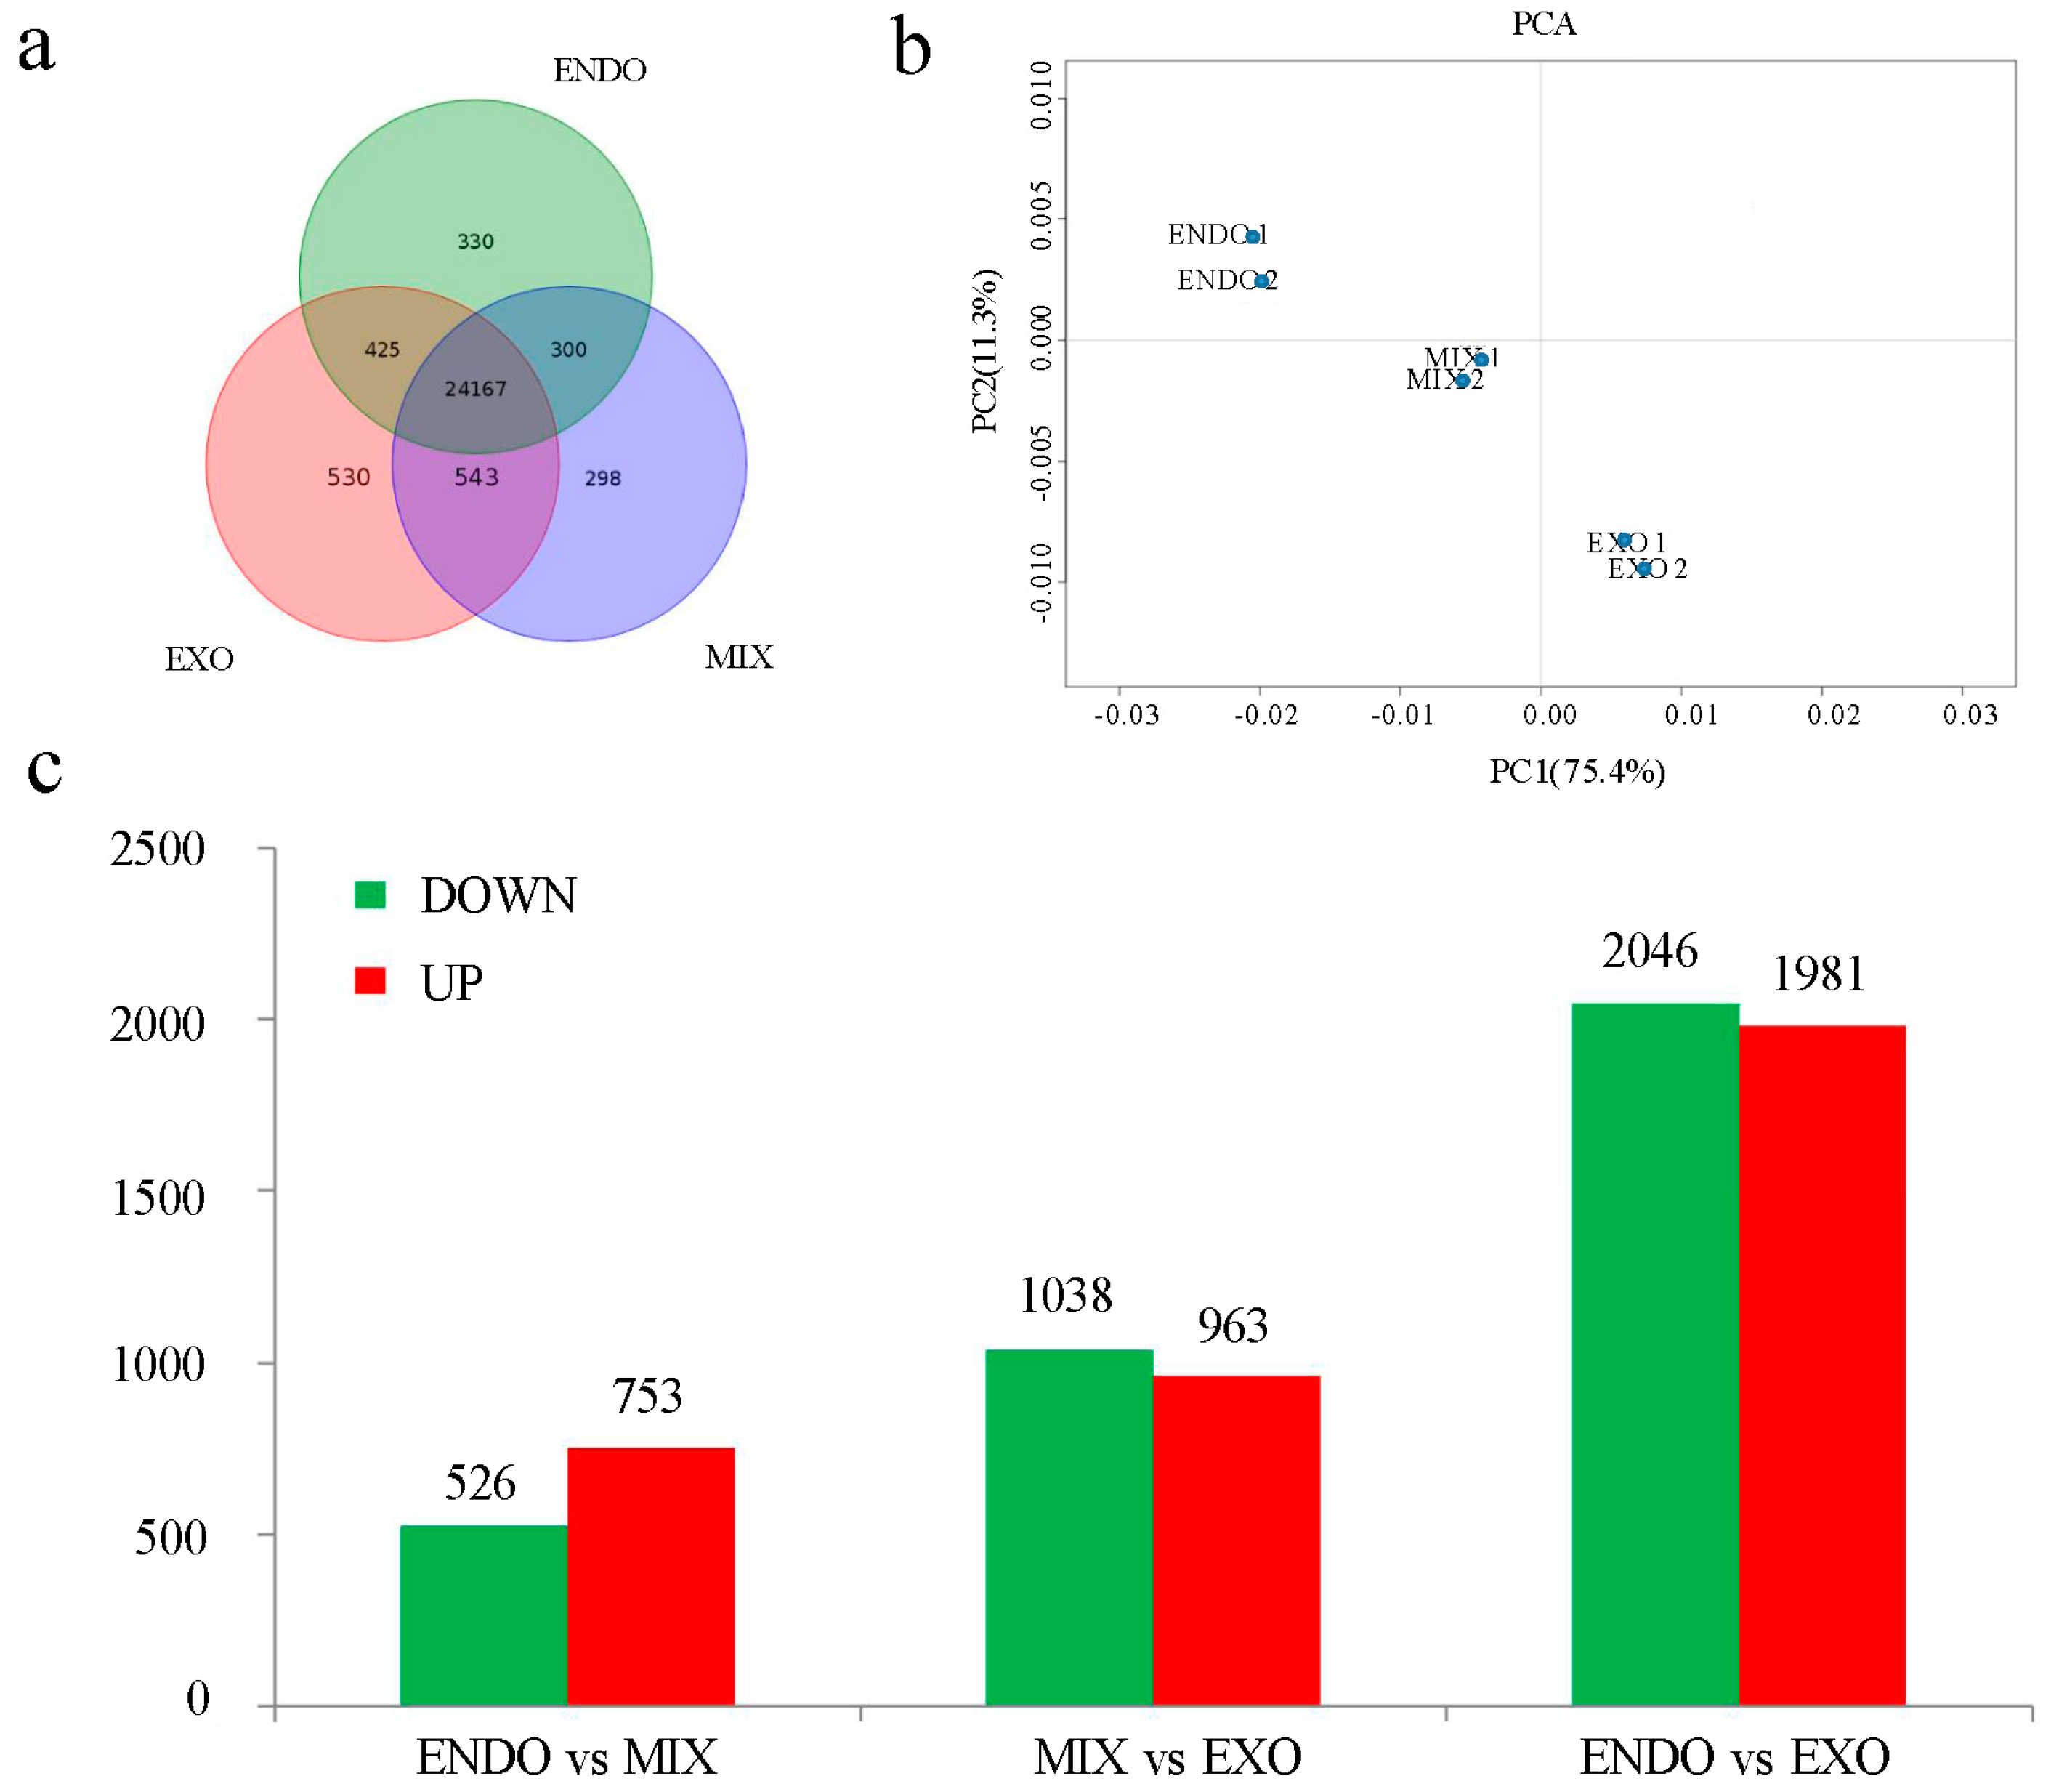
2.1. Mapping of RNA-Seq Reads to the Zebrafish Genome

To reveal the transcriptional profiles for the transition from the endogenous to the exogenous feeding phase in zebrafish larvae, total RNA was extracted from two biological replicates each for the ENDO (96 hpf), MIX (120 hpf) and EXO (192 hpf) samples, and an RNA-seq analysis was performed (Figure 1a). Zebrafish larvae in the three phases displayed a distinguishable feeding behavior (Figure 1b–d). At 96 hpf, although the mouth had developed to a protrusion, feeding behavior was not observed. At 120 hpf, exogenous foods were observed easily in the intestinal tract, and the statistical feeding rate reached 100%. At 192 hpf, the yolk-sac reserves were exhausted, and the nutritional resources were exclusively exogenous.
RNA-seq generated 21.19–26.06 million (M) pairs of raw reads for each sample, and less than 3% of raw reads were discarded (Q < 20 and length < 25 bp) (Table 1). After the quality filtering, clean reads were extracted and mapped to the ribosome database. A total of 20.37 M–24.91 M reads were detected as the remaining reads and mapped to the zebrafish genome using TopHat. Moreover, 16.97 M–20.80 M reads were mapped to the total number of processed reads, and the ratio of unique mapping was 97.86–98.30% (Table 1).

2.2. Gene Expression Detected by RNA-Seq

In the present study, genes with a mean abundance >0 FPKM (Fragments per kilobase of transcript per million mapped reads) in any one of these samples were regarded as being expressed. According to Genome Reference Consortium Zebrafish Build 10 (GRCz10), 26,593 genes were detected during the mouth-opening stage (Figure 2a), and remaining 5422 genes were undetected. These non-detected gene transcripts were enriched in the gene ontology (GO) category biological processes (Table S1), which included neurological system processes, sensory perception of chemical stimuli, and G-protein coupled receptor signaling pathway. Moreover, 24,167 shared transcripts were observed among the three developmental stages. The number of transcripts shared only between two developmental stages was lower, with the ENDO stage sharing 300 transcripts with the MIX stage and 425 transcripts with the EXO stage (Figure 2a).
The overall change in gene expression during the transition from endogenous to exogenous feeding was analyzed by a principal component analysis (PCA). The inter- and intra-group variations in gene expression are shown in Figure 2b. The results showed that 86.7% of the variations in gene expression could be explained by the first two principal components (PCs). Minute variations in the intra-group were indicative of biological replicates highly. PCA projections of the ENDO, MIX and EXO groups in the PC space showed a significant distance, indicating that significant variations in gene expression occurred during the mouth-opening stage of larval development.
A pairwise comparison was performed among the ENDO, MIX, and EXO groups. The criteria of a two-fold or greater change in expression, p-value < 0.05 and false discovery rate (FDR) < 0.05, were used to determine the significantly up- or down-regulated genes. As a result, 1279 genes (753 up-regulated and 526 down-regulated) displayed a change in expression between ENDO and MIX, 2001 genes (963 up-regulated and 1038 down-regulated) between MIX and EXO, 4027 genes (1981 up-regulated and 2046 down-regulated) between ENDO and EXO (Figure 2c; Table S2). Moreover, we performed multiple comparisons using ENDO as the control and MIX and EXO as the treatments. A total of 4965 genes were identified as differentially expressed genes (DEGs) and used for further analysis (Table S3).

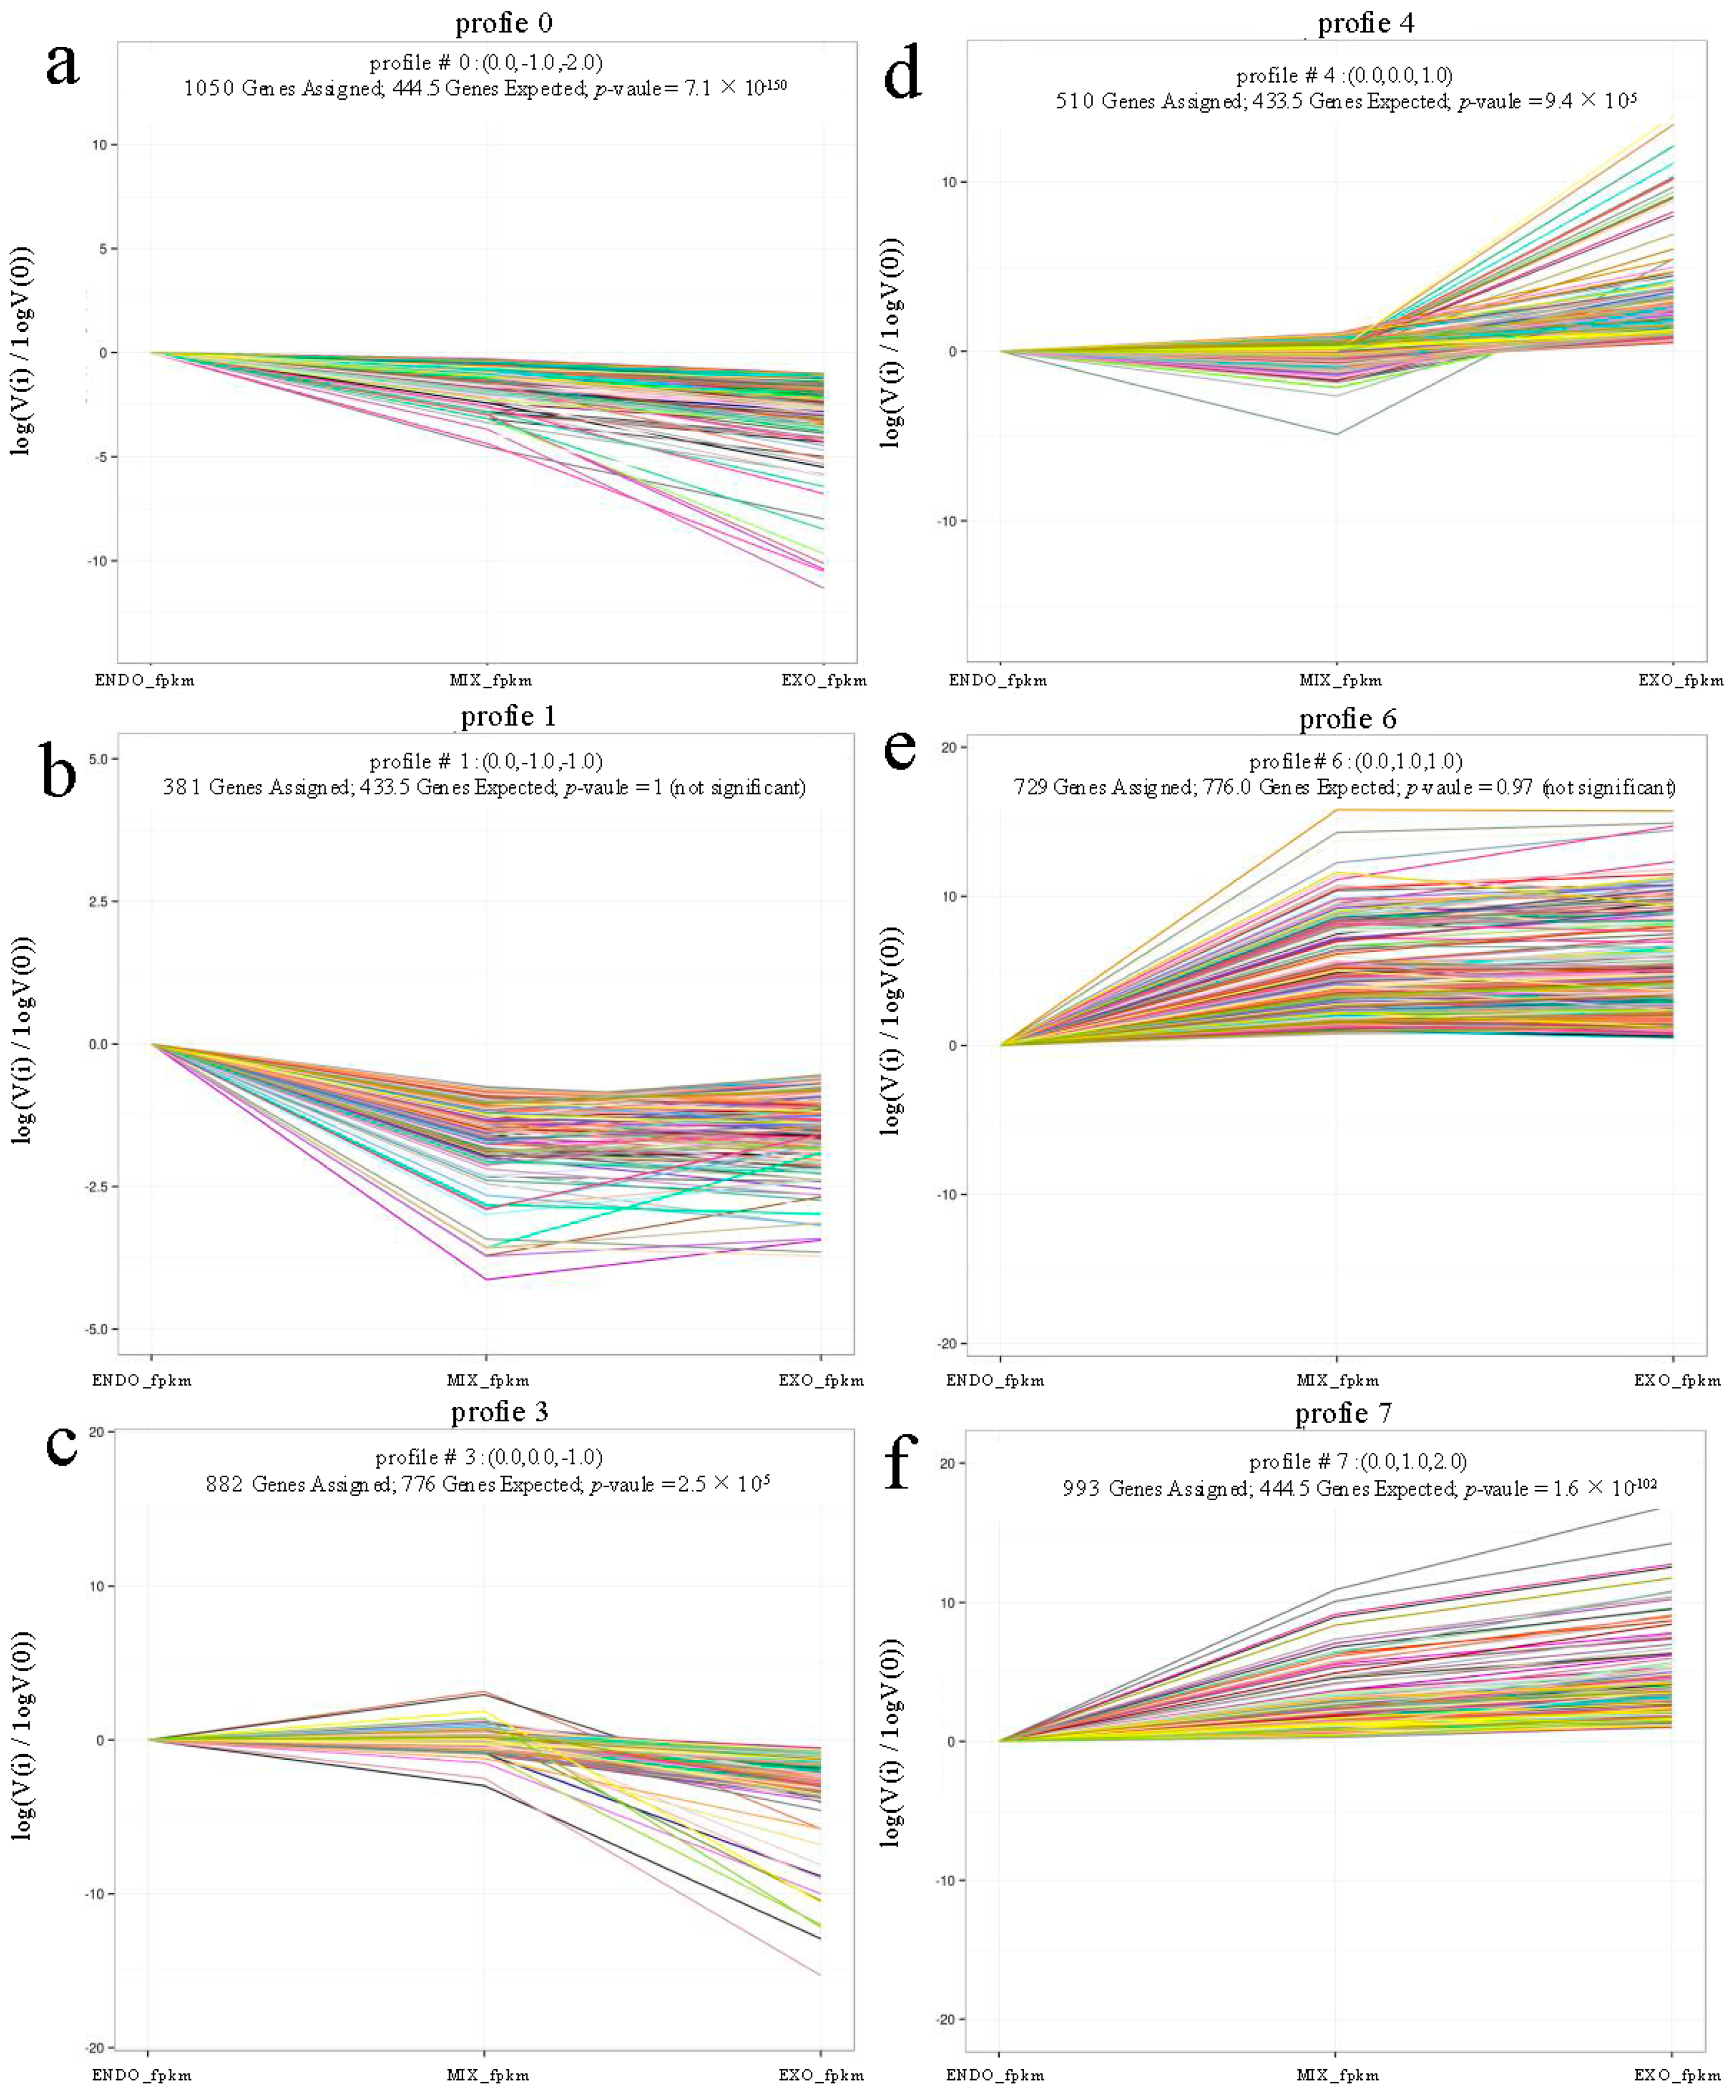
2.3. Analysis of Differential Expression

In the present study, to explore the physiological switches during the mouth-opening stage, we focused on the expression profiles of the 4965 DEGs. From ENDO to EXO, the expression data υ were normalized to 0, log2 (υMIX/υENDO), and log2 (υEXO/υENDO). The DEGs could be clustered into eight profiles using the short time-series expression miner (STEM). In total, 4485 DEGs could be clustered into the six profiles (p-value ≤ 0.05), including three down-regulated patterns in Profiles 0, 1, and 3 (Figure 3a–c), and three up-regulated patterns in Profiles 4, 6 and 7 (Figure 3d–f). Profiles 0, 1 and 3 contained 1050, 381 and 882 DEGs, respectively, while Profiles 4, 6 and 7 contained 510, 729 and 933 DEGs, respectively, (Figure S1).
Next, functional classification of the DEGs was performed to analyze the GO terms using Web gene ontology annotation plot (WEGO). Among the 4965 DEGs, WEGO provided functional annotation for 2692 genes, which were classified into three main functional clusters (biological process, cellular component, and molecular function), and more than 50 GO terms were overrepresented. The DEGs in the biological processes cluster were mainly related to stimuli responses, immune responses and developmental processes (Figure 4).
To identify the switch of physiological pathways during the mouth-opening stage, we mapped 4965 DEGs to the kyoto encyclopedia of genes and genomes (KEGG) database, and 36 pathways were overrepresented (Table S4). The top 10 KEGG pathways with the highest representation of DEGs are shown in Table 2. In the fat digestion and absorption pathways, 16 genes were found to be differentially expressed. The two genes annotated to Profile 4, six genes annotated to Profile 6 and eight genes annotated to Profile 7 showed different patterns of up-regulation, and none of the genes showed patterns of down-regulation. Similar results were observed in the antigen processing and presentation, arachidonic acid metabolism, and linoleic acid metabolism pathway. Conversely, the homologous recombination and cell cycle pathway, and fatty acid metabolism showed significant down-regulation trends (Table 2 and Table S4).
Overall, the results from the GO and KEGG pathway analyses showed that the DEGs were highly associated with immune response, growth regulation and energy utilization in zebrafish larvae during the mouth-opening stage.

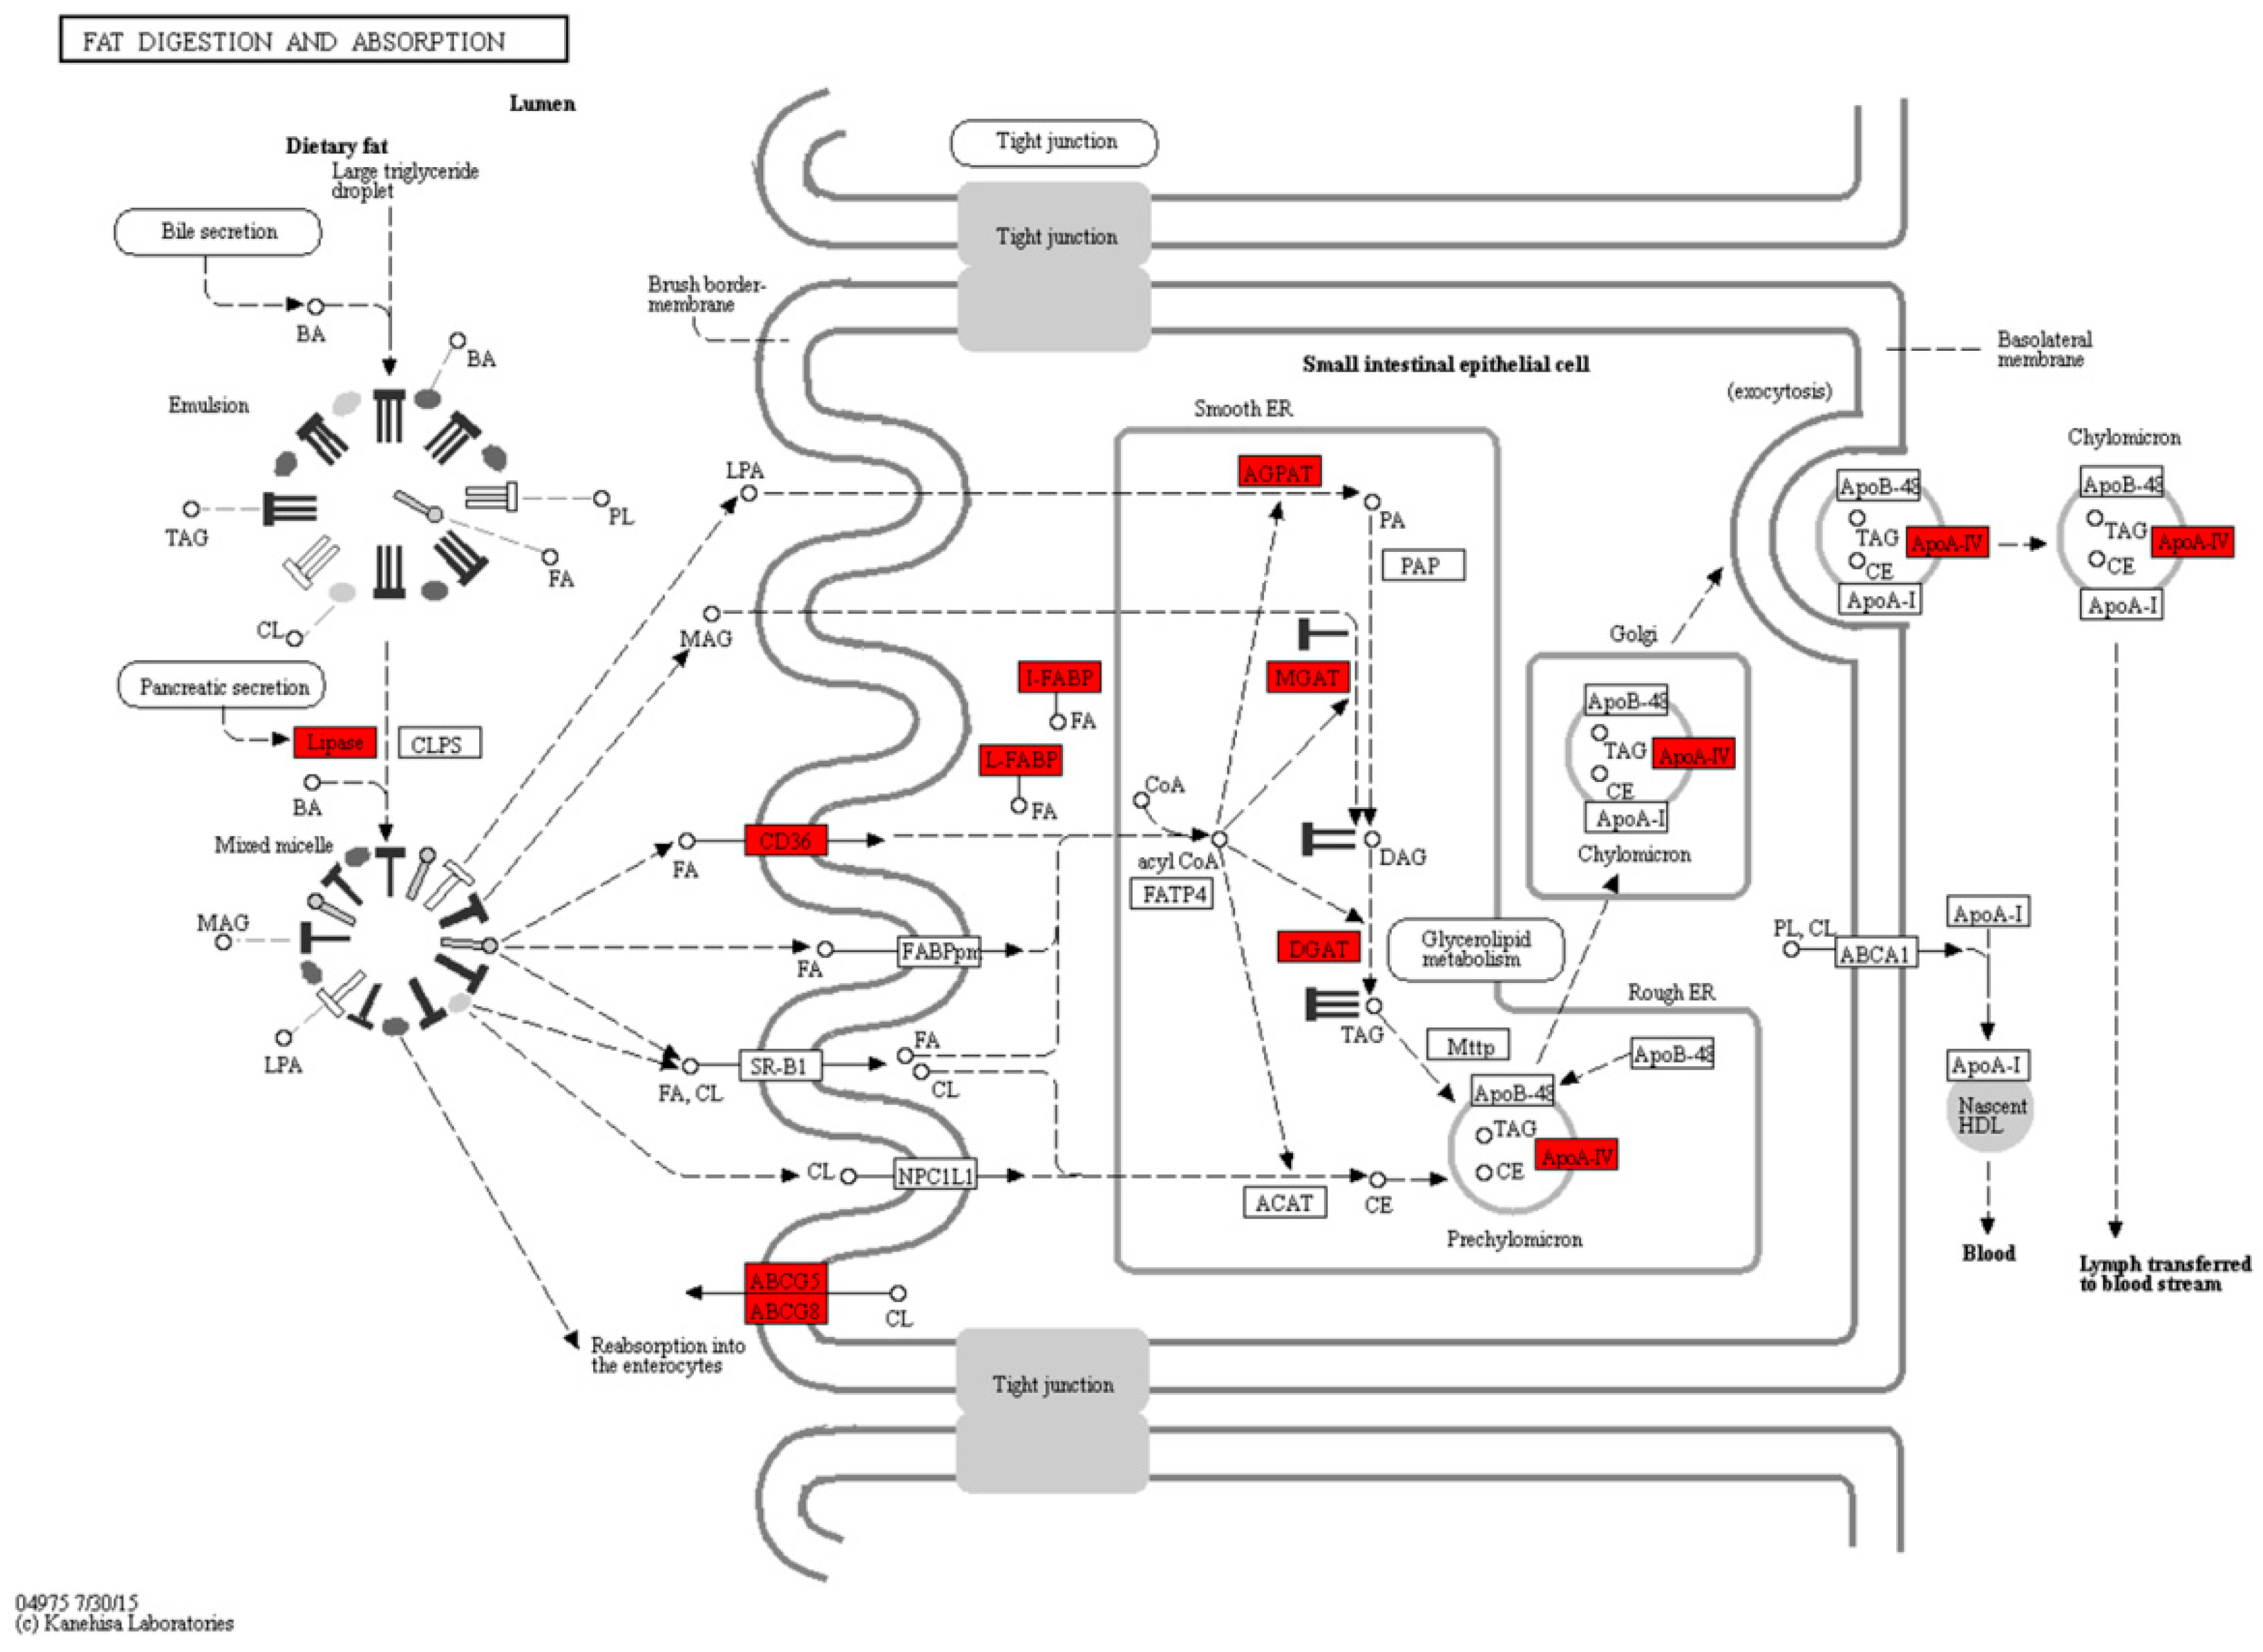
2.4. Fat Digestion, Absorption and Fatty Acid Metabolism during the Mouth-Opening Stage

Figure 5 shows that a large number of the DEGs involved in the fat digestion and absorption pathway were annotated by the KEGG pathway enrichment analysis during the mouth-opening stage. In the process of exogenous lipid digestion, five DEGs (cel.1, cel.2, pla2g12a, pla2g1b, and pla2g3) belonged to lipases and showed different up-regulation profiles. Similar results were found in the free fatty acid transportation and triglyceride re-synthesis processes, with four DEGs (fabp2, fabp6, fabp1b.1, and fabp10a) encoding fatty acid binding proteins and three DEGs (agpat2, mogat2, and dgat1a) encoding acyltransferase. Furthermore, three apolipoproteins (apoa4a, apoa4b.2, and apoa4b.3) involved in the transport of lipids were significantly up-regulated. In the fat digestion and absorption pathway, all 16 DEGs showed up-regulated profiles during the mouth-opening stage.
The absorption of exogenous fatty acids are either used for lipid storage or energy supply. In the present study, the up-regulated profile of cd36 was observed in the switch from endogenous to exogenous feeding (Table S3), and it is a marker for adipogenesis in mammalian models. Conversely, we observed a significantly decreased expression profile for the key genes involved in fatty acid metabolism, including carnitine-palmitoyl transferase transporter isoforms cpt1aa, cpt1ab, and cpt2. Moreover, besides of the three isoforms, acads, acat2, eci1, and aldh9a1b also were identified that showed down-regulated profiles in the fatty acid metabolism pathway, whereas only acsl5, acox1, and acox3 showed up-regulated profiles (Table S3). Obviously, the number of DEGs with down-regulated profiles in fatty acid metabolism was higher than the number with up-regulated profiles.
The above gene expression profiles revealed that during the mouth-opening stage, zebrafish larvae show increased lipid deposition and reduced fatty acid metabolism; therefore, we labeled neutral lipid droplets with Nile Red to explore adipogenesis in zebrafish larvae after mouth-opening feeding. The results showed that, under normal feeding condition, significant neutral lipid droplets were firstly observed commencing at 12 dpf and approximately 74% was labeled (Figure 6a), and this value increased in number and distribution with the growth of zebrafish (Figure 6b,c).

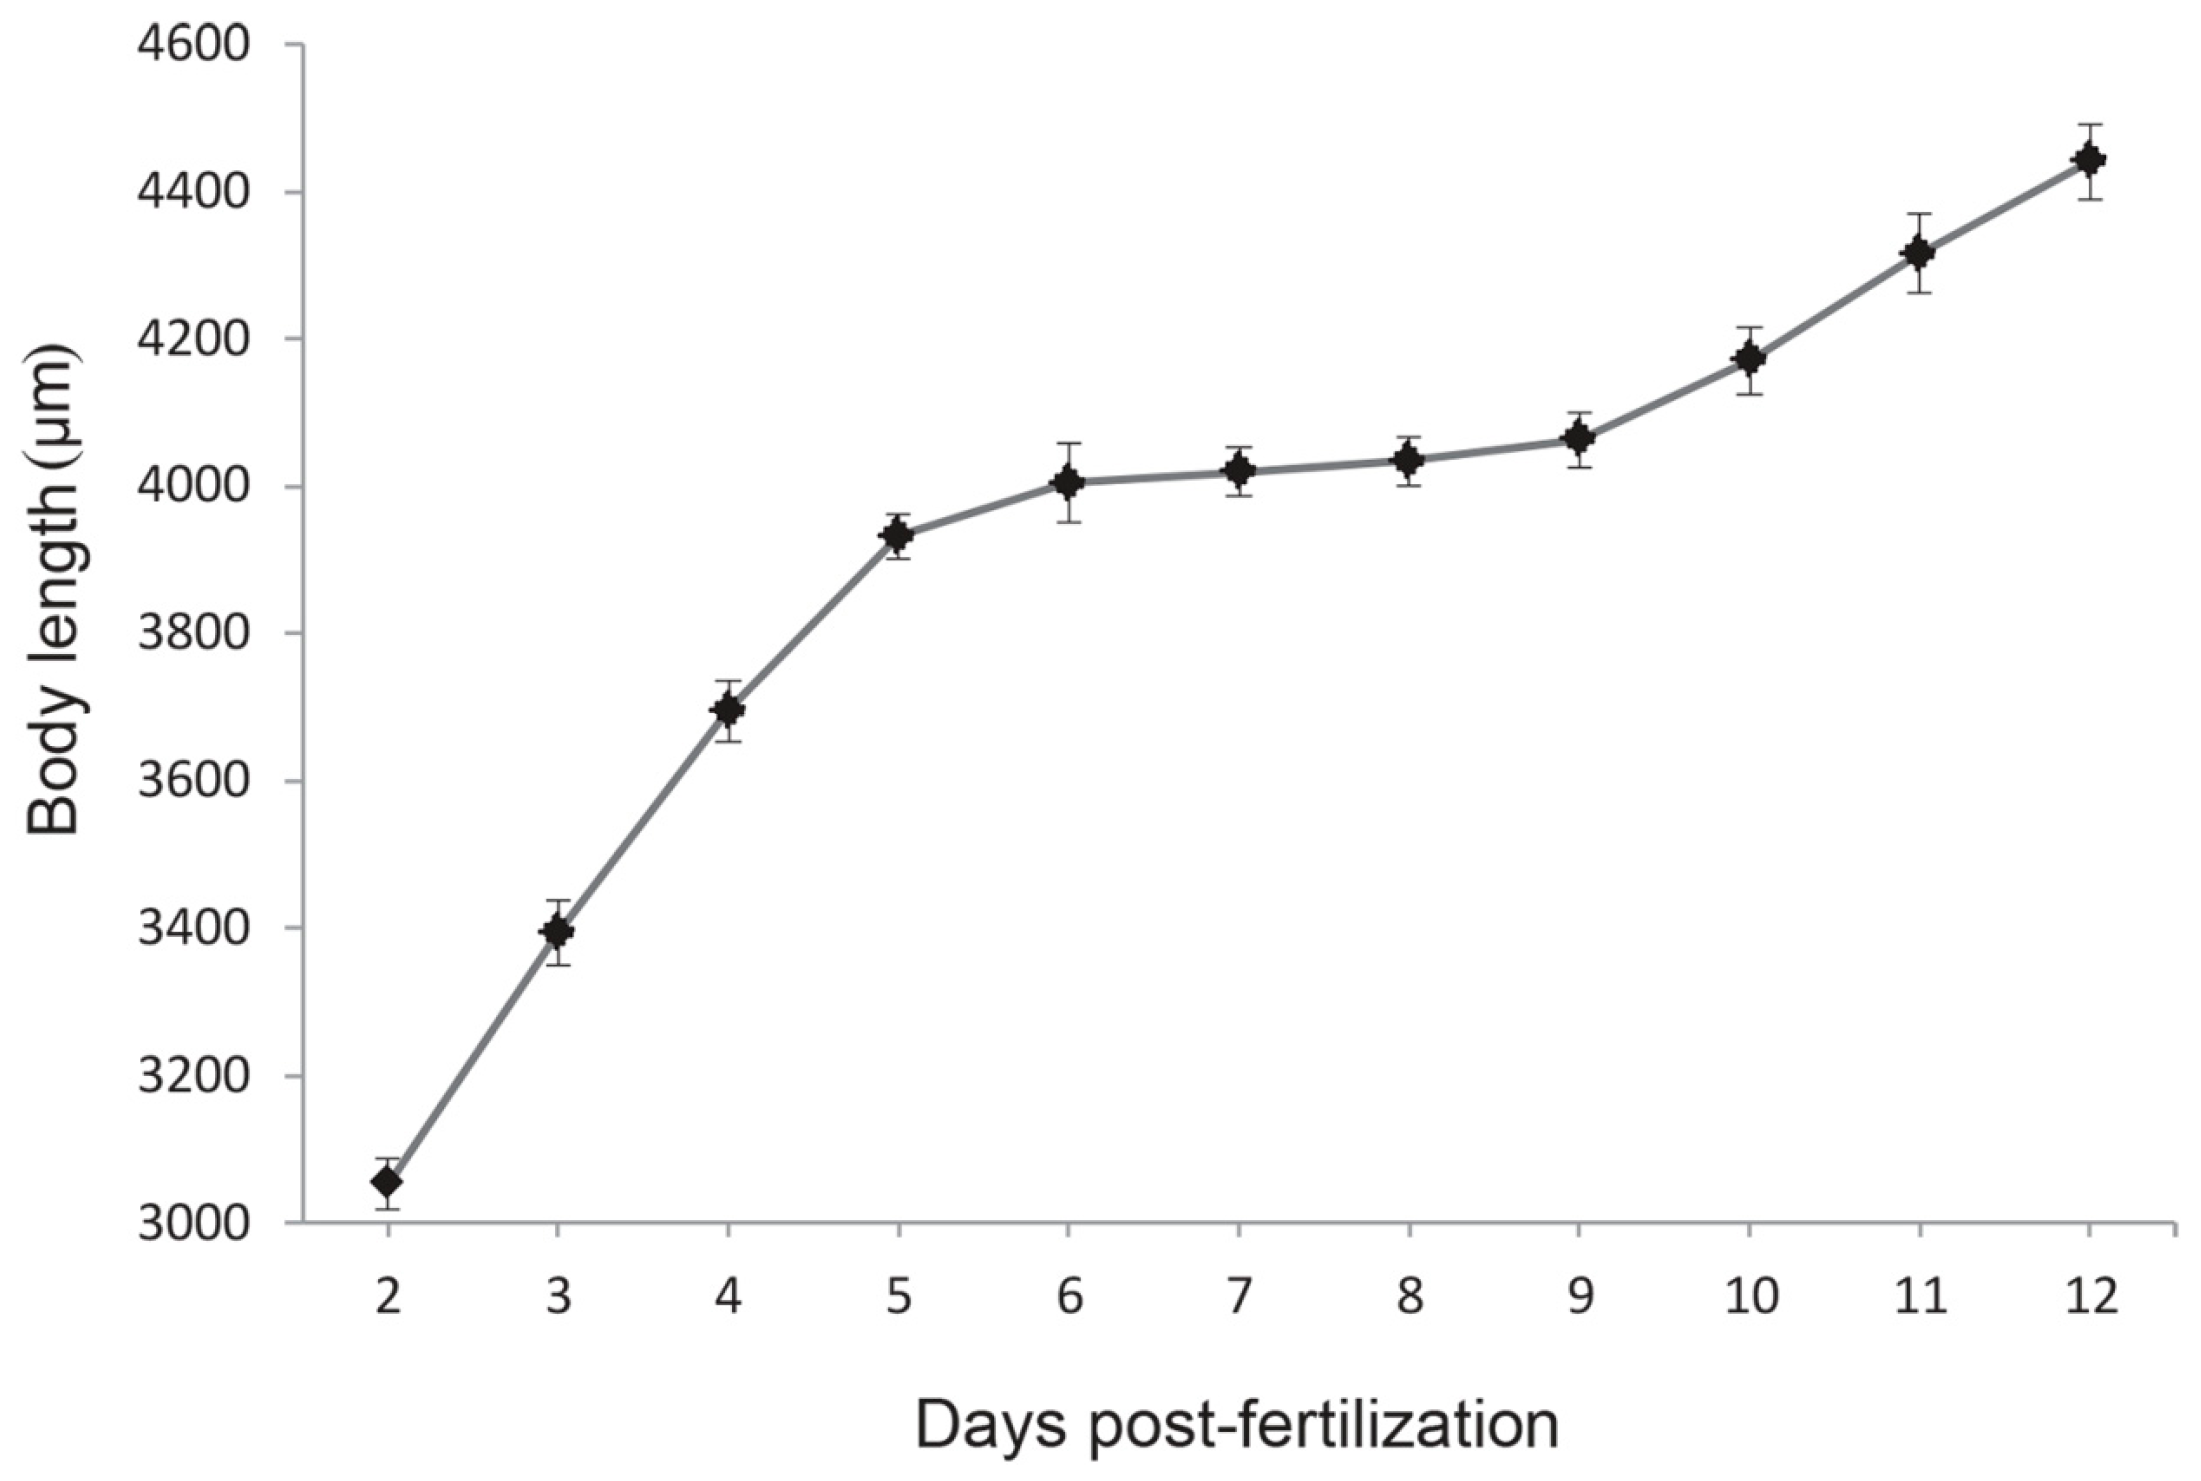
2.5. Temporal Expression of the Growth Hormone and Insulin-Like Growth Factor-I (GH-IGF-I) System and Growth Pattern during the Mouth-Opening Stage

In the present study, several factors of the growth hormone (GH)-insulin-like growth factor-I (IGF-I) system were identified. Growth hormone 1 (gh1) is a protein that stimulates growth and cell reproduction in most animals, and it presented an up-regulated expression profile from ENDO to EXO; however, other molecules associated with growth hormone, such as growth hormone releasing hormone (ghrh), growth hormone releasing hormone receptor (ghrhr1, ghrhr2, ghrhra, and ghrhrb), growth factor receptor-bound protein 2 (grb2a and grb2b), and GRB2-associated binding protein (gab1 and gab2), displayed no significant difference. Moreover, insulin-like growth factors (IGFs) and insulin-like growth factors receptors (IGFRs) did not show significant differences. However, IGFBP1, which is present as two isoforms, igfbp1a and igfbp1b, displayed similar up-regulated profiles with development. A completely inverse expression profile was observed for igfbp2a. Other IGFBPs, including igfbp2b, igfbp3, igfbp5, and igfbp6, did not display differences in expression during the mouth-open stage (Table S3).
To further explore the growth pattern in zebrafish larvae during the mouth-opening stage, we measured the body length of the larvae and drew a growth curve from hatching to the exogenous feeding stage (Figure 7). The fastest increase in body length was observed at the endogenous feeding stage (2–5 dpf), which was followed by a significant decrease to almost growth arrest at the mixed feeding stage (5–8 dpf), and then a high increase in growth was gradually restored at 9 dpf. This phenotype was consistent with the global gene expression profiles of the cell cycle pathway. The RNA-seq analysis revealed that 32 DEGs were annotated in the cell cycle pathway (Figure 8), including at the G1, S, G2, and M phases. Among the multiple steps during cell division, significantly down-regulated profiles were observed for 30 out of the 32 functional genes, including genes for cyclin-dependent kinases (cdk1, cdk2, and cdk7), cyclins (ccna2, ccnb1, ccnb2, ccnb3, and ccne2), polo-like kinase 1 (plk1), cell division cycle 25B (cdc25b), and mitotic checkpoint serine/threonine kinase (bub1, bub3). Only one gene encoding the structural maintenance of chromosomes 1A (smc1a) and one gene encoding the cell division cycle 14Aa (cdc14aa) showed up-regulated profiles.

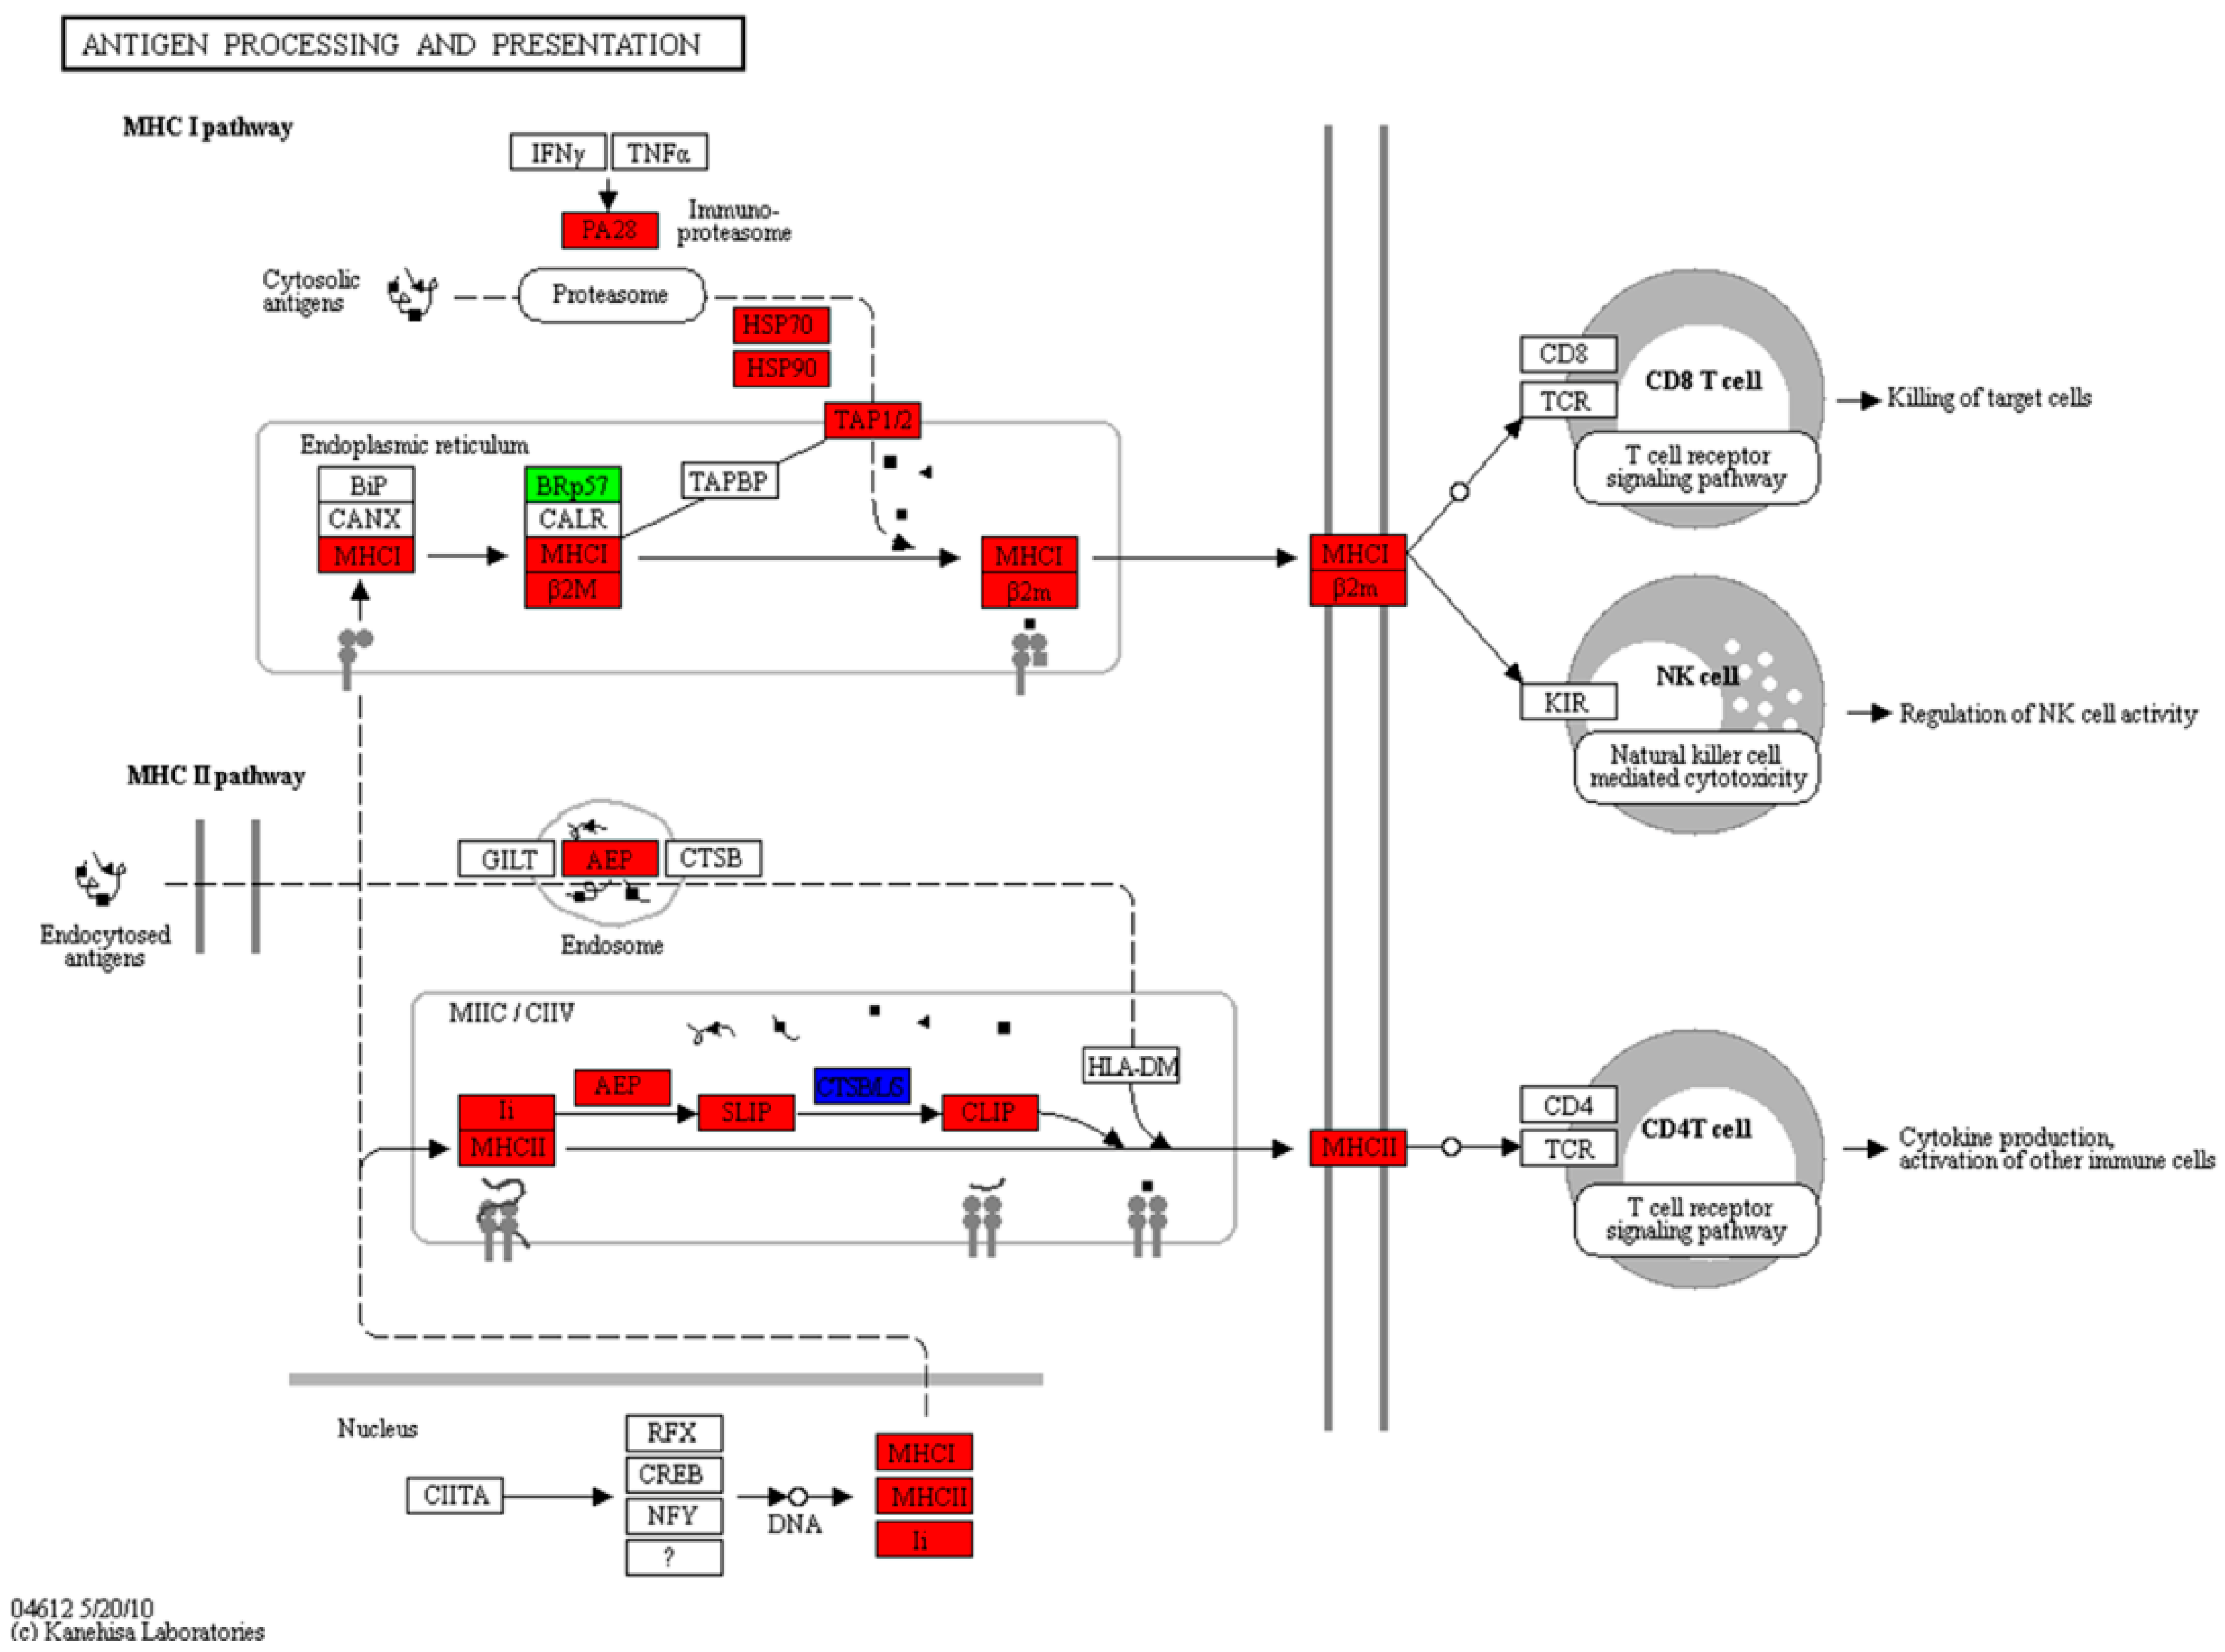
2.6. Expression of the Antigen Processing and Presentation Pathway during the Mouth-Opening Stage

The RNA-seq analysis revealed that a significant number of genes associated with protein degradation and transportation in the antigen processing and presentation pathway were differentially expressed in zebrafish larvae during the mouth-opening stage (Figure 9). Significantly up-regulated gene profiles were observed in the major histocompatibility complex (MHC)-I pathway, including the proteasome activator (psme1 and psme2), heat shock protein superfamilies (hsc70 and hsp90aa1.2), transporter of antigen presentation (tap1), beta (β)-2-microglobulin (b2m and b2ml) and MHC class I ZEA protein (mhc1zea) genes. A similar change in expression was also observed in the genes related to the MHC-II pathway, such as the CD74 molecule, MHC, class II invariant chain (cd74a and cd74b), legumain (lgmn), cathepsin Bb (ctssb), MHC class II DAB gene (mhc2dab), MHC class II alpha (α) chain (si:busm1-266f07.2), MHC class II β chain (si:busm1-194e12.12), and cathepsin S,b.2 (ctssb.2) genes. In the present study, the entire antigen processing and presentation pathway, which includes nine genes involved in the MHC-I pathway and eight genes involved in the MHC-II pathway, showed up-regulated profiles. However, only one gene encoding disulfide-isomerase A3 precursor (zgc: 100906) in the MHC-1 pathway and two genes encoding cathepsin S,b.1 (ctssb.1) and cathepsin La (ctsla) in the MHC-II pathway showed down-regulated profiles.

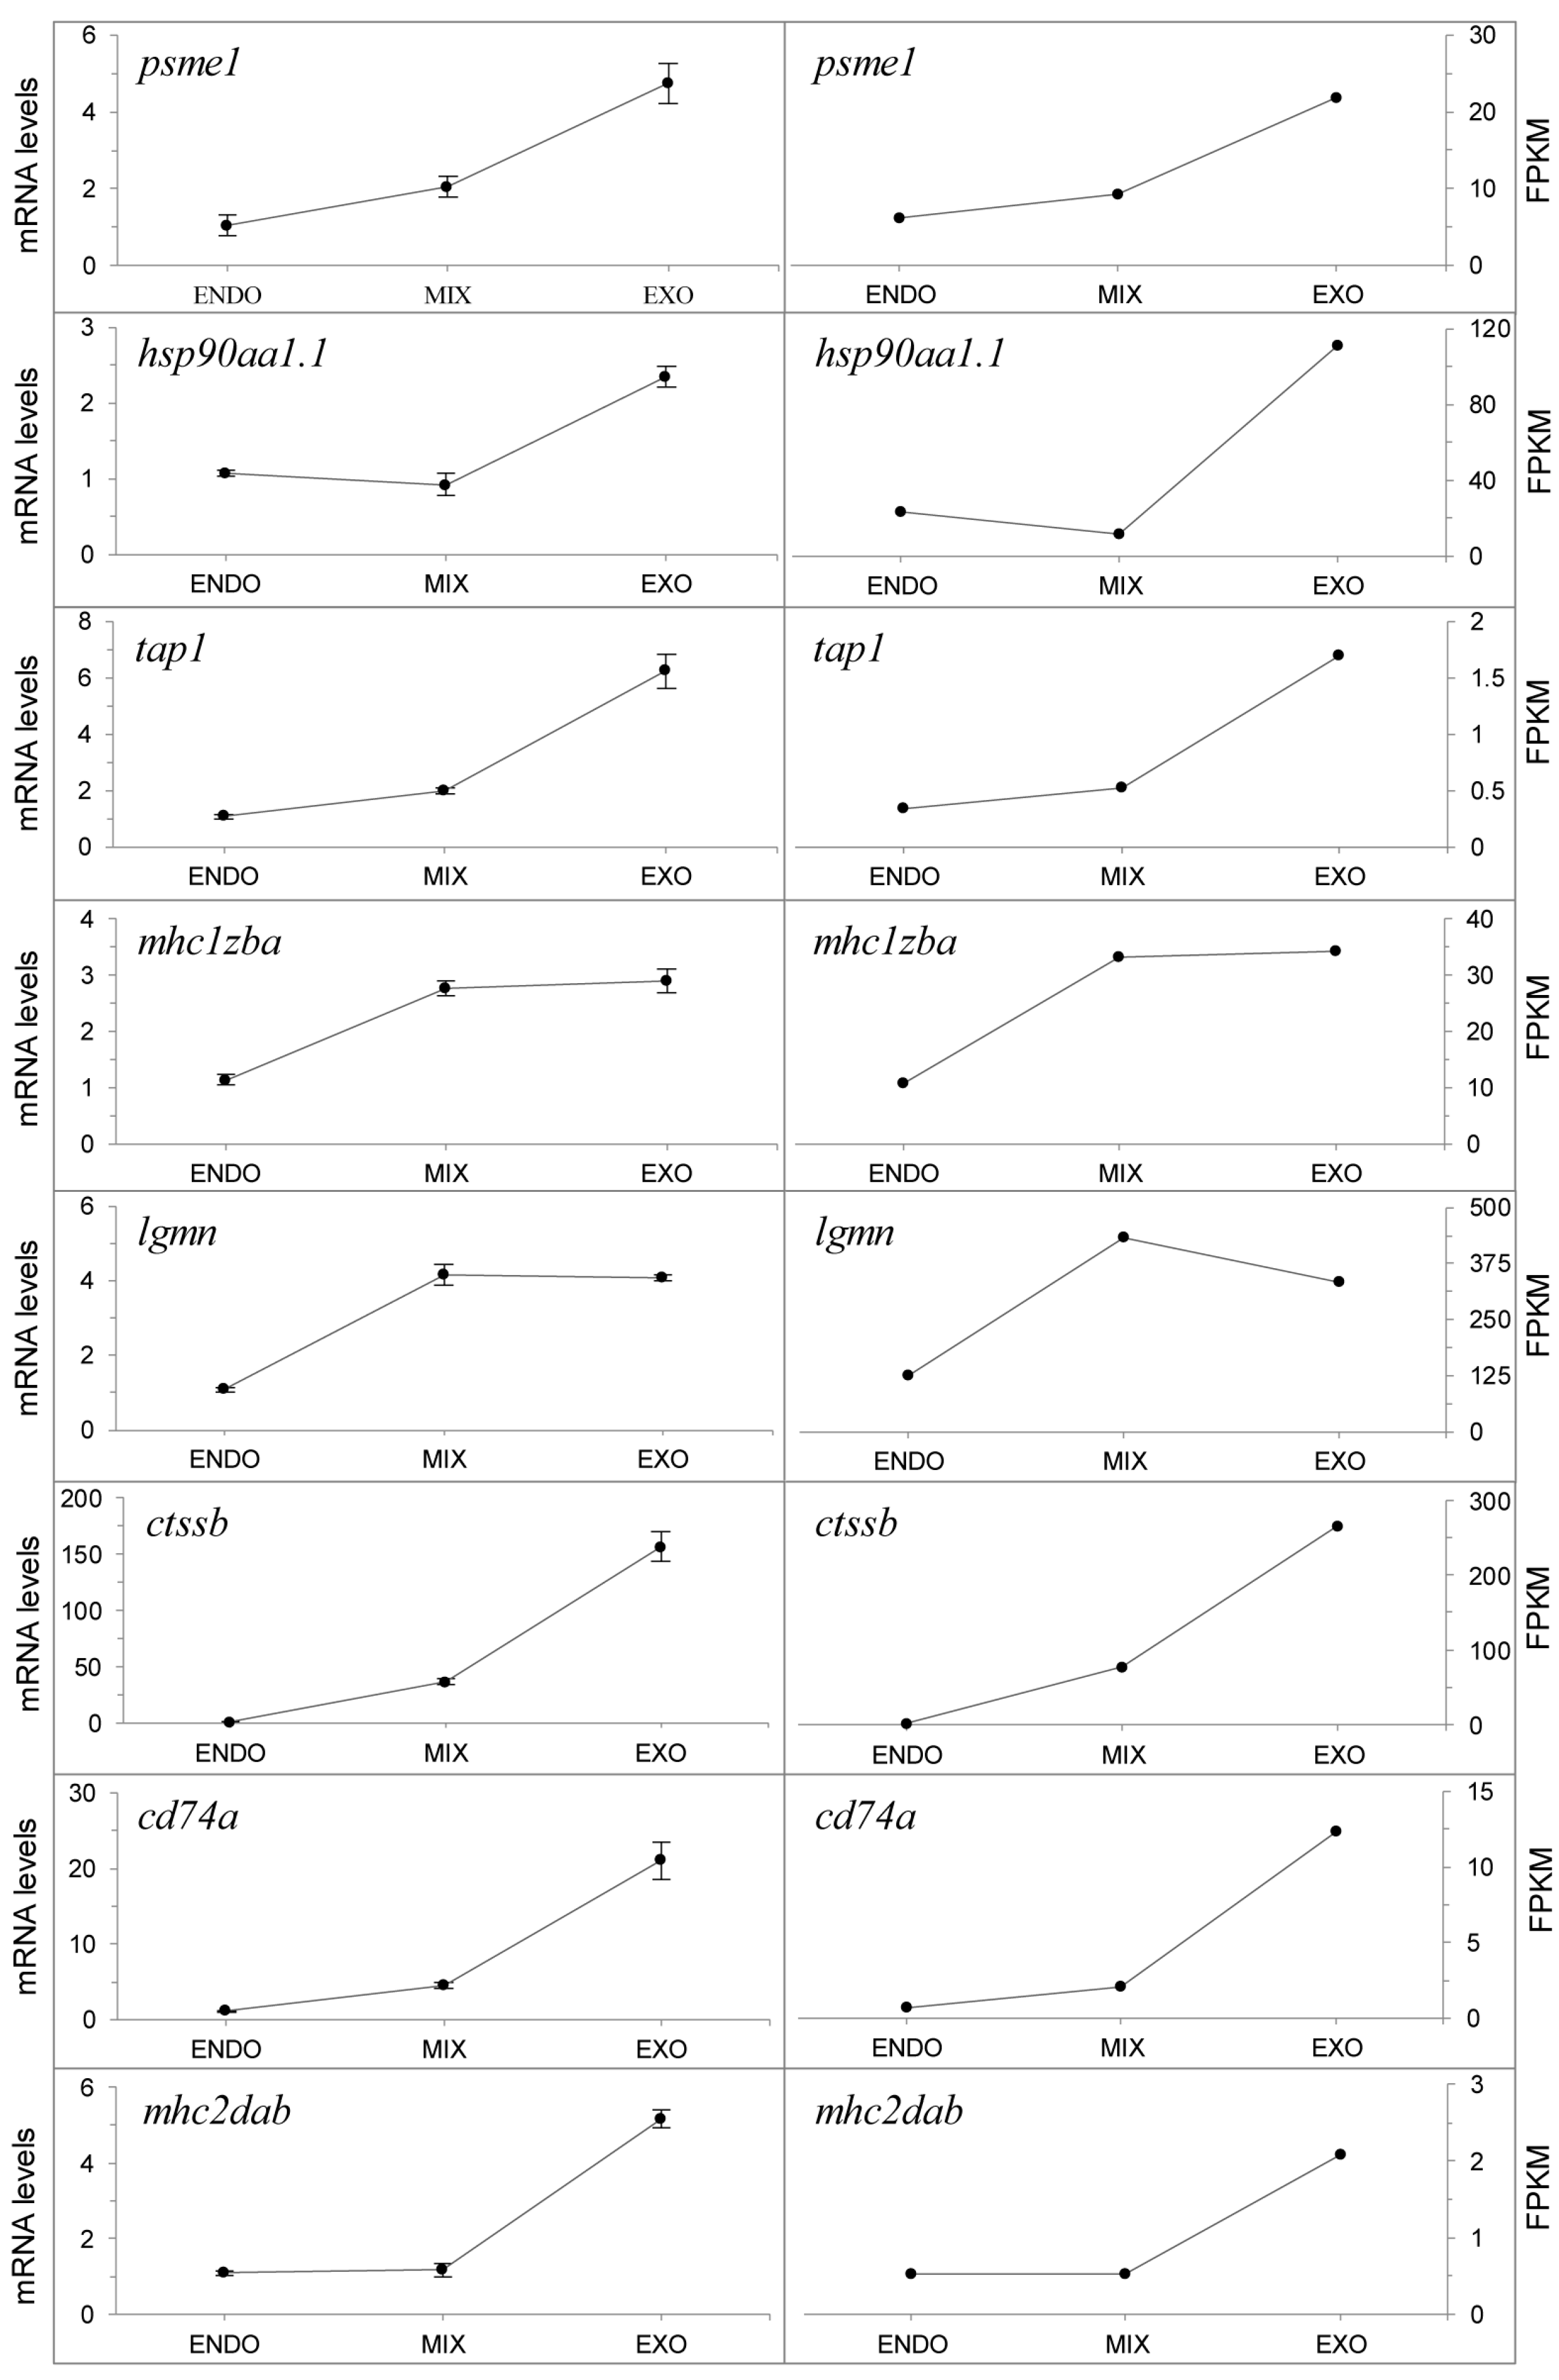
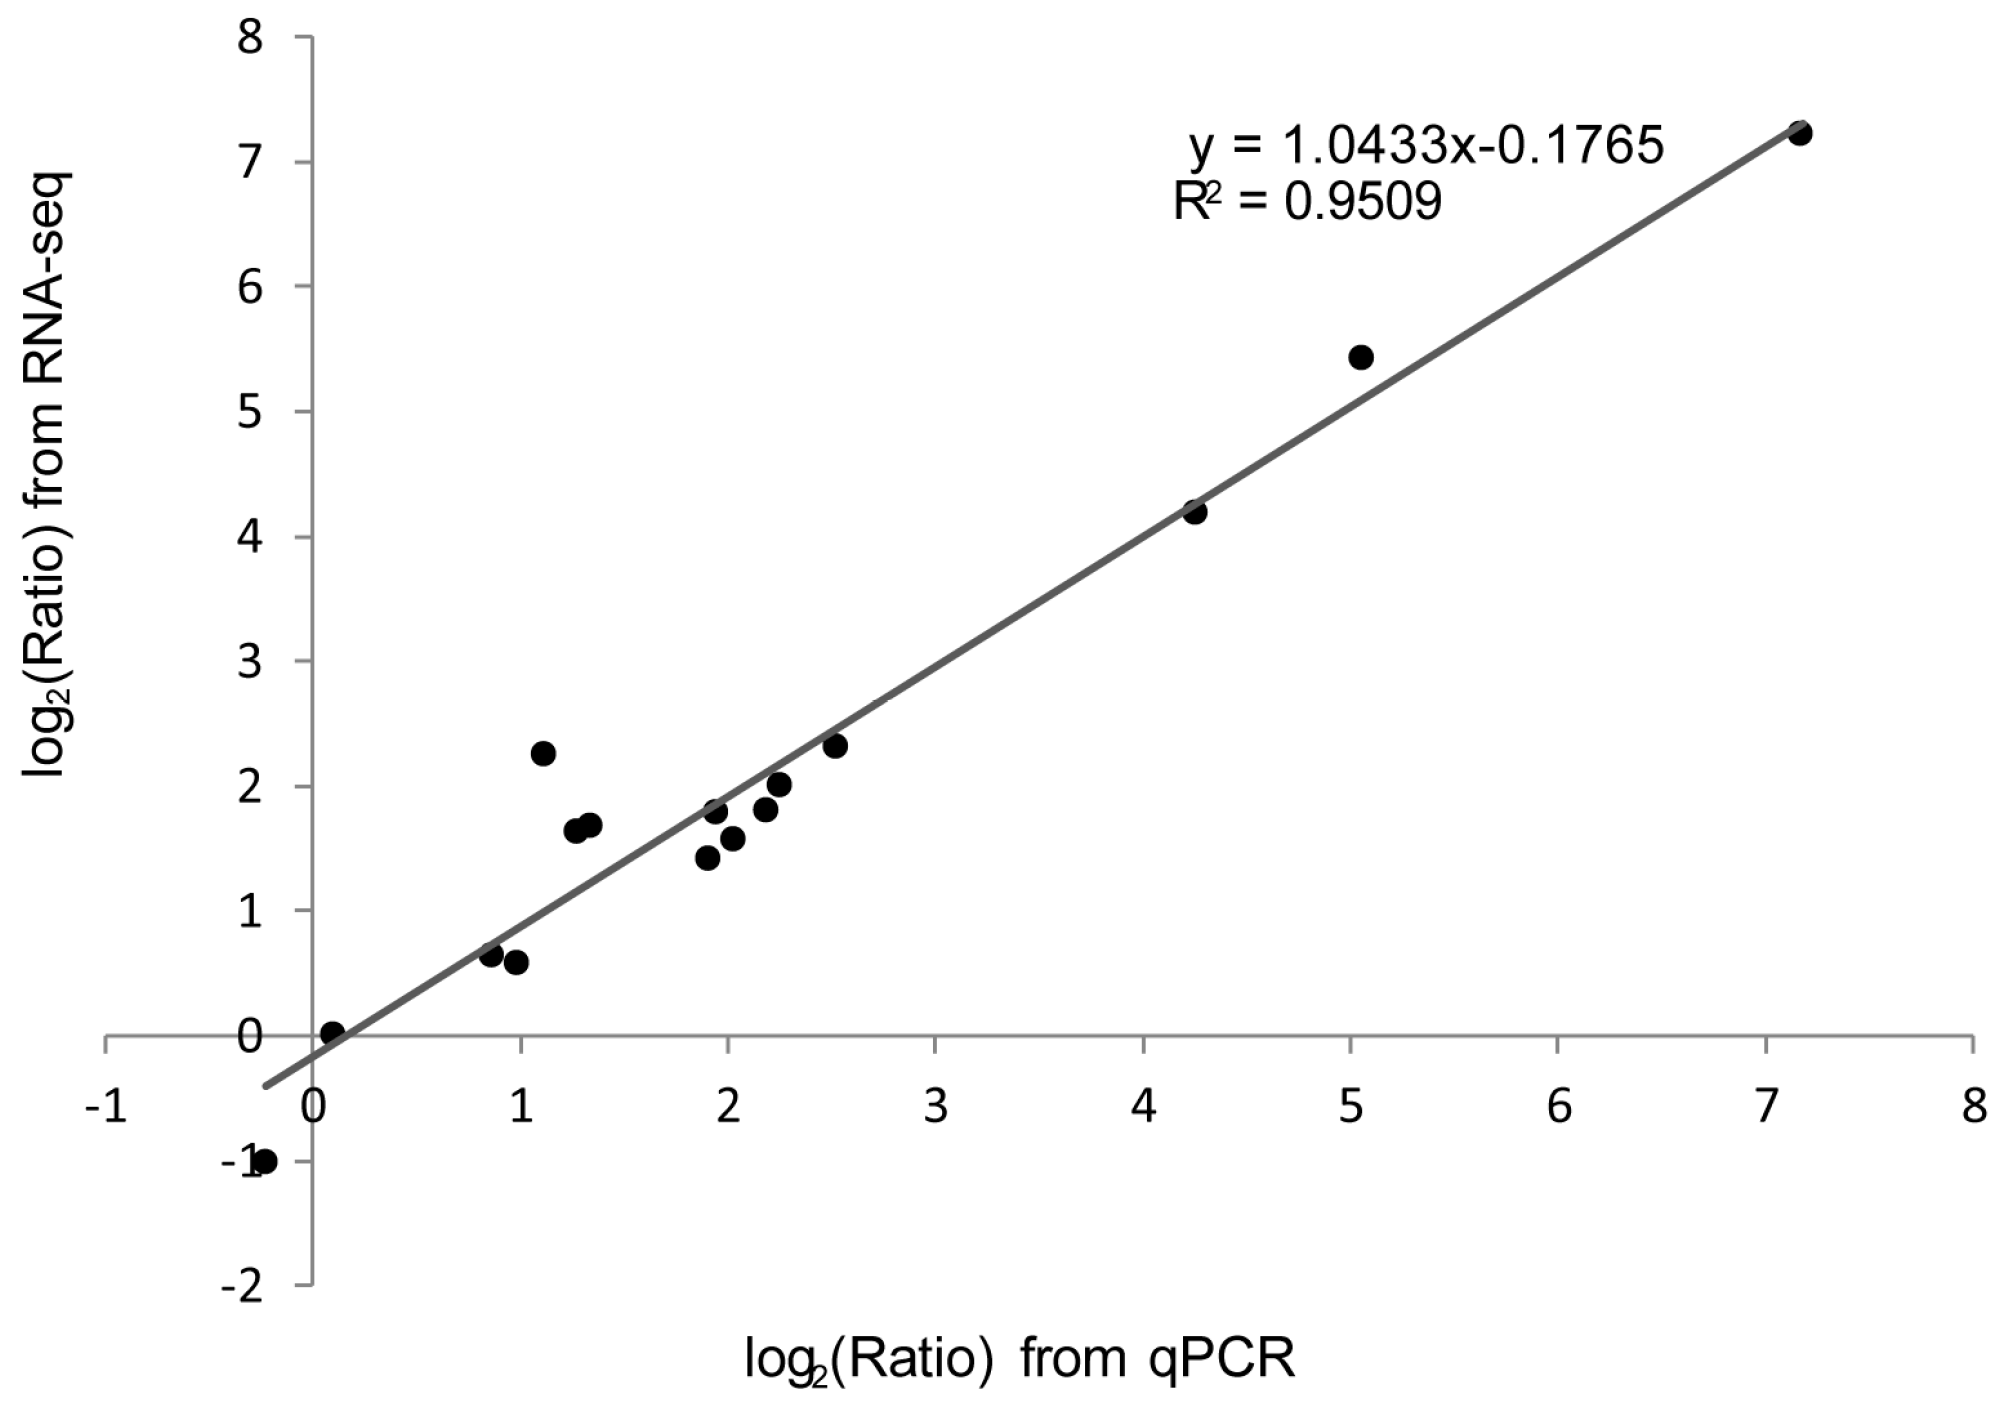
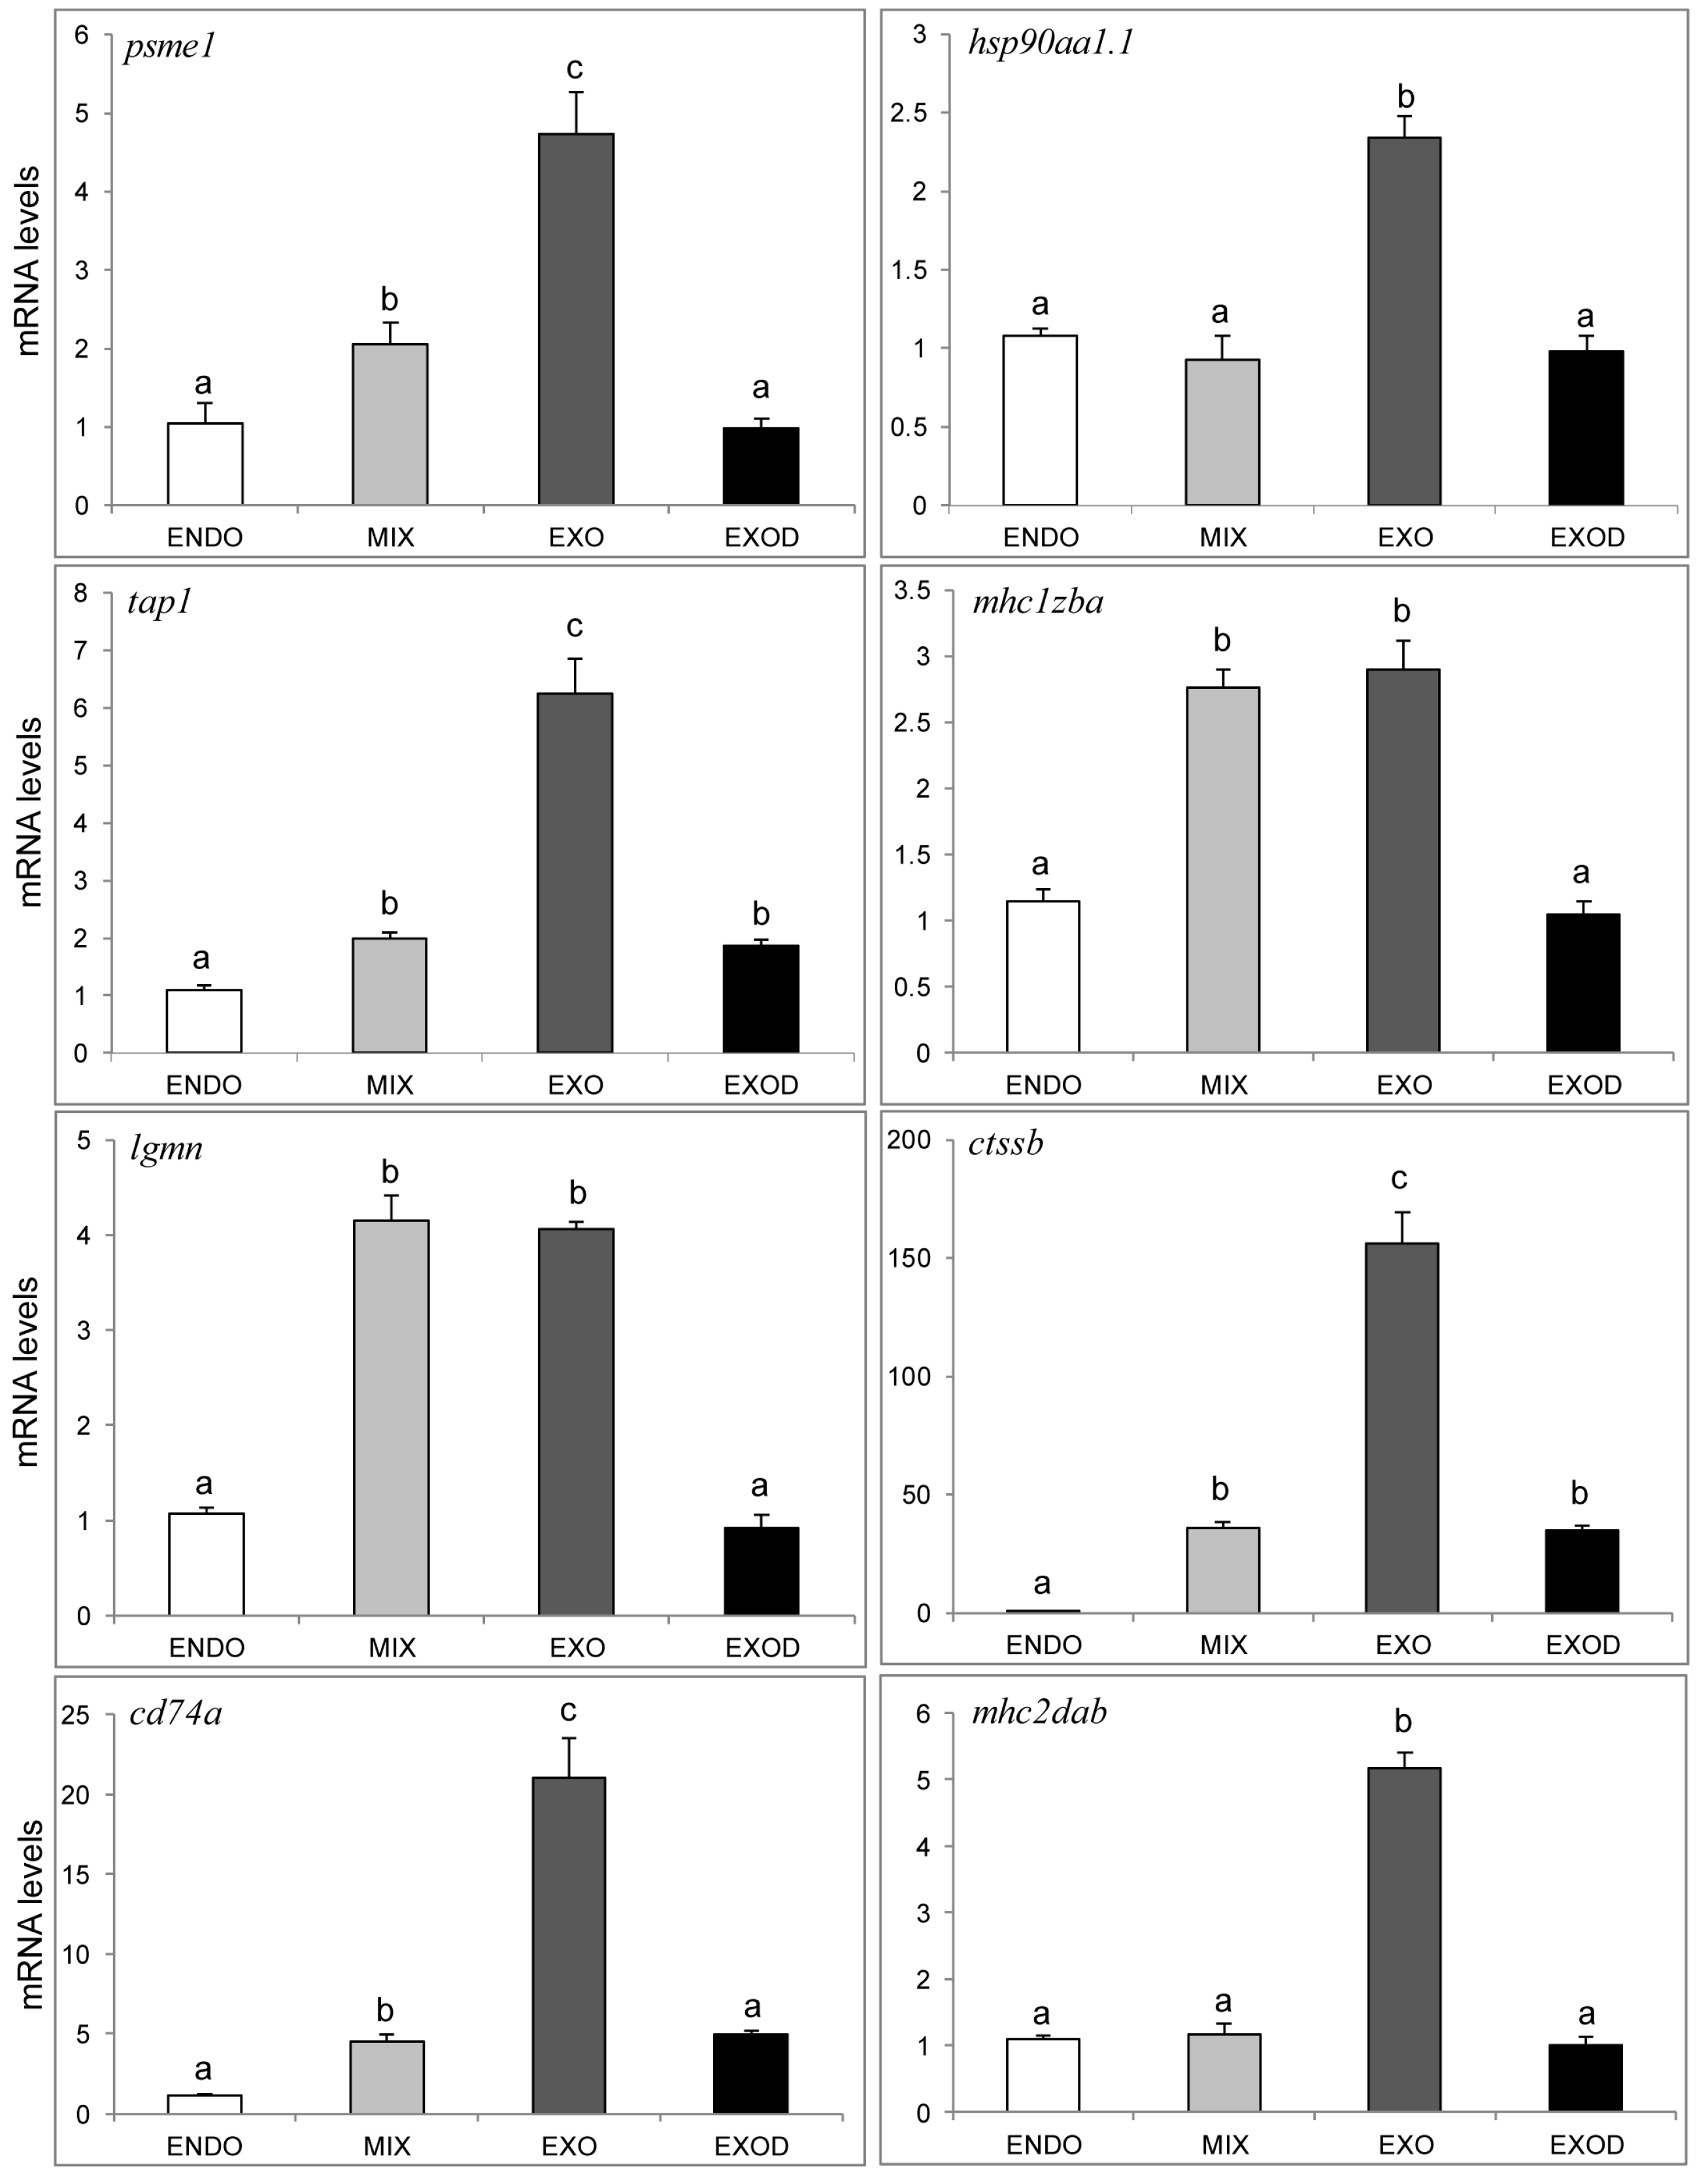
2.7. qPCR Analysis of Genes in the Antigen Processing and Presentation Pathway

To validate the reproducibility and accuracy of the RNA-seq analysis results, we determined the relative mRNA levels for eight genes in the antigen processing and presentation pathway via qPCR. Primers of the candidate genes are shown in Table S5. The results showed that the qPCR expression patterns for candidate genes were consistent with those of the RNA-seq data (Figure 10). Furthermore, the fold change of the gene expression ratios between the RNA-seq and qPCR analyses were significantly positive correlated (R2 = 0.9509) as revealed by a linear regression analysis (Figure 11). This finding indicated the reliability of the RNA-seq data.
Next, to determine whether the activation of the MHC pathways during the mouth-opening stage requires a supply of exogenous nutrients, the same gene expression levels were determined at the exogenous feeding phase without exogenous nutrition (EXOD, 8 dpf) via qPCR. The results showed that eight genes involved in antigen processing and presentation were significantly down-regulated in the EXOD group. The psme1, hsp90aa1.1, mhc1zba, lgmn and mhc2dab fell to ENDO group expression level, and the tap1, ctssb, cd74a fell to MIX group level (Figure 12). The results suggested that the activation of the MHC pathways were highly dependent on the supply of exogenous nutrients at the mouth-opening stage.

3. Discussion

Fish larvae are vulnerable and present high mortality during the mouth-opening stage because of their physiological characteristics. Limited data are available on the basic biology of this phase, which has severely hampered the development of the aquaculture industry. To date, several studies have performed transcriptomic analyses and reported the physiological, biochemical and behavioral processes associated with larval development in oviparous fish species, such as Sparus aurata [22], Gadus morhua L. [23], Gymnocypris przewalskii [24], Paralichthys olivaceus [25], and Dicentrarchus labrax [26]. However, few studies have performed transcriptome analyses of the mouth-opening stage. In the present study, the RNA-seq approach was used to collect data on the transition of physiological processes during the mouth-opening stage and investigate the gene expression patterns in zebrafish larvae. We identified 4965 DEGs in the 26,593 genes expressed in the zebrafish larvae, and they included 2172 genes with up-regulated profiles and 2313 with down-regulated profiles. The DEGs involved in biological processes and pathways, including the arachidonic acid metabolism, linoleic acid metabolism, fat digestion and absorption, and antigen processing and presentation pathways, were activated, whereas DEGs involved in the cell cycle, homologous recombination, and fatty acid metabolism pathways were inhibited. These data provide insights into the molecular mechanisms underlying the larval mouth-opening stage and could be useful for aquaculture development research.

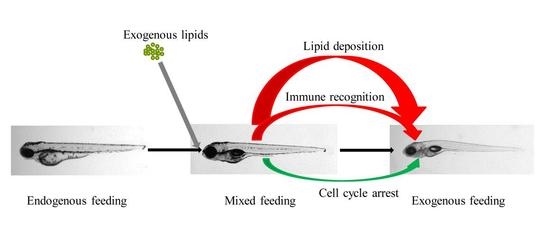
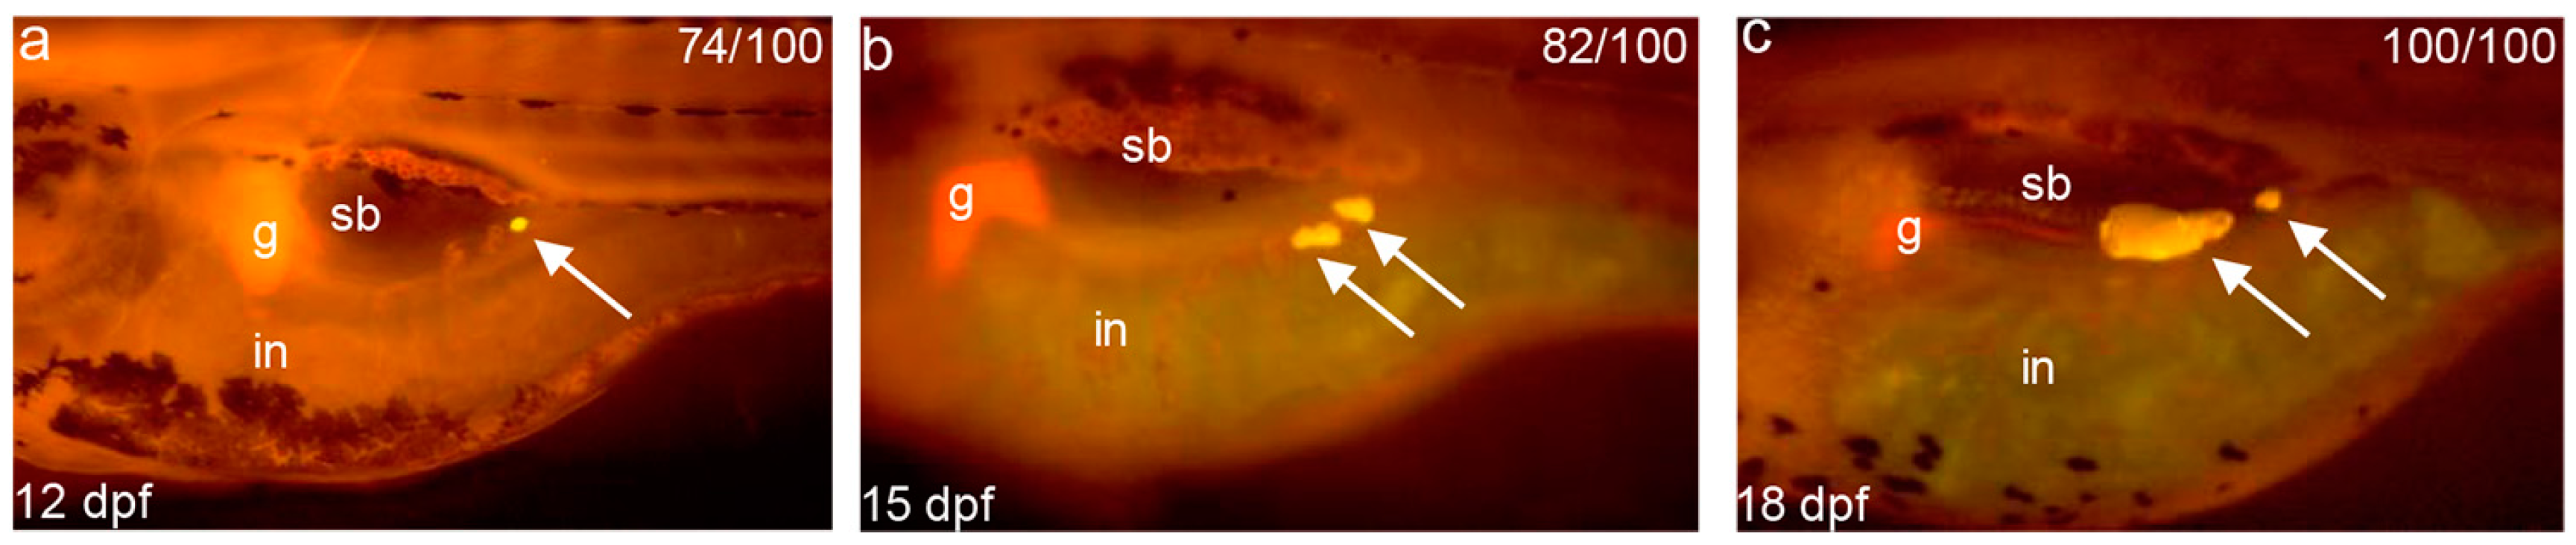
3.1. Exogenous Fatty Acids Are Used for Lipid Deposition Instead of Metabolism during the Mouth-Opening Stage

Exogenous feeding is essential for the survival of fish larvae, especially after yolk-sac resorption [1]. By utilizing yolk-sac reserves, digestive organs, such as the liver, pancreas and intestines, gradually develop to maturation. The specific enzymes involved in energy storage or consumption are activated in the organs involved in the digestive tract [16]. In the present study, RNA-seq analyses revealed that a large number of DEGs of the fat digestion and absorption pathway were enriched during the mouth-opening stage. In the process of fat digestion, DEGs for digestive enzymes that contain various lipases and phospholipases, such as cel.1, cel.2, pla2g12a, pla2g1b and pla2g3, displayed strongly up-regulated profiles. Digestive enzymes primarily hydrolyze dietary fats to release free fatty acids, monoglycerides, lysophosphatidic acids, and cholesterol to the intestine [27]. Similar expression profiles were observed for several DEGs for fatty acid binding protein (FABP)s, such as fabp1b.1 [28], fabp2 [29], and fabp6 [30], which were mainly expressed in the intestine, and fabp10a [31], which is expressed in the liver. This observation is consistent with the previous study [32] that the uptake of exogenous fatty acids requires the mobilization of various FABPs. Moreover, several key genes involved in the re-synthesis of triglycerides (TAG) from the digestion products of dietary fats, including agpat2, mogat2, and dgat1a, displayed significantly up-regulated profiles. Currently, agpat2-/-, mogat-/-, and dgat1-/- mouse models are well established [33,34,35]. Although the deletion of these three genes was not lethal, fat absorption was decreased significantly. Apolipoprotein binds with lipids to form lipoproteins for the transportation of lipids to various tissues [36]. In our study, three of the four ApoA-IV genes, including apoa4a, apoa4b.2, and apoa4b.3, showed that up-regulated profiles. The result is consistent with the results of a previous study showed that ApoA-IV performs a conserved role involved in regulating food intake in mammals and teleost fishes [37]. Together, the up-regulation of these genes revealed a successful transition for the conversion of exogenous to endogenous fat during the mouth-opening stage.
Further, we identified a significant negative correlation in the gene expression profiles of molecular markers between lipid deposition and fatty acid metabolism, including the cd36, and cpt1aa, cpt1ab, and cpt2, respectively. Several studies have revealed that during the process of lipid deposition, cd36 has a rate-limiting function in triglyceride synthesis in muscle and adipocytes [38,39,40]. In our study, a significantly up-regulated expression profile of cd36 was observed during the mouth-opening stage. This molecular signature indicated that the uptake of exogenous fatty acids obviously promoted lipid deposition. The genes cpt1 and cpt2 represent molecular markers and were involved in the oxidation of free fatty acids in mitochondria [41]. However, the significant down-regulation of cpt1aa and cpt1ab and the cpt2 isoform indicated that increases in lipid deposition during the mouth-opening feeding stage were accompanied by decreases in fatty acid metabolism. This phenotype was also observed in the alevin stage of trout [2], suggesting that the physiological switch for lipid deposition at the mouth-opening stage may be a common feature in oviparous fish. This result was further corroborated by Nile Red staining of neutral lipid droplets, which showed increased accumulation in the visceral adipocytes after exogenous feeding. In adult fish, the endogenous reserves of lipids meet the metabolic demands of the fish during fasting [42,43] and supply energy for exercise [44] and cold acclimation [45]; thus, these reserves are essential for the survival of fish throughout their life cycle. Our data verified that lipid deposition in zebrafish larvae commences with the mouth-opening stage.

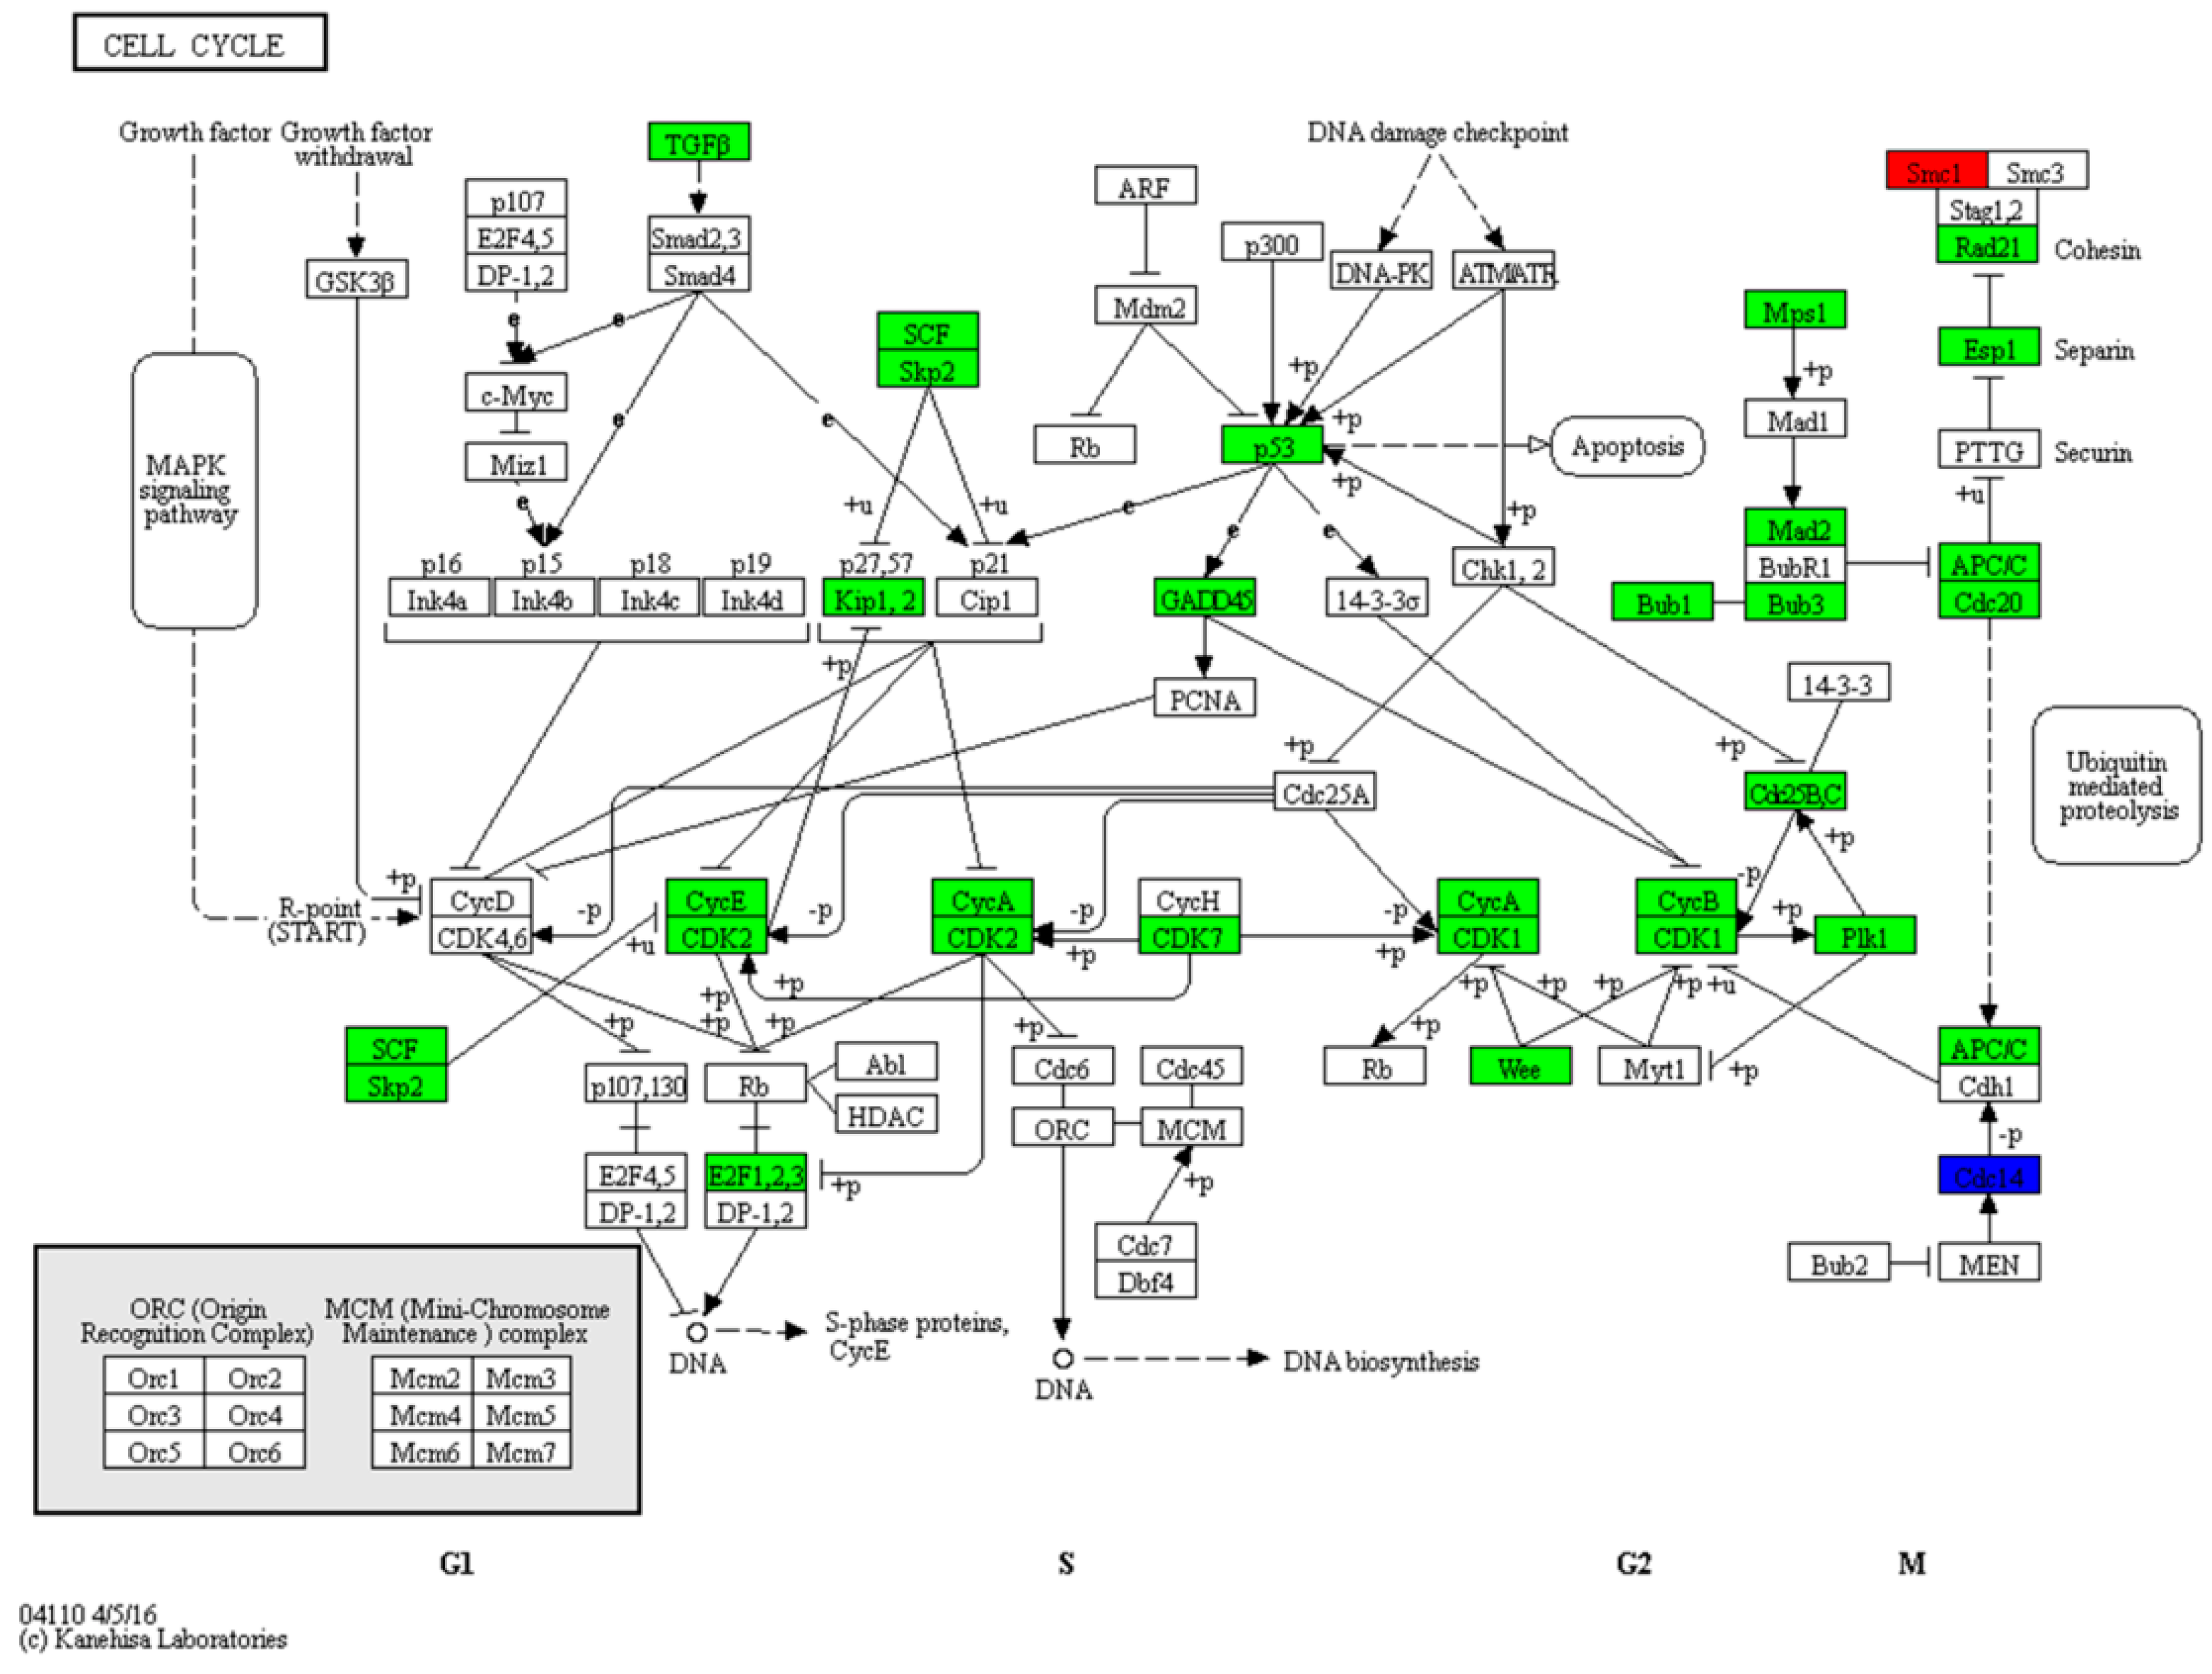
3.2. Zebrafish Larvae Growth Is Retarded by the Cell Cycle Pathway during the Mouth-Opening Stage

The GH/IGF-I system is important for the regulation of growth and development in fish [46]. Previous studies revealed that the key components of the GH/IGF-I axis, which includes GH, GHRH, IGF-I, IGF-1R, and IGFBP, showed different mRNA expression level patterns during the larval stages [15,47], and studies have identified the turning point in expression patterns occurred at the mouth-opening stage. For example, in the common sole, GHRH and GH mRNA expression is significantly up-regulated soon after mouth opening and then decreases until the juvenile stage. Moreover, IGF-I, IGFR1, and IGFBP1 mRNA displays lower expression before mouth opening and is up-regulated after the first meal [15]. These switches in gene expression profiles during the mouth-opening stage indicate where essential adjustments for growth and development occur. In the present study, we observed that gh1 was up-regulated, which is consistent with previous findings in common sole [15]. However, other molecular markers associated with growth hormones did not display significant differences at this stage. We further observed that the mRNA of the igfbp1a and igfbp1b isoforms was up-regulated and the growth rate in body length was decreased during the mouth-opening stage. This observation is consistent with previous studies conducted in zebrafish in which increases in IGFBP1 mRNA expression caused growth and developmental retardation [48].
Furthermore, the RNA-seq analyses revealed that the inhibition of body length growth was mainly associated with the regulation of the cell cycle pathway because a dramatic down-regulation of the genes encoding for associated cell division proteins was observed. Cell division is an energy-consuming process in which the amount of DNA in a cell is doubled in the S phase [49] and protein is synthesized in the G2 phase [50]. Cell cycle arrest may be one of the most efficient methods for reducing energy utilization. In the present study, saturated feeding observed cell cycle arrest, suggested that the reduced growth rate during the mouth-opening stage is a physiological switch and ontogenetic process in zebrafish larvae. This phenomenon supports the hypothesis that most of the energy accumulated in the mouth-opening stage tends to be reserved or used for specific demands, such as immune system development or lipid deposition, instead of rapid growth.

3.3. Activation of the MHC Pathway Depends on the Supply of Exogenous Nutrients during the Mouth-Opening Stage

To date, most studies on the teleost immune system in adult fish have focused on the head, kidney, spleen, and liver [51,52,53,54]. Findings have shown that the MHC class of molecules involved in the antigen processing and presentation plays an important role in these tissues. MHC class I molecules mainly survey the endogenous antigens of the cytosol, where they are degraded into proteasomal products and then transported to CD8+ T cell surfaces, where they stimulate the cells to mature into effectors [55]. However, MHC class II molecules present exogenous antigens to the immune system for the recognition and activation of CD4+ T cells via the endocytic route [56]. Although the role of the MHC pathways in immune recognition and disease resistance has been extensively studied in vertebrates [57,58], information is lacking on the MHC pathways associated with genes expression profile during larval development at the mouth-opening stage. After mouth opening, a variety of microorganisms enter the gastrointestinal tract and microflora colonization begins immediately; therefore, we hypothesized that the larvae would be more susceptible to pathogen infection through the gastrointestinal tract and the coordinated expression of the MHC during the mouth-opening stage may participated in antigen recognition. In the present study, we found that a significant number of DEGs involved in antigen processing and presentation in the MHC class I and II pathways showed significantly up-regulated profiles. This result confirmed our hypothesis that microflora colonization at the mouth-opening stage activates a strong antigen recognition pathway.
Next, we studied the correlation between exogenous nutrition and MHC pathways. The mouth-opening stage is extremely susceptible to hunger stress, and the importance of nutrition is widely recognized in regulating the ontogenesis, development, intensity and type of immune response [59]. To explore whether nutritional supply was required in the activation of the MHC pathways during the mouth-opening stage, we detected the expression levels of eight genes in the MHC pathways by qPCR at the exogenous feeding phase without exogenous nutrition. The result showed eight genes were significantly attenuated in the absence of exogenous nutrition, indicating that exogenous nutrition is an important activator of the MHC pathway. Furthermore, we compared the DEGs involved in the MHC pathways identified in our study with those in the response to long term starvation in the adult large yellow croaker (Larimichthys crocea) [42]. The inconsistent result was observed that the latter not alter the gene expression level associated with MHCs pathway under starvation (Table S6). Studies have revealed that adipose tissue is closely related to immune functions and part of the immune system [60], and fasting led to a significant activation involved in fatty acid metabolism pathway. Changes were not observed in the MHC pathways in response to starvation in adult large yellow croaker, indicating the importance of endogenous lipids in maintaining the immune recognition level. In the present study, the utilization of exogenous fatty acids during the mouth-opening stage showed a tendency for lipid deposition rather than metabolism and may be involved in subsequent immune defense.

4. Materials and Methods

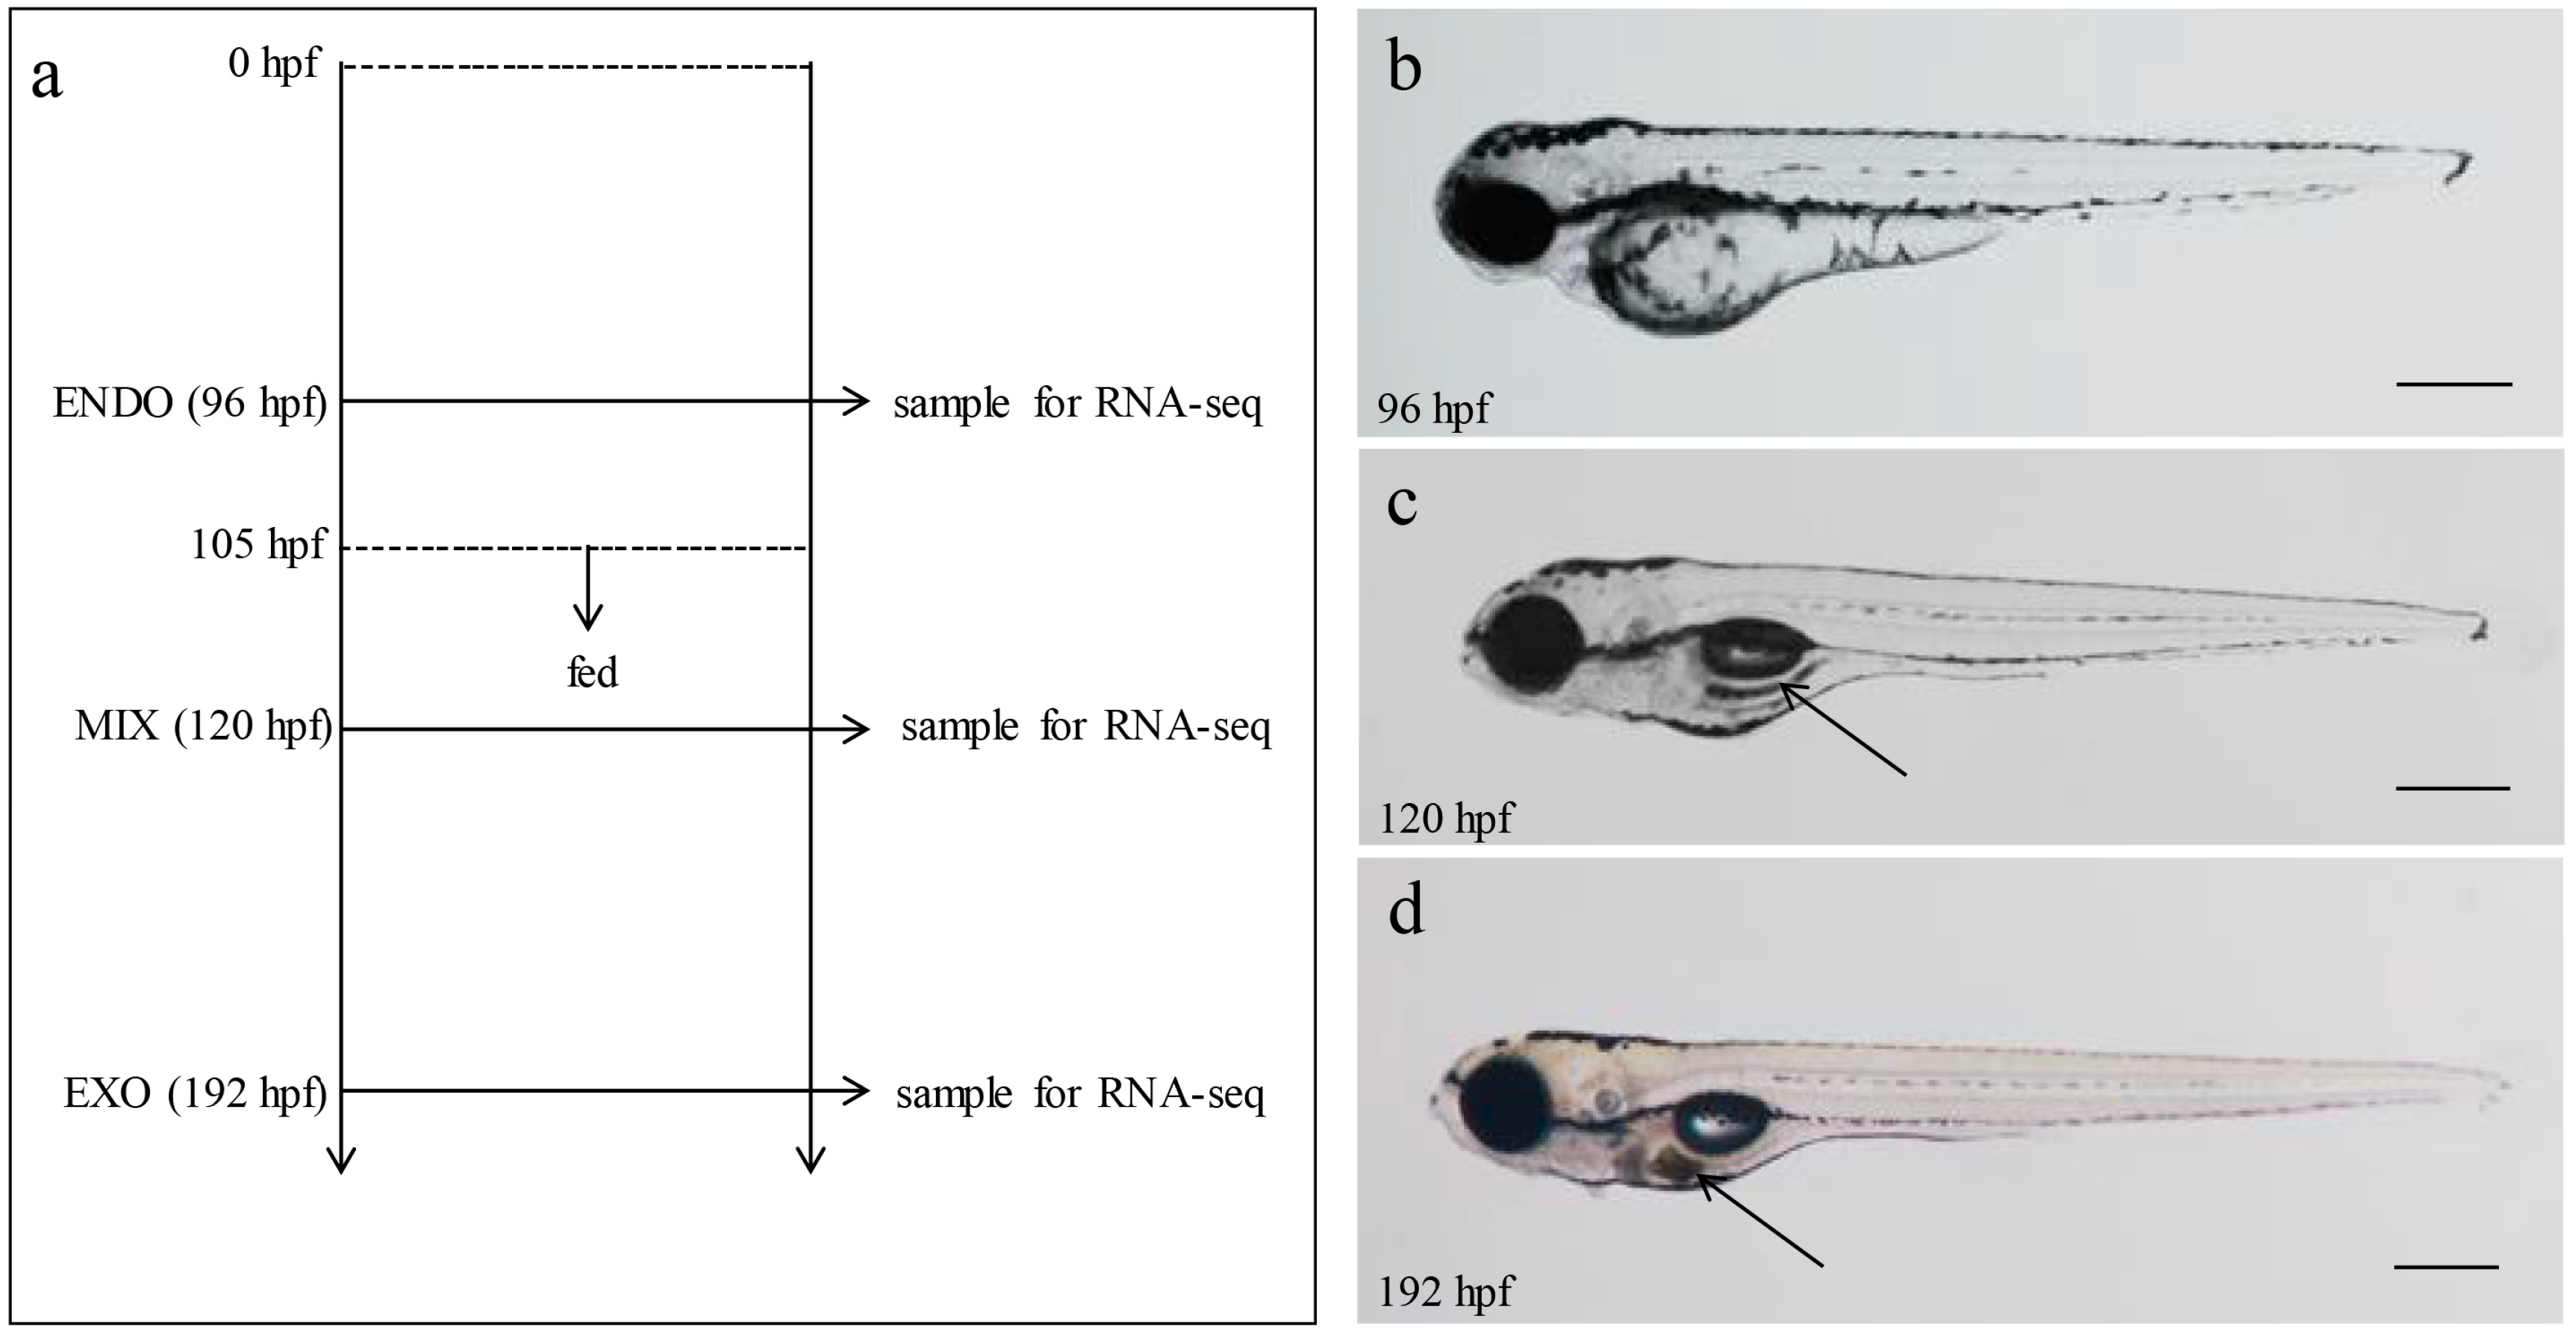
4.1. Larvae Collection and RNA Extraction

The adult fish were reared and the embryos were incubated in accordance with standard protocols [61]. The temperature (28.5 °C) and 14 h light/10 h dark cycle were strictly controlled in the zebrafish circulation aquaculture system. After fertilization, the embryos were immediately collected and incubated in 100 mm diameter culture dishes (60 larvae per dish). At 105 hpf, the larvae were transferred into tanks containing 1 liter of fresh egg water, and the Larval AP100 diet (Haisheng, Shanghai, China) was supplied twice per day. At specific developmental stages, including the endogenous (96 hpf), mix (120 hpf) and exogenous (192 hpf) feeding stages, the larvae were sacrificed using the anesthetic tricaine, and RNA was extracted for the RNA-seq analysis. Meanwhile, the same samples were stored at −80 °C until RNA extraction for the real-time qPCR analysis. Animal experiments were conducted in accordance with the regulations of the Guide for Care and Use of Laboratory Animals, and they were approved by the Committee of Laboratory Animal Experimentation at Southwest University.

4.2. cDNA Library Construction and Illumina Deep Sequencing

Two independent biological replicates of each phase, including 96, 120, and 192 hpf, were used for library construction and RNA-seq, and a single biological replicate are 60 fish larvae. The whole fish larvae were subjected to RNA extraction (Takara, Dalian, Japan) according to the manufacturer’s protocol. For each sample, the quality of total RNA was examined via agarose gel electrophoresis, and the total RNA concentration was measured using a SmartSpecTMPlus spectrophotometer (Bio-Rad, Hercules, CA, USA). The RNA libraries were constructed by Gene Denovo Co. (Guangzhou, China). RNA integrity and quality were measured with an Agilent 2100 Bioanalyzer (Agilent Technologies, Palo Alto, CA, USA), and the RNA integrity number (RIN) index was calculated for each sample. Only RNA with a RIN number > 8.5 were processed further. Total mRNA was used for isolation with oligo (dT) magnetic bead enrichment, and small segments fragmented with fragment buffer were added and reverse transcribed with 6 bp random primers. Double-strand cDNA was synthesized using buffer, dNTPs, DNA polymerase I and RNase H. After purifying the double-strand cDNA fragments using a QiaQuick PCR extraction kit, the cDNA was subjected to end repair, dA-tailing and adapter ligation. Agarose gel electrophoresis was used to collect the processing and PCR amplification products. The amplified fragments were sequenced using an Illumina HiSeq 2000 system. The sequencing data were deposited in the NCBI Sequence Read Archive under the accession number SRR4045953.

4.3. Bioinformatic Analysis of RNA-Seq Data

To acquire clean reads, the raw reads were filtered by removing the adapter-containing reads and reads with more than 10% unknown nucleotides and low-quality reads (Q < 20). To avoid interference of ribosomal RNA, we mapped the clean reads to the ribosome database using bowtie [62], and the matched reads were removed from the ribosome database. The remaining reads were mapped to the genome sequence of zebrafish (GRCz10) using TopHat [63]. The aligned reads were assembled into transcripts using cufflinks, and the assembled transcripts were merged using cuffmerge. The abundance of gene transcripts was calculated via FPKM (Fragments per kilobase of transcript per million mapped reads) [64,65], and genes with a mean abundance >0 FPKM in any one of these samples were regarded as being expressed.
The raw read counts were used to differential expression analysis using egdeR [66]. Genes with fold change of |log2FC| > 1, p < 0.05 and FDR < 0.05 were considered differentially expressed. In this study, the DEGs between the ENDO and MIX, ENDO and EXO, and MIX and EXO groups were analyzed. Moreover, an expression trend analysis was performed with ENDO as the control group and MIX or EXO as the treatments, and the gene expression levels were normalized to 0, log2 (υMIX/υENDO), and log2 (υEXO/υENDO). DEGs were clustered using STEM [67], which is used to cluster and compare short time series gene expression data with its visualization capabilities and study dynamical biological processes. The clustered profiles at p < 0.05 were regarded as significant DEGs.
After obtaining the DEGs, a gene ontology (GO) classification of the DEGs was performed using WEGO [68], and the terms included molecular function, cellular component and biological process. The KEGG pathway was annotated by the KEGG Automatic Annotation Server (KAAS). The hypergeometric test was used to identify overrepresented GO and KEGG pathway terms with a significance level (p < 0.05) and Beniamini and Hochberg method was used for the correction of the p-values.

4.4. Zebrafish Larvae Adipocytes Staining and Measure of Body Length

Adipocytes were stained and measured in whole zebrafish using the Nile Red method [69]. Zebrafish larvae were placed in dishes (40 larvae per dish) and stained with Nile Red (final working concentration 1.0 μg/mL) for 15 min at 28 °C in the dark. After anesthetizing using Tricaine (Sigma-Aldrich, St. Louis, MO, USA), the zebrafish larvae were mounted on a microslide and imaged using a Leica DM6000B fluorescence stereomicroscope (Leica, Wetzlar, Germany). The body length (distance between the tip of the snout and the end of the caudal vertebra) was measured, and the values were presented as the mean ± standard deviation (n = 20).

4.5. qPCR Analysis

A qPCR analysis was performed using the CFX96 Real-Time PCR Detection System (Bio-Rad, Hercules, CA, USA) with SYBR Green (Promega, Madison, WI, USA) as the fluorescent detection dye according to the manufacturer’s protocol. Using oligo(dT) as a primer, first-strand cDNA for each sample was synthesized from approximately 2 μg of total RNA and applied as a template for the qPCR assay with gene-specific primers. The Primer Premier 5.0 software was used to design the specific primers. The RNA-seq analysis showed that actb2 was not differentially expressed among the samples and showed high expression levels; therefore, it was used as an internal reference for the normalization of gene expression. The amplification was conducted in a volume of 20 μL containing 10 μL of SYBR Green PCR Master Mix. The qPCR amplification protocol was as follows: 95 °C for 3 min, followed by 40 cycles of 95 °C for 15 s, 60 °C for 20 s, and 72 °C for 20 s. The melting curve for PCR products was generated by heating from 65 to 95 °C in 0.5 °C increments and a 5 s dwell time, and a plate read was performed at each temperature. The specificity of the PCR fragments was detected by analyzing the melting curve and agarose gel electrophoresis results. Three biological replicates for each sample were performed. The expression levels of the genes were determined by the 2−ΔΔCt method [70].

5. Conclusions

The present study revealed the gene expression profiles underlying the transition from endogenous to exogenous feeding in zebrafish larvae. Changes in several pathways and molecular markers revealed a physiological process that promotes energy storage during the mouth-opening stage via increased lipid storage, decreased fatty acid metabolism, and arrested cell division. Moreover, the MHC-I and MHC-II processing pathways were significantly enhanced in these stages and the activation of these MHC pathways requires a supply of exogenous nutrients. These findings will facilitate further investigations of the molecular mechanisms underlying the physiological changes that occur during the transition from endogenous to exogenous feeding and should be beneficial for the aquaculture industry.

Supplementary Materials

Supplementary materials can be found at www.mdpi.com/1422-0067/18/8/1634/s1.

Acknowledgments

We are grateful for the support by the Project of Ecological Fishery Industry Technological System from Chongqing Municipal Agriculture Commission (Grant to Yun Li) and Genetic Resources Conservation Grant (Fisheries) from Ministry of Agriculture of the P.R. China (No. 171721301354052181 to Yun Li). Hao Xu was supported by the Postgraduate Scientific Research Innovation Project from Chongqing Municipal Education Commission (Grant No. CYB2015069). The funders had no role in the study design, data collection and analysis, decision to publish, or preparation of the manuscript.

Author Contributions

Yun Li and Hao Xu conceived the work. Hao Xu, Enxiu Liu, Xiaojie Li and Chenyu Ding conducted experiments. Hao Xu carried out transcriptome data analysis. Hao Xu and Yun Li wrote the manuscript. All authors read and approved this manuscript.

Conflicts of Interest

The authors declare no conflict of interest.

Abbreviations

αAlpha
βBeta
DEGsDifferentially expressed genes
dpfDays post fertilization
ENDOEndogenous feeding
EXOExogenous feeding
FABPFatty acid binding protein
FDRFalse discovery rate
FPKMFragments per kilobase of transcript per million mapped reads
GOGene ontology
hpfHours post fertilization
IDIdentification
KEGGKyoto encyclopedia of genes and genomes
MHCMajor histocompatibility complex
MIXMixed feeding
PCAPrincipal component analysis
PCsPrincipal components
qPCRQuantitative real-time polymerase chain reaction
RINRNA integrity number
SRASequence read archive
STEMShort time-series expression miner software
TAGTriglycerides
WEGOWeb gene ontology annotation plot

References

  1. Mazurais, D.; Darias, M.; Zambonino-infantej, J.L.; Cahuc, C.L. Transcriptomics for understanding marine fish larval development. Can. J. Zool. 2011, 89, 599–611. [Google Scholar] [CrossRef]
  2. Mennigen, J.A.; Skiba-Cassy, S.; Panserat, S. Ontogenetic expression of metabolic genes and microRNAs in rainbow trout alevins during the transition from the endogenous to the exogenous feeding period. J. Exp. Biol. 2013, 216, 1597–1608. [Google Scholar] [CrossRef] [PubMed]
  3. Ahlstrom, E.H.; Amaoka, K.; Hensley, D.A.; Moser, H.G.; Sumida, B.Y. Pleuronectiformes: Development, ontogeny and systematics of fishes. Am. Soc. Ichthyol. Herpetol. Ser. 1984, 1, 640–670. [Google Scholar]
  4. Andrew, G.J.; Rawlinson, K.A.; Justin, B.; Warrick, S.L.; Clare, V.H.; Baker, C.V.; Shubin, N.H. Holocephalan embryos provide evidence for gill arch appendage reduction and opercular evolution in cartilaginous fishes. Proc. Natl. Acad. Sci. USA 2011, 108, 1507–1512. [Google Scholar]
  5. Rosenberger, L.J. Pectoral fin locomotion in batoid fishes: Undulation versus oscillation. J. Exp. Biol. 2001, 204, 379–394. [Google Scholar] [PubMed]
  6. Mascarello, F.; Rowlerson, A.; Veggetti, A. Hyperplasia of lateral muscle during normal growth of the sea-bream, Sparus aurata. J. Muscle Res. Cell Motil. 1994, 15, 189. [Google Scholar]
  7. Barak, Y.; Nelson, M.C.; Ong, E.S.; Jones, Y.Z.; Ruiz-Lozano, P.; Chien, K.R.; Koder, A.; Evans, R.M. PPARγ is required for placental, cardiac, and adipose tissue development. Mol. Cell 1999, 4, 585–595. [Google Scholar] [CrossRef]
  8. Sarropoulou, E.; Kotoulas, G.; Power, D.M.; Geisler, R. Gene expression profiling of gilthead sea bream during early development and detection of stress-related genes by application of cDNA microarray technology. Physiol. Genom. 2005, 23, 182–191. [Google Scholar] [CrossRef] [PubMed]
  9. Rawls, J.F.; Samuel, B.S.; Gordon, J.I. Gnotobiotic zebrafish reveal evolutionarily conserved responses to the gut microbiota. Proc. Natl. Acad. Sci. USA 2004, 101, 4596–4601. [Google Scholar] [CrossRef] [PubMed]
  10. Suau, A.; Bonnet, R.; Sutren, M.; Godon, J.J.; Gibson, G.R.; Collins, M.D.; Dore, J. Direct analysis of genes encoding 16S rRNA from complex communities reveals many novel molecular species within the human gut. Appl. Environ. Microbiol. 1999, 65, 4799–4807. [Google Scholar] [PubMed]
  11. Stappenbeck, T.S.; Hooper, L.V.; Gordon, J.I. Developmental regulation of intestinal angiogenesis by indigenous microbes via Paneth cells. Proc. Natl. Acad. Sci. USA 2002, 99, 15451–15455. [Google Scholar] [CrossRef] [PubMed]
  12. Bry, L.; Falk, P.G.; Midtvedt, T.; Gordon, J.I. A model of host-microbial interactions in an open mammalian ecosystem. Science 1996, 273, 1380–1383. [Google Scholar] [CrossRef] [PubMed]
  13. Kelly, D.; Campbell, J.I.; King, T.P.; Grant, G.; Jansson, E.A.; Coutts, A.G.; Pettersson, S.; Conway, S. Commensal anaerobic gut bacteria attenuate inflammation by regulating nuclear-cytoplasmic shuttling of PPAR-γ and RelA. Nat. Immunol. 2004, 5, 104–112. [Google Scholar] [CrossRef] [PubMed]
  14. Hooper, L.V.; Midtvedt, T.; Gordon, J.I. How host-microbial interactions shape the nutrient environment of the mammalian intestine. Annu. Rev. Nutr. 2002, 22, 283–307. [Google Scholar] [CrossRef] [PubMed]
  15. Ferraresso, S.; Bonaldo, A.; Parma, L.; Cinotti, S.; Massi, P.; Bargelloni, L.; Gatta, P.P. Exploring the larval transcriptome of the common sole (Soleasolea L.). BMC Genom. 2013, 14, 315. [Google Scholar] [CrossRef] [PubMed]
  16. Zambonino-Infante, J.L.; Cahu, C.L. Dietary modulation of some digestive enzymes and metabolic processes in developing marine fish: Applications to diet formulation. Aquaculture 2007, 268, 98–105. [Google Scholar] [CrossRef]
  17. Alestrom, P.; Holter, J.L.; Nourizadeh-Lillabadi, R. Zebrafish in functional genomics and aquatic biomedicine. Trends Biotechnol. 2006, 24, 15–21. [Google Scholar] [CrossRef] [PubMed]
  18. Detrich, H.W.; Westerfield, M.; Zon, L.I. Overview of the Zebrafish system. Methods Cell Biol. 1999, 59, 3–10. [Google Scholar] [PubMed]
  19. Li, Y.; Xiang, J.H.; Duan, C. Insulin-like growth factor-binding protein-3 plays an important role in regulating pharyngeal skeleton and inner ear formation and differentiation. J. Biol. Chem. 2005, 280, 3613–3620. [Google Scholar] [CrossRef] [PubMed]
  20. Paw, B.H.; Zon, L.I. Zebrafish: A genetic approach in studying hematopoiesis. Curr. Opin. Hematol. 2000, 7, 79–84. [Google Scholar] [CrossRef] [PubMed]
  21. Van den Belt, K.; Verheyen, R.; Witters, H. Comparison of vitellogenin responses in zebrafish and rainbow trout following exposure to environmental estrogens. Ecotoxicol. Environ. Saf. 2003, 56, 271–281. [Google Scholar] [CrossRef]
  22. Ferraresso, S.; Vitulo, N.; Mininni, A.N.; Romualdi, C.; Cardazzo, B.; Negrisolo, E.; Reinhardt, R.; Canario, A.V.; Patarnello, T.; Bargelloni, L. Development and validation of a gene expression oligo microarray for the gilthead sea bream (Sparus aurata). BMC Genom. 2008, 9, 580. [Google Scholar] [CrossRef] [PubMed]
  23. Lanes, C.F.; Bizuayehu, T.T.; de Oliveria Fernandes, J.M.; Kiron, V.; Babiak, I. Transcriptome of Altantic cod (Gadus morhua L.) early embryos from farmed and wild broodstocks. Mar. Biotechnol. 2013, 15, 677–694. [Google Scholar] [CrossRef] [PubMed] [Green Version]
  24. Tong, C.; Zhang, C.F.; Zhang, R.Y.; Zhao, K. Transcriptome profiling analysis of naked carp (Gymnocypris przewalskii) provides insights into the immune-related genes in highland fish. Fish Shellfish Immunol. 2015, 46, 366–377. [Google Scholar] [CrossRef] [PubMed]
  25. Fan, Z.F.; Wu, Z.H.; Wang, L.J.; Zou, Y.X.; Zhang, P.J.; You, F. Characterization of embryo transcriptome of gynogenetic olive flounder Paralichthys olivaceus. Mar. Biotechnol. 2016, 18, 545–553. [Google Scholar] [CrossRef] [PubMed]
  26. Zarski, D.; Nguyen, T.; Le Cam, A.; Montfort, J.; Dutto, G.; Vidal, M.O.; Fauvel, C.; Bobe, J. Transcriptomic profiling of egg quality in sea bass (Dicentrarchus labrax) sheds light on genes involved in ubiquitination and translation. Mar. Biotechnol. 2017, 19, 102–115. [Google Scholar] [CrossRef] [PubMed]
  27. Reetz, M.T. Lipases as practical biocatalysts. Curr. Opin. Chem. Biol. 2002, 16, 145–150. [Google Scholar] [CrossRef]
  28. Karanth, S.; Denovan-Wright, E.M.; Thisse, C.; Thisse, B.; Wright, J.M. Tandem duplication of the fabp1b gene and subsequent divergence of the tissue-specific. Genome 2009, 52, 985–992. [Google Scholar] [PubMed]
  29. Mayer, A.N.; Fishman, M.C. nil per os encodes a conserved RNA recognition motif protein required for morphogenesis and cytodifferentiation of digestive organs in zebrafish. Development 2003, 130, 3917–3928. [Google Scholar] [CrossRef] [PubMed]
  30. Oehlers, S.H.; Flores, M.V.; Okuda, K.S.; Hall, C.J.; Crosier, K.E.; Crosier, P.S. A chemical enterocolitis model in zebrafish larvae that is dependent on microbiota and responsive to pharmacological agents. Dev. Dyn. 2011, 240, 288–298. [Google Scholar] [CrossRef] [PubMed]
  31. Denovan-Wright, E.M.; Pierce, M.; Sharma, M.K.; Wright, J.M. cDNA sequence and tissue-specific expression of a basic liver-type fatty acid binding protein in adult zebrafish (Danio rerio). Biochim. Biophys. Acta 2000, 1492, 227–232. [Google Scholar] [CrossRef]
  32. Bernlohr, D.A.; Coe, N.R.; Licata, V.J. Fatty acid trafficking in the adipocyte. Semin. Cell Dev. Biol. 1999, 10, 43–49. [Google Scholar] [CrossRef] [PubMed]
  33. Fernandez-Galilea, M.; Tapia, P.; Cautivo, K.; Morselli, E.; Cortes, V.A. AGPAT2 deficiency impairs adipogenic differentiation in primary cultured preadipocytes in a non-autophagy or apoptosis dependent mechanism. Biochem. Biophys. Res. Commun. 2015, 467, 39–45. [Google Scholar] [CrossRef] [PubMed]
  34. Nelson, D.W.; Gao, Y.; Yen, M.I.; Yen, C.L. Intestine-specific deletion of acyl-CoA: Monoacylglycerol acyltransferase (MGAT) 2 protects mice from diet-induced obesity and glucose intolerance. J. Biol. Chem. 2014, 289, 17338–17349. [Google Scholar] [CrossRef] [PubMed]
  35. Smith, S.J.; Cases, S.; Jensen, D.R.; Chen, H.C.; Sande, E.; Tow, B.; Sanan, D.A.; Raber, J.; Eckel, R.H.; Farese, R.V. Obesity resistance and multiple mechanisms of triglyceride synthesis in mice lacking Dgat. Nat. Genet. 2000, 25, 87–90. [Google Scholar] [CrossRef] [PubMed]
  36. Havel, R.J. Lipoproteins and lipid transport. In Advances in Experimental Medicine and Biology; Springer: Berlin, Germany, 1975; Volume 63, pp. 37–59. [Google Scholar]
  37. Otis, J.P.; Zeituni, E.M.; Thierer, J.H.; Anderson, J.L.; Brown, A.C.; Boehm, E.D.; Cerchione, D.M.; Ceasrine, A.M.; Avraham-Davidi, I.; Temeplhof, H.; et al. Zebrafish as a model for apolipoprotein biology: Comprehensive expression analysis and a role for ApoA-IV in regulating food intake. Dis. Mod. Mech. 2015, 8, 295–309. [Google Scholar] [CrossRef] [PubMed]
  38. Christiaens, V.; van Hul, M.; Lijnen, H.R.; Scroyen, I. CD36 promotes adipocyte differentiation and adipogenesis. Biochim. Biophys. Acta 2012, 1820, 949–956. [Google Scholar] [CrossRef] [PubMed]
  39. Coburn, C.T.; Hajri, T.; Ibrahimi, A.; Abumrad, N.A. Role of CD36 in membrane transport and utilization of long-chain fatty acids by different tissues. J. Mol. Neurosci. 2001, 16, 117–121. [Google Scholar] [CrossRef]
  40. Kennedy, D.J.; Kuchibhotla, S.; Westfall, K.M.; Silverstein, R.L.; Morton, R.E.; Febbraio, M. A CD36-dependent pathway enhances macrophage and adipose tissue inflammation and impairs insulin signaling. Cardiovasc. Res. 2011, 89, 604–613. [Google Scholar] [CrossRef] [PubMed]
  41. Mcgarry, J.D.; Brown, N.F. The mitochondrial carnitine palmitoyltransferase system. From concept to molecular analysis. Eur. J. Biochem. 1997, 244, 1–14. [Google Scholar] [CrossRef] [PubMed]
  42. Qian, B.; Xue, L.; Huang, H. Liver transcriptome analysis of the Large yellow croaker (Larimichthys crocea) during fasting by using RNA-seq. PLoS ONE 2016, 11. [Google Scholar] [CrossRef] [PubMed]
  43. Martin, S.A.; Douglas, A.; Houlihan, D.F.; Secombes, C.J. Starvation alters the liver transcriptome of the innate response in Atlantic salmon (Salmo salar). BMC Genom. 2010, 11, 418–838. [Google Scholar] [CrossRef] [PubMed] [Green Version]
  44. Richards, J.G.; Heigenhauser, G.J.; Wood, C.M. Lipid oxidation fuels recovery from exhaustive exercise in white muscle of rainbow trout. Am. J. Physiol. Regul. Integr. Comp. Physiol. 2002, 282, 89–99. [Google Scholar] [CrossRef] [PubMed]
  45. Egginton, S.; Cordiner, S.; Skibeck, C. Thermal compensation of peripheral oxygen transport in skeletal muscle of seasonally acclimatized trout. Am. J. Physiol. Regul. Integr. Comp. Physiol. 2000, 279, 375–388. [Google Scholar]
  46. Butler, A.A.; Le Roith, D. Control of growth by the somatotrophic axis: Growth hormone and the insulin-like growth factors have related and independent roles. Ann. Rev. Physiol. 2001, 63, 141–164. [Google Scholar] [CrossRef] [PubMed]
  47. Hildahl, J.; Power, D.M.; Bjornsson, B.T.; Einarsdottir, I.E. Involvement of growth hormone-insulin-like growth factor I system in cranial remodeling during halibut metamorphosis as indicated by tissue- and stage-specific receptor gene expression and the presence of growth hormone receptor protein. Cell Tissue Res. 2008, 322, 211–225. [Google Scholar] [CrossRef] [PubMed]
  48. Kamei, H.; Lu, L.; Jiao, S.; Li, Y.; Gyrup, C.; Laursen, L.S.; Oxvig, C.; Zhou, J.; Duan, C. Duplication and diversification of the hypoxia-inducible IGFBP-1 gene in zebrafish. PLoS ONE 2008, 3, e3091. [Google Scholar] [CrossRef] [PubMed]
  49. Recondo, A. DNA replication in eukaryotic cells. Biochemistry 2002, 71, 333–374. [Google Scholar]
  50. Gullov, K.; Friis, J.; Bonven, B. Rate of protein synthesis through the cell cycle of Saccharomyces cerevisiae. Exp. Cell Res. 1981, 136, 295–304. [Google Scholar] [CrossRef]
  51. Trede, N.S.; Langenau, D.M.; Traver, D.; Look, A.T.; Zon, L.I. The use of zebrafish to understand immunity. Immunity 2004, 20, 367–379. [Google Scholar] [CrossRef]
  52. Forn-Cuni, G.; Varela, M.; Fernandez-Rodriguez, C.M.; Figueras, A.; Novoa, B. Liver immune responses to inflammatory stimuli in a diet-induced obesity model of zebrafish. J. Endocrinol. 2015, 224, 159–170. [Google Scholar] [CrossRef] [PubMed]
  53. He, J.G.; Deng, M.; Weng, S.P.; Li, Z.; Zhou, S.Y.; Long, Q.X.; Wang, X.Z.; Chan, S.M. Complete genome analysis of the mandarin fish infectious spleen and kidney necrosis iridovirus. Virology 2001, 291, 126–139. [Google Scholar] [CrossRef] [PubMed]
  54. Xu, X.; Zhang, L.; Weng, S.; Huang, Z.; Lu, J.; Lan, D.; Zhong, X.; Yu, X.; Xu, A.; He, J. A zebrafish (Danio rerio) model of infectious spleen and kidney necrosis virus (ISKNV) infection. Virology 2008, 376, 1–12. [Google Scholar] [CrossRef] [PubMed]
  55. Rock, K.L.; Farfan-Arribas, D.J.; Shen, J. Proteases in MHC class I presentation and cross-presentation. J. Immunol. 2010, 184, 9–15. [Google Scholar] [CrossRef] [PubMed]
  56. Hoorn, T.; Paul, P.; Jongsma, M.L.; Neefjes, J. Routes to manipulate MHC class II antigen presentation. Curr. Opin. Immunol. 2011, 23, 88–95. [Google Scholar] [CrossRef] [PubMed]
  57. Warren, A.; le Couteur, D.G.; Fraser, R.; Bowen, D.G.; McCaughan, G.W.; Bertolino, P. T lymphocytes interact with hepatocytes through fenestrations in murine liver sinusoidal endothelial cells. Hepatology 2006, 44, 1182–1190. [Google Scholar] [CrossRef] [PubMed]
  58. Crotzer, V.L.; Blum, J.S. Autophagy and its role in MHC-mediated antigen presentation. J. Immunol. 2009, 182, 3335–3341. [Google Scholar] [CrossRef] [PubMed]
  59. Kubena, K.S.; McMurray, D.N. Nutrition and the immune system: A review of nutrient-nutrient interactions. J. Am. Diet. Assoc. 1996, 96, 1156–1164. [Google Scholar] [CrossRef]
  60. Wensveen, F.M.; Vaalentic, S.; Marko, S.; Wensveen, T.T.; Polic, B. Interactions between adipose tissue and the immune system in health and malnutrition. Semin. Immunol. 2015, 27, 322–333. [Google Scholar] [CrossRef] [PubMed]
  61. Westerfield, M. The Zebrafish Book: A Guide for the Laboratory Use of Zebrafish (Danio rerio); University of Oregon Press: Eugene, OR, USA, 1995. [Google Scholar]
  62. Langmead, B.; Salzberg, S.L. Fast gapped-read alignment with Bowtie 2. Nat. Methods 2012, 9, 357–359. [Google Scholar] [CrossRef] [PubMed]
  63. Kim, D.; Pertea, G.; Trapnell, C.; Pimentel, H.; Kelley, R.; Salzberg, S.L. TopHat2: Accurate alignment of transcriptomes in the presence of insertions, deletions and gene fusions. Genom. Biol. 2013, 14, R36. [Google Scholar] [CrossRef] [PubMed] [Green Version]
  64. Wang, Z.; Fang, B.; Chen, J.; Zhang, X.; Luo, Z.; Huang, L.; Chen, X.; Li, Y. De novo assembly and characterization of root transcriptome using Illumina paired-end sequencing and development of cSSR markers in sweet potato (Ipomoea batatas). BMC Genom. 2010, 11, 726. [Google Scholar] [CrossRef] [PubMed]
  65. Long, Y.; Song, G.; Yan, J.; He, X.; Li, Q.; Cui, Z. Transcriptomic characterization of cold acclimation in larval zebrafish. BMC Genom. 2013, 14, 612. [Google Scholar] [CrossRef] [PubMed]
  66. Robinson, M.D.; McCarthy, D.J.; Smyth, G.K. edgeR: A Bioconductor package for differential expression analysis of digital gene expression data. Bioinformatics 2010, 26, 139–140. [Google Scholar] [CrossRef] [PubMed]
  67. Ernst, J.; Bar-Joseph, Z. STEM: A tool for the analysis of short time series gene expression data. BMC Bioinformatics 2006, 7, 191. [Google Scholar] [CrossRef] [PubMed]
  68. Ye, J.; Fang, L.; Zheng, H.; Zhang, Y.; Chen, J.; Zhang, Z.; Wang, J.; Li, S.; Li, R.; Bolund, L.; et al. WEGO: A web tool for plotting GO annotations. Nucleic Acids Res. 2006, 34, 293–297. [Google Scholar] [CrossRef] [PubMed]
  69. Greenspan, P.; Fowler, S.D. Spectrofluorometric studies of the lipid probe, nile red. J. Lipid Res. 1985, 26, 781–789. [Google Scholar] [PubMed]
  70. Livak, K.J.; Schmittgen, T.D. Analysis of relative gene expression data using real-time quantitative PCR and the 2-ΔΔCt method. Methods 2001, 25, 402–408. [Google Scholar] [CrossRef] [PubMed]
Figure 1. Samples were taken during transition from endogenous to exogenous feeding in zebrafish. (a) Flowchart of sampling. Zebrafish embryos were incubated at 28.5 °C from fertilization to 96 hpf, 120 hpf, and 192 hpf, respectively, and samples were taken for RNA-seq or qPCR. The time scales are shown on the left; (b) ENDO (96 hpf), the larvae start feeble swimming after hatching, yolk as the exclusive utilization of development; (c) MIX (120 hpf), the concurrent utilization of yolk reserves and exogenous feeds and (d) EXO (192 hpf), which is characterized by use of exclusively exogenous nutrition after the yolk was consumed completion. The black arrow annotated exogenous foods in intestinal tract. Bars = 400 μm in (bd).
Ijms 18 01634 g001
Figure 2. Bioinformatic analysis of RNA-seq data: (a) Venn diagram showing the developmental distribution of the genes detected; (b) principle component analysis (PCA) of gene expression in ENDO, MIX and EXO groups and (c) the number of differential expression genes between ENDO and MIX, ENDO and EXO, and MIX and EXO group.
Ijms 18 01634 g002
Figure 3. DEGs expression profiles from ENDO, MIX, and EXO: Profile 0 (a); Profile 1 (b); and Profile 3 (c) indicating down-regulated patterns; and Profile 4 (d); Profile 6 (e); and Profile 7 (f) indicating up-regulated patterns.
Ijms 18 01634 g003
Figure 4. GO classification of DEGs. Biological process, cellular component and molecular function were analyzed.
Ijms 18 01634 g004
Figure 5. The differentially expressed genes involved in the fat digestion and absorption were annotated by KEGG. Red indicates up-regulated genes. The DEGs included cel.1, cel.2, pla2g12a, pla2g1b, pla2g3, fabp2, fabp6, fabp1b.1, fabp10a, cd36, agpat2, mogat2, dgat1a, apoa4a, apoa4b.2, and apoa4b.3.
Ijms 18 01634 g005
Figure 6. Nile Red staining reveals adipogenesis in zebrafish larval phase. Live zebrafish was stained with Nile Red at: 12 dpf (a); 15 dpf (b) and 18 dpf (c). White arrows annotate adipocyte neutral lipid droplets. The rate of adipogenesis shows on the top right corner. Swim bladder (sb), gall bladder (g), and intestine (in) are indicated. Bars = 400 μm in (ac).
Ijms 18 01634 g006
Figure 7. The drawing of growth trends from 2 days post fertilization (dpf) to 12 dpf. Data from body length are shown as mean ± standard deviation (n = 30).
Ijms 18 01634 g007
Figure 8. The differentially expressed genes associated with the cell cycle were annotated by KEGG. Red indicates up-regulated genes, green indicates down-regulated genes, and blue indicates genes that were both up- and down-regulated. The DEGs included rbx1, skp2, tgfb2, cdkn1ca, ccna2, ccnb3, ccne2, cdk2, e2f2, e2f3, tp53, gadd45ga, cdk7, cdk1, wee1, ccnb1, ccnb2, ttk, mad2l1, bub1, bub3, cdc25b, plk1, smc1a, rad21a, espl1, cdc20, cdc23, anapc10, anapc13, cdc14aa, cdc14b. “+p” indicates phosphorylation, “−p” indicates dephosphorylation, “+u” indicates ubiquitination, and “T-bar” indicates inhibition.
Ijms 18 01634 g008
Figure 9. Significantly differentially expressed genes identified by KEGG as involved in the antigen processing and presentation pathway. Red indicates up-regulated genes, green indicates down-regulated genes, and blue indicates genes that were both up- and down-regulated. The DEGs included psme1, psme2, psme3, hsc70, hsp90aa1.2, tap1, b2m, b2ml, mhc1zea, cd74a, cd74b, lgmn, ctssb, mhc2dab, si:busm1-266f07.2, si:busm1-194e12.12, ctssb.2, zgc: 100906, ctssb.1, and ctsla.
Ijms 18 01634 g009
Figure 10. Gene expression levels were revealed by: qPCR (left) and RNA-seq (right). The proteasome activator (psme1), heat shock protein 90 kDa α (hsp90aa1.1), antigen transporter (tap1), MHC class I ZBA (mhc1zba), legumain (lgmn), cathepsin Bb (ctssb), CD74 molecule (cd74a), and MHC class II DAB (mhc2dab) were validated. Data from qPCR are shown as mean ± standard deviation (n = 3). FPKM from RNA-seq are means of two replicates.
Ijms 18 01634 g010
Figure 11. Correlation analysis of fold change data between qPCR and RNA-seq. Scatterplots were generated by the log2 expression ratios from RNA-seq (x-axis) and qPCR (y-axis). Data from qPCR are means of three replicates, while data from RNA-seq are means of two replicates. The reference line represents the linear relationship between the results of RNA-seq and qPCR.
Ijms 18 01634 g011
Figure 12. qPCR analysis of the genes related to antigen processing and presentation, including ENDO, MIX, EXO and EXOD groups. The proteasome activator (psme1), heat shock protein 90 kDa α (hsp90aa1.1), antigen transporter (tap1), MHC class I ZBA (mhc1zba), legumain (lgmn), cathepsin Bb (ctssb), CD74 molecule (cd74a), and MHC class II DAB (mhc2dab) were detected. Data from qPCR are shown as mean ± standard deviation (n = 3). Significant differences are marked by different letters (p < 0.05).
Ijms 18 01634 g012
Table 1. Statistics for the filtering and mapping of reads.
LibrariesENDO-1ENDO-2MIX-1MIX-2EXO-1EXO-2
Raw reads (M)21.1924.0522.3724.0326.0625.28
Clean reads (M)20.7423.5421.8423.4725.5024.71
Percent clean reads97.8897.8997.6297.6997.8597.73
Processed reads20.3723.0521.1622.7424.9123.97
Mapped reads (M)17.3319.1416.9718.4320.8019.45
Percent mapped85.0783.0680.2081.0583.5081.12
Unique mapping (M)16.9618.8116.6718.0920.4119.12
Percent uniquely mapped reads a97.8698.2898.2398.1698.1398.30
a The percent uniquely mapped reads indicates the ratio of unique mapping to the mapped reads.
Table 2. Top 10 KEGG pathways with high representation of the DEGs.
PathwaysNo. of DEGs with Pathway AnnotationPathway Identification (ID)
All ProfilesProfile 0Profile 1Profile 3Profile 4Profile 6Profile 7
Antigen processing and presentation23201458ko04612
Arachidonic acid metabolism191212103ko00590
Metabolic pathways246592637173851ko01100
Cell cycle329219011ko04110
Linoleic acid metabolism10001342ko00591
Homologous recombination13408000ko03440
Fat digestion and absorption16000268ko04975
Arginine and proline metabolism24413355ko00330
Glutathione metabolism18316033ko00480
α-Linolenic acid metabolism8000125ko00592

