Article

QTL Mapping of Fiber Quality and Yield-Related Traits in an Intra-Specific Upland Cotton Using Genotype by Sequencing (GBS)

1
State Key Laboratory of Cotton Biology, Institute of Cotton Research, Chinese Academy of Agricultural Sciences, Anyang 455000, China
2
Senegalese River Valley Development Agency (SAED), Saint-Louis Bp74, Senegal
3
School of Physical and Biological Sciences (SPBS), Jaramogi Oginga Odinga University of Science and Technology (JOOUST), Main Campus, P.O. Box 210-40601, Bondo, Kenya
*
Author to whom correspondence should be addressed.
These authors contributed equally to this work.
Int. J. Mol. Sci. 2018, 19(2), 441; https://doi.org/10.3390/ijms19020441
Submission received: 20 December 2017 / Revised: 12 January 2018 / Accepted: 28 January 2018 / Published: 1 February 2018
(This article belongs to the Section Molecular Plant Sciences)

Abstract

:
Fiber quality and yield improvement are crucial for cotton domestication and breeding. With the transformation in spinning techniques and multiplicity needs, the development of cotton fiber quality and yield is of great importance. A genetic map of 5178 Single Nucleotide Polymorphism (SNP) markers were generated using 277 F2:3 population, from an intra-specific cross between two upland cotton accessions, CCRI35 a high fiber quality as female and Nan Dan Ba Di Da Hua (NH), with good yield properties as male parent. The map spanned 4768.098 cM with an average distance of 0.92 cM. A total of 110 Quantitative Traits Loci (QTLs) were identified for 11 traits, but only 30 QTLs were consistent in at least two environments. The highest percentage of phenotypic variance explained by a single QTL was 15.45%. Two major cluster regions were found, cluster 1 (chromosome17-D03) and cluster 2 (chromosome26-D12). Five candidate genes were identified in the two QTL cluster regions. Based on GO functional annotation, all the genes were highly correlated with fiber development, with functions such as protein kinase and phosphorylation. The five genes were associated with various fiber traits as follows: Gh_D03G0889 linked to qFM-D03_cb, Gh_D12G0093, Gh_D12G0410, Gh_D12G0435 associated with qFS-D12_cb and Gh_D12G0969 linked to qFY-D12_cb. Further structural annotation and fine mapping is needed to determine the specific role played by the five identified genes in fiber quality and yield related pathway.

Graphical Abstract

1. Introduction

Cotton is one of the most important natural fibers and oil crops in the world. Its annual global market value was estimated to be $630.6 billion in 2011 [1]. Cotton fiber is the primary raw material in the textile industry [2]. The advancements in techniques and diversified methods of spinning have made cotton fiber quality and related yield traits of paramount significance in breeding and production of cotton [3]. Fiber quality is determined by a number of factors such as fiber strength, fiber length, fiber micronaire and fiber color, while yield is mainly determined by lint quantity [4]. However, lint yield and fiber quality have been found to be negatively correlated [5,6], which has long been a critical issue in cotton breeding [7]. Recently, Shang et al. [8] identified 20 QTLs for fiber quality-related traits, however, four QTLs were validated. Moreover, five fiber quality traits were linked to 59 QTLs in an earlier report across five environments [9]. So far, few numbers of QTLs have been employed in marker-assisted selection (MAS) which is one of the enhanced breeding methods [10]. In all the identified and documented QTLs related to fiber and yield traits, most of them have been localized in a wide range of genomic regions and are often not stable across a wide genetic backgrounds [11]. Therefore, a dense interspecific map was generated, which included 2316 loci on the 26 cotton chromosomes in order to reduce and enhance accuracy in mapping [12]. However, these maps developed from interspecific hybridization have limited use in breeding due to limitation in controlling defective genes [2,5].
To overcome the inefficiency of maps developed from interspecific hybridization, it is therefore imperative to generate molecular maps based on an intraspecific population due to their ability to reduce the wide genome gap [2]. The employment of molecular marker techniques in cotton breeding through MAS and more advanced approaches such as genomic selection (GS) [13] would help break the bottleneck and, in turn, development of genetically advantaged genotypes. A small part of a DNA can be archived by reducing the complexity of the genome by restriction enzymes, such as genotyping-by-sequencing (GBS), the reduced-representation libraries (RRLs), restriction-site-associated DNA sequencing (RAD-seq) and next generation sequencing (NGS) [14].
The next-generation sequencing (NGS) of crop plant genomes have transformed the field of plant breeding. In the recent past, a lot of data generated has facilitated the discovery and use of large scale of single nucleotide polymorphisms (SNPs) in different genomes [15,16]. One of which was, genotype by sequencing (GBS), which holds the potential to narrow down the genotyping gap between references of large interest and mapping or breeding populations of local or specific interest [17]. GBS protocol techniques with their sample multiplicity have kept molecular research costs low while their output has diverse applications in many research areas, ranging from gene discovery to genomic-assisted breeding [18]. The ability of generating large amounts of unbiased markers in an inexpensive methods, has enabled GBS to become a more attractive approach to genotype and to construct high-resolution genetic maps, genomic selection and facilitated QTL mapping [19].
Mapping of QTLs has become an important technique to facilitate quantitative trait research and has been largely used in agricultural crops to map a number of beneficial agronomic traits including fiber quality and related yield traits.
In this investigation, a genetic map of 5178 SNP markers was generated using a 277 F2:3 intraspecific population developed from two tetraploid upland cotton accessions, mainly cultivated in China. CCRI35 with good fiber quality as female parent and Nan Dan Ba Di Da Hua (NH) known for high yield fiber as male parent. The map generated was employed to analyze QTLs related to fiber quality and yield related traits using QTL cartographer [20]. The aim of this study was to identify QTLs related to fiber quality, yield component traits, localize their position within the cotton genome and to identify the genes tightly linked to those QTLs. Findings of this research could provide valuable insights for breeders to develop cultivars with both traits, yield and quality fiber and enhance selection in cotton breeding.

2. Results

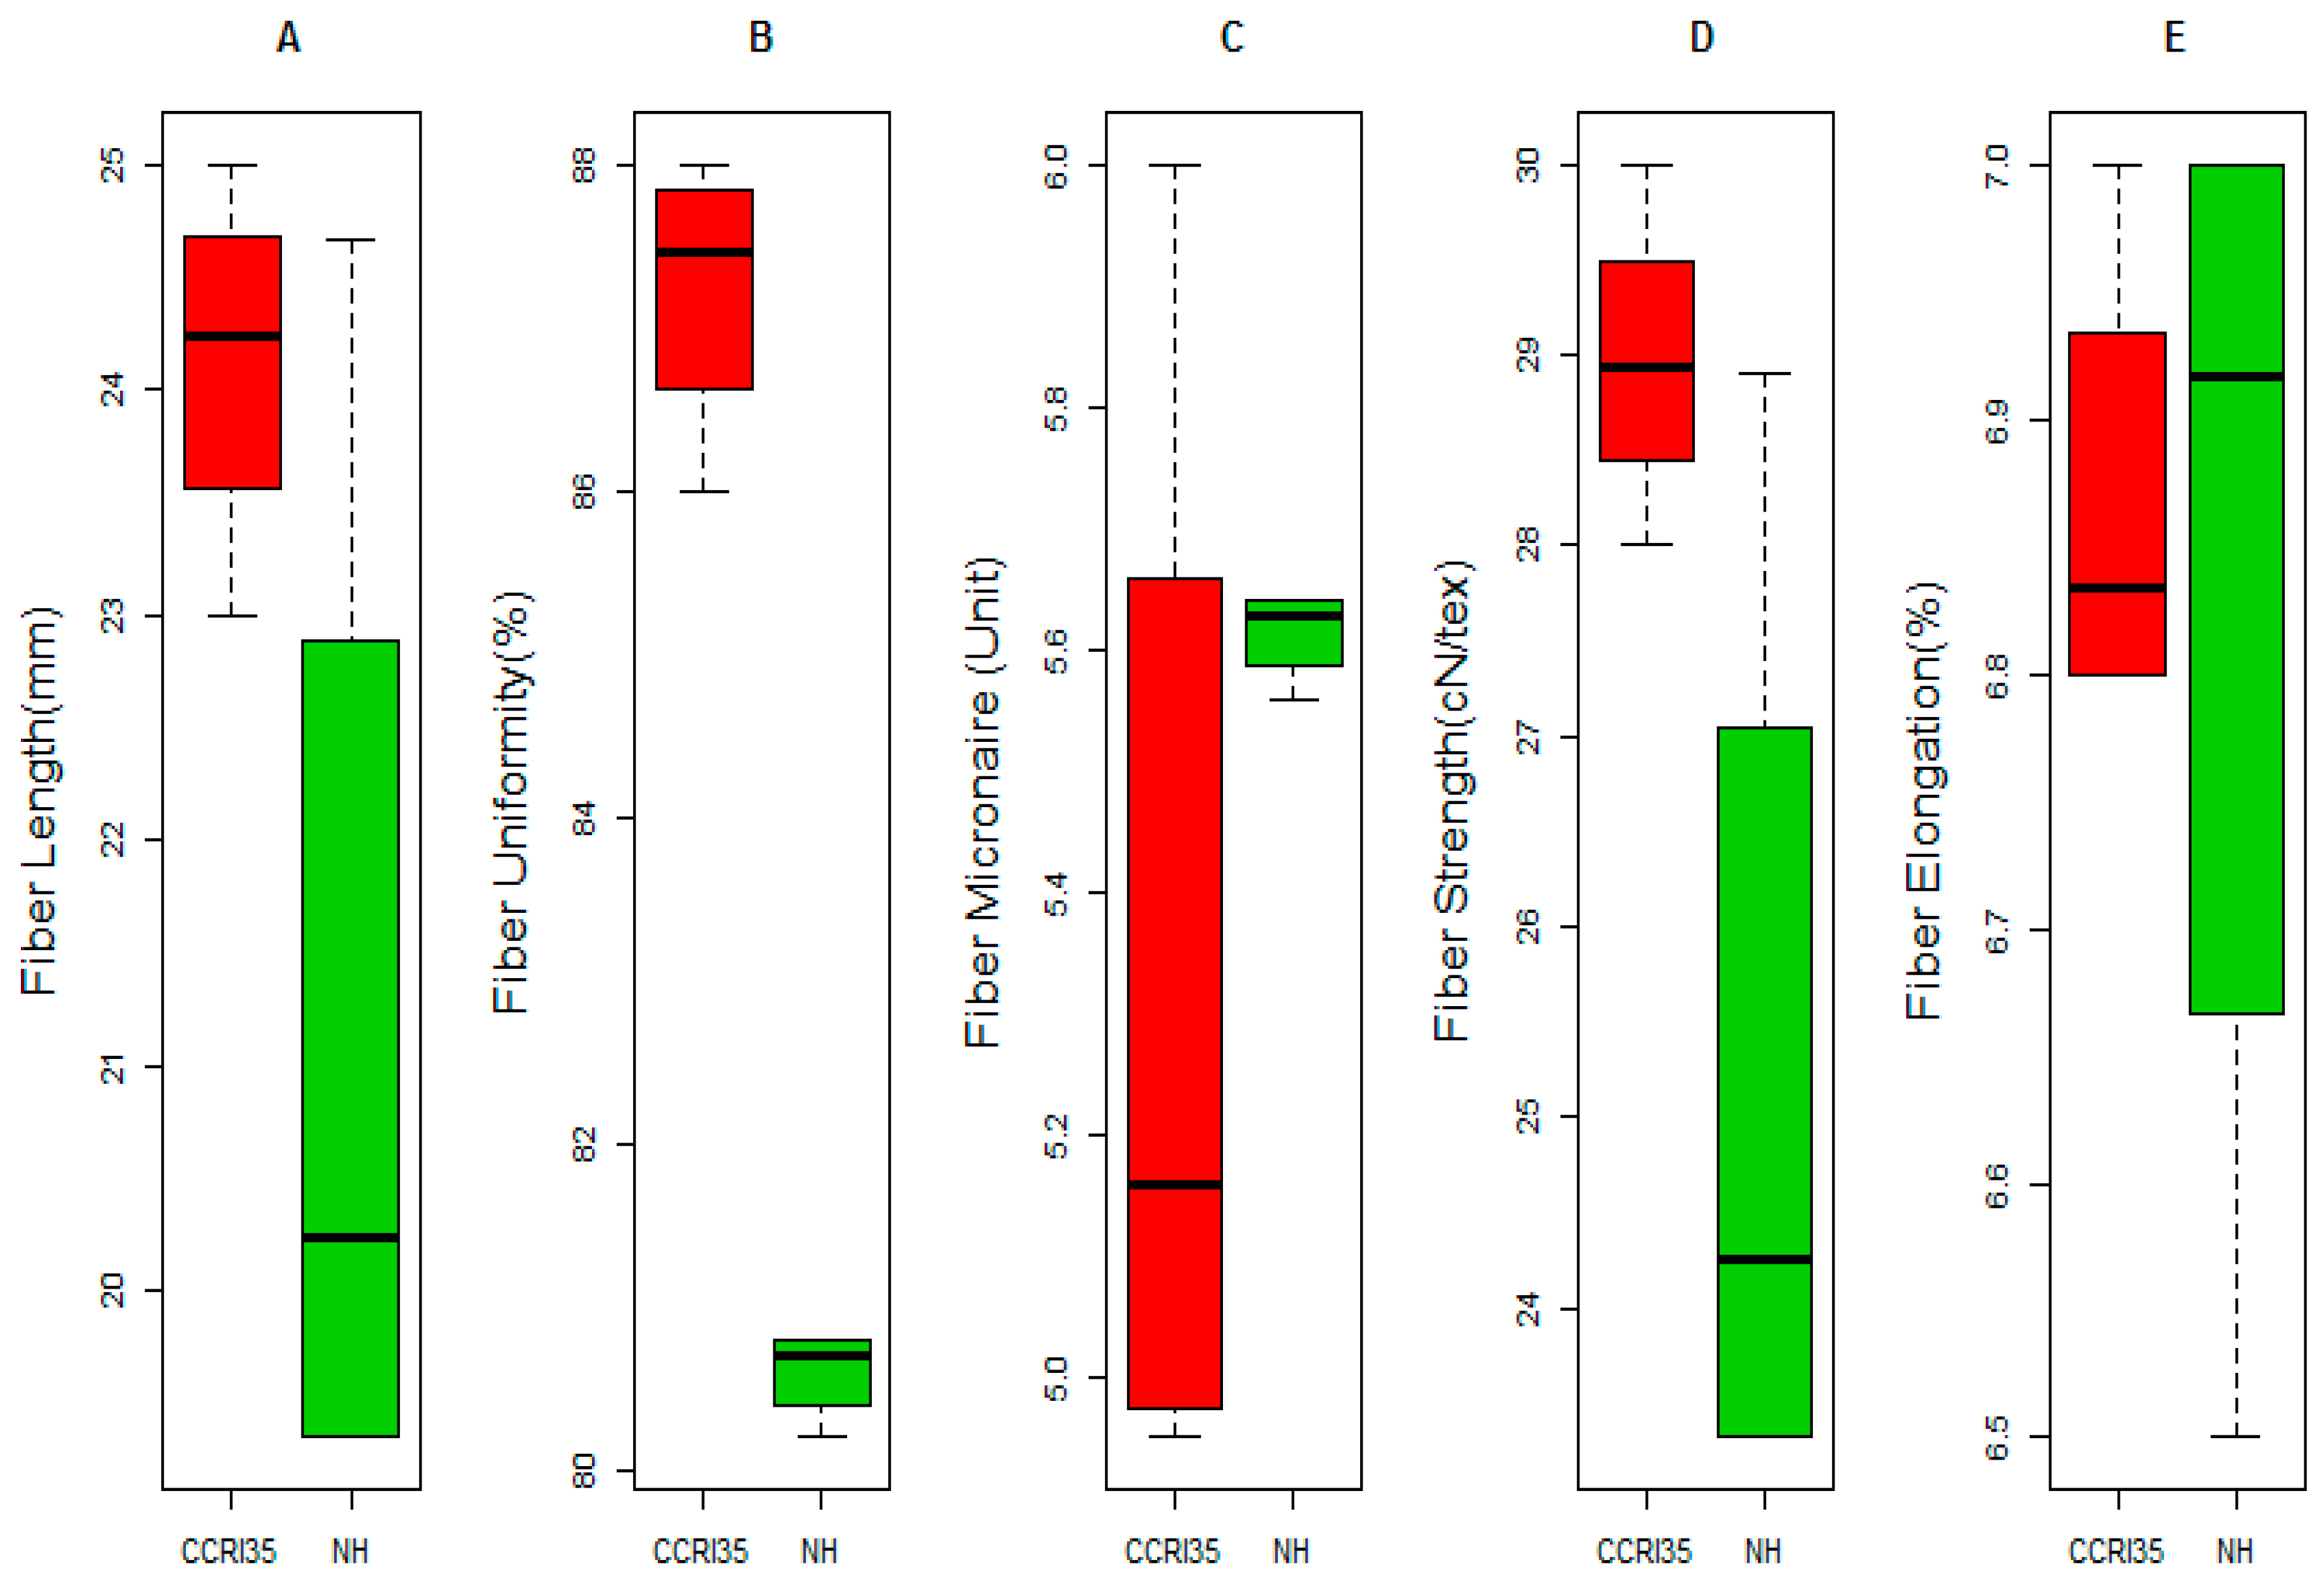
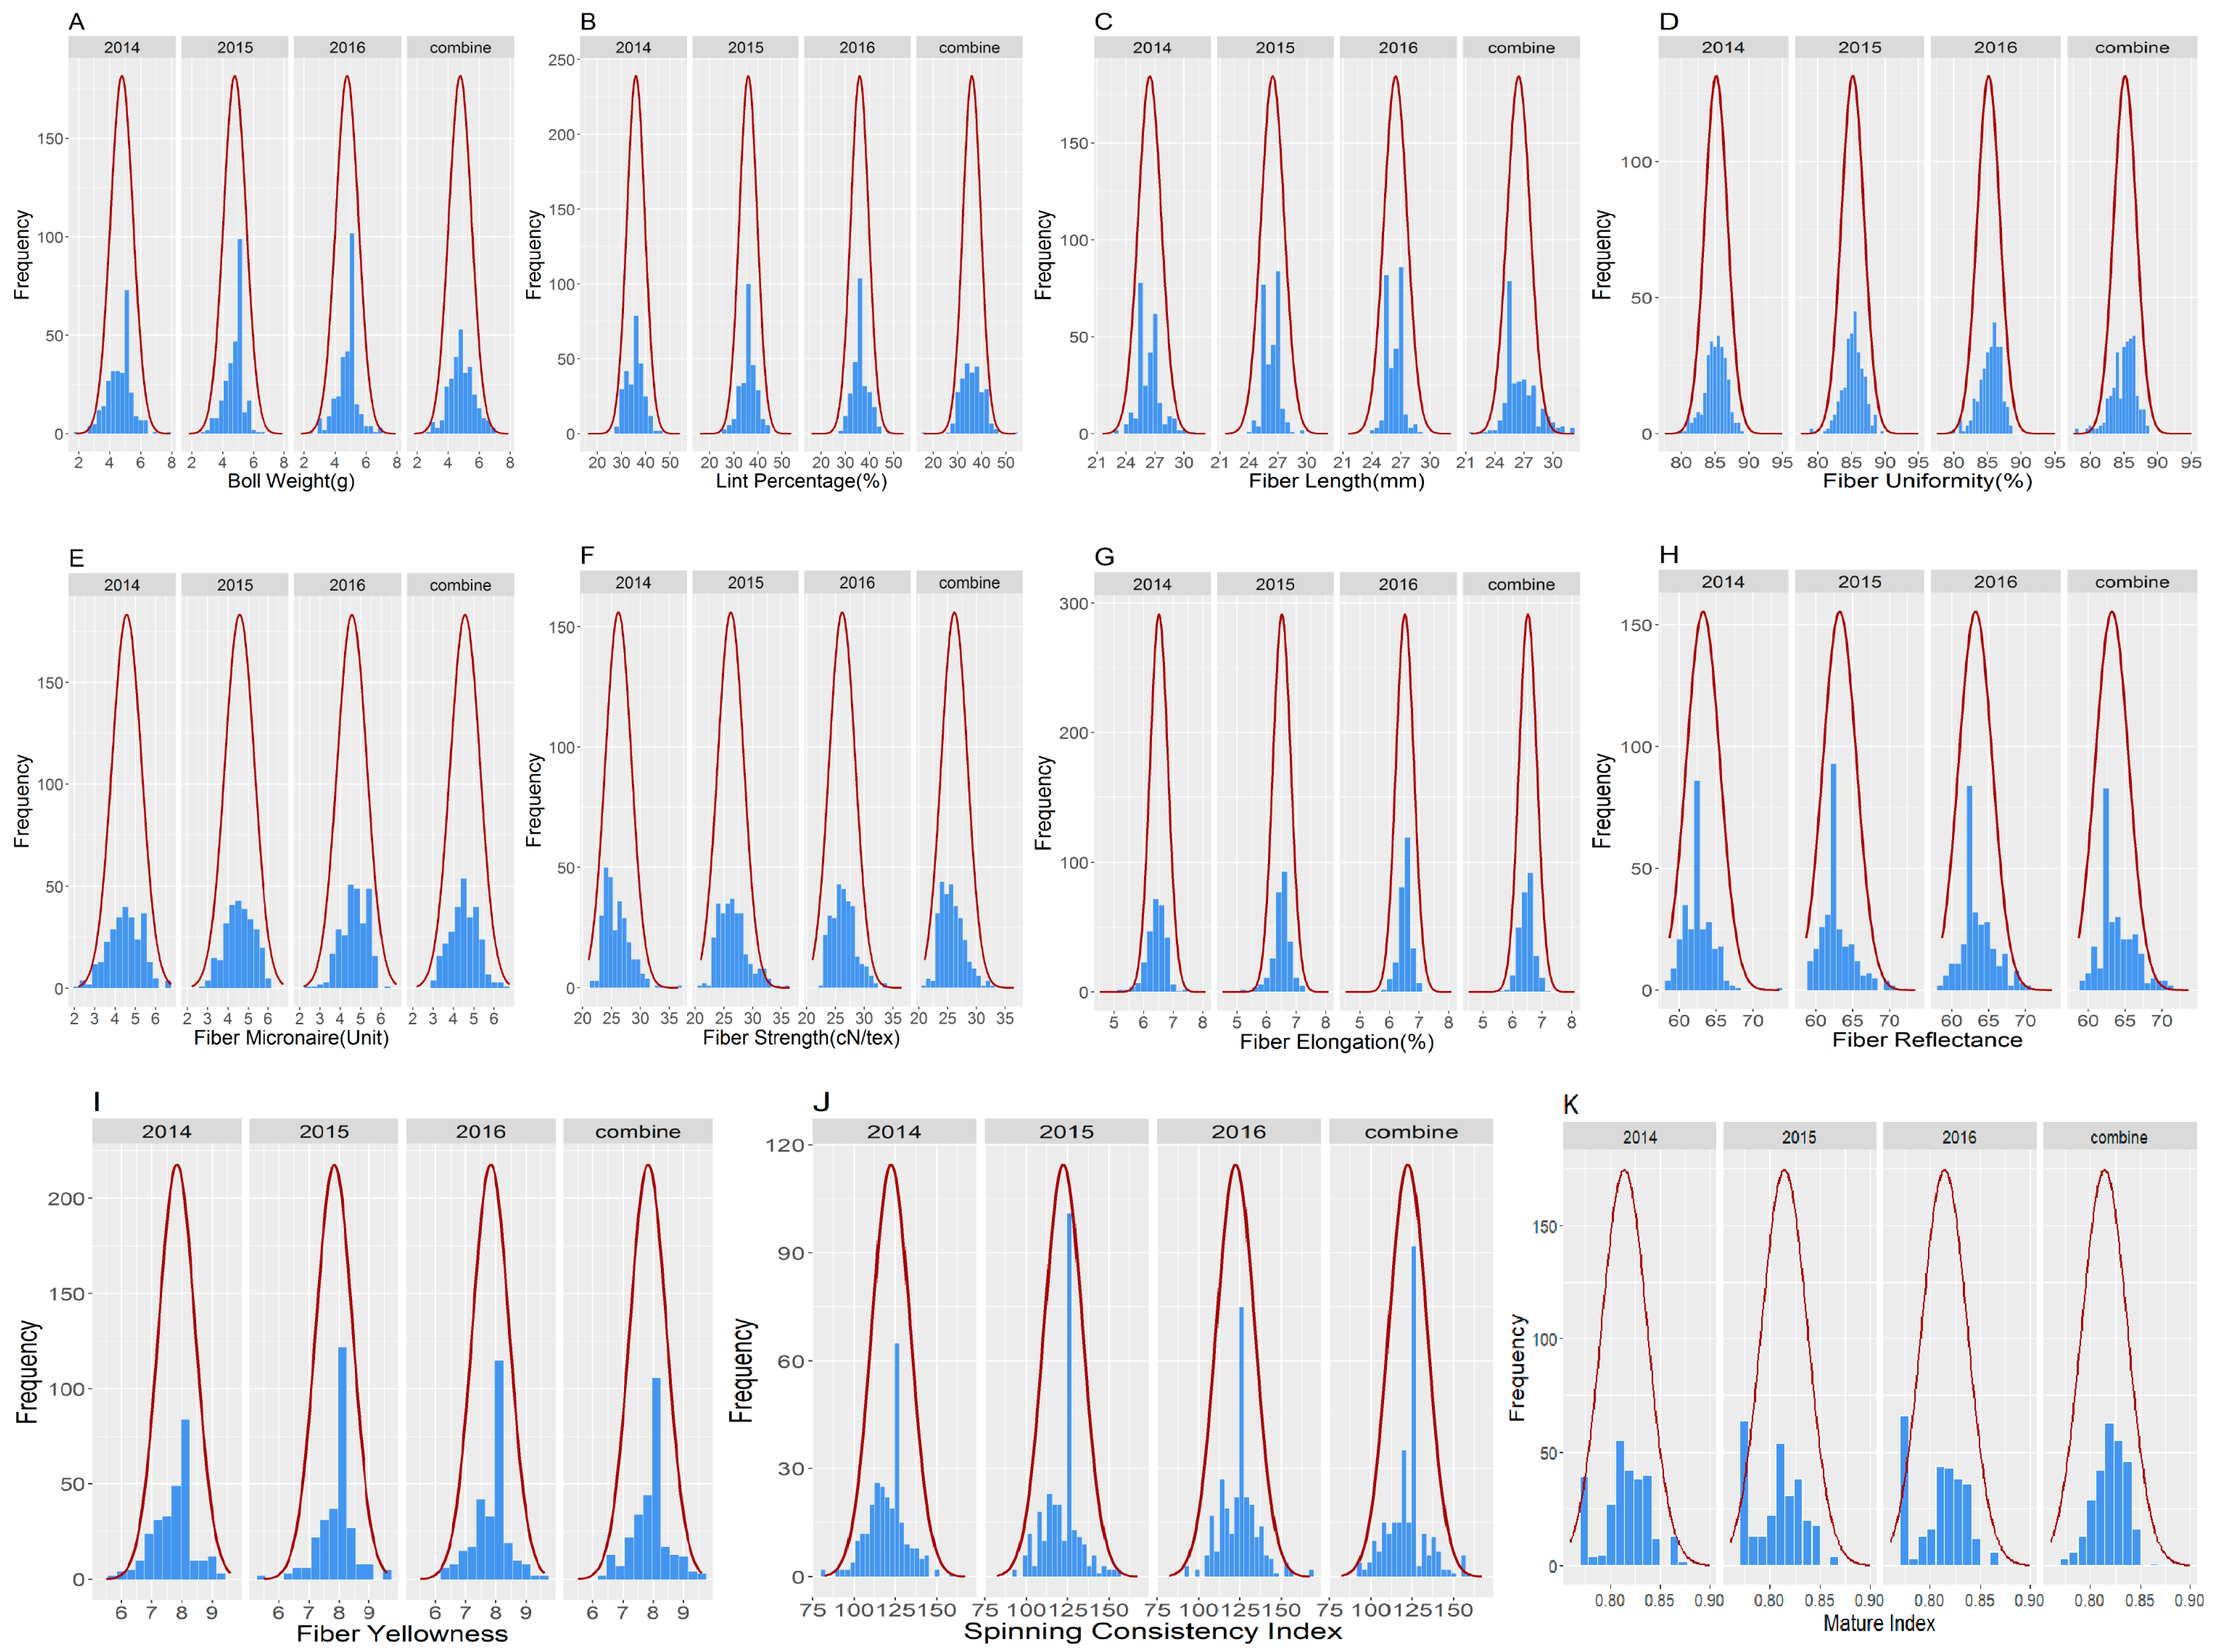
2.1. Phenotypic Variation between the Two Parents

In the determination of phenotypic variation of the 11 measured traits, Boll weight (BW), lint percentage (LP), fiber reflectance (FR), fiber yellowness (FY), spinning consistency index (SCI), and mature index (MI) were not used in analysis of the phenotypic variation between the parental lines due to the huge missing data throughout the phenotyping periods. The five traits used were fiber length (FL), fiber uniformity (FU), fiber strength (FS), fiber micronaire (FM) and fiber elongation (FE). FL, FU and FS showed significant differences between the parental lines. All traits were higher in CCRI35 than NH with exemption of FE which was higher in NH. In addition, no significant difference was noted between the two parental lines for fiber micronaire (FM) and fiber elongation (FE), Figure 1. However, there was a wide range of phenotypic variation among the F2:3 population, with respect to all the measured traits; BW, LP, FL, FU, FM, FS, FE, FR, FY, SCI and MI. Across the three environments, 2014, 2015 and 2016 all the traits showed normal segregation with normalized distribution patterns (Figure 2).

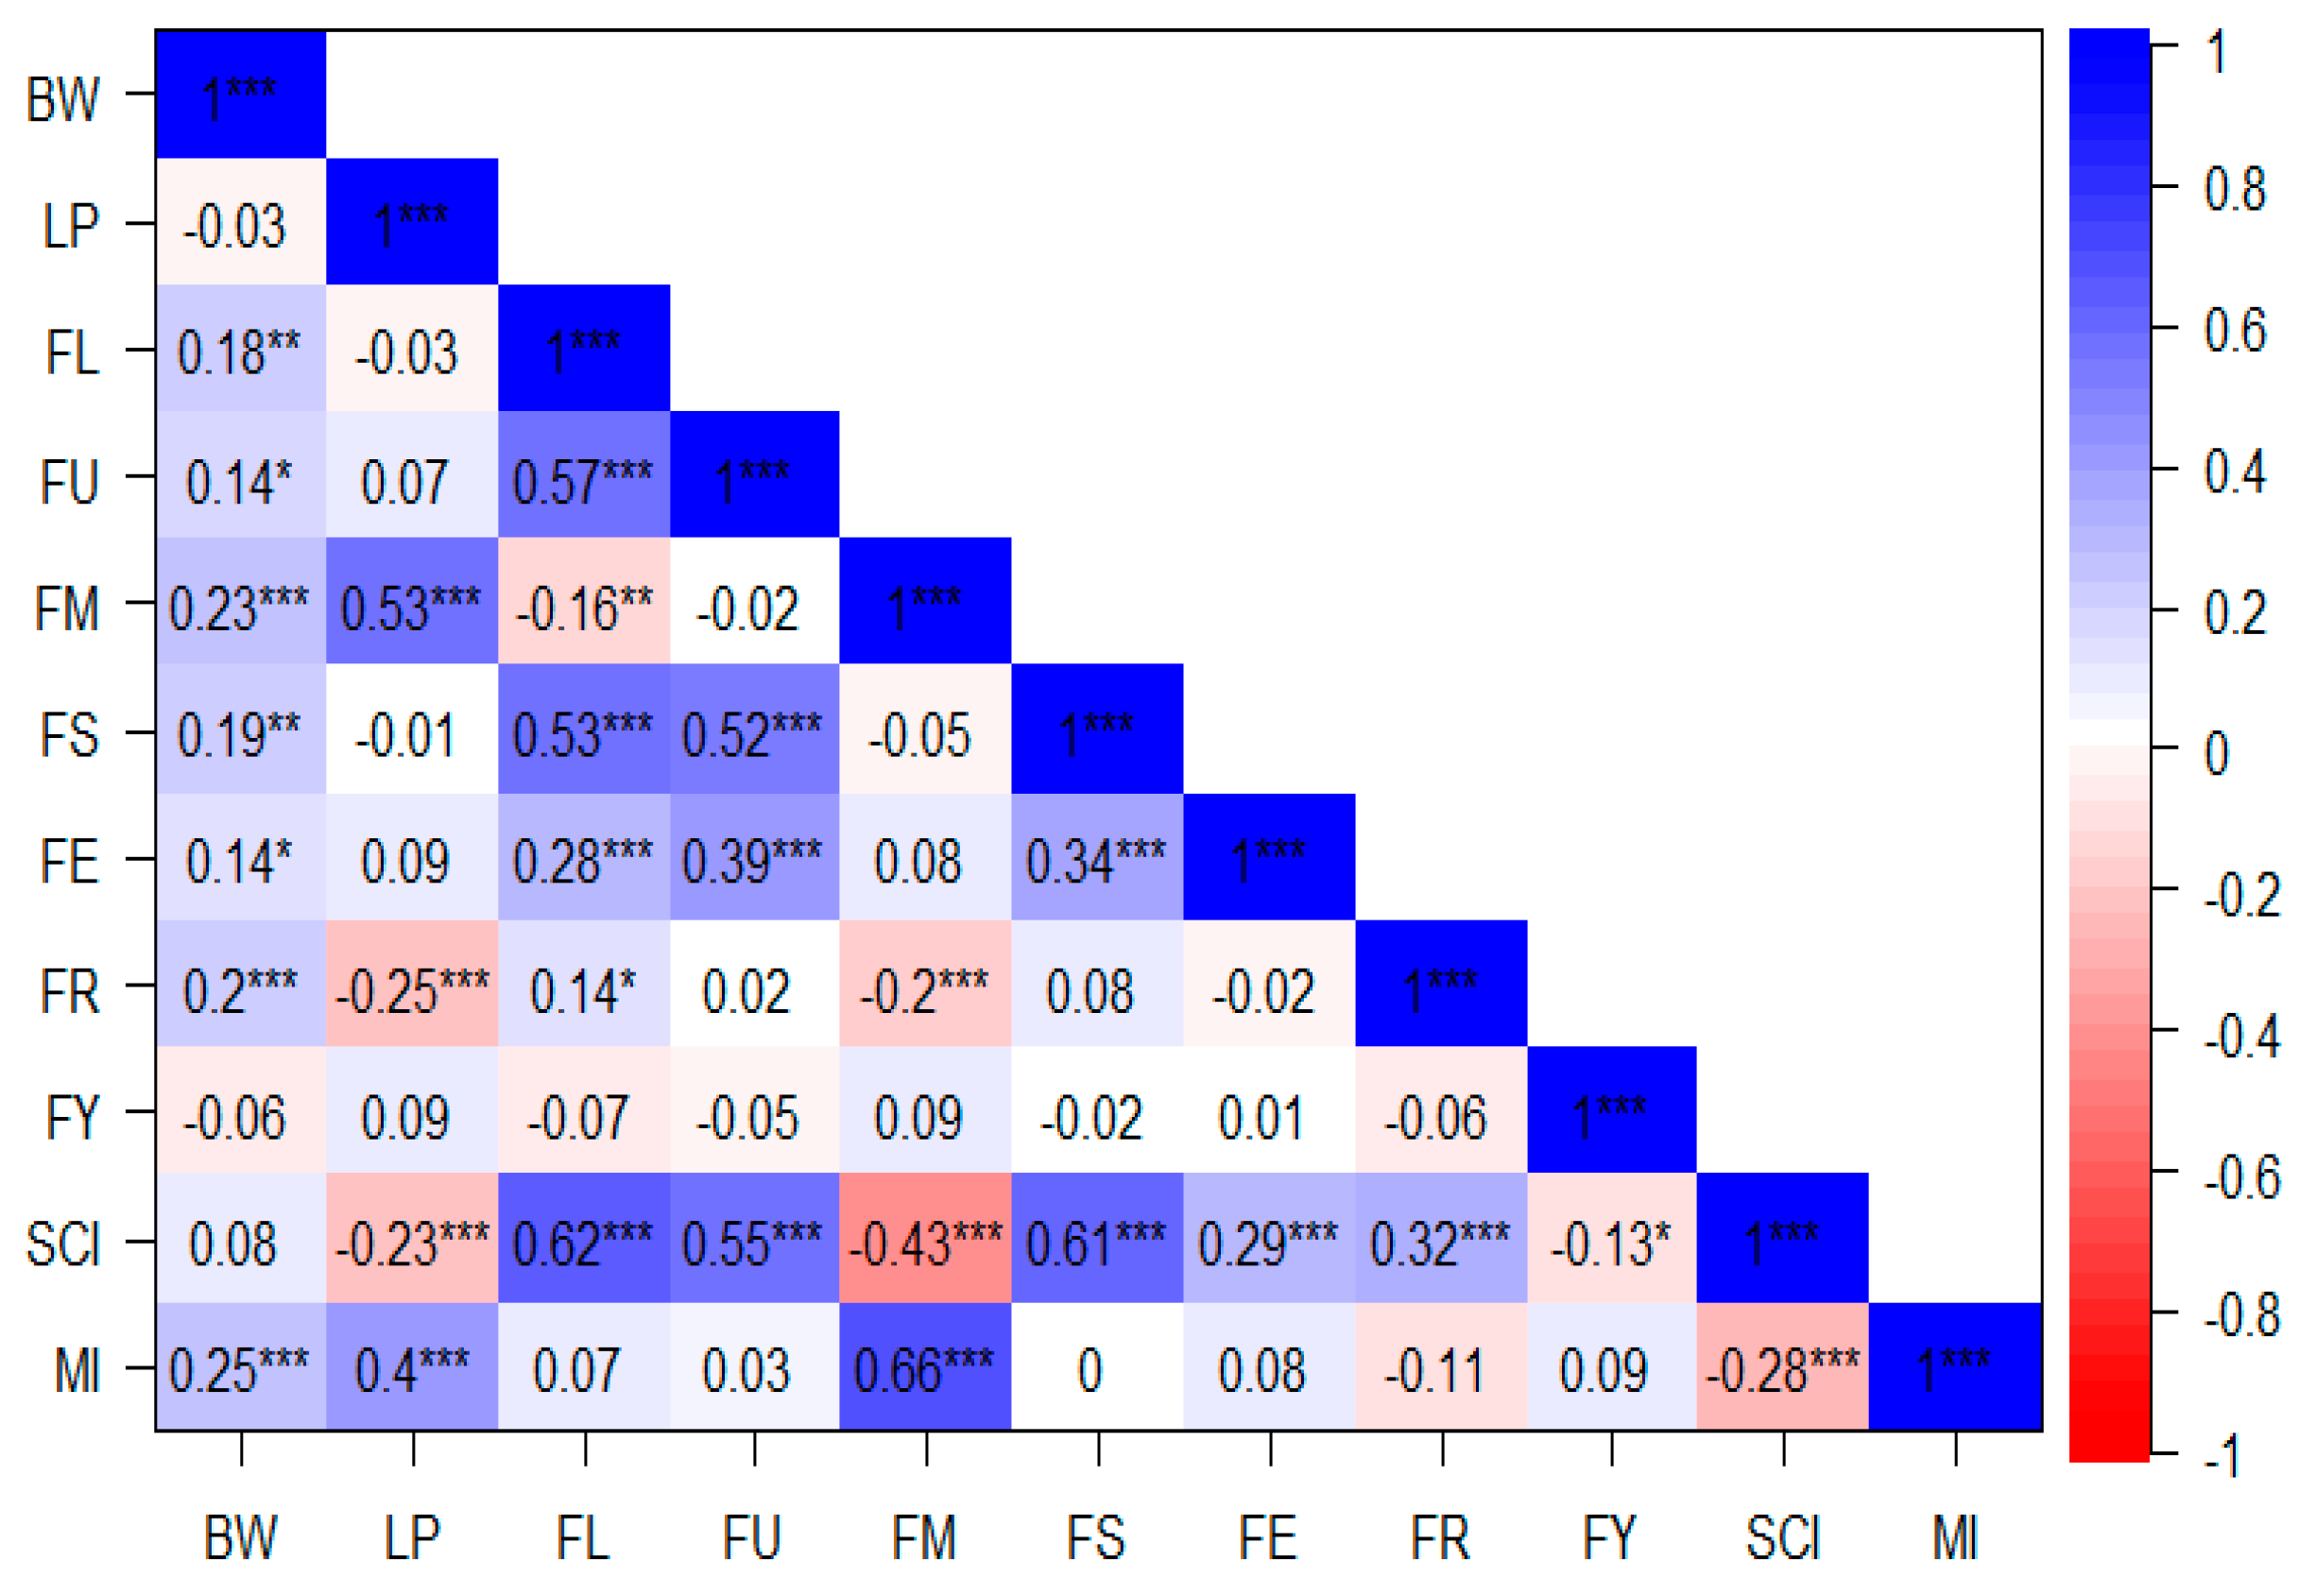
2.2. Correlation Analysis

To determine the correlations among different traits, a Pearson’s correlation coefficient on yield-related and fiber quality trait was done using “Performance Analytics” package with Chart correlation function in R software version 3.4.2 [21]. Significant and positive correlations were noted between: BW with FL, FU, FM, FS, FE, FR, and MI; LP with FM and MI;FL with FU, FS, FE, FR, and SCI; FU with FS, FE, and SCI; FM with MI; FS with FE and SCI; FE with SCI and finally FR with SCI. Negative correlations were observed between: LP with FR and SCI; FL with FM; FM with FR and SCI; FY with SCI and finally SCI with MI (Figure 3). However, no significant correlation was noted between the other traits.

2.3. ANOVA, Broad Sense Heritability and Phenotypic Analysis of Fiber Quality for the Two Parents and the F2:3 Population

The ANOVA result revealed significant differences between the genotypes, environment and their interactions for all the traits (Table 1).
The broad sense heritability was much higher for the fiber quality traits as opposed to yield-related traits. The highest broad sense heritability was observed with fiber micronaire (FM), with 92.4% while the lowest broad sense heritability was observed in fiber elongation (FE) with 61.8%.

2.4. GBS Genotyping, SNP Detection and Annotation

The genotypic data for the entire population was developed by use of the genotyping by sequencing (GBS) technique. Fifteen (15) individuals of each of the parents were sequenced and mapped on to the reference genome, which we obtained from the cotton research institute (available online: http://mascotton.njau.edu.cn). We obtained a total of 20,542,731 and 20,244,825 reads for CCRI35 and NH, respectively. An average of 80,372 and 112,128 SNPs were eventually identified for the female parent (CCRI35) and the male parent (NH), respectively, with an enzyme digestion efficiency of 99%. In genotyping the F2:3 population, the enzyme efficiency was slightly lower compared to its efficiency in the parents, with efficiency of 98.9%. The overall mapped reads for the population and the two parents were 1,507,193,217, with an average of 4,909,424.16 mapped reads per individual which correspond to nearly 180.889 Gb of clean bases. The clean reads obtained were equivalent to 80.42-fold haploid genome coverage of raw paired-end Illumina reads by sequencing whole genome shotgun (WGS) libraries of homozygous cv. “TM-1” compared to Li et al. [22] in their study which generated a total of 445.7 Gb of clean reads translating to about 181-fold haploid genome coverage of raw paired-end Illumina reads by sequencing whole genome shotgun (WGS) libraries of homozygous cv. “TM-1” with fragment lengths ranging from 250 bp to 40 kb. The average GC content of the sequences was 38.25%, with a Q20 score of 94.66%. The parental lines were genotypes such as AC and AA, in which the female parent CCRI35 was heterozygous while the male parent (NH) was homozygous. The total resulting SNPs markers were 103,381 markers which were used to carry out further analysis. We assessed the distribution of the alleles across the F2:3 population, and those markers which had a coverage threshold of 75% were filtered out, eventually, 34,090 markers were used. Markers with significant distortion (p < 0.001) were filtered and 6405 markers were retained with the purpose of determining bin markers.

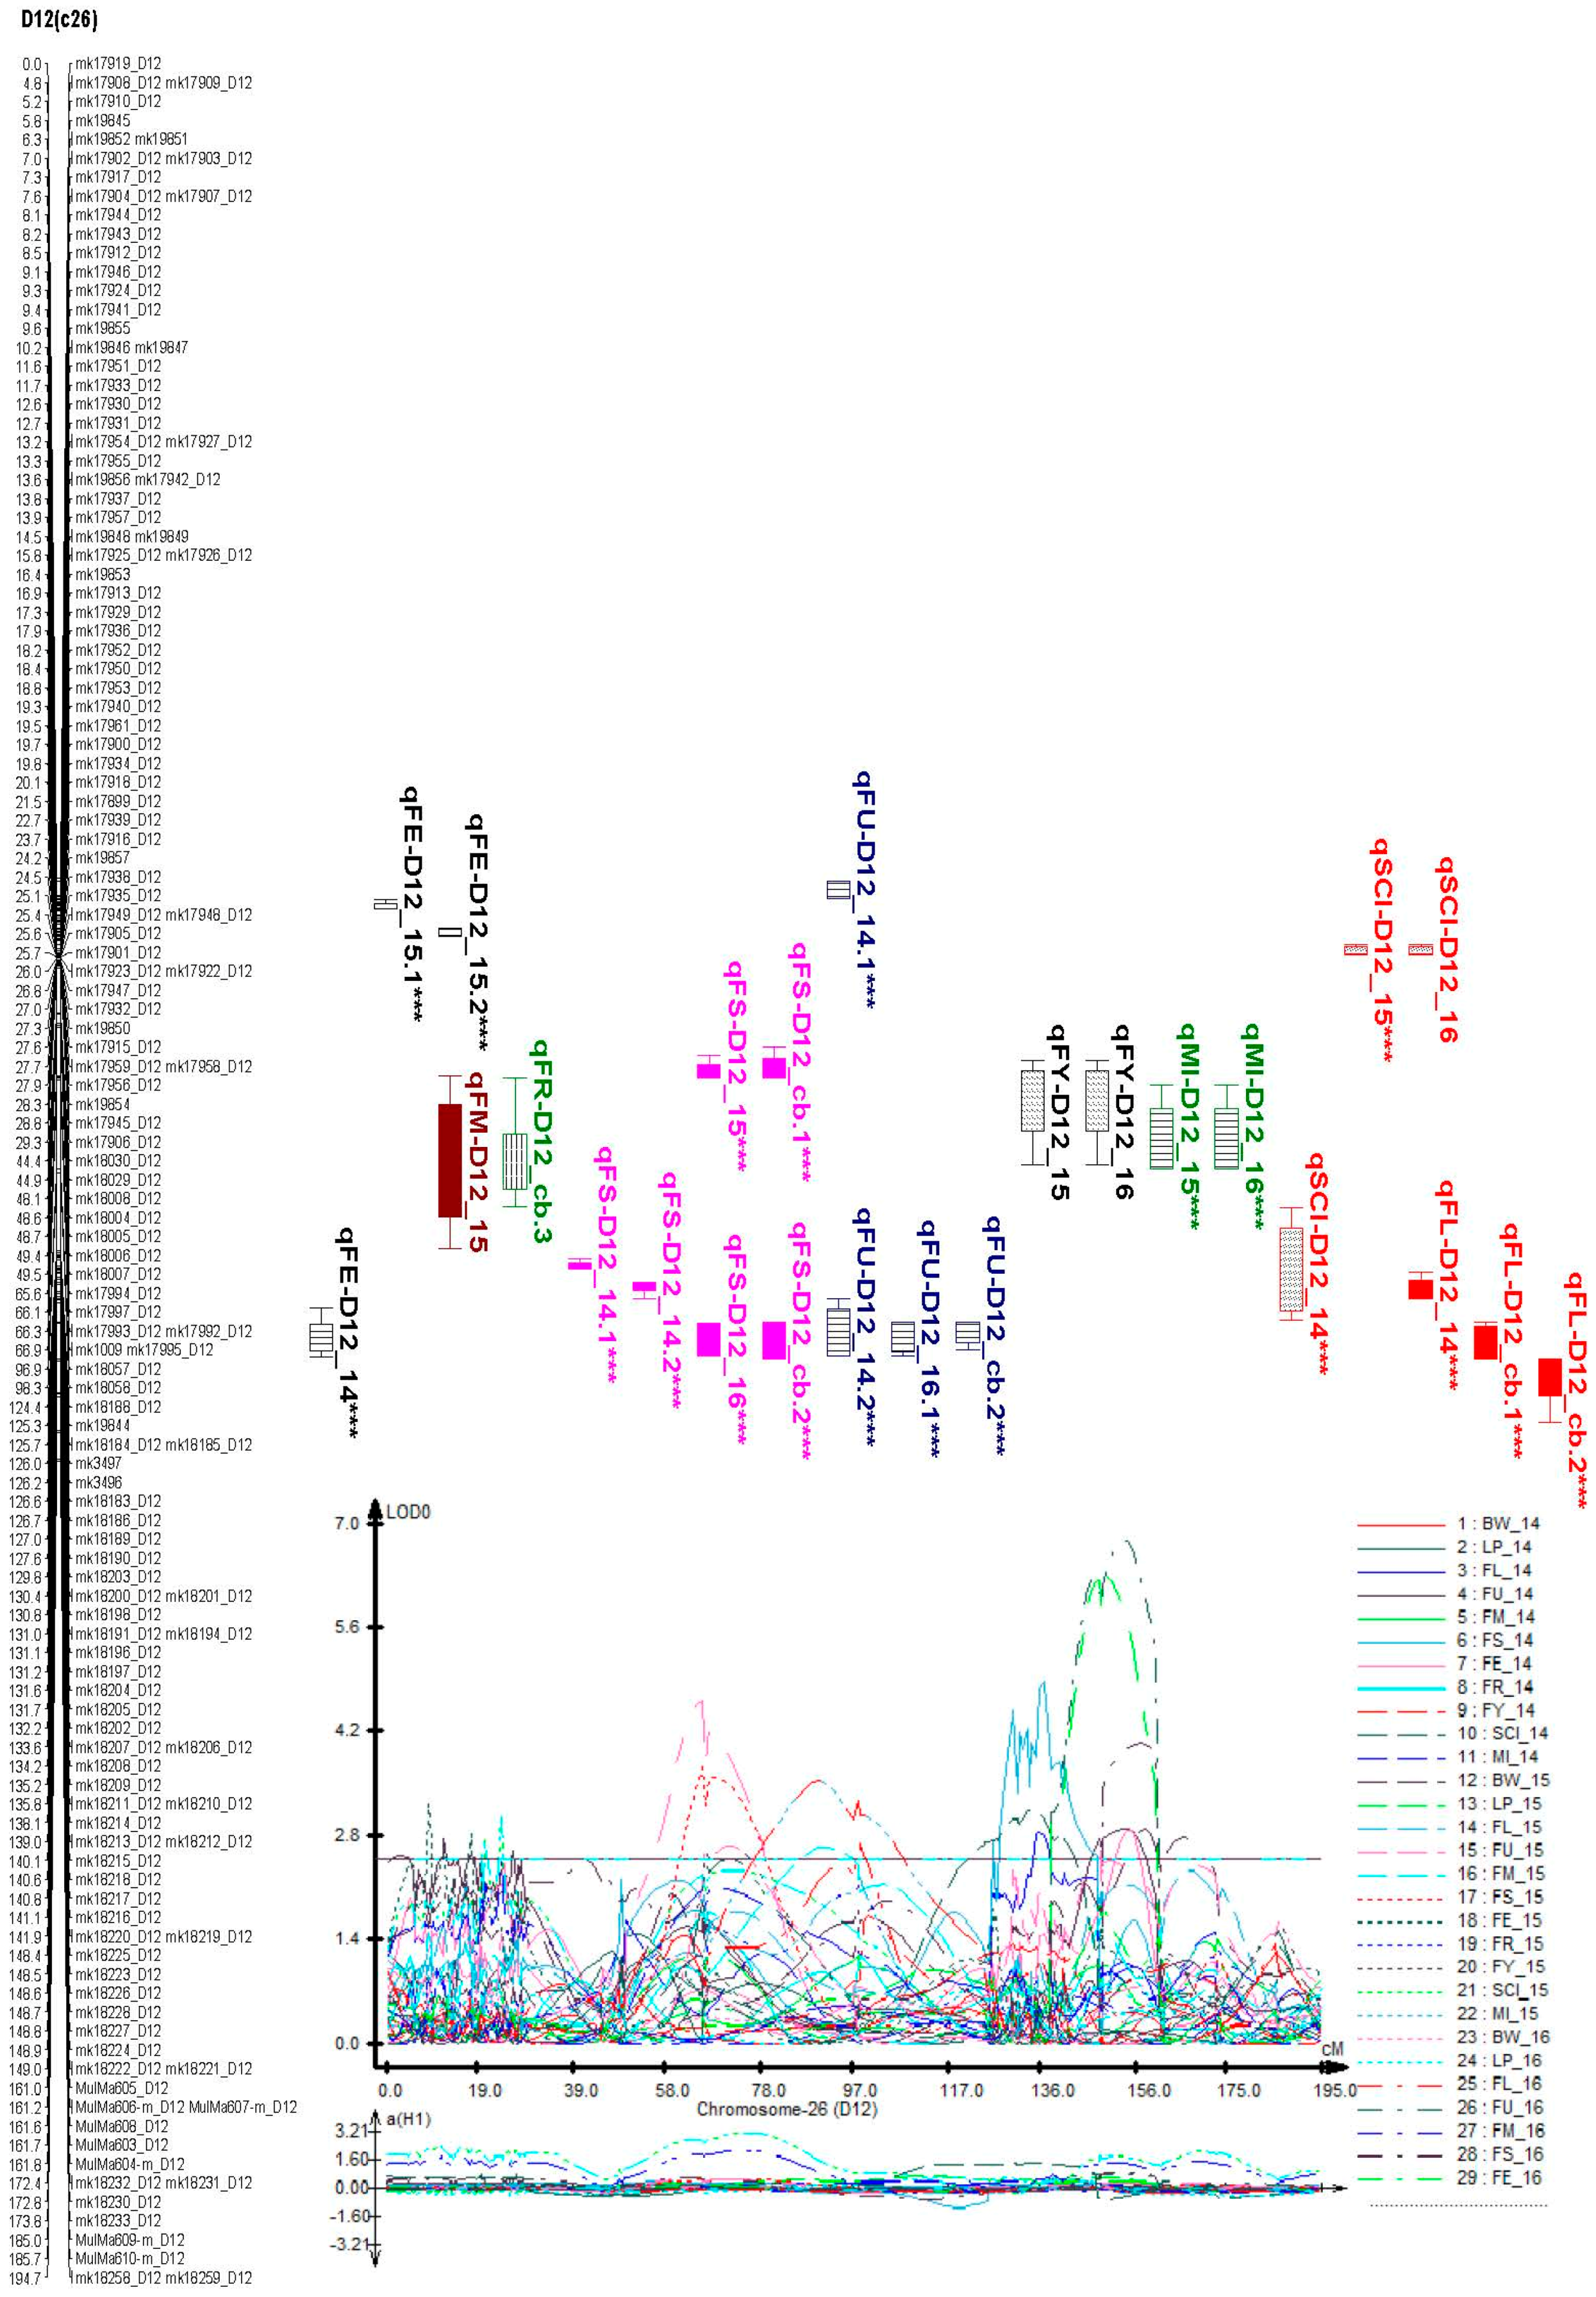
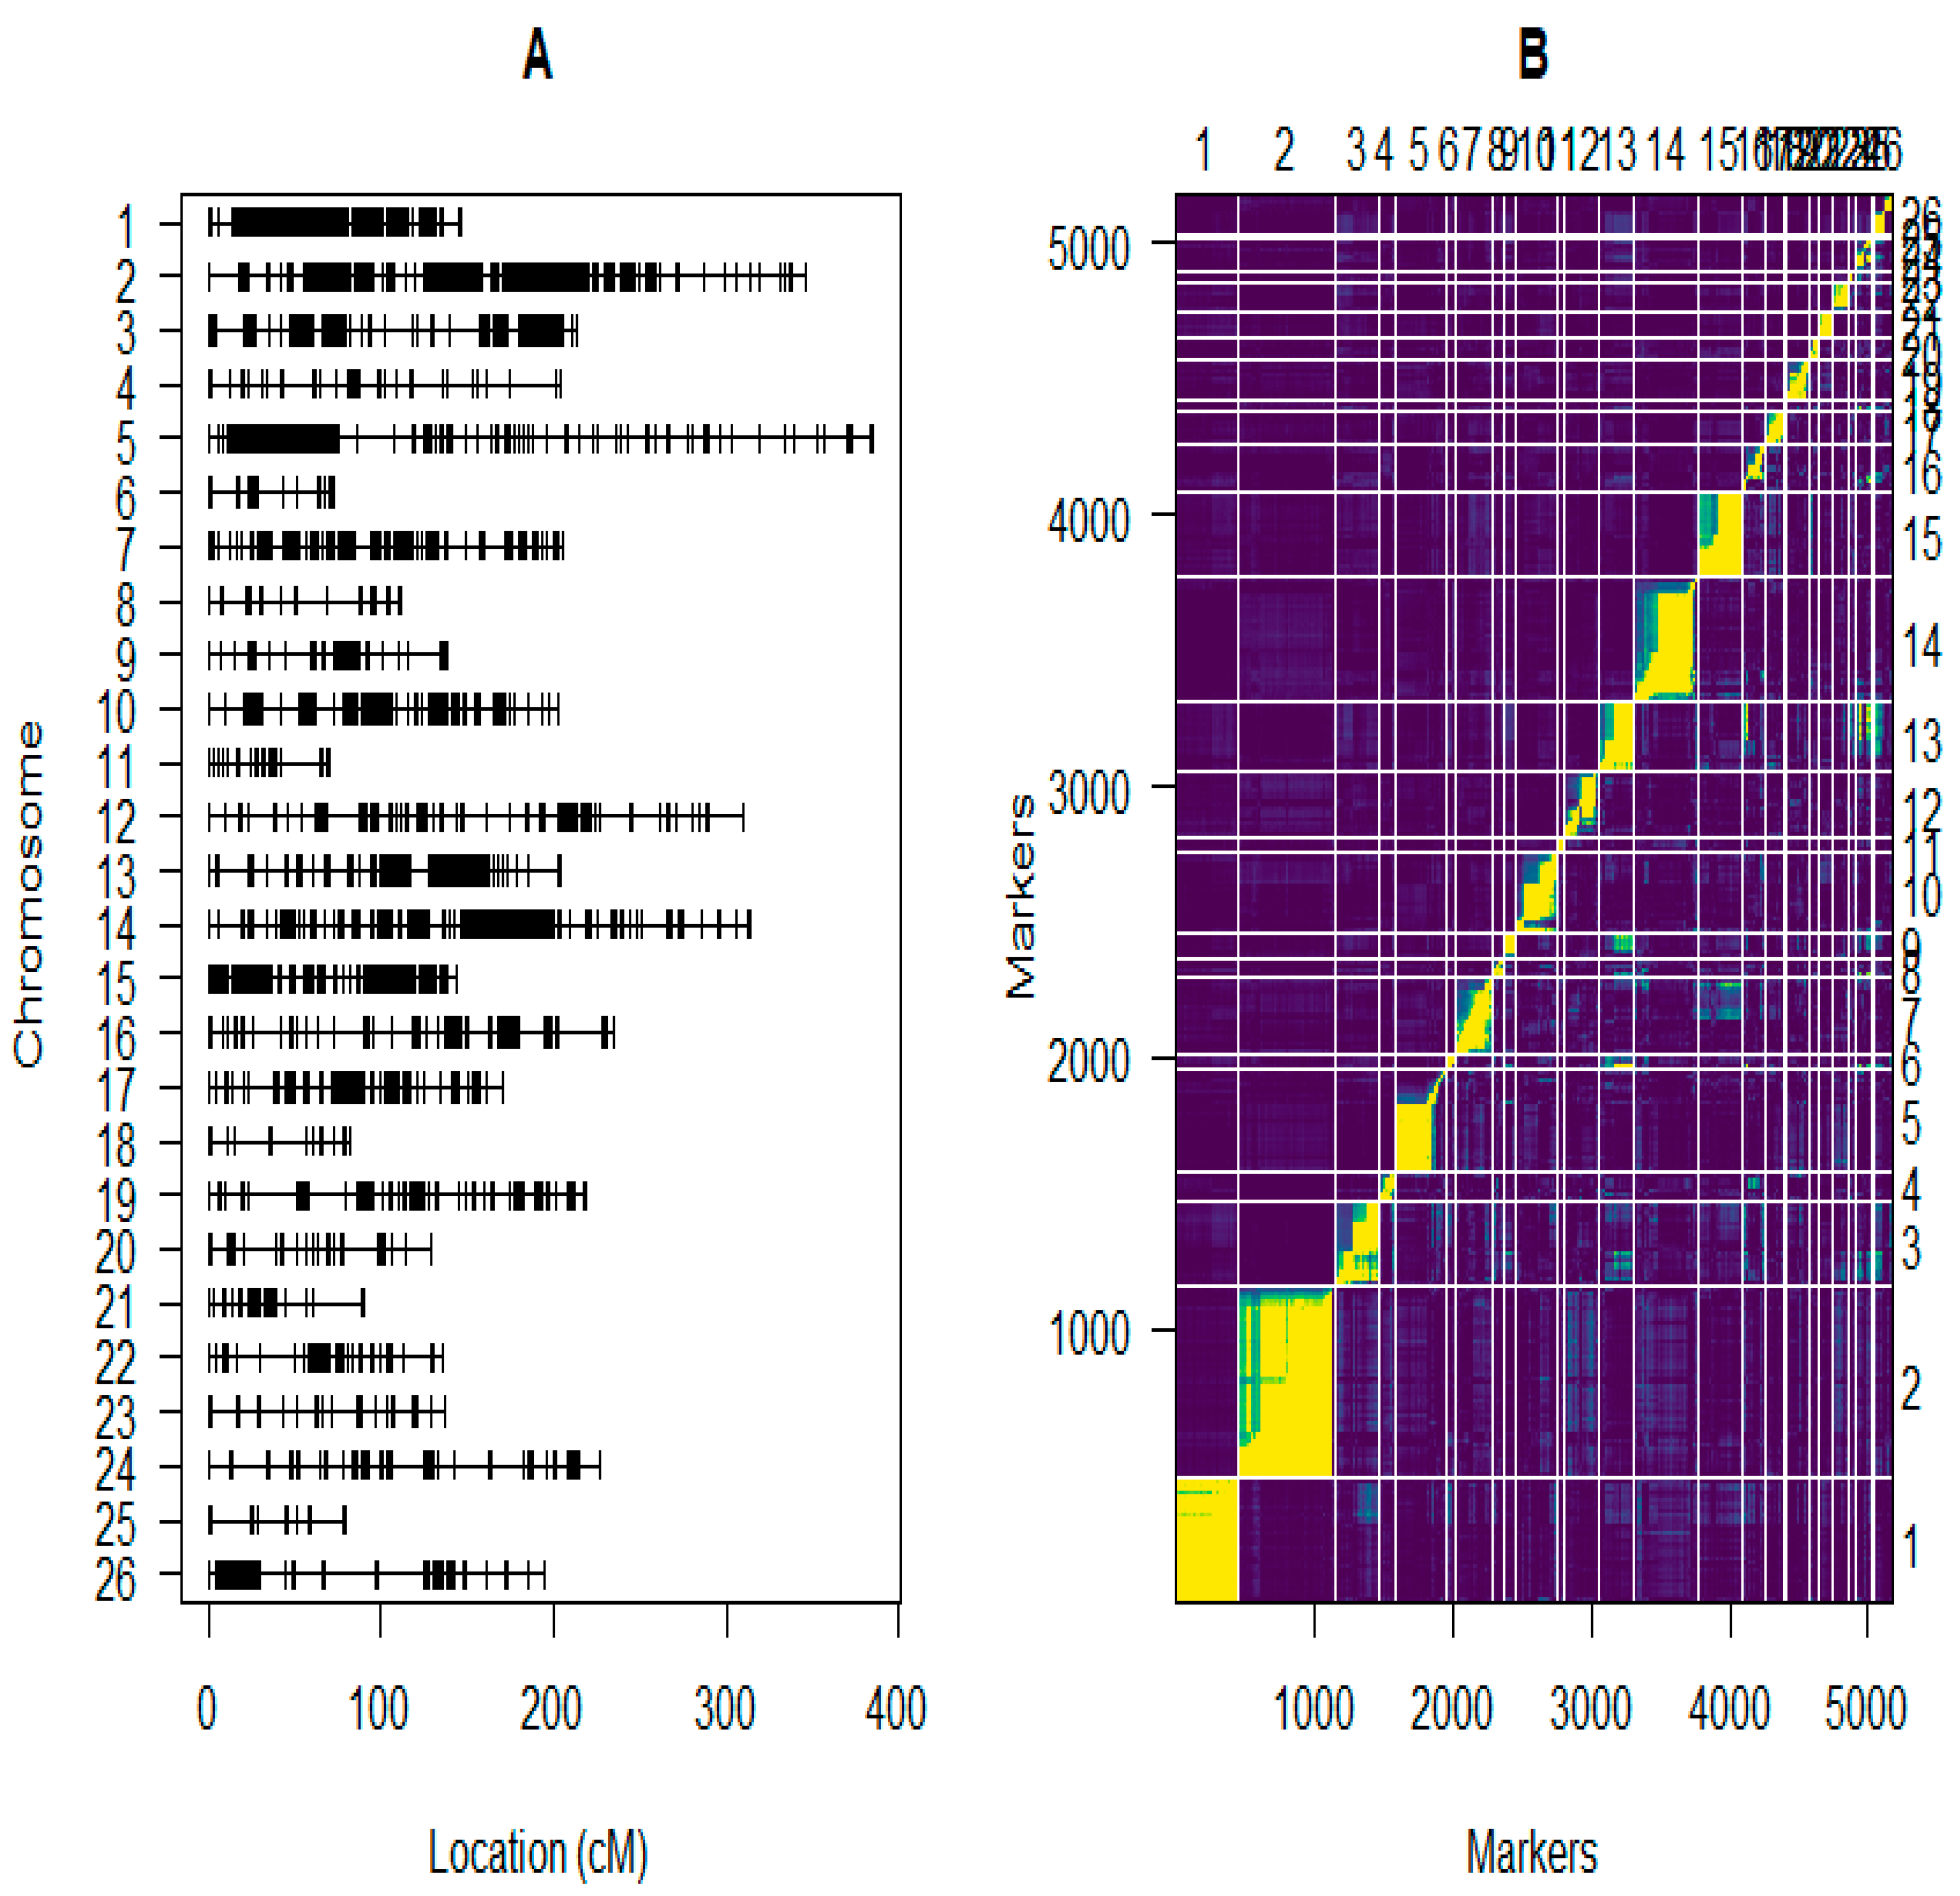
2.5. Construction of the Linkage Maps

In the construction of the linkage groups, we used 6405 markers (Table S1) and phenotypic data of the F2:3 population developed from an intra-specific cross of two tetraploid upland cottons were utilized for developing the intra-specific linkage map. A total of 5178 GBS markers were used for mapping the F2:3 population, all the distorted markers were filtered out, the linkage groups were generated by the use of Join Map 4.0 [23]. Twenty six (26) LGs were generated from 5178 markers (Figure 4A and Figure S1, Table 2 and Table S2). Markers in linkage groups were ordered, rippled, and re-ordered according to pairwise recombination fractions, LOD scores (Logarithm of Odds) and linkage group length (Figure 4B). The 26 LGs were designated as A01 to A13 for At sub-genome and D01 to D13 for Dt sub-genome. The map generated had a map distance of 4768.098 cM, higher than the most current upland cotton linkage map with a map distance of 4450 cM [24]. The average distance between adjacent markers was 0.92 cM, the marker distances were narrowed in the map generated compared to earlier maps with 1.7 cM between adjacent markers [24]. The At sub-genome spanned 2611.43 cM, with a total of 3313 markers in the 13 linkage groups, with an average distance of 0.79 cM, while in Dt sub-genome, thirteen linkage groups comprised of 1865 markers spanning a distance of 2156.67 cM, with an average of 1.156 cM. The maximum gap between adjacent loci was 26.598 cM and 30.082 cM in At and Dt respectively, affirming the genome lengths between At and Dt [24] (Table 2). Chromosomes; A02, D02, A01, A05, A03, D01 and A10 exhibited higher marker loci with higher recombination frequency compared to the rest of the chromosomes such as D06 and D13 (Figure 4A,B). The chromosome with the highest marker loci was chromosome A02, 705 loci with map distance of 346.314 cM and an average distance of 0.49 cM, while the lowest marker loci was detected in chromosome D06 with only 16 markers, and a total length of 79.084 cM (Figure 4B).

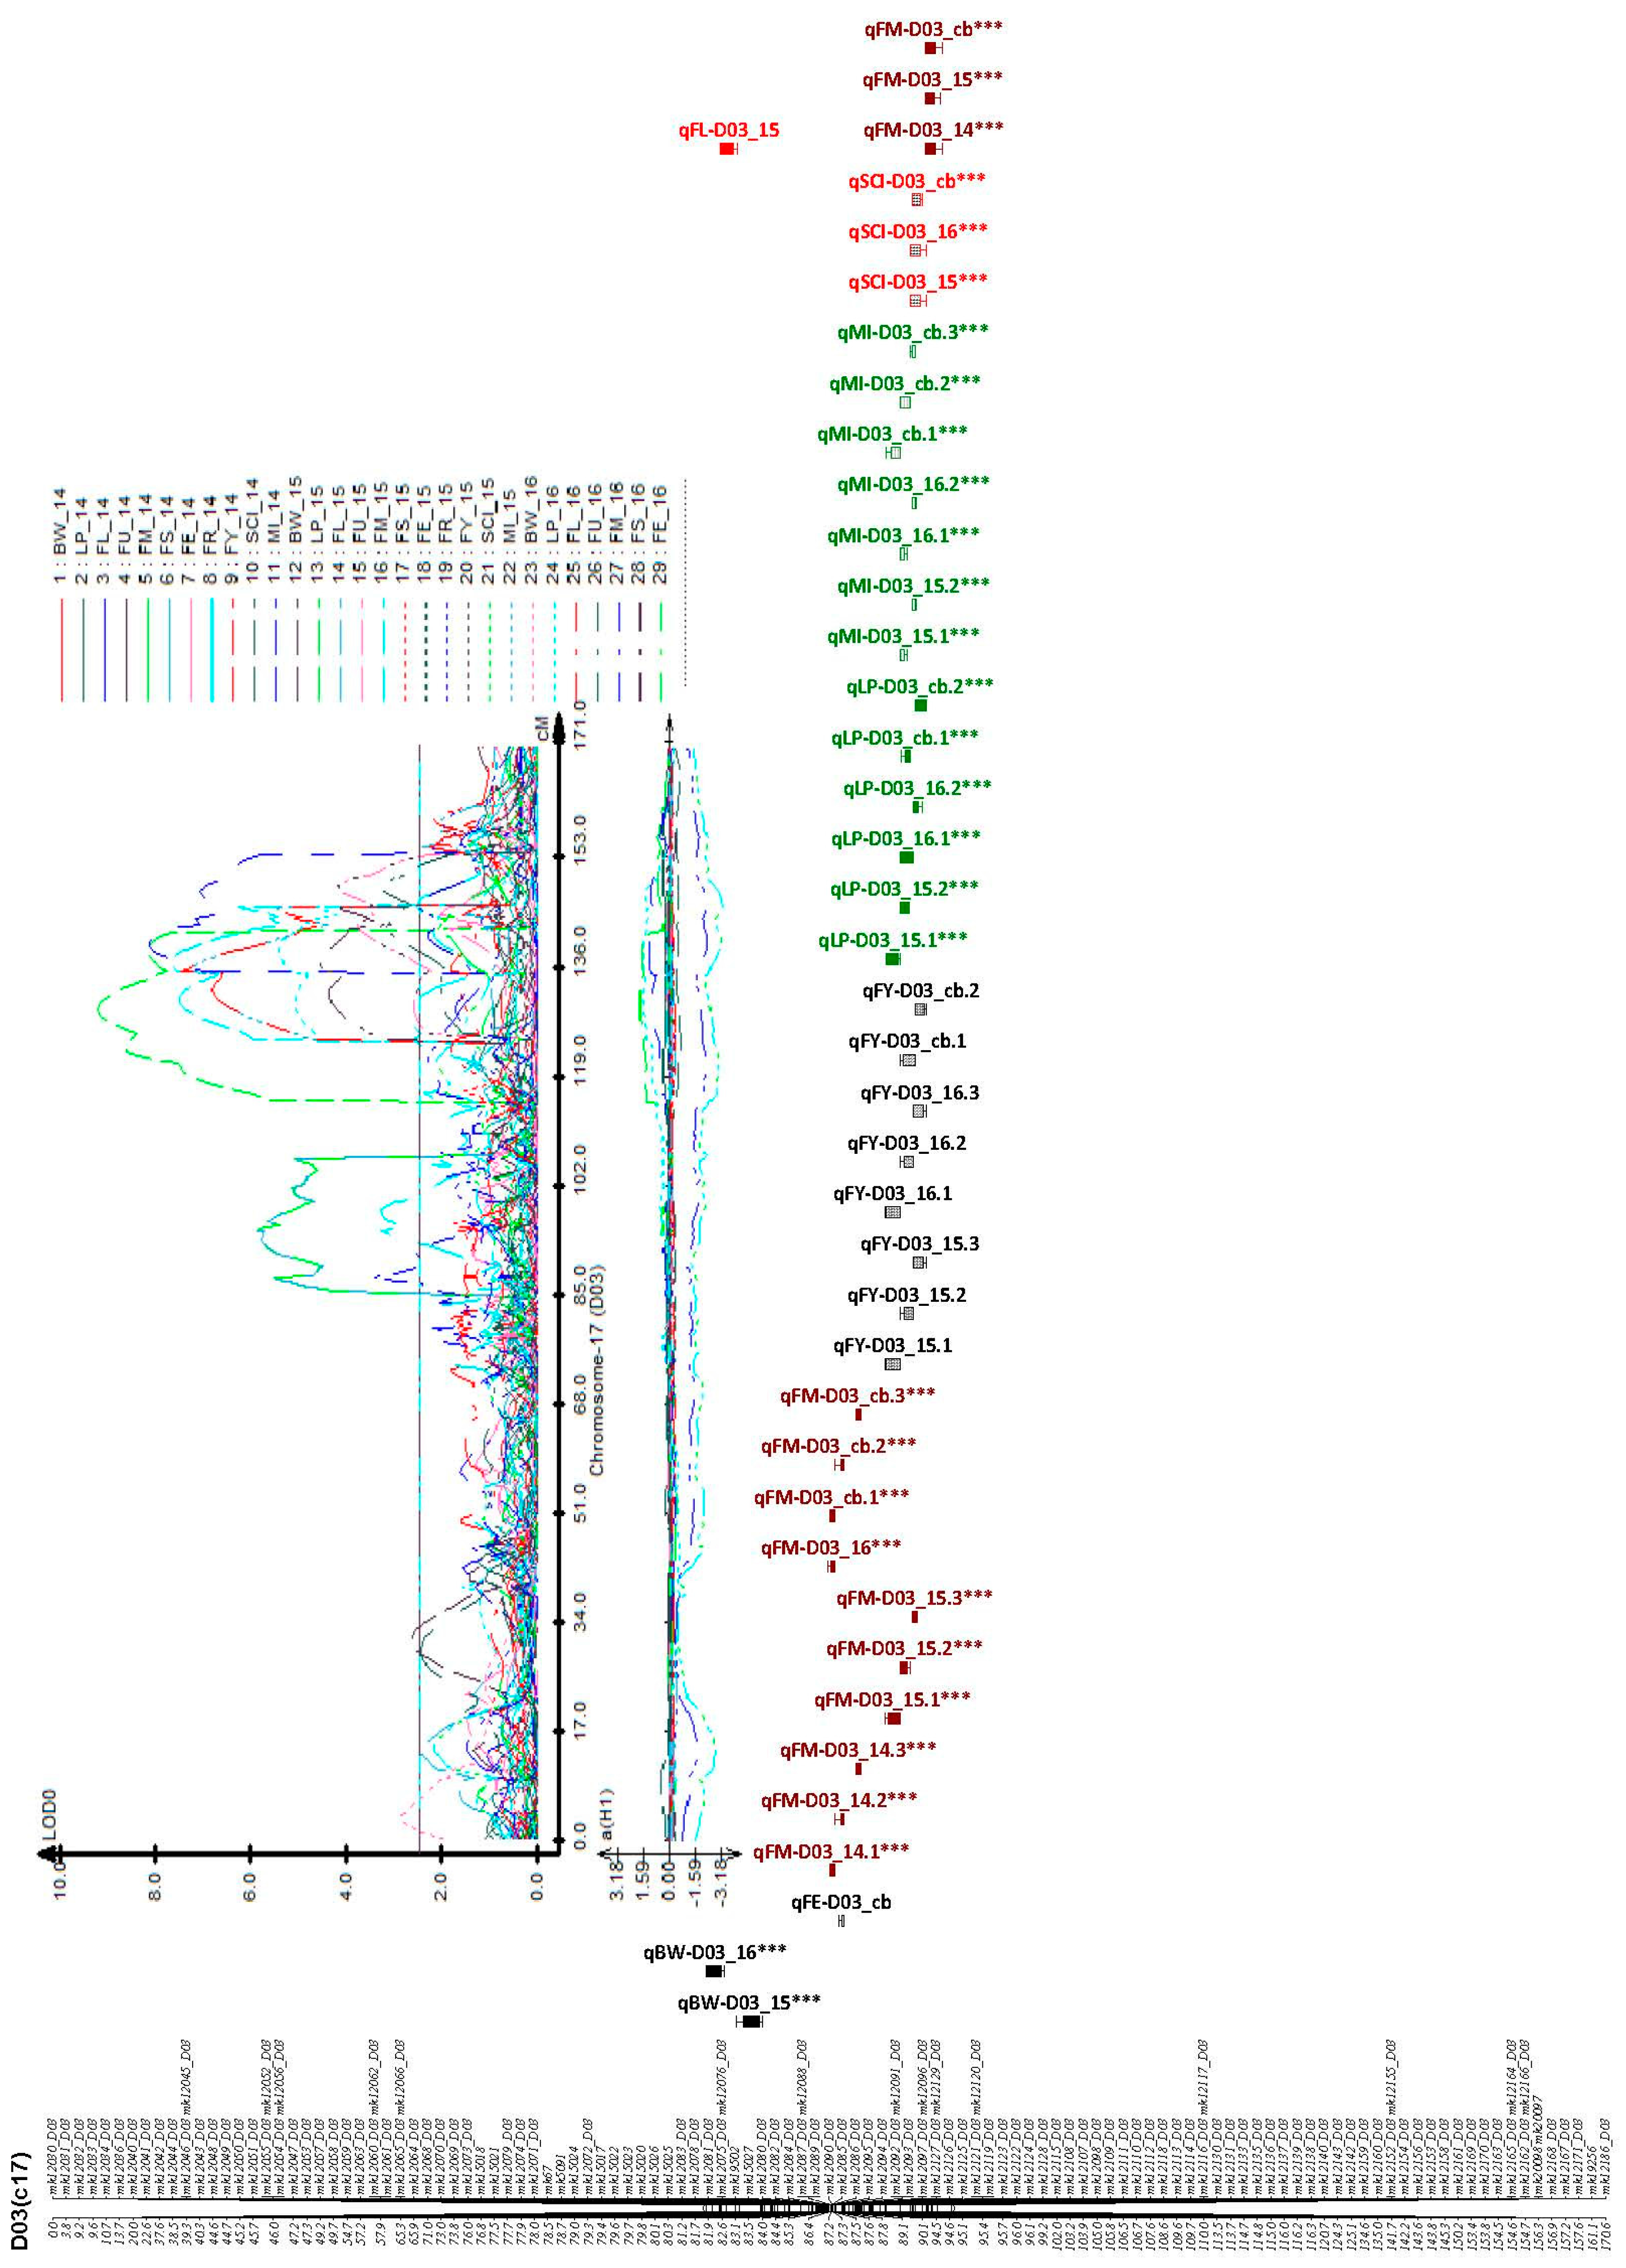
2.6. Identification of Consistent and Clustering QTLs for Yield Related and Fiber Quality Traits

Thirty (30) QTLs were consistent among all the 110 QTLs identified for 11 traits in at least two environments (Table 3 and Figure S1). The 30 consistent QTLs were located on 16 chromosomes; A02 (2), A03 (1), A05 (2), A09 (3), A10 (2), A12 (1), D01 (1), D02 (1), D03 (4), D04 (1), D05 (2), D08 (2), D10 (2), D11 (1), D12 (4), and D13 (1). The distribution of the QTLs within the identified chromosomes, exhibited multiple position as illustrated in Figure S1 and Table S2 and Table 3. Of the 30 detected QTLs, 11 were localized on At sub-genome while the remaining 19 were mapped on the Dt sub-genome. The contributions of the parents toward the QTLs: 19 QTLs were linked to the good fiber quality parent (CCRI35) while only 11 QTLs were contributed by the high yield fiber parent (NH). Only16 chromosomes out of 26 were found to harbor consistent QTLs for ten traits except MI (Mature Index) for yield-related and fiber quality (Table S2 and Table 3).
Four types of gene actions were revealed by the genetic effects of which one gene exhibited dominant effects (De), four partial dominances (PD), 20 over dominances (OD) and five additive effects (Ae). OD was observed for most of the traits in response to yield-related and fiber quality traits.
The highest percentage of phenotypic variance explained by a single QTL was 15.45%. The highest percentage of phenotypic variance was noted in lint percentage (LP), with a range of 10.03–15.46%. The distribution of the QTLs within the identified chromosomes, exhibited multiple positions in some chromosomes; A02, A03, A09, A10, D01, D03, D05, D08, D12, and D13 as illustrated in Table S2 and Table 3 and Figure S1. Moreover, a total of two important clusters with more than three traits per region, with high broad sense heritability and high percentage of phenotypic variation were identified as D03 (c17) and D12 (c26), which we designated as cluster 1 and cluster 2, respectively (Table 3, Figure 5 and Figure 6).

2.7. The Gene Ontology Enrichment Analysis Based on QTL Clusters

Based on phenotype variation and QTL frequency, Dt-sub genome of the whole tetraploid chromosomes, harbored the highest number of stable QTLs with the highest level of phenotypic variation. In lieu of this, chromosome 17 (D03) and chromosome 26 (D12) had two clusters with four QTLS in each. Within the two cluster regions, we were able to mine the putative genes which could be having a role in fiber and yield-related traits. In cluster 1 (Chr17, D03), 136 genes were obtained, in which 14 were found to be highly expressed based on the RNA sequence while in cluster 2 (Chr26, D12), a total of 1280 genes were mined, out of which 153 were highly expressed at various stages of fiber development, 5 DPA, 10 DPA, 20 DPA and 25 DPA.
Moreover, in order to identify the set of the most robust candidate genes for yield-related traits and fiber quality; we mainly focused on the 153 highly expressed genes as obtained from “TM-1”_RNA-seq data (available online: http://mascotton.njau.edu.cn). Out of 153 highly expressed genes, five showed high level of expression across the various stages of fiber development, and therefore, the five genes could be the potential candidate genes with greater roles in the regulation of various fiber traits Table S3. Furthermore, all the five genes were localized in different positions of the genome: one gene (Gh_D03G0889) was located in cluster 1 (D03 (Chr 17)) within the marker mk12119_D03 (30,535,745 bp) to marker mk12123_D03 (30,566,883 bp), the trait localized in this region was fiber micronaire (FM); while the other three genes: Gh_D12G0093, Gh_D12G0410, and Gh_D12G0435 were localized in cluster 2 (D12 (c26)) within the marker mk19853 (101,319 bp) to marker mk17913_D12 (13,479,261 bp), the trait localized in the genome region was fiber strength (FS). Finally, the fifth gene, Gh_D12G0969 was also mapped in cluster 2 (D12 (Chr 26)), from marker mk1009 (18,989 bp) to marker mk17992_D12 (37,732,030 bp), the trait localized in that area was fiber yellowness (FY). Based on the expression profile and GO functional annotation, these five genes were therefore found to be the most robust and possibly the putative candidate genes for fiber quality and yield related traits (Table S3, Figure 7 and Figure 8).
Based on GO enrichment analysis, the five highly up regulated genes were as follows: Gh_D03G0889 was mainly involved in molecular function and biological processes, such as, up regulation of translational elongation (GO: 0003746), poly-A RNA binding (GO: 0003723), ribosome receptor activity (GO: 0043022), hypusine anabolism (GO: 0008612), translation elongation factor (GO: 0003746), regulation of translation elongation (GO: 0045901) and regulation of translation termination (GO: 0045905). The second gene, Gh_D12G0093 was involved only in molecular function, protein amino acid binding (GO: 0005515). The third gene, Gh_D12G0410 was involved in all the GO functional annotation, in biological process, it was mainly involved in translation elongation (GO: 0006414), molecular function, it was mainly involved in translation elongation factor activity (GO: 0003746) and protein binding (GO: 0005515) while in cellular component, it was found to be involved in eukaryotic translation elongation factor 1 complex (GO: 0005853). The fourth gene, Gh_D12G0435, had no functional annotation, however it was found to function in nucleoside diphosphate kinase activity and the last gene, Gh_D12G0969, functions both in biological process and molecular function, nucleoside diphosphate kinase activity (GO: 0004550), nucleoside diphosphate phosphorylation (GO: 0006165), GTP biosynthetic process (GO: 0006183), UTP biosynthetic process (GO: 0006228), CTP biosynthetic process (GO: 0006241) and ATP binding (GO: 0005524). In relation to gene action analysis, the five putative and robust genes with direct role in fiber development in cotton were all contributed by the female parent, CCRI35, known for its superior fiber quality (Table S3 and Figure 7 and Figure 8). The five genes had similar sequences based on phylogenetic tree analysis; the same was affirmed by their expression profile and all from Dt-sub genome. High quality fiber attributes are highly linked to the D-genome of the diploid cotton such as G. barbadense, and being tetraploid cotton originated from the polyploidization of the A and D genomes of the diploid cotton.

3. Discussion

The determination of stable QTLs for superior agronomical traits and the construction of a high-resolution map are crucial for MAS. Several intra-specific genetic maps have been generated and used for QTL detection related to fiber and yield components [2]. Even though these maps have been used, they are limited in scope and accuracy due to huge marker intervals and narrow genome coverage. The greatest impediment in the construction of a high-resolution map in intraspecific crosses is due to low rate of polymorphism within G. hirsutum and the presence of fixed homozygous genetic blocks [11,25]. Therefore, there is a need to find additional markers to fill in the gaps in the genetic map [11]. In this current research, a genetic map consisting of 5178 SNP markers obtained through the GBS technique was developed using a 277 F2:3 population derived from an intra-specific cross. In addition, the contrasting difference between the two parental lines used in this investigation could be explained based on inherent genetic characteristics. The male parent is known for superior agronomic traits such as early flowering and the ability to generate a high percentage of fruits with large size, while the female parent is known for superior fiber traits. Fiber length (FL), fiber uniformity (FU), fiber micronaire (FM), and fiber strength (FS) showed significant differences between the two parental lines. These traits were attributed to CCRI35, except FE which was linked to NH. There was no significant difference noted between the two parents for FE and FM. This result confirmed the good quality fiber trait of the female parent, CCRI35, compared to the male, NH.
In addition, there was a wide range of phenotypic variation among the F2:3 population, with respects to the following measured traits: BW, LP, FL, FU, FM, FS, FE, FR, FY, SCI, and MI. In the three environments, all traits exhibited normal segregation patterns, with equal distribution. The low absolute values for skewness and kurtosis showed that these traits had normal distribution. In addition, in the F2:3 population, the maximum phenotypic data values in all the variables were much higher than in CCRI35, the parent known for superior fiber traits, fiber length (FL), fiber uniformity (FU), fiber micronaire (FM), fiber strength (FS), and fiber elongation (FE). This finding showed that all traits were transgressively segregated in the F2:3 population. Previous research reported that transgression was the difference observed between the mapping parents of upland cotton [11,26,27,28].
Furthermore, positive correlations were noted between the following traits: boll weight (BW) with fiber length (FL), fiber uniformity (FU), fiber micronaire (FM), fiber strength (FS), fiber elongation (FE), fiber reflectance (FR), and mature index (MI); lint percentage (LP) with FM, FL with FU, FS, FE, and spinning consistency index (SCI); FU with FS, FE, and SCI; FM with MI; FS with FE, and SCI; FE with SCI and finally FR with SCI. However negative correlations were observed in the following traits: LP with FR, and SCI; FL with FM; FM with FR, and SCI; finally, SCI with MI. This result is consistent with those from Jamshed et al. [11] which showed that positive correlations were observed between: fiber elongation (FE), fiber length (FL), fiber strength (FS), and fiber uniformity (FU), with a significance level of 0.01. Moreover, FL and FS were both negatively correlated with fiber micronaire (FM). In this study, the correlations between FM with and FS were found to be negative but were not significant, which does not agree with previous findings. This deviation could be attributed to the population background used in this study.
It is known that broad sense heritability with high percentage is more useful and very easy to manipulate in MAS. Therefore, the extent of transmission of traits from the parents to the descendants or offspring was determined by level of heritability, hence traits with high broad sense heritability could be easier to manipulate [29]. The broad sense heritability was high for LP (82.65%), FM (91.68%), FR ((86.08%), FY (88.89%), SCI (87.47%), and moderate for BW (68.92%), FL (61.66%), FU (76.42%), FS (76.54%), FE (60.58%), and MI (76.61%). The lowest broad sense heritability was noted for fiber elongation (FE), 60.58%. Similar findings were observed with Jamshed et al. (2016) who found that fiber elongation had the lowest broad sense heritability (27%), whereas other fiber traits were higher, ranging from 80% (FU) to 93% (FL) [11,28].
A total map distance of 4768.098 cM was generated, higher than the most current linkage map with a map distance of the 4450 cM of cotton genome [24]. This is the densest intra-specific map developed in upland cotton. This map could be helpful for further studies in MAS, especially in fine mapping. The average distance of the adjacent markers was 0.92 cM. At sub-genome spanned 2611.43 cM, and consisted of 3313 markers with 13 LGs. The average marker distance in At sub-genome was 0.79 cM with a maximum gap of 26.598 cM of the adjacent markers. In Dt sub-genome, 13 LGs were assigned which comprised of 1865 markers spanning 2156.67 cM, with an average of 1.156 cM. The maximum gap was 30.082 cM between adjacent loci. Due to the nature of upland cotton genome, mapping QTLs not only for fiber as in this research but for other agronomic traits has been difficult. This is because of the narrow genetic background, which resulted in low diversity of alleles with a significant role in fiber quality traits between two given varieties [30]. Therefore, only few QTLs could be mapped based on two parent crossing populations, which has been verified by previous reports [3,6,31,32,33,34,35,36,37,38,39]. In this current study, a total of 110 QTLs were identified for 11 traits, but only 30 QTLs were consistent in at least two environments. The 30 consistent QTLs were located on 16 chromosomes; A02, A03, A05, A09, A10, A12, D01, D02, D03, D04, D05, D08, D10, D11, D12, and D13 with 2, 1, 2, 3, 2, 1, 1, 1, 4, 1, 2, 2, 2, 1, 4, and 1 QTL respectively. Of the 30 detected QTLs, 11 were located on At sub-genome while the remaining 19 were located on the Dt sub-genome. This finding is consistent with previous reports in which 58 QTLs were found on the At sub-genome, whereas 107 QTLs were localized on the Dt sub-genome [11]. Fifty-eight QTLs were located on the At sub-genome (Chr01–Chr13), and 73 QTLs on the Dt sub-genome [25]. These QTLs explained from 2.03 to 16.85% of phenotypic variation, with an average of 6.26% explained in all five fiber quality traits [40].
Most of the QTLs distributed in the cotton genome revealed the complexity of the cotton genome and arduousness of QTL mapping in cotton. Therefore, comparing our QTLs with other QTLs mapped from previous studies could be of great help in determining the reliability of the QTLs detected [41]. Up to now, 4268 QTLs from 140 publications of cotton have been documented in the collected Cotton QTL Database (available online: http://www2.cottonqtldb.org:8081/index). In this study, the GBS-SNP markers are unique and thus lack common identity with the SSR-based markers. However, five QTL clusters in this investigation were found to have a common bearing to those documented by Said et al. [42], which have been known as one of the strongest references in QTL mapping in recent years. The five QTL clusters were: cluster A07 was identical to c7-cluster-Gh × Gb-4:55–79 cM; cluster A08 had an approximate position of 4.81–110.81 cM, which was similar to c8-cluster-Gh-2:21–31 cM; cluster D01, had an approximate position of 2.21–139.31 cM, similar to c15-cluster-Gh-3:49–68 cM; cluster D02, had an approximate position of 0.01–206.11 cM, similar to c14-cluster-Gh-2:76–91 cM and lastly cluster D08, had an approximate position of 100.71–208.61 cM, nearby to c24-cluster-Gh-2:41–62 cM. The high correlation of the QTLs detected in this study to the previous finding, provides the opportunity for the utilization of these QTLs in MAS to improve the fiber quality of Upland cotton.
Gene Ontology enrichment analysis revealed five genes with very high expression and were linked to three fiber quality traits, FM, FS, and FY. Interestingly, the five genes took their alleles from the parental line known for superior fiber quality CCRI35. This result supported our study. Our findings provide an opportunity in the improvement for fiber quality especially fiber color (FY: fiber yellowness). Cotton fiber development occurs through various stages, namely fiber initiation, elongation, secondary cell wall formation and maturation [43]. Cotton fiber development is controlled by a multi-complex of genes interactions rather than a single gene effect [44,45]. GhD12G0969 was mainly found to have a functional role in phosphorylation; phosphorylation is a process mediated by protein kinases to activate critical cellular pathways such as metabolism, cell division and cell differentiation during initiation stages in cotton fiber development [46]. In addition, Gh_D12G0435 was found to be involved in kinase activity; protein kinase activity plays an important role in signal transduction through the phosphorylation process during cotton fiber development [47]. Therefore, the five highly up regulated genes could possibly be the key genes with major functional roles in fiber development and in turn superior quality as evident in the CCRI35, female parent.

4. Materials and Methods

4.1. Plant Materials, Growth Conditions and Trait Data Collection

The accessions used in this research were, Nan Dan Ba Di Da Hua in Chinese annotation, but for simplicity, we abbreviated the name as (NH), the male parent; it has moderate fiber quality traits but high yielding in fiber [48,49]. The female parent was Zhong35, also with the Chinese name, was then abbreviated as CCRI35; it is known for high fiber quality traits but with moderate yield [9]. The parental lines and 277 F2:3 population were evaluated for fiber quality traits and yield components in Anyang research station (36°100′ N, 114°350′ E), Henan province, Yellow River. The field experiment was carried out during summer periods in three consecutive years, 2014, 2015 and 2016. The experimental layout adopted, was complete randomized block design (CRBD) with three replicates. The plot sizes were 5 m long with row spacing of 0.75 m. Fiber quality and yield component traits were collected following the laid down scheme as described by [41]. Fully opened bolls in each sampled plant were collected within the middle region of the plant, 25 bolls were collected from each line for fiber quality and yielded component determination. The balls were ginned for the determination of lint percentage (LP), fiber length (FL), fiber uniformity (FU), fiber micronaire (FM), fiber elongation (FE), fiber strength (FS), fiber reflectance (FR), fiber yellowness [50], spanning consistency index (SCI) and mature index (MI) by the HVI 900 fiber testing system, which was done in our cotton fiber quality testing unit, cotton research institute, Anyang, China. The test conditions were set with temperature at 20 °C and relative humidity of 65%.

4.2. Sample Collection, Library Preparation, Sequencing and SNP Genotyping

4.2.1. DNA Extraction, Quantification and Quality Determination

Fresh leaf samples were obtained from each line, together with the two parents and immediately frozen in liquid nitrogen then stored under −80 °C before DNA extraction. DNA of the F2:3 populations of 277 individuals and 10 samples for individual parents was extracted by the CTAB method as described by Paterson et al. [51]. Each sample was then crushed separately in liquid nitrogen to fine powder, then immediately added to CTAB solution. In every 100 mg ground tissues, we added 500 µL of CTAB Buffer. The samples were then shaken for 15 min then centrifuged. The centrifuged mixture was then put in a water bath at 60 °C for 30 min. Then, samples were centrifuged for 5 min at 12,000 revolutions per minute (rpm) for 5 min. After centrifuging, the supernatant transferred to a new tube. Then, 5 µL of RNase solution was added to digest RNA and then incubated for 20 min at 32 °C. Equal amount in volume of chloroform/isoamyl alcohol (24:1) was added then shaken for 5 s before centrifuging the samples for 1 min to separate the phases. We pippeted the aqueous upper phase to a new tube; the method was then redone until the upper phase was clear. The upper clear phase was then pipetted into a new tube. DNA samples were later precipitated by adding 70% by volume of ice-cold isopropanol and incubated for 15 min at −20 °C. The condensed DNA samples were then centrifuged at 12,000 rpm for 10 min. The supernatant was then decanted and subsequently washed with 500 µL ice cold 70% ethanol twice then absolute alcohol. DNAs were later dissolved in 20 µL TE buffer (10 mM Tris, pH 8, 1 mM EDTA) [52]. The degradation and contamination of DNA was checked through 1% agarose gels. The purity of DNA was determined by using a Nano Photometer® spectrophotometer (IMPLEN, Westlake Village, CA, USA). The ratio of absorbance at 260 and 280 nm was used to assess the purity of DNA. The DNA samples with the ratio of ~1.8 were then qualified as pure [53]. The concentration of DNA was done by using Qubit® DNA Assay Kit in Qubit® 2.0 Fluorimeter (Life Technologies, Carlsbad, CA, USA). The Qubit® dsDNA HS (High Sensitivity) Assay Kits make DNA quantitation easy and accurate. The kits contain concentrated assay reagent, dilution buffer, and prediluted DNA standards. The reagents were mixed with the buffer solution, and then added 1–20 μL of each DNA samples.
The concentrations were read using the Qubit® Fluorometer (Life Technologies, Carlsbad, CA, USA); only the DNA samples with concentration range of 10 pg/µL to 100 ng/µL were finally used (available online: https://tools.thermofisher.com/content/sfs/manuals/Qubit_dsDNA_HS_Assay_UG.pdf).

4.2.2. GBS Library Preparation, Sequencing and SNP Genotyping

GBS is a low cost and an efficient method of large-scale genotyping, which is based on high-throughput sequencing but with a reduced-representation library (RRL). The following were step by step processes in GBS technique; firstly, we carried out a GBS pre-design experiment to test the accuracy of the GBS protocol and quality of the output data. The enzymes and sizes of restriction fragments were examined by using training data. Three basic criteria were followed: (a) the suitability of the number of tags to the project needs; (b) the homogenous distribution of the enzymatic tags throughout the examined sequences; (c) elimination of redundant tags (repeated tags must be avoided). This was to ensure the effectiveness and accuracy of data obtained from GBS reads; 50 bp was the selection criterion to ensure sequence depth uniformity.
Secondly, we constructed the GBS library using the pre-designed scheme. The genomic DNA of the F2:3 population were incubated at 37 °C with MseI Restriction Enzyme obtained from New England BioLabs (Ipswich, MA, USA), NEB, T4 DNA ligase and ATP. MseI Y adapter N containing barcode. Restriction-ligation reactions were activated at 65 °C, followed by digestion for additional restriction enzyme NlaIII at a temperature of 37 °C. The samples were then purified by using Agencourt AMPure XP (Beckman, Brea, CA, USA). Then carried out polymerization chain reaction (PCR) using the purified samples, Phusion Master Mix universal primer and index primer were used to add index, complete i5 and i7 sequence. The Agencourt AMPure XP (Beckman) was used to purify the PCR products, which were pooled then ran through 2% agarose gels. Fragments with 375–400 bp (with indexes and adaptors) in size were obtained by using a Gel Extraction Kit (Qiagen, Hilden, Germany). The isolated fragment products were then purified using Agencourt AMPure XP (Beckman), and finally diluted for sequencing.
GBS analysis was strictly carried out as outlined by Elshire et al. (2011) [54]; integrating 3 of 96-well plates across 288 barcodes for library preparation and sequencing. For SNP calling, the raw sequence data for the 277 F2:3 population together with the F1generation was processed through the TASSEL 3.0 Genotype By Sequencing (GBS) pipeline [55] using the Gossypium_hirsutum_v1.1.fa as the reference genome [56] which was obtained from Cotton research institute (available online: http://mascotton.njau.edu.cn/info/1054/1118.htm), for alignment and the Burrows–Wheeler Aligner (BWA) mem [57] with default parameters. The output consisted of variant call format (VCF) file version 4.1 [58] including single nucleotide polymorphisms (SNPs) present in at least 40% of the progeny and with a minor allele frequency (MAF) 0.1. Subsequently, the data in variant call format (VCF) was filtered using VCF tools version.1.12a [58] and TASSEL [59] versions 3.0 and 4.0. A total of 93,384 single nucleotide polymorphisms (SNPs) were identified in 277 F2:3 population by TASSEL 3.0, then a custom filtering process was applied for alignment. The filtering was based on maintaining sites with a minimum read depth of 6% and 75% completeness by site across progeny and by progeny across sites. Results were obtained as a TASSEL hapmap file.
Finally, using a custom perl script marker heterozygous in the F1generations and with a co-dominant segregation ratio of 1:2:1 among the F2:3 population were identified using a chi-squared (χ2) goodness-of-fit test at α ≤ 0.01. These were reconverted and imported in JoinMap® 4.1 for linkage group generation. A total of 26 LGs were obtained, each linkage group was assigned to its corresponding chromosome by using BLASTN-search (available online: https://blast.ncbi.nlm.nih.gov/Blast.cgi), for the marker sequence.

4.3. Data Analysis and Linkage Map Construction

Analysis of variance (ANOVA) was performed by using field phenotype data of the three consecutive seasons 2014, 2015, 2016, and the combine analysis (cb). A mixed procedure was used; the genotypes and the environments were fixed as factors in order to detect the heritability [60]. Post hoc test (Turkey’s) to compare means was done [60]. The broad-sense heritability percentage, Hb (%), was calculated for each trait using the formula described by [61].
H = σ2G/σ2G + (σ2e/r)
With σ2G is the genotypic variance; σ2e: phenotypic variance and r: replication.
Most of the data were analyzed using R software version 3.4.2 (R Foundation for Statistical Computing, Vienna, Austria) [21]. Markers were ordered, rippled, and re-ordered according to pairwise recombination fractions, LOD scores and linkage group length [62]. Linkage group analyses were conducted using Join Map 4.0 [23] with a recombination frequency of 0.40 and a logarithm of odds (LOD) score of 2.5 for the F2:3 population. The Kosambi mapping function was employed in the conversion of the recombination frequencies to map distances. Each data point represented the mean of three replications. Fiber quality and yield-related traits such as boll weight (BW), lint percentage (LP), fiber length (FL), fiber uniformity (FU), fiber micronaire (FM), fiber strength (FS), fiber elongation (FE), fiber reflectance (FR), fiber yellowness (FY), spinning consistency index (SCI) and mature index (MI) were used to conduct QTL analysis. The quantitative trait loci (QTLs) were detected using composite interval mapping (CIM) [63] by WinQTL Cartographer version 2.5 [20]. In the CIM mapping method, version 6, forward–reverse regression method with 1 cM walking speed, a probability into and out of the model of p = 0.01 and window size set at 10 cM. The LOD [64] threshold value was determined by 1000 permutation tests for all traits and was used to declare the significant QTLs with a significance level of p = 0.05. In addition, QTLs with LOD threshold of 2.5 in more than one environment were considered as common QTLs based on the explanation by Lander and Kruglyak [65].
QTL nomenclature was done based on the description by Liang et al. [2]. The proportion of observed phenotypic variance explained by each QTL was estimated by the coefficient of determination R2 (%) as a percentage. The additive and dominance effects from QTL cartographer results were used to calculate genetic effects (|d/a|). The results were used to classify the QTL as additive effect (Ae) (0–0.20), partial dominant (PD) (0.21–0.80), dominant effect (De) (0.81–1.20) and over dominant (OD) >1.20 according to Stuber et al. (1987) [66]. The graphic presentation of the linkage group and QTLs marked were created by R software version 3.4.2 [21] and Map Chart 2.2 [67], respectively

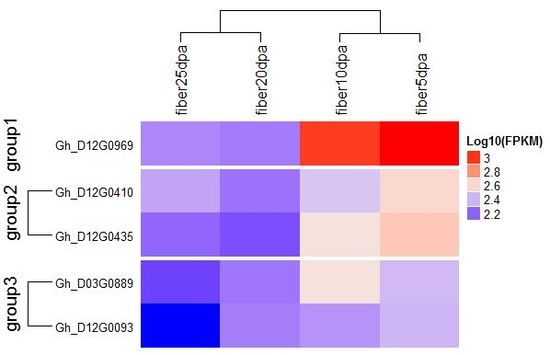
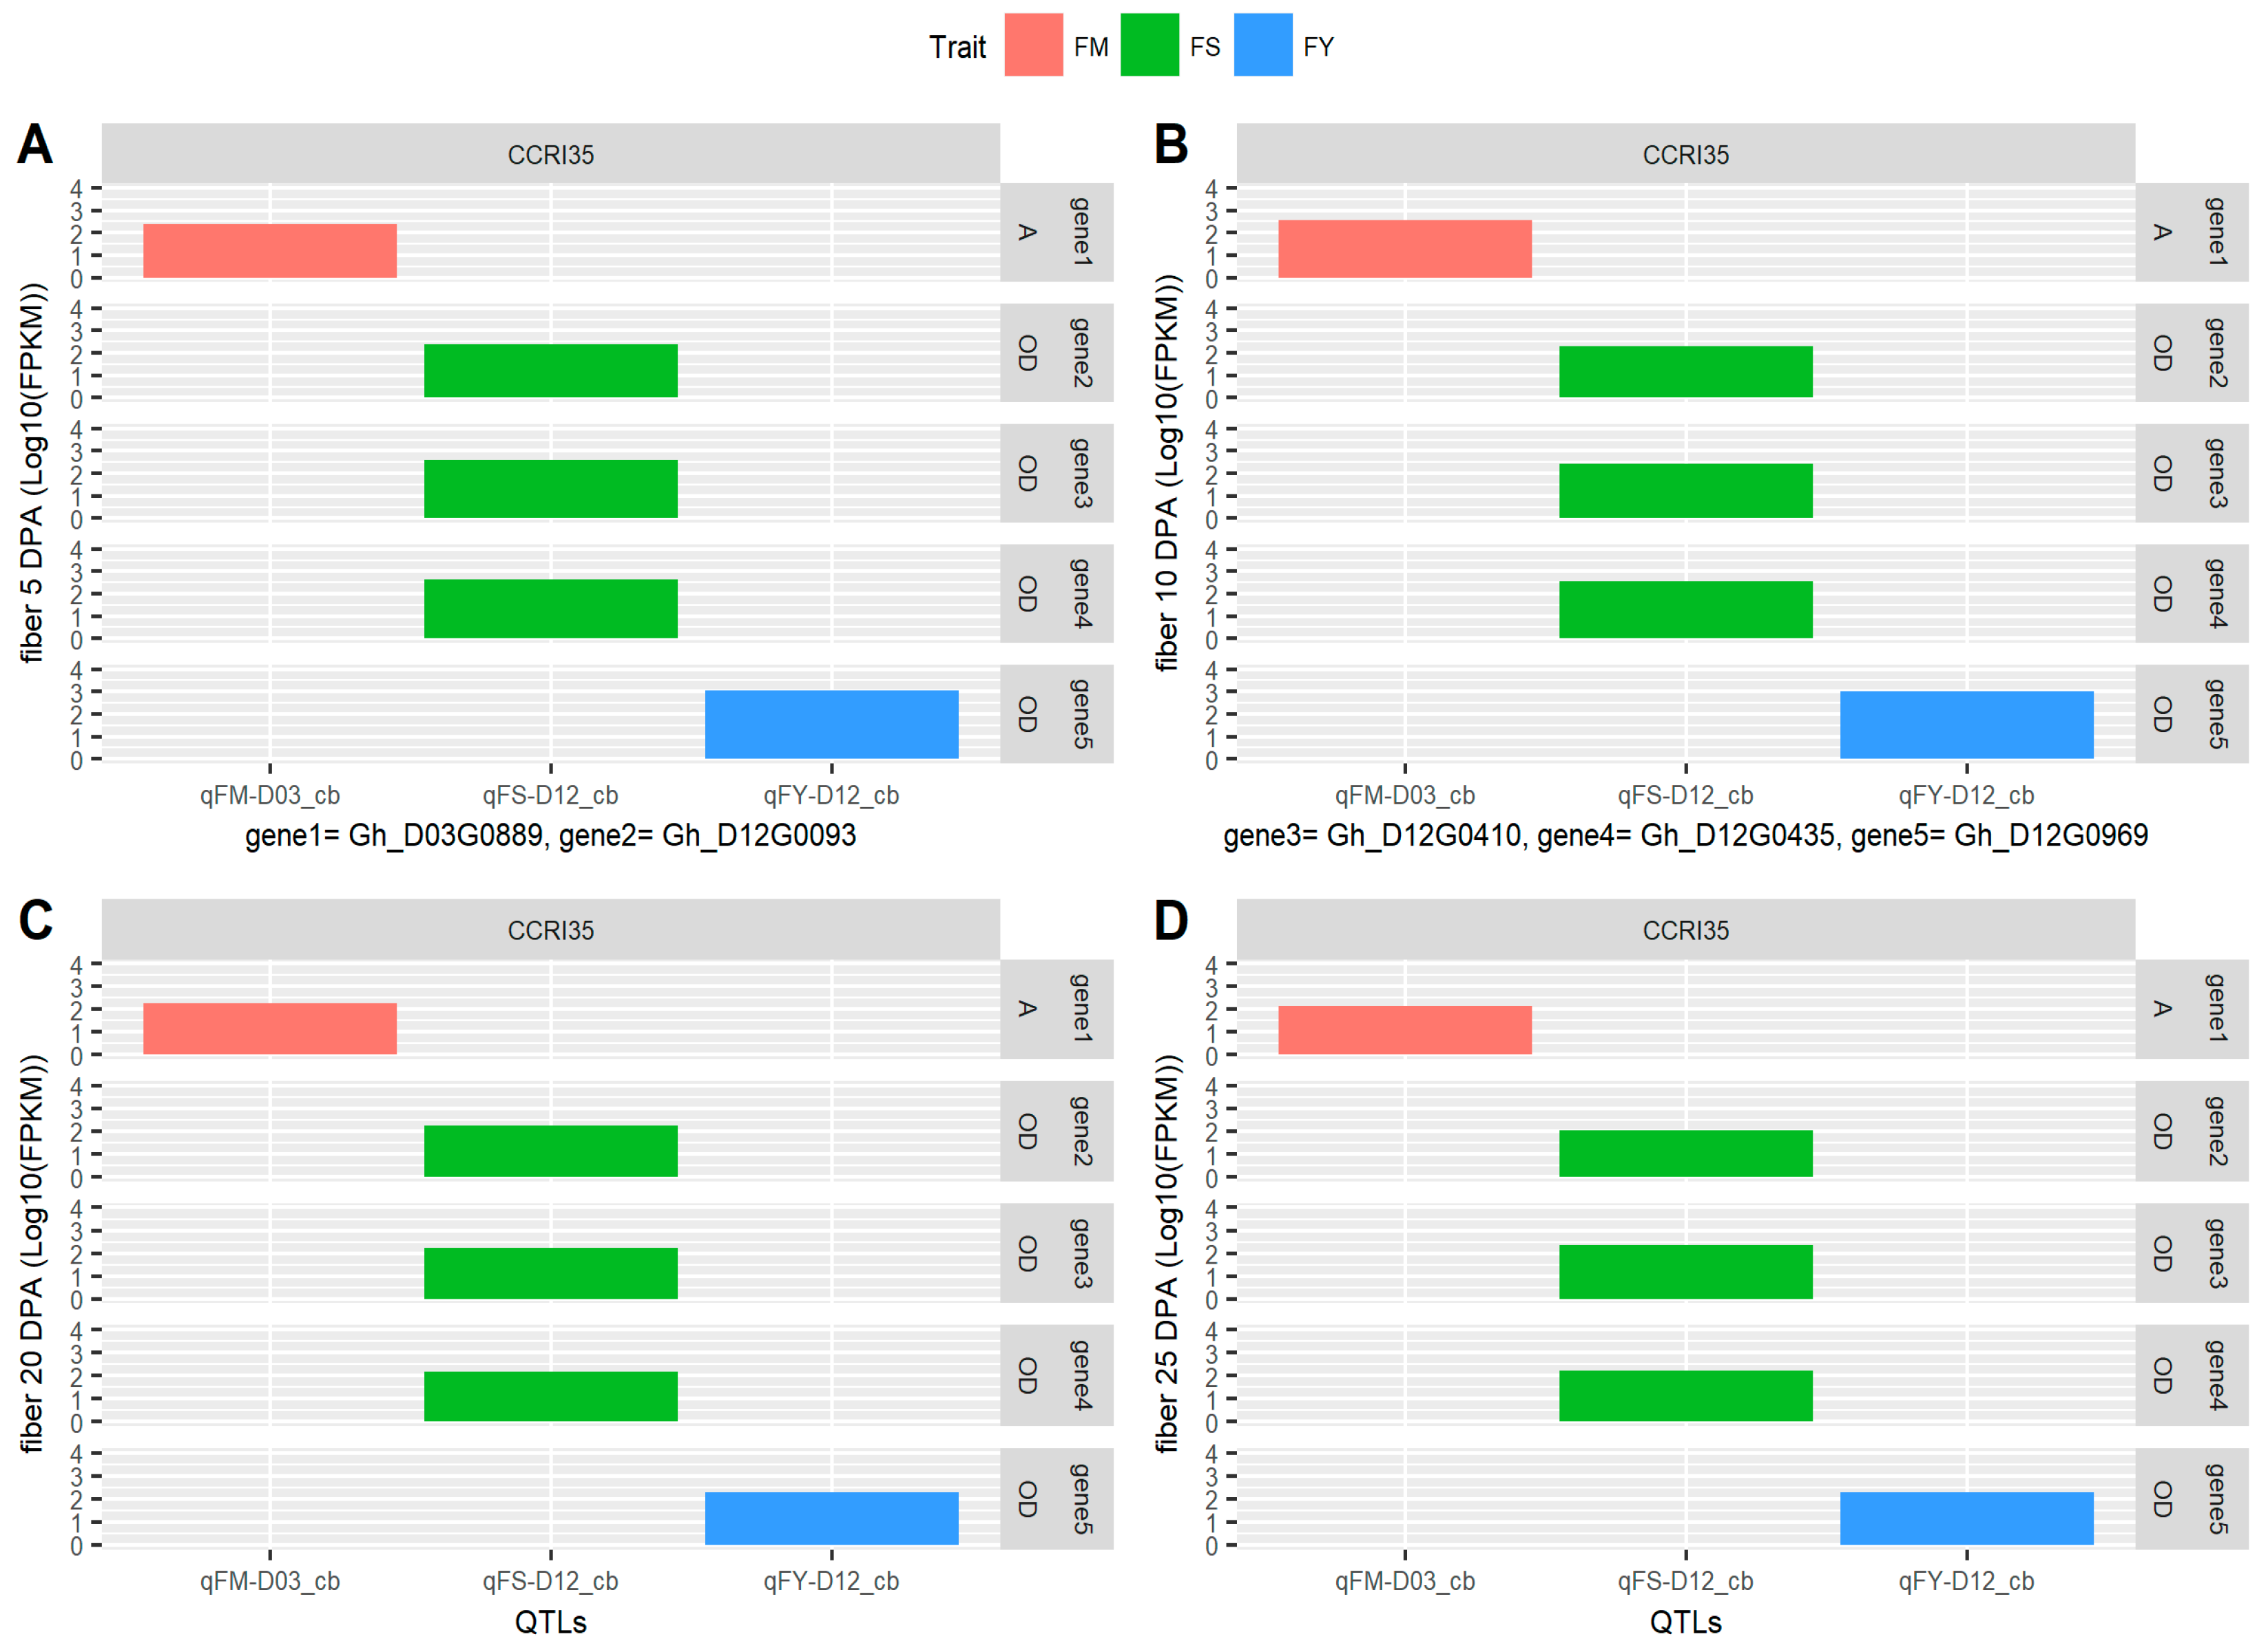
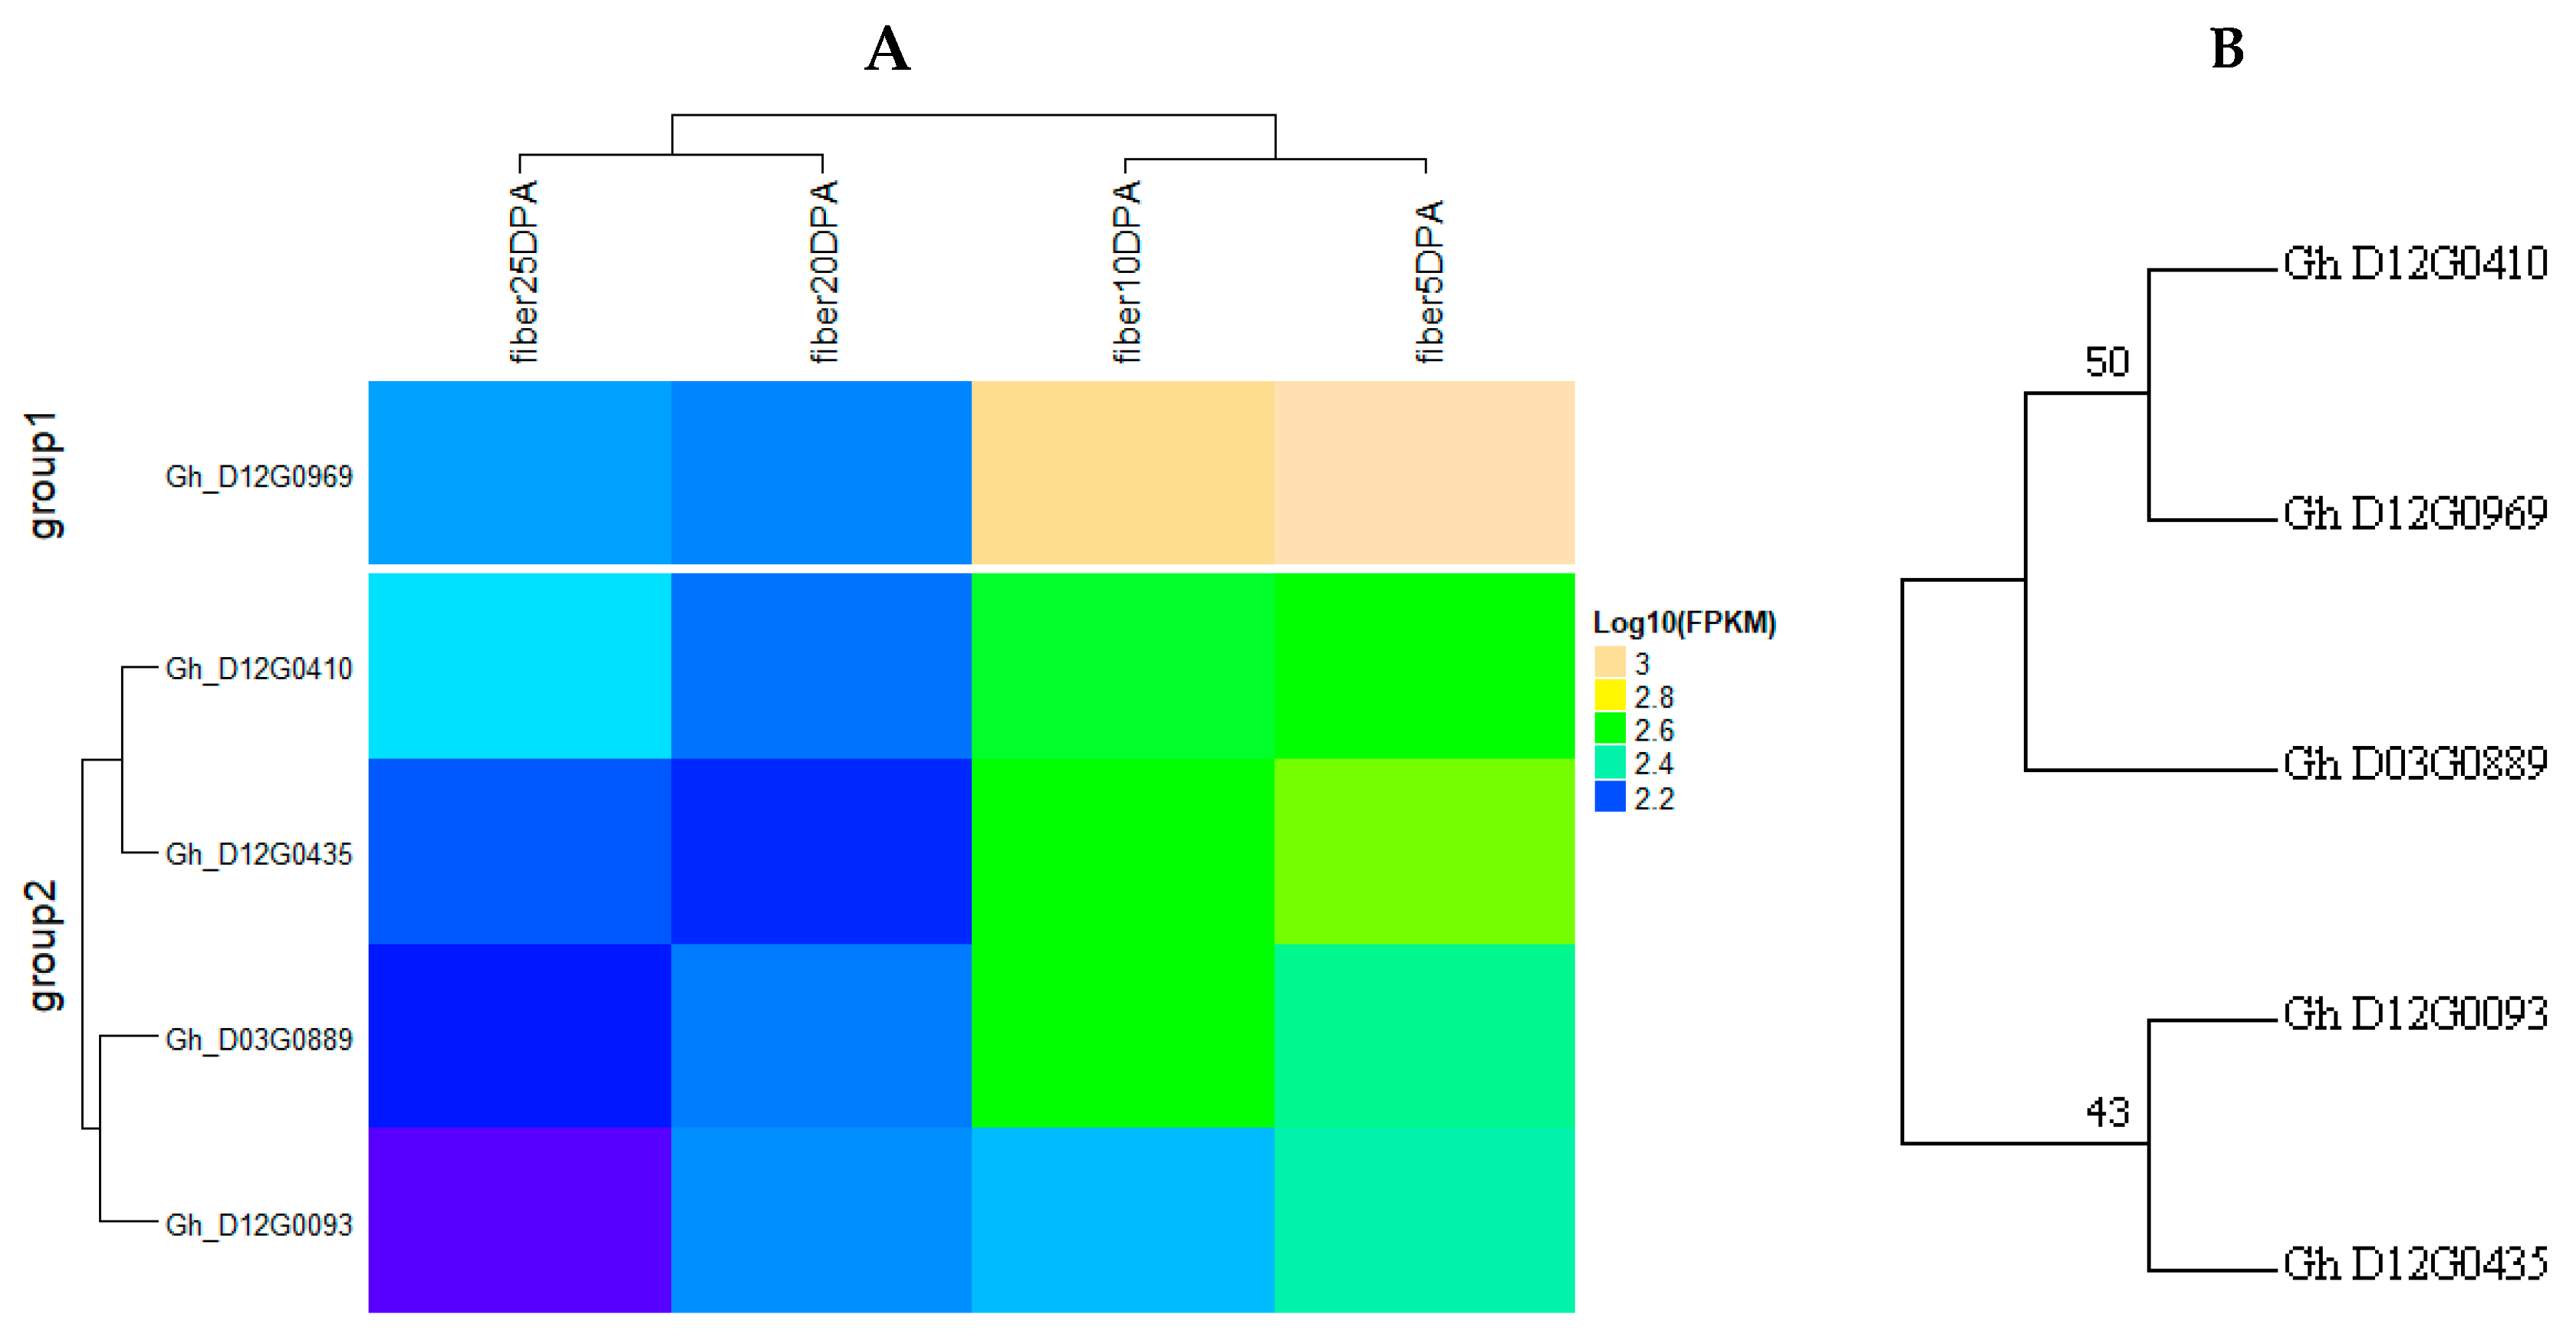
4.4. Gene Mining and Expression Analysis

In this study, only segments of linkage groups associated with significantly detected QTLs were presented. The detected consistent QTLs were used to identify the crucial candidate genes for fiber yield and fiber quality-related traits. The genes identified were searched through the available resources [68] (available online: https://cottonfgd.org). The physical position of the GBS-SNP markers flanking major QTLs for fiber quality and yield-related traits were used to find the gene located in each QTL region. The function of the identified genes was determined through gene annotation. Furthermore, the expression profile of the candidate genes was analyzed by mapping it in the “TM-1”_RNA-seq transcriptome data of cotton (available online: https://cottonfgd.org). The expression values for each gene mined were used to generate the heat map using R-software script [21].

4.5. The Gene Ontology Enrichment Analysis BaseD on QTL Clusters

In order to determine the functions of the identified genes, we carried out gene ontology enrichment analysis through online software, Blast2GO (available online: https://www.blast2go.com/). Gene ontology describes the genes in three functional annotations, namely cellular component (CC, biological process (BP) and molecular functions (MF); three functions provide information on the possible roles played by the genes in the plant; of interest were the genes responsible or fiber qualities and yield-related traits. The choice of genes used for GO analysis was based on the genes mined from the two clusters, cluster 1 (D03) and 2 (D12), which had high percentage of phenotypic variation (PV) and heritability (Hb).

5. Conclusions

A genetic linkage map comprising of 5178 SNP markers, obtained by the GBS genotyping method, was generated using a 277 F2:3 population derived from an intra-specific cross of two tetraploid upland cotton. The map constructed in this study is the highest dense genetic map ever developed from an intra-specific population of the tetraploid upland cotton. The average distance of 0.92 cM was observed between adjacent markers. A total of 110 QTLs were obtained for 11 traits, however, only 30 QTLs were consistent in more than one environment. In addition, we identified 1709 genes that were found in the two main hot spot regions, named as cluster 1 and 2, with four QTLs in each. Out of the 1709 genes, 153 genes exhibited higher expression levels while the rest showed lower expression levels in all stages of fiber development. We further identified five key genes: Gh_D03G0889, Gh_D12G0093, Gh_D12G0969, Gh_D12G0410, and Gh_D12G0435 to be the candidate genes involved in fiber development. This research provides the very first foundation in which future molecular work can be done, such as cloning of the identified genes and/or saturation of the genes to boost the current elite cultivated cotton cultivars.

Supplementary Materials

Supplementary materials can be found at https://www.mdpi.com/1422-0067/19/2/441/s1.

Acknowledgments

We thank Xiongming Du (Cotton Research Institute/Chinese Academy of Agricultural Science, Anyang, China), Wenfang Gong (Cotton Research Institute/Chinese Academy of Agricultural Science, Anyang, China), Shoupu He (Cotton Research Institute/Chinese Academy of Agricultural Science, Anyang, China), all our lab mates and friends for their helpful suggestion and useful comments on the manuscript.

Author Contributions

Conceived and designed the experiments: Xiongming Du, Wenfang Gong, Shoupu He, Zhaoe Pan, Latyr Diouf, Yin Hua Jia, Richard Odongo Magwanga and Joy Nyangasi Kirungu. Performed the experiments: Latyr Diouf. Analyzed the data: Latyr Diouf. Contributed reagents/materials/analysis tools: Xiongming Du and Zhaoe Pan. Wrote the paper: Latyr Diouf and Richard Odongo Magwanga.

Conflicts of Interest

The authors declare no conflict of interest.

Funding

This program was financially sponsored by the National Science and Technology Support Program of China (No. 68612014028) and the National Key R&D Program of China (2017YFD0101600). We are very grateful to the China Scholarship Council (CSC).

References

  1. Wang, K.; Wang, Z.; Li, F.; Ye, W.; Wang, J.; Song, G.; Yue, Z.; Cong, L.; Shang, H.; Zhu, S.; et al. The draft genome of a diploid cotton Gossypium raimondii. Nat. Genet. 2012, 44, 1098–1103. [Google Scholar] [CrossRef] [PubMed]
  2. Liang, Q.; Hu, C.; Hua, H.; Li, Z.; Hua, J. Construction of a linkage map and QTL mapping for fiber quality traits in upland cotton (Gossypium hirsutum L.). Chin. Sci. Bull. 2013, 58, 3233–3243. [Google Scholar] [CrossRef]
  3. Kohel, R.J.; Yu, J.; Park, Y.H. Molecular mapping and characterization of traits controlling fiber quality in cotton. Euphytica 2001, 121, 163–172. [Google Scholar] [CrossRef]
  4. Lokhande, S.; Reddy, K.R. Quantifying Temperature Effects on Cotton Reproductive Efficiency and Fiber Quality. Agron. J. 2014, 106, 1275–1282. [Google Scholar] [CrossRef]
  5. Zhang, Z.S.; Li, X.B.; Xiao, Y.H. Combining ability and heterosis between high strength lines and transgenic Bt (Bacillus thuringiensis) bollworm-resistant lines in upland cotton (Gossypium hirsutum L.). Agric. Sci. China 2003, 2, 13–18. [Google Scholar]
  6. Shen, X.; Guo, W.; Lu, Q. Genetic mapping of quantitative trait loci for fiber quality and yield trait by RIL approach in upland cotton. Euphytica 2007, 155, 371–380. [Google Scholar] [CrossRef]
  7. Yu, J.; Zhang, K.; Li, S.; Yu, S.; Zhai, H.; Wu, M.; Li, X.; Fan, S.; Song, M.; Yang, D.; et al. Mapping quantitative trait loci for lint yield and fiber quality across environments in a Gossypium hirsutum × Gossypium barbadense backcross inbred line population. Theor. Appl. Genet. 2013, 126, 275–287. [Google Scholar] [CrossRef] [PubMed]
  8. Shang, L.; Liang, Q.; Wang, Y.; Wang, X.; Wang, K.; Abduweli, A.; Ma, L.; Cai, S.; Hua, J. Identification of stable QTLs controlling fiber traits properties in multi-environment using recombinant inbred lines in Upland cotton (Gossypium hirsutum L.). Euphytica 2015, 205, 877–888. [Google Scholar] [CrossRef]
  9. Tan, Z.Y.; Fang, X.M.; Tang, S.Y.; Zhang, J.; Liu, D.J.; Teng, Z.H.; Li, L.; Ni, H.; Zheng, F.; Liu, D.; et al. Genetic map and QTL controlling fiber quality traits in upland cotton (Gossypium hirsutum L.). Euphytica 2015, 203, 615–628. [Google Scholar] [CrossRef]
  10. Collard, B.C.Y.; Mackill, D.J. Marker-assisted selection: An approach for precision plant breeding in the twenty-first century. Philos. Trans. R. Soc. B Biol. Sci. 2008, 363, 557–572. [Google Scholar] [CrossRef] [PubMed]
  11. Jamshed, M.; Jia, F.; Gong, J.; Palanga, K.K.; Shi, Y.; Li, J.; Shang, H.; Liu, A.; Chen, T.; Zhang, Z.; et al. Identification of stable quantitative trait loci (QTLs) for fiber quality traits across multiple environments in Gossypium hirsutum recombinant inbred line population. BMC Genom. 2016, 17, 197. [Google Scholar] [CrossRef] [PubMed]
  12. Yu, Y.; Yuan, D.; Liang, S. Genome structure of cotton revealed by a genome-wide SSR genetic map constructed from a BC1 population between Gossypium hirsutum and G. barbadense. BMC Genom. 2011, 12, 15. [Google Scholar] [CrossRef] [PubMed]
  13. Meuwissen, T.H.E.; Hayes, B.J.; Goddard, M.E. Prediction of total genetic value using genome-wide dense marker maps. Genetics 2001, 157, 1819–1829. [Google Scholar] [PubMed]
  14. Davey, J.W.; Hohenlohe, P.A.; Etter, P.D.; Boone, J.Q.; Catchen, J.M.; Blaxter, M.L. Genome-wide genetic marker discovery and genotyping using next-generation sequencing. Nat. Rev. Genet. 2011, 12, 499–510. [Google Scholar] [CrossRef] [PubMed]
  15. Huang, X.; Kurata, N.; Wei, X.; Wang, Z.-X.; Wang, A.; Zhao, Q.; Zhao, Y.; Liu, K.; Lu, H.; Li, W.; et al. A map of rice genome variation reveals the origin of cultivated rice. Nature 2012, 490, 497–501. [Google Scholar] [CrossRef] [PubMed]
  16. Xu, X.; Liu, X.; Ge, S.; Jensen, J.D.; Hu, F.; Li, X.; Dong, Y.; Gutenkunst, R.N.; Fang, L.; Huang, L.; et al. Resequencing 50 accessions of cultivated and wild rice yields markers for identifying agronomically important genes. Nat. Biotechnol. 2012, 30, 105–111. [Google Scholar] [CrossRef] [PubMed]
  17. Spindel, J.; Wright, M.; Chen, C.; Cobb, J.; Gage, J.; Harrington, S.; Lorieux, M.; Ahmadi, N.; McCouch, S. Bridging the genotyping gap: Using genotyping by sequencing (GBS) to add high-density SNP markers and new value to traditional bi-parental mapping and breeding populations. Theor. Appl. Genet. 2013, 126, 2699–2716. [Google Scholar] [CrossRef] [PubMed]
  18. Thomson, M.J.; Zhao, K.; Wright, M.; McNally, K.; Rey, J.; Tung, C.W.; Reynolds, A.; Scheffler, B.; Eizenga, G.; McClung, A.K.H.; et al. High-throughput single nucleotide polymorphism genotyping for breeding applications in rice using the BeadXpress platform. Mol. Breed. 2012, 29, 875–886. [Google Scholar] [CrossRef]
  19. Poland, J.A.; Rife, T.W. Genotyping-by-sequencing for plant breeding and genetics. Plant Genome 2012, 5, 92–102. [Google Scholar] [CrossRef]
  20. Wang, S.; Zeng, Z.B. Department of Statistics; North Carolina State University: Raleigh, NC, USA, 2007. [Google Scholar]
  21. R Development Core Team. R: A Language and Environment for Statistical Computing; R Foundation for Statistical Computing: Vienna, Austria, 2008. [Google Scholar]
  22. Li, F.; Fan, G.; Lu, C.; Xiao, G.; Zou, C.; Kohel, R.J.; Ma, Z.; Shang, H.; Ma, X.; Wu, J.; et al. Genome sequence of cultivated Upland cotton (Gossypium hirsutum TM-1) provides insights into genome evolution. Nat. Biotechnol. 2015, 33, 524–530. [Google Scholar] [CrossRef] [PubMed]
  23. Stam, P.; van Ooijen, J.W. JoinMap™ Version 2.0: Software for the Calculation of Genetic Linkage Maps; Plant Research International B.V. and Kyazma B.V.: Wageningen, The Netherlands, 1995; CPRO-DLO: Wageningen, The Netherlands, 1995. [Google Scholar]
  24. Rong, J.; Abbey, C.; Bowers, J.E. A 3347-locus genetic recombination map of sequence-tagged sites reveals features of genome organization, transmission and evolution of cotton (Gossypium). Genet. Mol. Biol. 2004, 166, 389–417. [Google Scholar] [CrossRef]
  25. Fang, D.D.; Jenkins, J.N.; Deng, D.D.; McCarty, J.C.; Li, P.; Wu, J. Quantitative trait loci analysis of fiber quality traits using a random-mated recombinant inbred population in Upland cotton (Gossypium hirsutum L.). BMC Genom. 2014, 15, 397. [Google Scholar] [CrossRef] [PubMed]
  26. Wang, K.; Wang, H.; Huang, C.; Guo, H.; Li, X.; Zhao, W.; Dai, B.; Yan, Z.; Lin, Z. QTL Mapping for Fiber and Yield Traits in Upland Cotton under Multiple Environments. PLoS ONE 2015, 10, e0130742. [Google Scholar] [CrossRef] [PubMed]
  27. Oluoch, G.; Zheng, J.; Wang, X.; Khan, M.K.R.; Zhou, Z.; Cai, X.; Wang, C.; Wang, Y.; Li, X.; Wang, H.; et al. QTL mapping for salt tolerance at seedling stage in the interspecific cross of Gossypium tomentosum with Gossypium hirsutum. Euphytica 2016, 209, 223–235. [Google Scholar] [CrossRef]
  28. Lacape, J.-M.; Llewellyn, D.; Jacobs, J.; Arioli, T.; Becker, D.; Calhoun, S.; Al-Ghazi, Y.; Liu, S.; Palaï, O.; Georges, S.; et al. Meta-analysis of cotton fiber quality QTLs across diverse environments in a Gossypium hirsutum x G. barbadense RIL population. BMC Plant Biol. 2010, 10, 132. [Google Scholar] [CrossRef] [PubMed] [Green Version]
  29. Saba, J.; Moghaddam, M.; Ghassemi, K.; Nishabouri, M.R. Genetic properties of drought resistance indices. J. Agric. Sci. Technol. 2001, 3, 43–49. [Google Scholar]
  30. Shao, Q.; Zhang, F.; Tang, S.; Liu, Y.; Fang, X.; Liu, D.; Liu, D.; Zhang, J.; Teng, Z.; Paterson, A.H.; et al. Identifying QTL for fiber quality traits with three upland cotton (Gossypium hirsutum L.) populations. Euphytica 2014, 198, 43–58. [Google Scholar] [CrossRef]
  31. Lin, Z.; He, D.; Zhang, X.; Nie, Y.; Guo, X.; Feng, C.; Stewart, J.M. Linkage map construction and mapping QTL for cotton fibre quality using SRAP, SSR and RAPD. Plant Breed. 2005, 124, 180–187. [Google Scholar] [CrossRef]
  32. Shen, X.L.; Guo, W.Z.; Zhu, X.F.; Yuan, Y.L.; Yu, J.Z.; Kohel, R.J.; Zhang, T.Z. Molecular mapping of QTLs for fiber qualities in three diverse lines in Upland cotton using SSR markers. Mol. Breed. 2005, 15, 169–181. [Google Scholar] [CrossRef]
  33. Zhang, Z.-S.; Xiao, Y.-H.; Luo, M.; Li, X.-B.; Luo, X.-Y.; Hou, L.; Li, D.-M.; Pei, Y. Construction of a genetic linkage map and QTL analysis of fiber-related traits in upland cotton (Gossypium hirsutum L.). Euphytica 2005, 144, 91–99. [Google Scholar] [CrossRef]
  34. Zhang, Z.-S.; Hu, M.-C.; Zhang, J.; Liu, D.-J.; Zheng, J.; Zhang, K.; Wang, W.; Wan, Q. Construction of a comprehensive PCR-based marker linkage map and QTL mapping for fiber quality traits in upland cotton (Gossypium hirsutum L.). Mol. Breed. 2009, 24, 49–61. [Google Scholar] [CrossRef]
  35. Wang, B.H.; Guo, W.Z.; Zhu, X.F.; Wu, Y.T.; Huang, N.T.; Zhang, T. QTL mapping of fiber quality in an elite hybrid derived-RIL population of upland cotton. Euphytica 2006, 152, 367–378. [Google Scholar] [CrossRef]
  36. He, D.H.; Lin, Z.X.; Zhang, X.L.; Nie, Y.C.; Guo, X.P.; Zhang, Y.X.; Li, W. QTL mapping for economic traits based on a dense genetic map of cotton with PCR-based markers using the interspecific cross of Gossypium hirsutum × Gossypium barbadense. Euphytica 2007, 153, 181–197. [Google Scholar] [CrossRef]
  37. Rong, J.; Feltus, F.A.; Waghmare, V.N.; Pierce, G.J.; Chee, P.W.; Draye, X.; Saranga, Y.; Wright, R.J.; Wilkins, T.A.; May, O.L.; et al. Meta-analysis of polyploidy cotton QTL shows unequal contributions of subgenomes to a complex network of genes and gene clusters implicated in lint fiber development. Genetics 2007, 176, 2577–2588. [Google Scholar] [CrossRef] [PubMed]
  38. Ma, X.; Ding, Y.; Zhou, B.; Guo, W.; Lv, Y.; Zhu, X.; Zhang, T. QTL mapping in A-genome diploid Asiatic cotton and their congruence analysis with AD-genome tetraploid cotton in genus Gossypium. J. Genet. Genom. 2008, 35, 751–762. [Google Scholar] [CrossRef]
  39. Sun, F.-D.; Zhang, J.-H.; Wang, S.-F.; Gong, W.-K.; Shi, Y.-Z.; Liu, A.-Y.; Li, J.-W.; Gong, J.-W.; Shang, H.-H.; Yuan, Y.-L. QTL mapping for fiber quality traits across multiple generations and environments in upland cotton. Mol. Breed. 2012, 30, 569–582. [Google Scholar] [CrossRef]
  40. Zhang, S.W.; Zhu, X.F.; Feng, L.C.; Gao, X.; Yang, B.; Zhang, T.Z.; Zhou, B.L. Mapping of fiber quality QTLs reveals useful variation and footprints of cotton domestication using introgression lines. Sci. Rep. 2016, 6, 31954. [Google Scholar] [CrossRef] [PubMed]
  41. Wang, H.; Huang, C.; Zhao, W.; Dai, B.; Shen, C.; Zhang, B.; Li, D.; Lin, Z. Identification of QTL for Fiber Quality and Yield Traits Using Two Immortalized Backcross Populations in Upland Cotton. PLoS ONE 2016, 11, e0166970. [Google Scholar] [CrossRef] [PubMed]
  42. Said, J.I.; Lin, Z.; Zhang, X.; Song, M.; Zhang, J. A comprehensive meta QTL analysis for fiber quality, yield, yield related and morphological traits, drought tolerance, and disease resistance in tetraploid cotton. BMC Genom. 2013, 14, 776. [Google Scholar] [CrossRef] [PubMed]
  43. Tiwari, S.C.; Wilkins, T.A. Cotton (Gossypium hirsutum) Seed Trichomes Expand via Diffuse Growing Mechanism. Can. J. Bot. Rev. Can. Bot. 1995, 73, 746–757. [Google Scholar] [CrossRef]
  44. Guan, X.; Lee, J.J.; Pang, M.; Shi, X.; Stelly, D.M.; Chen, Z.J. Activation of Arabidopsis Seed Hair Development by Cotton Fiber-Related Genes. PLoS ONE 2011, 6, e21301. [Google Scholar] [CrossRef] [PubMed]
  45. Pu, L.; Li, Q.; Fan, X.; Yang, W.; Xue, Y. The R2R3 MYB Transcription Factor GhMYB109 Is Required for Cotton Fiber Development. Genetics 2008, 180, 811–820. [Google Scholar] [CrossRef] [PubMed]
  46. Ma, Q.; Wu, M.; Pei, W.; Li, H.; Li, X.; Zhang, J.; Yu, J.; Yu, S. Quantitative phosphoproteomic profiling of fiber differentiation and initiation in a fiberless mutant of cotton. BMC Genom. 2014, 15, 466. [Google Scholar] [CrossRef] [PubMed]
  47. Chaudhary, B.; Hovav, R.; Rapp, R.; Verma, N.; Udall, J.A.; Wendel, J.F. Global Analysis of Gene Expression in Cotton Fibers from Wild and Domesticated Gossypium barbadense. Evol. Dev. 2008, 10, 567–582. [Google Scholar] [CrossRef] [PubMed]
  48. Peng, Z.; He, S.; Gong, W.; Sun, J.; Pan, Z.; Xu, F.; Lu, Y.; Du, X. Comprehensive analysis of differentially expressed genes and transcriptional regulation induced by salt stress in two contrasting cotton genotypes. BMC Genom. 2014, 15, 760. [Google Scholar] [CrossRef] [PubMed]
  49. Gong, W.; Xu, F.; Sun, J.; Peng, Z.; He, S.; Pan, Z.; Du, X. iTRAQ-Based Comparative Proteomic Analysis of Seedling Leaves of Two Upland Cotton Genotypes Differing in Salt Tolerance. Front. Plant Sci. 2017, 8, 2113. [Google Scholar] [CrossRef] [PubMed]
  50. Socquet-Juglard, D.; Christen, D.; Devenes, G.; Gessler, C.; Duffy, B.; Patocchi, A. Mapping Architectural, Phenological, and Fruit Quality QTLs in Apricot. Plant Mol. Biol. Rep. 2013, 31, 387–397. [Google Scholar] [CrossRef]
  51. Paterson, A.H.; Brubaker, C.; Wendel, J.F. A rapid method for extraction of cotton (Gossypium spp.) genomic DNA suitable for RFLP or PCR analysis. Plant Mol. Biol. Rep. 1993, 11, 122–127. [Google Scholar] [CrossRef]
  52. Krizman, M.; Jakse, J.; Baricevic, D.; Javornik, B.; Prosek, M. Robust CTAB-activated charcoal protocol for plant DNA extraction. Acta Agric. Slov. 2006, 87, 427–433. [Google Scholar]
  53. Wilfinger, W.W.; Chomczynski, M.K. P 260/280 and 260/230 Ratios NanoDrop ® ND-1000 and ND-8000 8-Sample Spectrophotometers. BioTechniques 1997, 22, 474–481. [Google Scholar] [PubMed]
  54. Elshire, R.J.; Glaubitz, J.C.; Sun, Q.; Poland, J.A.; Kawamoto, K.; Buckler, E.S.; Mitchell, S.E. A robust, simple genotyping-by-sequencing (GBS) approach for high diversity species. PLoS ONE 2011, 6, e19379. [Google Scholar] [CrossRef] [PubMed]
  55. Glaubitz, J.C.; Casstevens, T.M.; Lu, F.; Harriman, J.; Elshire, R.J.; Sun, Q.; Buckler, E.S. TASSEL-GBS: A High Capacity Genotyping by Sequencing Analysis Pipeline. PLoS ONE 2014, 9, e90346. [Google Scholar] [CrossRef] [PubMed]
  56. Paten, B.; Novak, A.; Haussler, D. Mapping to a Reference Genome Structure. arXiv, 2014; arXiv:1404.5010. [Google Scholar]
  57. Li, H.; Durbin, R. Fast and accurate short read alignment with Burrows-Wheeler transform. Bioinformatics 2009, 25, 1754–1760. [Google Scholar] [CrossRef] [PubMed]
  58. Danecek, P.; Auton, A.; Abecasis, G.; Albers, C.A.; Banks, E.; DePristo, M.A.; Handsaker, R.E.; Lunter, G.; Marth, G.T.; Sherry, S.T.; et al. The variant call format and VCFtools. Bioinformatics 2011, 27, 2156–2158. [Google Scholar] [CrossRef] [PubMed]
  59. Bradbury, P.J.; Zhang, Z.; Kroon, D.E.; Casstevens, T.M.; Ramdoss, Y.; Buckler, E.S. TASSEL: Software for association mapping of complex traits in diverse samples. Bioinformatics 2007, 23, 2633–2635. [Google Scholar] [CrossRef] [PubMed]
  60. SPSS Inc. SPSS Base 10.0 for Windows User’s Guide; SPSS Inc.: Chicago, IL, USA, 1999. [Google Scholar]
  61. Singh, U.M.; Yadav, S.; Dixit, S.; Ramayya, P.J.; Devi, M.N.; Raman, K.A.; Kumar, A. QTL Hotspots for Early Vigor and Related Traits under Dry Direct-Seeded System in Rice (Oryza sativa L.). Front. Plant Sci. 2017, 8, 286. [Google Scholar] [CrossRef] [PubMed]
  62. Broman, K.W.; Wu, H.; Sen, S.; Churchill, G.A. R/QTL: QTL mapping in experimental crosses. Bioinformatics 2003, 19, 889–890. [Google Scholar] [CrossRef] [PubMed]
  63. Da Silva, M.J.R.; Ferreira, T.E.; Domiciano, S.; Paula, A.; Paiva, M.; Tecchio, M.A.; Leonel, S. Phenology, yield and fruit quality of four persimmon (Diospyros kaki L.) cultivars in So Paulos Midwest countryside, Brazil. Afr. J. Agric. Res. 2016, 11, 5171–5177. [Google Scholar]
  64. Podliesna, S.; Bezzina, C.R.; Lodder, E.M. Complex Genetics of Cardiovascular Traits in Mice: F2-Mapping of QTLs and Their Underlying Genes. Methods Mol. Biol. 2017, 1488, 431–454. [Google Scholar] [PubMed]
  65. Lander, E.; Kruglyak, L. Genetic dissection of complex traits: Guidelines for interpreting and reporting linkage results. Nat. Genet. 1995, 1, 1241–1247. [Google Scholar] [CrossRef] [PubMed]
  66. Stuber, C.; Edwards, M.D.; Wendel, J.F. Molecular marker facilitated investigations of quantitative trait loci in maize. II. Factors influencing yield and its component traits. Crop Sci. 1987, 27, 639–648. [Google Scholar] [CrossRef]
  67. Voorrips, R.E. MapChart: Software for the graphical presentation of linkage maps and QTLs. J. Hered. 2002, 93, 77–78. [Google Scholar] [CrossRef] [PubMed]
  68. Zhu, T.; Liang, C.; Meng, Z.; Sun, G.; Meng, Z.; Guo, S.; Zhang, R. CottonFGD: An integrated functional genomics database for cotton. BMC Plant Biol. 2017, 17, 101. [Google Scholar] [CrossRef] [PubMed]
Figure 1. Phenotypic analysis of the two parents for fiber quality and yield-related traits; (A) Fiber Length (mm); (B) Fiber Uniformity (%); (C) Fiber Micronaire (Unit), (D) Fiber Strength (cN/tex); (E) Fiber Elongation (%).CCRI35: female parent, NH: male parent.
Ijms 19 00441 g001
Figure 2. Frequency distribution of the 11 traits for fiber quality traits in F2:3, (A) Boll Weight (g); (B) Lint Percentage (%); (C) Fiber Length (mm); (D) Fiber Uniformity (%); (E) Fiber Micronaire (Unit); (F) Fiber Strength (cN/tex); (G) Fiber Elongation (%); (H) Fiber Reflectance; (I) Fiber Yellowness; (J) Spinning Consistency Index; (K) Mature Index.
Ijms 19 00441 g002
Figure 3. Pearson’s correlation of the 11 traits for the F2:3 in three environments. *, **, ***: significant levels of 0.5, 0.01 and 0.001 respectively. BW: Boll weight; LP: lint percentage; FL: fiber length; FU: fiber uniformity; FM: fiber micronaire; FS: fiber strength; FE: fiber elongation; FR: fiber reflectance; FY: fiber yellowness; SCI: spinning consistency index; MI: mature index. For the units, see in Figure 1 and Figure 2.
Ijms 19 00441 g003
Figure 4. (A) Genetic linkage map constructed using the F2:3 Population; (B) Plot of estimated recombination fractions of all markers used in the F2:3 population. X and Y axis are the markers and Z is the linkage groups (LGs).
Ijms 19 00441 g004
Figure 5. Clustered QTLs identified in D03 (c17) of yield-related and fiber quality traits. Bars and lines on the right-hand side of the linkage groups show the QTL likelihood intervals. Map distances in centiMorgan (cM) are indicated on the left-hand side of the linkage groups. For trait meanings, see Figure 1 or Figure 2, *** asterisk means the QTL is consistent.
Ijms 19 00441 g005
Figure 6. Clustered QTLs identified in D12 (c26) of yield-related and fiber quality traits. Bars and lines on the right-hand side of the linkage groups show the QTL likelihood intervals. Map distances in centiMorgan (cM) are indicated on the left-hand side of the linkage groups. For trait meanings, see Figure 1 or Figure 2, *** asterisk means the QTL is consistent.
Ijms 19 00441 g006
Figure 7. (A) Candidate genes involved in yield and/or fiber quality traits in this study; (B) phylogenetic tree analysis of the five involved genes in yield related and fiber quality traits of upland cotton.
Ijms 19 00441 g007
Figure 8. The five genes with highest expression in different stages of fiber development. x axis: QTLs for fiber Quality; CCRI35: good fiber quality parental line; y axis: fiber DPA (Log10(FPKM)); FM: fiber micronaire (%); FS: fiber strength (cN/tex); FY: fiber yellowness; Gh_D03 or Gh_D12 are genes identified with high expression and involved in fiber development; cb: combine analysis; 0 <Ae (additive effect) <0.20; OD (over dominance) > 1.20; (AD) are respectively fiber expression at 5, 10, 20 and 25 DPA. For trait meanings, see Figure 1 or Figure 2.
Ijms 19 00441 g008
Table 1. ANOVA, broad sense heritability and phenotypic analysis of fiber quality and yield related traits for the two parents and the F2:3 population.
TraitSourceDFSSMSFPr > FHb (%)P1P2P1 − P2F2:3
MeanSDMaxMinSkewKurt
BWe3327.4109.11.9 × 1010<0.000167.5-- 4.770.737.91.8−0.160.94
g276728.62.64.59 × 1008<0.0001
g*e828710.50.91.49 × 1008<0.0001
LPe31856.76199.5 × 1010<0.000182.1-- 35.973.715416.080.091.2
g27628,244102.31.57 × 1010<0.0001
g*e82815,200.718.42.82 × 1009<0.0001
FLe31561.45219.23 × 1024<0.000163.624.1221.12326.461.232.221.550.940.55
g2761530.15.59.83 × 1022<0.0001
g*e8281670.723.58 × 1022<0.0001
FUe31200.64009 × 1023<0.000177.187.2380.66.6385.141.6989.377.8−0.750.12
g2764844.217.63.95 × 1022<0.0001
g*e8283321.349.02 × 1021<0.0001
FMe312.70042.19 × 1025<0.000192.45.615.320.294.570.726.752.2−0.19−0.15
g2761406.55.12.63 × 1025<0.0001
g*e828320.30.41.99 × 1024<0.0001
FSe32038.76803.37 × 1025<0.000176.828.9725.183.7926.192.2736.5210.760.75
g2768851.832.11.59 × 1024<0.0001
g*e8286155.47.43.69 × 1023<0.0001
FEe310.80042.15 × 1024<0.000161.86.836.87−0.046.510.38.14.5−1.020.02
g276137.10.52.96 × 1023<0.0001
g*e828157.50.21.13 × 1023<0.0001
FRe3335.5001125.58 × 1022<0.000184.8-- 63.232.2773.658.70.91.22
g27611,577.941.92.09 × 1022<0.0001
g*e8285282.36.43.18 × 1021<0.0001
FYe338.212.78.03 × 1023<0.000186.3-- 7.830.619.65.5−0.321.19
g276845.63.11.93 × 1023<0.0001
g*e8283480.42.65 × 1022<0.0001
SCIe324,493.68164.51.39 × 1025<0.000186.6-- 122.2611.57167820.090.97
g276299,9671086.81.85 × 1024<0.0001
g*e828120,302.4145.32.48 × 1023<0.0001
MIe30.50.26.73 × 1025<0.000166.7-- 0.810.020.870.75−0.19−0.79
g2760.701.18 × 1024<0.0001
g*e8280.502.77 × 1023<0.0001
P1 = CCRI35: parental female with good fiber quality traits; P2 = NH: good yield fiber; DF: degree of freedom; SS: sum square; MS: mean square; F: F value; Hb (%): Broad sense heritability percentage; SD: Standard deviation; Min: Minimum; Max: Maximum; Skew: Skewness; Kurt: Kurtosis, (<0.0001): means significant at level p < 0.001.
Table 2. Genomic distributions of SNPs markers.
GroupMarker NumberMap Length (cM)Av Distance (cM)Max Gap (cM)<10 cM>10 cMRatio
A01(c1)448146.7040.338.50544701
A02(c2)705346.3140.4917.84869950.99
A03(c3)323213.9370.6617.14531930.99
A04(c4)106203.8911.9226.5989960.93
A05(c5)378385.0921.0221.198365120.97
A06(c6)5873.0631.2615.0325430.93
A07(c7)279205.8920.7411.62227620.99
A08(c8)69112.1371.6318.8946530.94
A09(c9)98138.5011.4119.2349520.97
A10(c10)292202.1340.6910.55128740.98
A11(c11)5170.5481.3823.2414910.96
A12(c12)244309.6081.2719.59323670.97
A13(c13)262203.610.7817.42525650.98
Subtotal At33132611.430.7926.5983247530.98
D01(c15)319144.0920.456.35131801
D02(c14)454313.2680.6914.54145030.99
D03(c17)133170.5551.2814.99313110.98
D04(c22)114136.2281.1920.27511030.96
D05(c19)153218.7881.4327.06214840.97
D06(c25)1679.0844.9422.3891230.75
D07(c16)169235.3661.3926.04116170.95
D08(c24)118226.6881.9220.87810980.92
D09(c23)40136.7443.4214.483360.83
D10(c20)80129.0511.6120.5397630.95
D11(c21)9889.7820.9227.5649520.97
D12(c26)143194.7351.3630.08213570.94
D13(c18)2882.2862.9420.9172520.89
Subtotal Dt18652156.671.15630.0821803490.97
TOTAL (At + Dt)51784768.10.9230.08250501020.98
Ratio: number of markers less than (<) 10 cM divided by total number of markers within chromosome. Av: Average; Max: Maximum.
Table 3. Consistent QTLs for fiber quality and yield related traits identified in this study.
TraitQTLChrStart MarkerEnd MarkerStart Marker (bp)End Marker (bp)Start Marker (cM)End Marker (cM)Position (cM)LODAeDe|d/a|GAR2 (%)DPE
FSqFS-A02_15A02mk1761_A02mk1778_A0280,488,79981,766,125017.8485.013.761129−0.00521.5095290.28846OD0.5295NH
qFS-A02_cbA02mk1761_A02mk1778_A0280,488,79981,766,125017.8487.012.9033660.02920.536818.383562OD0.0421CCRI35
qFS-A02_cbA02mk1020_A02mk1022_A02827,449909,242337.304346.314337.115.5070580.24170.19440.8043029A5.6762CCRI35
SCIqSCI-A02_15A02mk1761_A02mk1778_A0280,488,7998,176,6125017.8481.013.268187−0.73839.022112.2201OD1.2775NH
qSCI-A02_cbA02mk1761_A02mk1778_A0280,488,79981,766,125017.8481.012.740499−0.41425.127412.379044OD0.9695NH
qSCI-A02_cbA02mk1018_A02mk1019_A02822,030827,340334.259337.053336.313.272530.99434.75284.7800463OD0.277CCRI35
FLqFL-A03_14A03mk1922_A03mk1927_A031,863,1371,863,215194.163194.228194.212.545060.17460.53373.056701OD0.4959CCRI35
qFL-A03_15A03mk1989_A03mk2007_A032,881,0612,936,448168.853169.141168.912.5993490.2760.14840.5376812PD3.0929CCRI35
qFL-A03_cbA03mk11099mk2084_A0331,386666,625994.16102.466102.213.5656890.1480.31662.1391892OD1.445CCRI35
qFL-A03_cbA03mk2085_A03mk2087_A036,666,4736,736,164130.379130.946130.412.7231270.12190.25152.0631665OD1.3067CCRI35
FMqFM-A05_15A05mk2943_A05mk2952_A0521,550,98823,173,778195.463206.855197.512.9272530.1377−0.22041.600581OD4.6742CCRI35
qFM-A05_cbA05mk2943_A05mk2952_A0521,550,98823,173,778195.463206.855197.513.0401740.0684−0.09321.3625731OD5.0485CCRI35
LPqLP-A05_14A05mk2943_A05mk2952_A0521,550,98823,173,778195.463206.855195.514.768730.9516−0.85140.8947037D11.2688CCRI35
qLP-A05_cbA05mk2943_A05mk2952_A0521,550,98823,173,778195.463206.855195.512.6731810.4032−1.18772.9456845OD3.4428CCRI35
BWqBW-A09_15A09mk6774_A09mk6775_A0960,948,39562,054,9797.25215.61915.612.5993490.10340.3353.2398453OD0.2668CCRI35
qBW-A09_15A09mk6764_A09mk6772_A0959,295,75659,503,46725.19826.00525.212.7448430.07940.38944.9042821OD0.0173CCRI35
qBW-A09_cbA09mk6764_A09mk6772_A0959,295,75659,503,46725.19826.00525.212.8317050.0040.283870.95OD0.6913CCRI35
FUqFU-A09_16A09mk6410_A09mk6462_A094,242,4757,339,105115.638134.872117.712.62975−0.02210.676230.597285OD0.1419NH
qFU-A09_cbA09mk8762mk6732_A0913,22255,126,52535.48644.20240.512.586319−0.03430.694520.247813OD1.3251NH
SCIqSCI-A09_15A09mk18838mk6517_A0964,09333,530,29579.72679.93479.914.601522.29159.07163.9588043OD0.5063CCRI35
qSCI-A09_15A09mk6528_A09mk6531_A0937,420,62837,694,39087.80391.57188.813.4006512.61947.20822.7518516OD1.1267CCRI35
qSCI-A09_cbA09mk6491_A09mk6493_A0915,408,93717,834,57473.59773.64773.612.8751363.64414.92941.3527071OD0.804CCRI35
qSCI-A09_cbA09mk18838mk6517_A0964,09333,530,29579.72679.93479.913.4136810.76935.37796.9906408OD0.0048CCRI35
qSCI-A09_cbA09mk6528_A09mk6531_A0937,420,62837,694,39087.80391.57188.812.6862111.00694.64584.6139637OD0.1298CCRI35
FMqFM-A10_15A10mk7018_A10mk7020_A1015,617,31815,617,342165.83165.941165.912.4212810.0767−0.3224.1981747OD2.1861CCRI35
qFM-A10_15A10mk11965mk6991_A10885212,815,805171.292171.66171.313.3398480.0919−0.35833.898803OD3.1176CCRI35
qFM-A10_cbA10mk18875mk1887635538958.67959.51958.712.9120520.0306−0.17695.7810458OD2.1098CCRI35
qFM-A10_cbA10mk11965mk6991_A10885212,815,805171.292171.66171.312.7795870.0402−0.15383.8258706OD2.621CCRI35
FSqFS-A10_16A10mk19550mk7479_A1062,12969,679,15093.73694.20893.812.877307−0.42060.06440.1531146A7.1603NH
qFS-A10_16A10MulMa189-m_A10mk7438_A1065,789,27767,378,405106.543109.182106.813.1704670.00480.351773.270833OD0.4704CCRI35
qFS-A10_cbA10mk6982_A10mk6986_A101,111,556912,645,781177.095185.191177.113.676439−0.19870.17270.8691495D6.206NH
FEqFE-A12_14A12mk9173_A12mk9187_A1279,355,80681,262,30123.5338.30531.512.54506−0.01770.11786.6553672OD3.0701NH
qFE-A12_16A12mk8958_A12mk8961_A1259,776,6336,102,5182161.739173.999163.812.8382190.00060.045876.333333OD0.0468CCRI35
FEqFE-D01_15D01mk10708_D01mk10809_D0142,734,09044,178,280105.061106.117106.112.551574−0.00010.19051905OD0.4005NH
qFE-D01_cbD01mk10832_D01MulMa266-m_D0146,916,08051,199,14877.70682.28779.714.1411510.04440.09552.1509009OD0.7434CCRI35
qFE-D01_cbD01mk10708_D01mk10709_D0142,734,09042,734,155106.1106.117106.112.9989140.00090.0961106.77778OD0.4425CCRI35
SCIqSCI-D02_15D02mk11587_D02mk11605_D0251,060,0535,122,5737120.178120.621120.612.6905541.4485−6.74944.6595789OD2.84CCRI35
qSCI-D02_cbD02mk11595_D02mk11603_D0251,118,85051,193,929115.939116.818116.012.5211730.2862−4.48515.67086OD1.8379CCRI35
BWqBW-D03_15D03mk12041_D03mk12042_D032,290,6012,894,28822.57337.56630.612.644951−0.08990.49575.5139043OD2.9343NH
qBW-D03_16D03mk12031_D03mk12032_D031,002,7041,037,9173.7759.1723.812.8707930.00060.4782797OD0.7748CCRI35
FMqFM-D03_15D03mk12142_D03mk12159_D0336,697,6563,861,6587125.137134.584130.217.524430.26670.14770.5538058PD8.7707CCRI35
qFM-D03_15D03mk12152_D03mk12159_D0337,665,16738,616,587134.584141.665136.017.6851250.26610.06640.2495303PD10.0325CCRI35
qFM-D03_15D03mk12153_D03mk12158_D0337,668,26237,938,158143.823145.337144.816.3040170.23290.09220.3958781PD7.4939CCRI35
qFM-D03_cbD03mk12085_D03mk12086_D0325,573,33425,700,13287.28587.51687.314.951140.09750.02120.2174359PD6.3845CCRI35
qFM-D03_cbD03mk12119_D03mk12123_D0330,535,74530,566,88395.39395.72495.416.6449510.11330.02040.180053A8.5806CCRI35
qFM-D03_cbD03mk12108_D03mk12115_D032,763,813329,511,299101.991103.218101.314.8273620.0950.0610.6421053PD5.0024CCRI35
FYqFY-D03_15D03mk12142_D03mk12159_D0336,697,65638,616,587125.137134.584130.212.6102060.1828−0.02980.1630197A4.7288CCRI35
qFY-D03_15D03mk12154_D03mk12155_D0337,676,41437,682,981141.665142.221141.713.8067320.184−0.18441.0021739D6.9294CCRI35
qFY-D03_15D03mk12158_D03mk12161_D0337,938,15839,407,242145.337150.198148.314.2106410.2038−0.22761.1167812D8.0817CCRI35
qFY-D03_cbD03mk12109_D03mk12111_D0327,707,66729,136,194105.804106.491105.812.5711180.0879−0.09311.0591581D4.7115CCRI35
LPqLP-D03_15D03mk12142_D03mk12159_D0336,697,65638,616,587125.137134.584129.219.2334421.7674−0.29220.1653276A15.4584CCRI35
qLP-D03_15D03mk12152_D03mk12160_D0337,665,16738,832,736134.986141.665138.018.2149841.6425−0.3990.2429224PD13.9321CCRI35
qLP-D03_16D03mk12152_D03mk12160_D0337,665,16738,832,736134.986141.665138.015.4397391.4767−0.97370.6593756PD9.8343CCRI35
qLP-D03_16D03mk12153_D03mk12158_D0337,668,26237,938,158143.823145.337144.814.6210641.2806−1.07660.8406997D7.9495CCRI35
qLP-D03_cbD03mk12152_D03mk12160_D0337,665,16738,832,736134.986141.665139.018.1693811.2356−0.16070.1300583A13.3867CCRI35
qLP-D03_cbD03mk12158_D03mk12161_D0337,938,15839,407,242145.337150.198147.317.0901191.1317−0.31520.278519PD12.0557CCRI35
FRqFR-D04_15D04MulMa448_D04MulMa451_D0449,867,79850,187,1924.7368.3375.012.660152−0.1841−1.58328.5996741OD0.0079NH
qFR-D04_cbD04MulMa448_D04MulMa451_D0449,867,79850,187,1924.7368.3375.012.781759−0.227−0.85573.7696035OD0.6158NH
FMqFM-D05_15D05mk12822_D05mk12824_D0530,214,24430,216,527152.95153.434153.015.0618890.20630.0080.0387785A6.8075CCRI35
qFM-D05_cbD05MulMa463-m_D05mk12861_D0530,373,35431,354,896144.668148.809146.714.0217160.08−0.12141.5175OD6.6096CCRI35
qFM-D05_cbD05mk12822_D05mk12824_D0530,214,24430,216,527152.95153.434153.414.6275790.0886−0.08790.9920993D7.3098CCRI35
SCIqSCI-D05_15D05MulMa463-m_D05mk12861_D0530,373,35431,354,896144.668148.809144.712.566775−2.74953.57991.3020185OD4.5444NH
qSCI-D05_cbD05MulMa463-m_D05mk12861_D0530,373,35431,354,896144.668148.809144.712.579805−1.7781.37250.7719348PD4.7561NH
FRqFR-D08_15D08mk15992_D08mk15995_D0856,628,64056,628,844181.945182.082182.012.6558090.587−0.29320.4994889PD4.6002CCRI35
qFR-D08_cbD08mk15992_D08mk15995_D0856,628,64056,628,844181.945182.082182.013.4419110.408−0.29770.7296569PD6.2705CCRI35
FLqFL-D08_14D08MulMa514_D08mk16004_D0854,937,78158,533,805187.587196.342196.313.5830620.3322−0.01520.0457556A5.8804CCRI35
qFL-D08_cbD08MulMa514_D08mk16004_D0854,937,7815,853,3805187.587196.342196.313.6395220.17990.08920.495831PD4.9405CCRI35
qFL-D08_cbD08mk16017_D08mk16020_D0859,691,08759,698,388208.553208.76208.613.2551570.15950.18761.1761755D3.2928CCRI35
FEqFE-D10_14D10mk17141_D10MulMa593-m_D1056,817,43256,887,380102.161106.55106.212.523344−0.03280.0822.5OD3.7527NH
qFE-D10_15D10MulMa575-m_D10MulMa581_D1024,793,86324,918,1411.6042.0471.912.9598260.07510.03060.4074567PD3.9966CCRI35
FLqFL-D10_14D10mk17141_D10MulMa593-m_D1056,817,43256,887,380102.161106.55105.213.411509−0.13940.73845.2969871OD3.6287NH
qFL-D10_cbD10mk2492MulMa366-m51933,03778.15598.69483.212.614549−0.0450.46410.311111OD2.0017NH
FLqFL-D11_16D11mk17462_D11mk17463_D1115,695,80415,711,59888.70688.93588.712.8317050.00110.1765160.45455OD0.8561CCRI35
qFL-D11_cbD11mk17464_D11mk17514_D1115,711,71121,298,89061.14288.70682.213.079262−0.04610.518511.247289OD2.2603NH
FSqFS-D12_14D12mk18221_D12MulMa605_D1250,554,3715,129,3378148.99160.984153.013.2703580.00770.8261107.28571OD0.6079CCRI35
qFS-D12_15D12mk17994_D12mk17997_D123,798,83133,8143,95765.60866.05665.613.7437570.3487−0.72772.0868942OD5.7325CCRI35
qFS-D12_cbD12mk19853mk17913_D12101,31913,479,26116.39216.94616.414.0499460.1807−0.30371.6806862OD6.3446CCRI35
FYqFY-D12_15D12mk17995_D12mk18057_D1238,058,75541,722,49566.86196.94370.912.6775240.047−0.472110.044681OD2.0175CCRI35
qFY-D12_cbD12mk1009mk17992_D1218,98937,732,03066.34866.86166.413.2529860.0211−0.273912.981043OD1.9523CCRI35
SCIqSCI-D12_14D12mk18202_D12mk18207_D1248,411,38748,718,111132.168133.627133.613.146581.3176−0.81280.6168792PD6.2241CCRI35
qSCI-D12_15D12mk19857mk17916_D12117,14215,801,26523.69224.24523.713.0727472.6364.60941.7486343OD1.4248CCRI35
FLqFL-D12_14D12mk18210_D12mk18214_D1248,923,08449133419135.788138.113135.812.8512490.281−0.2160.7686833PD5.2886CCRI35
qFL-D12_cbD12mk18221_D12MulMa605_D1250,554,37151,293,378148.99160.984158.012.8968510.17550.17390.9908832D3.2967CCRI35
qFL-D12_cbD12MulMa604-m_D12mk18232_D1251,286,85952,905,207161.79172.395165.812.7730730.16530.13750.8318209D3.0451CCRI35
FLqFL-D13_14D13mk18377_D13MulMa619_D134,171,03734,392,98336.05256.96946.113.2377850.1336−0.78465.8727545OD3.0376CCRI35
qFL-D13_15D13mk18378_D13mk18379_D134,310,4904,329,36464.75665.40964.812.5298590.26240.27241.0381098D2.1912CCRI35
qFL-D13_cbD13mk18516_D13mk18533_D1341,759,68147,859,5752.02310.4299.013.0510310.17−0.05720.3364706PD5.3187CCRI35
qFL-D13_cbD13mk20382mk18378_D131414,310,49065.40972.52365.413.0727470.1705−0.06580.3859238PD5.4653CCRI35
LOD: logarithm of odds; 0 < Ae (additive effect) < 0.20; 0.21 < PD (partial dominance) < 0.80; 0.81 < De (dominance effect) < 1.20; OD (over dominance) > 1.20; |d/a| = De/Ae; GA: gene action; DPE: direction of phenotypic explanation. For traits meaning see Figure 1 or Figure 2.

