A Model to Predict Total Chlorine Residue in the Cooling Seawater of a Power Plant Using Iodine Colorimetric Method

Abstract
:1. Introduction
2. Results and Discussion
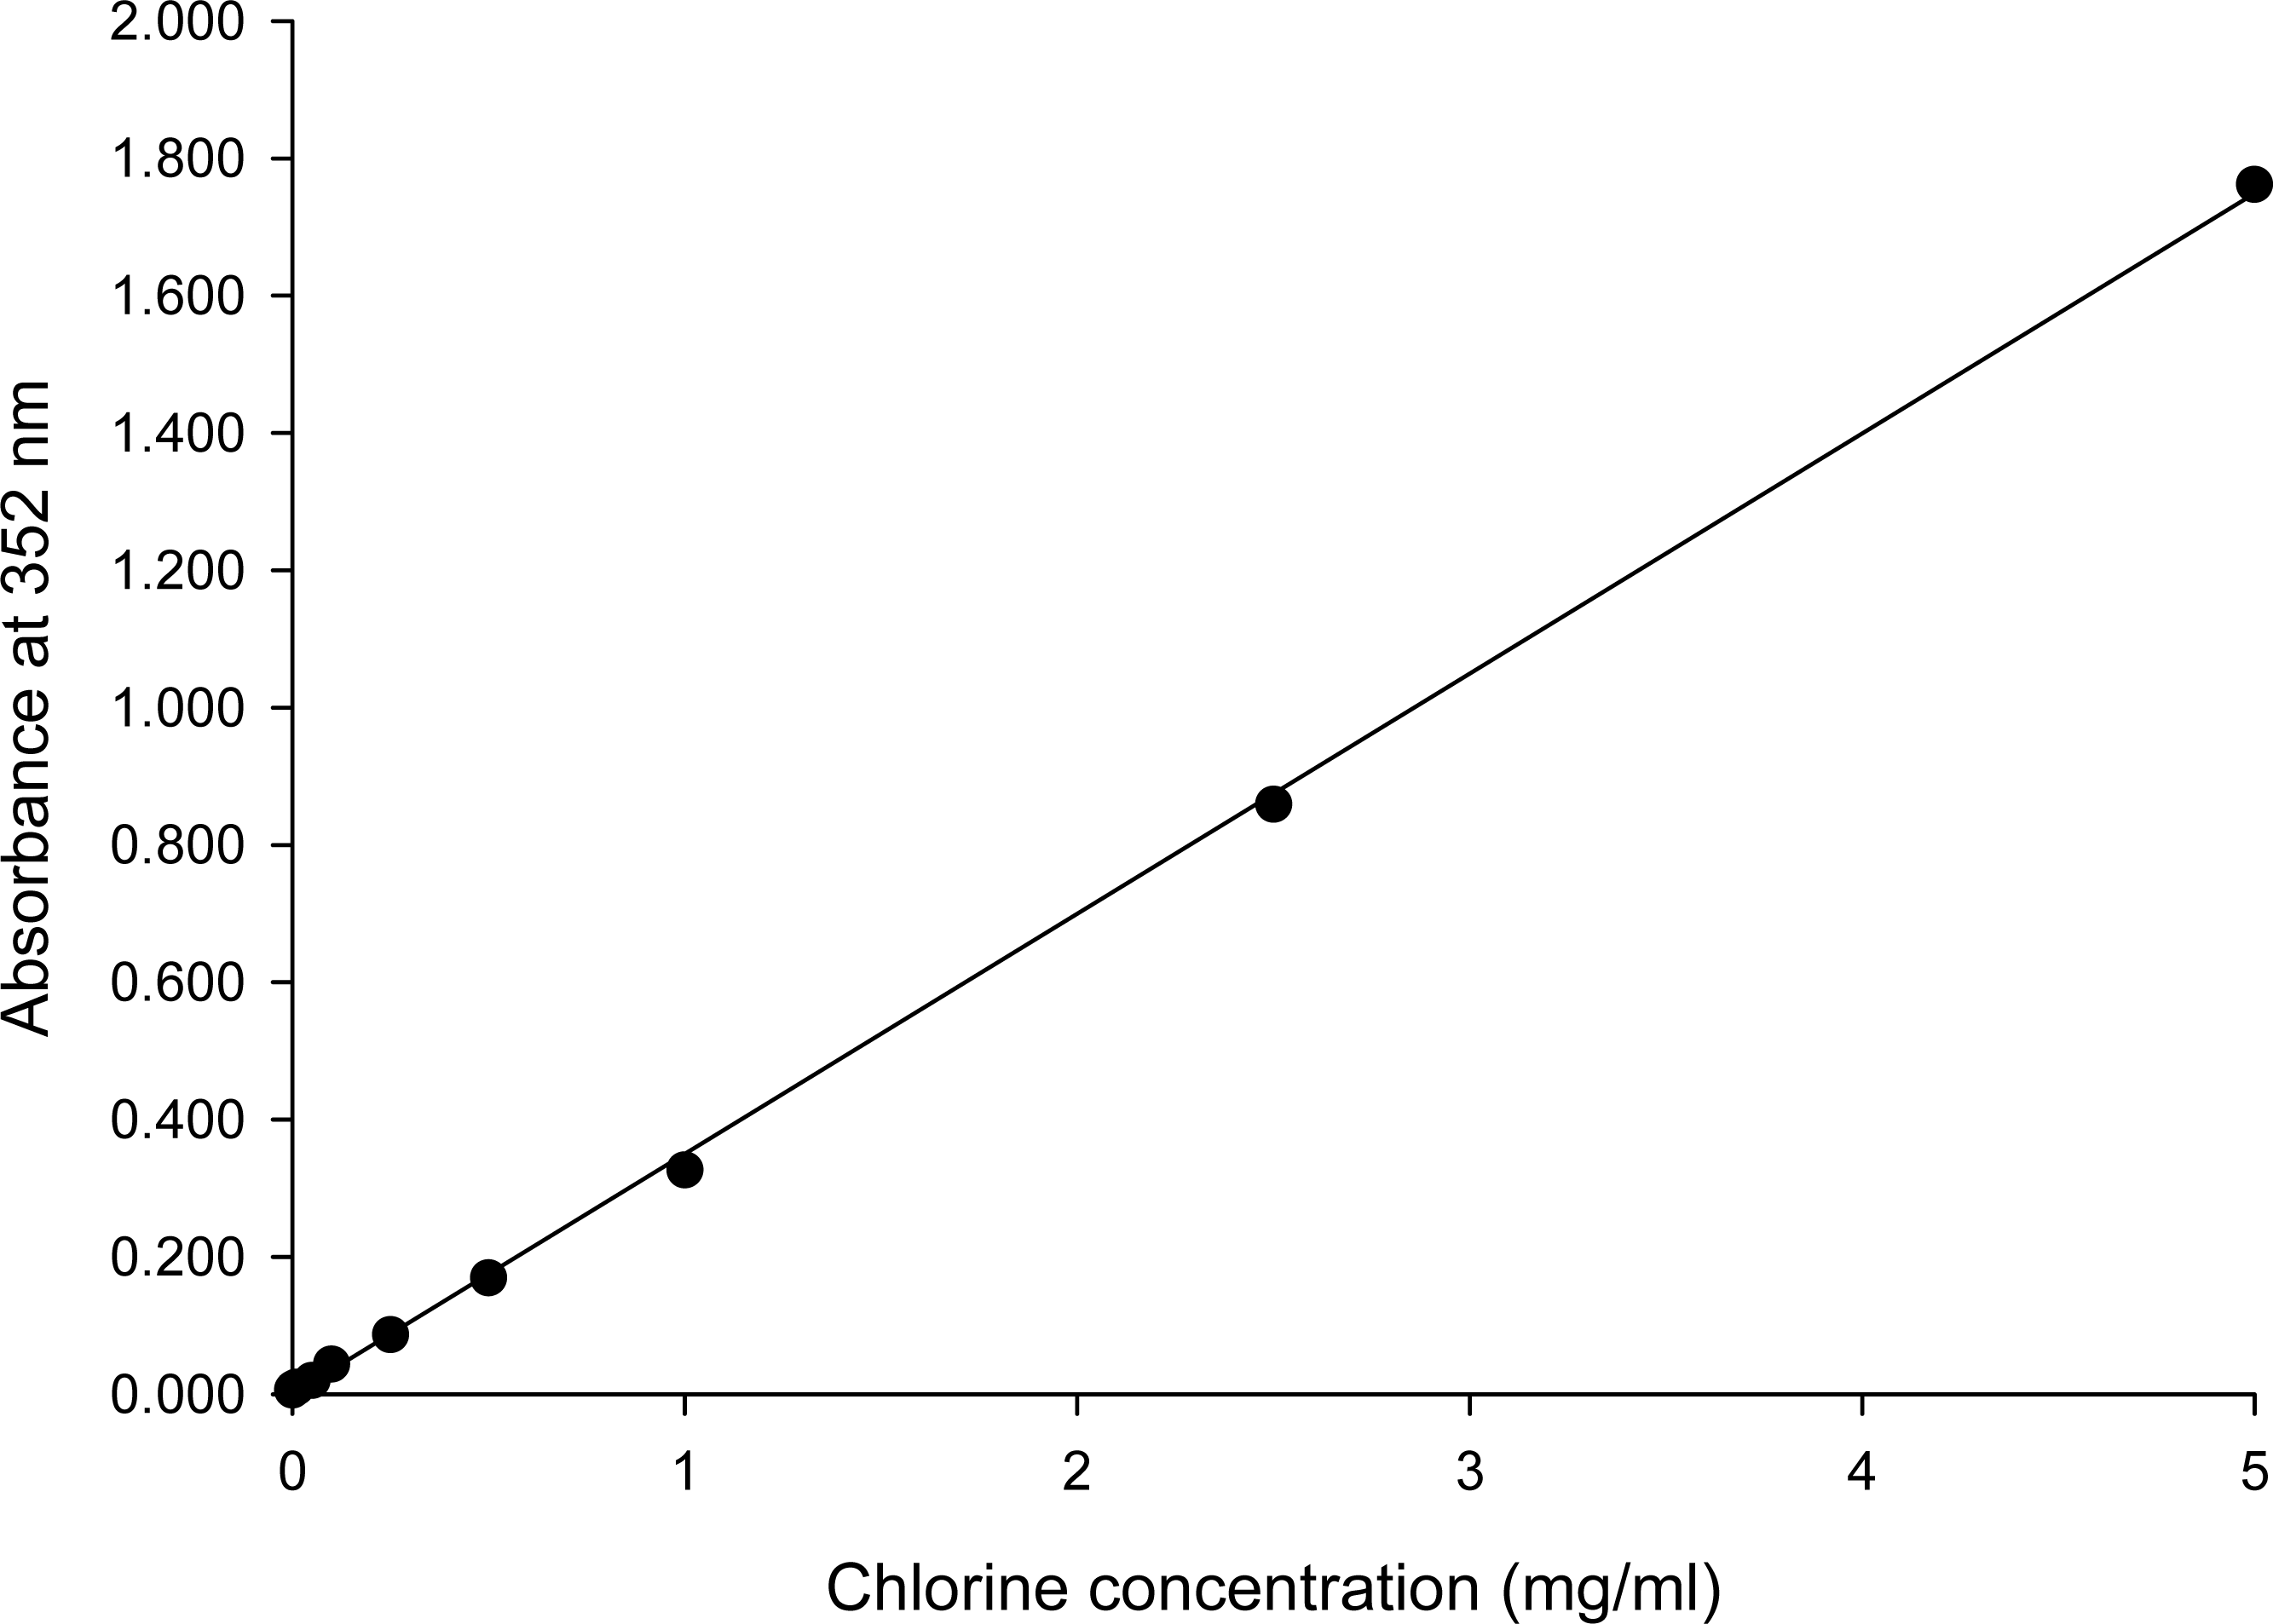
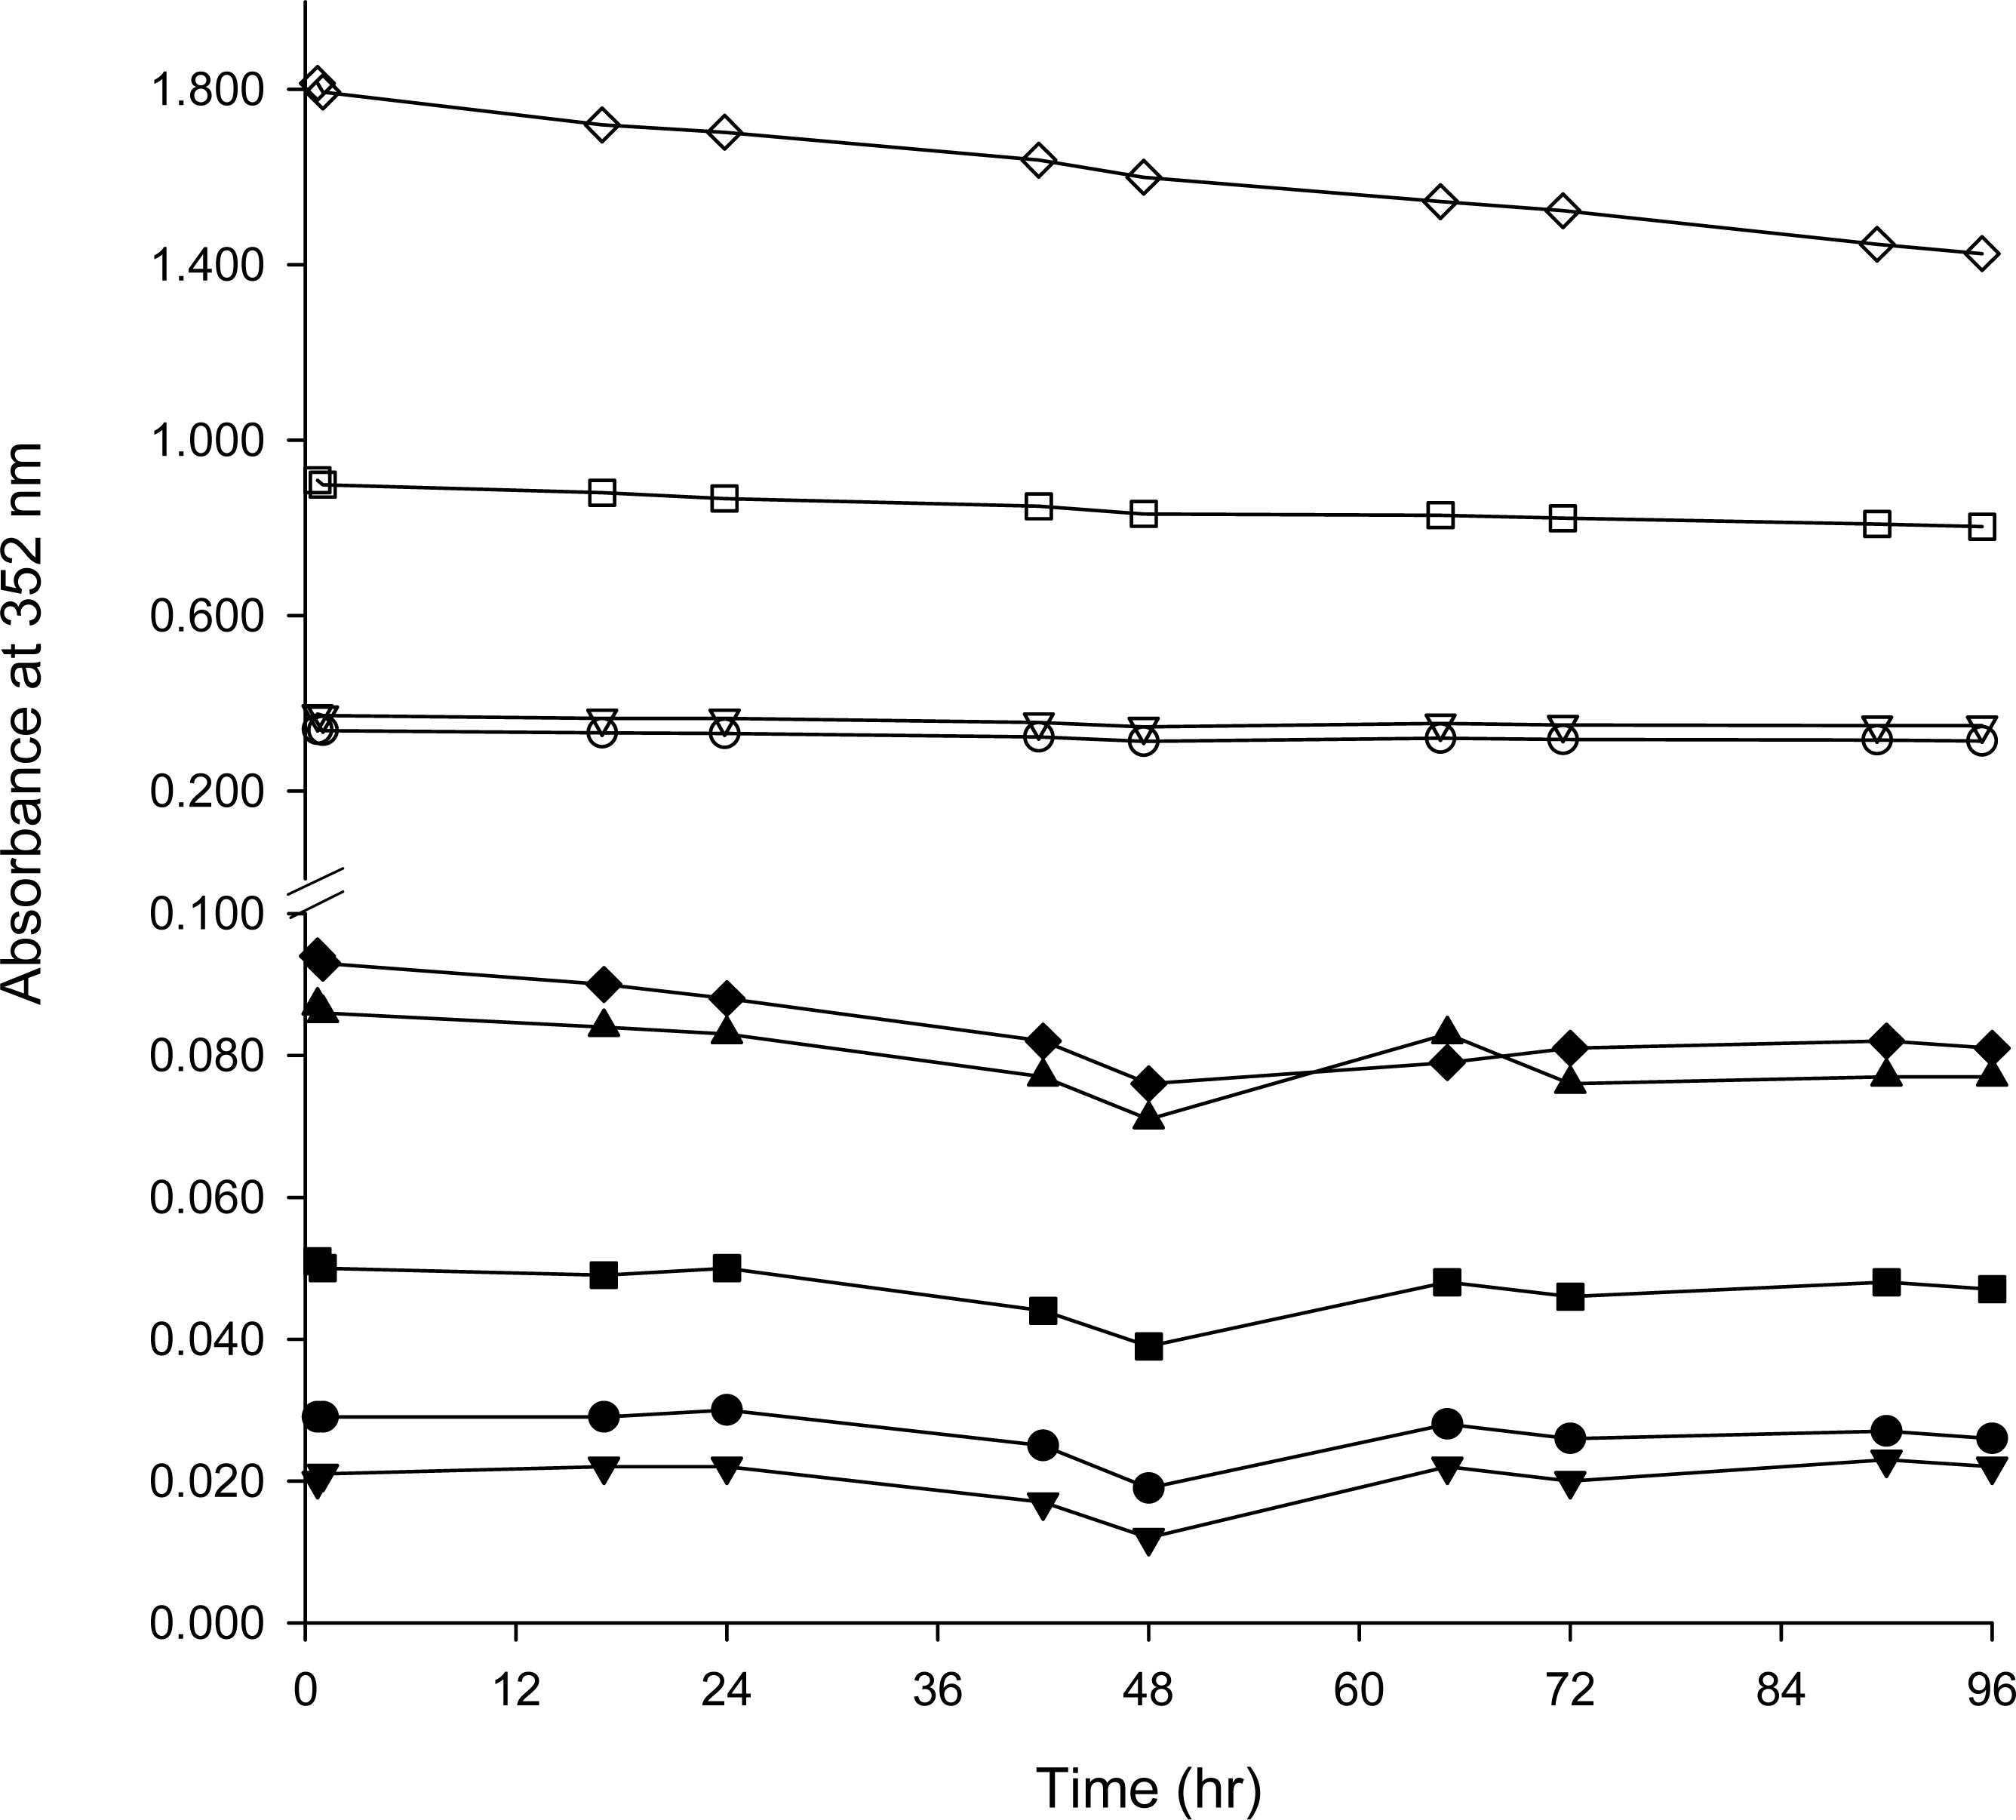
2.1 Standard curve and stability of iodine colorimetry
2.2 Temperature and salinity dependence of TRO determination
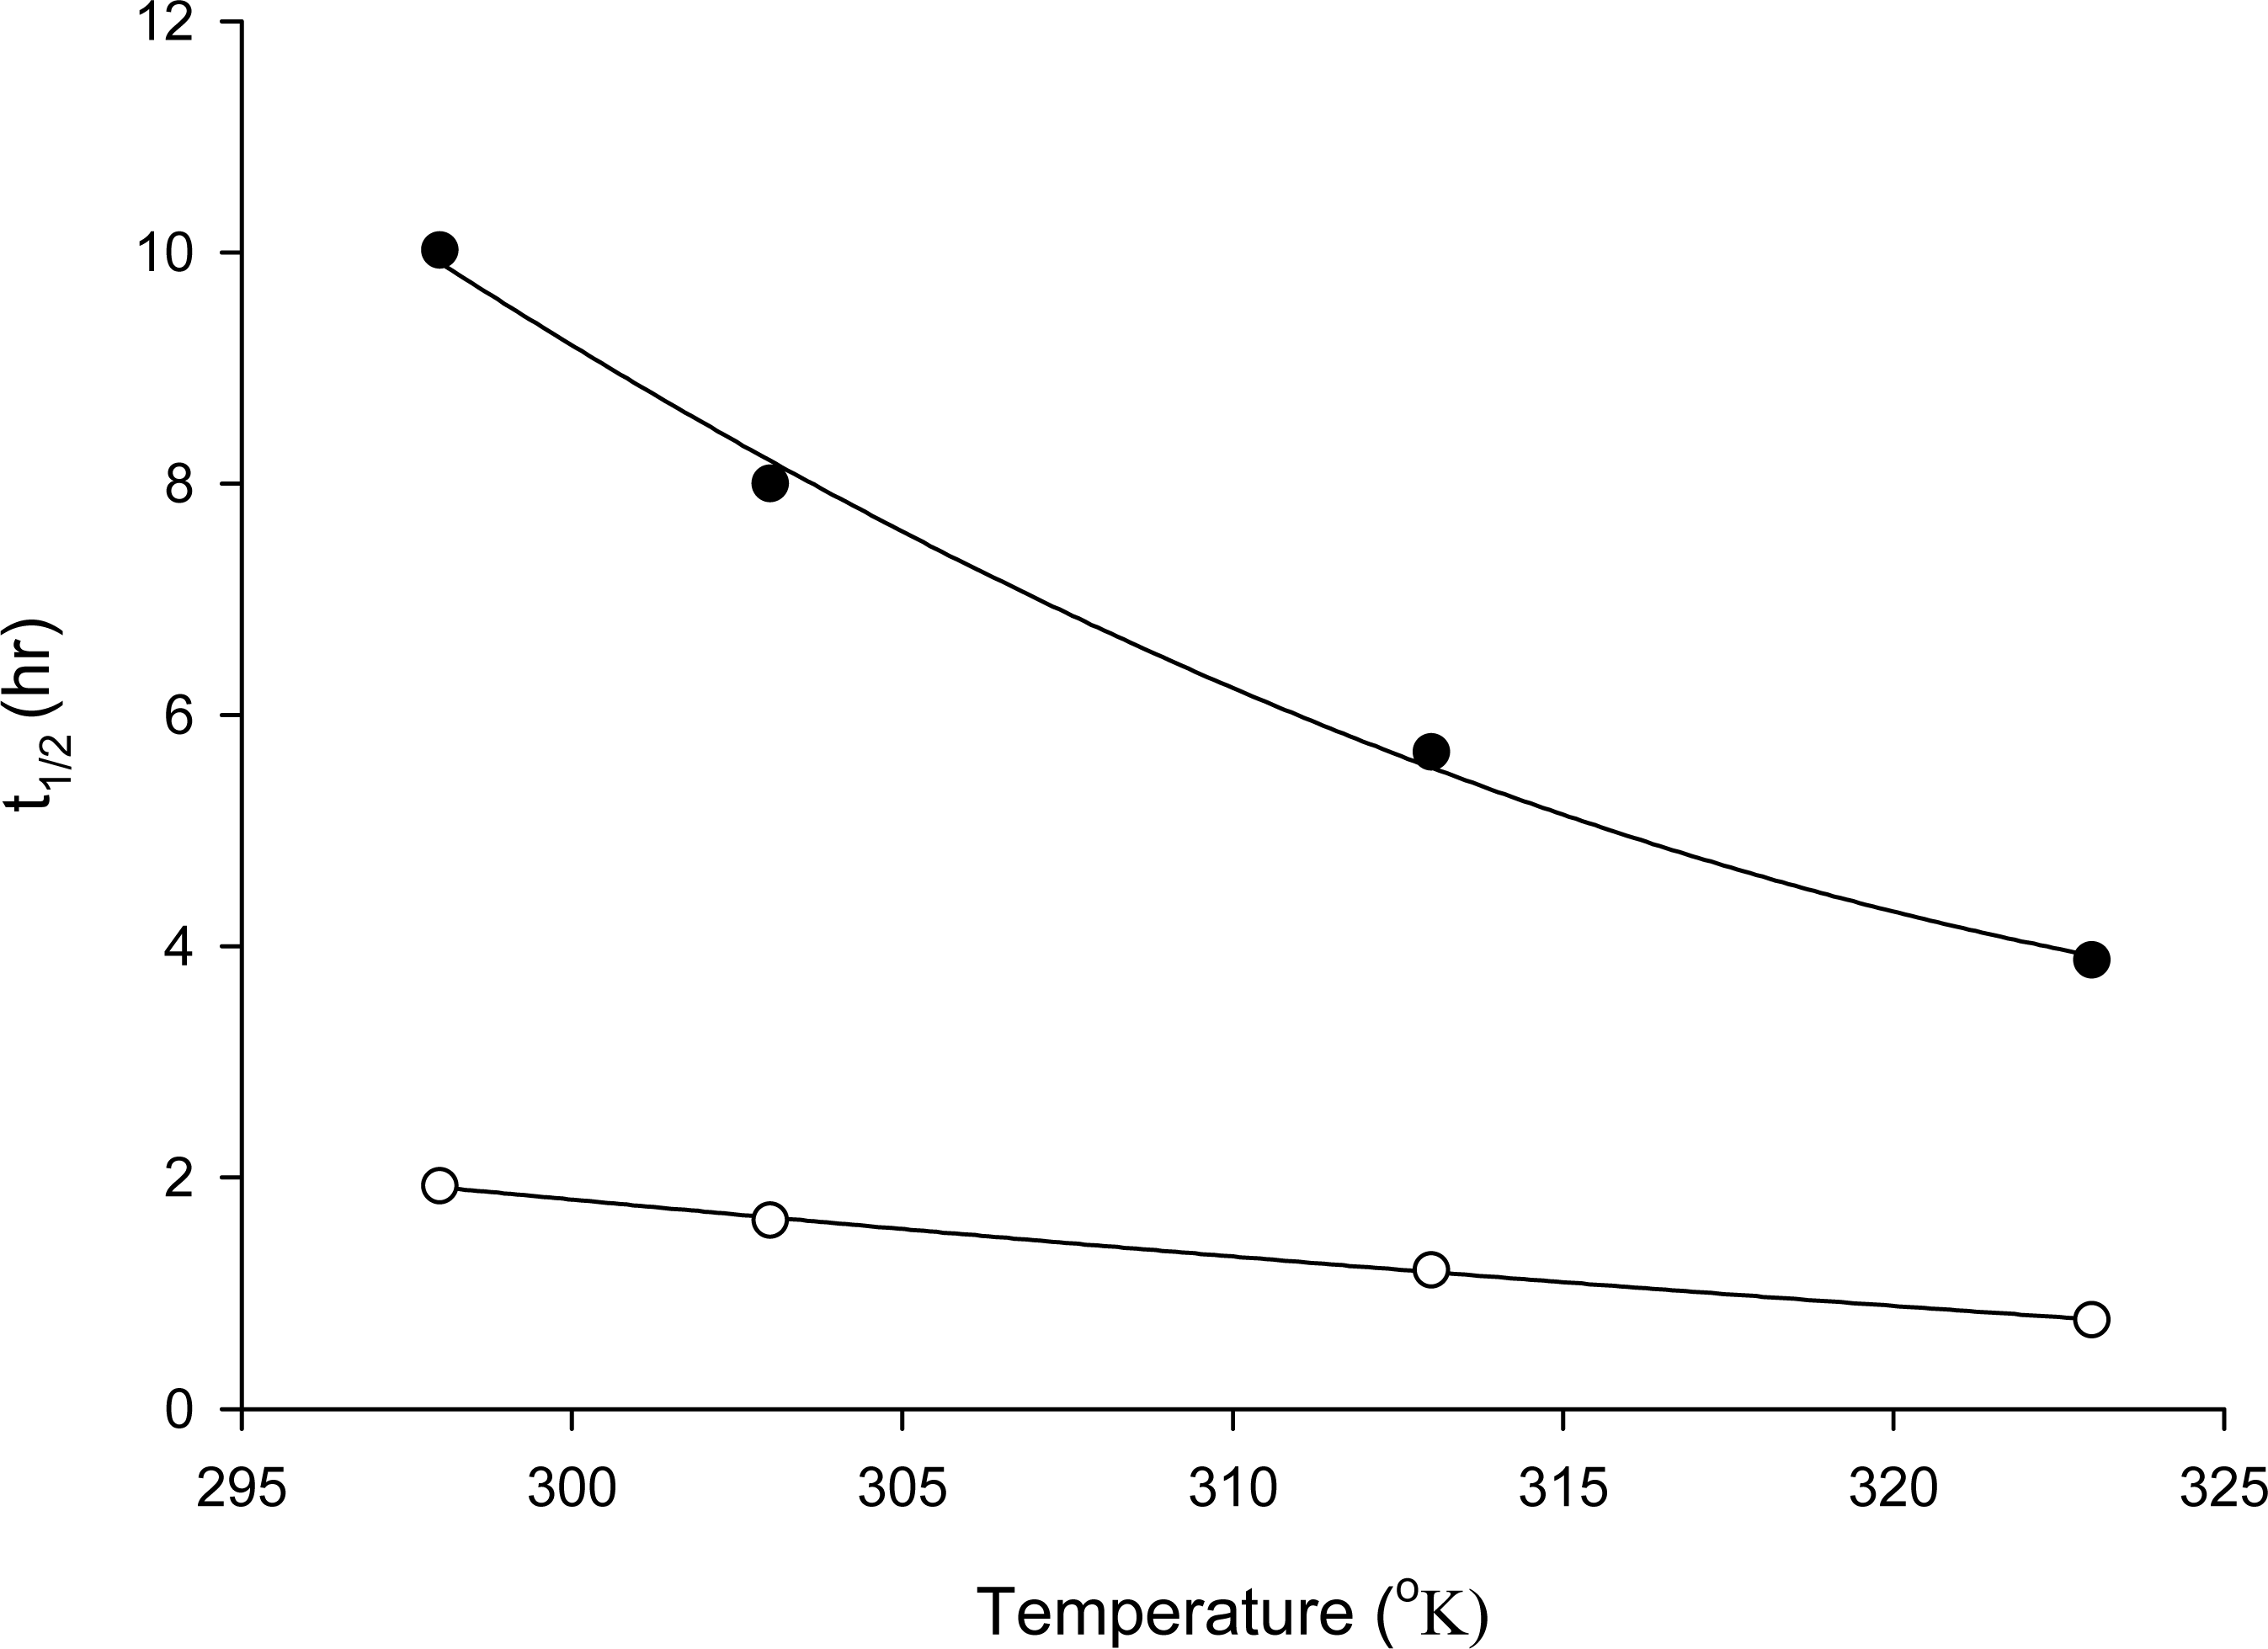
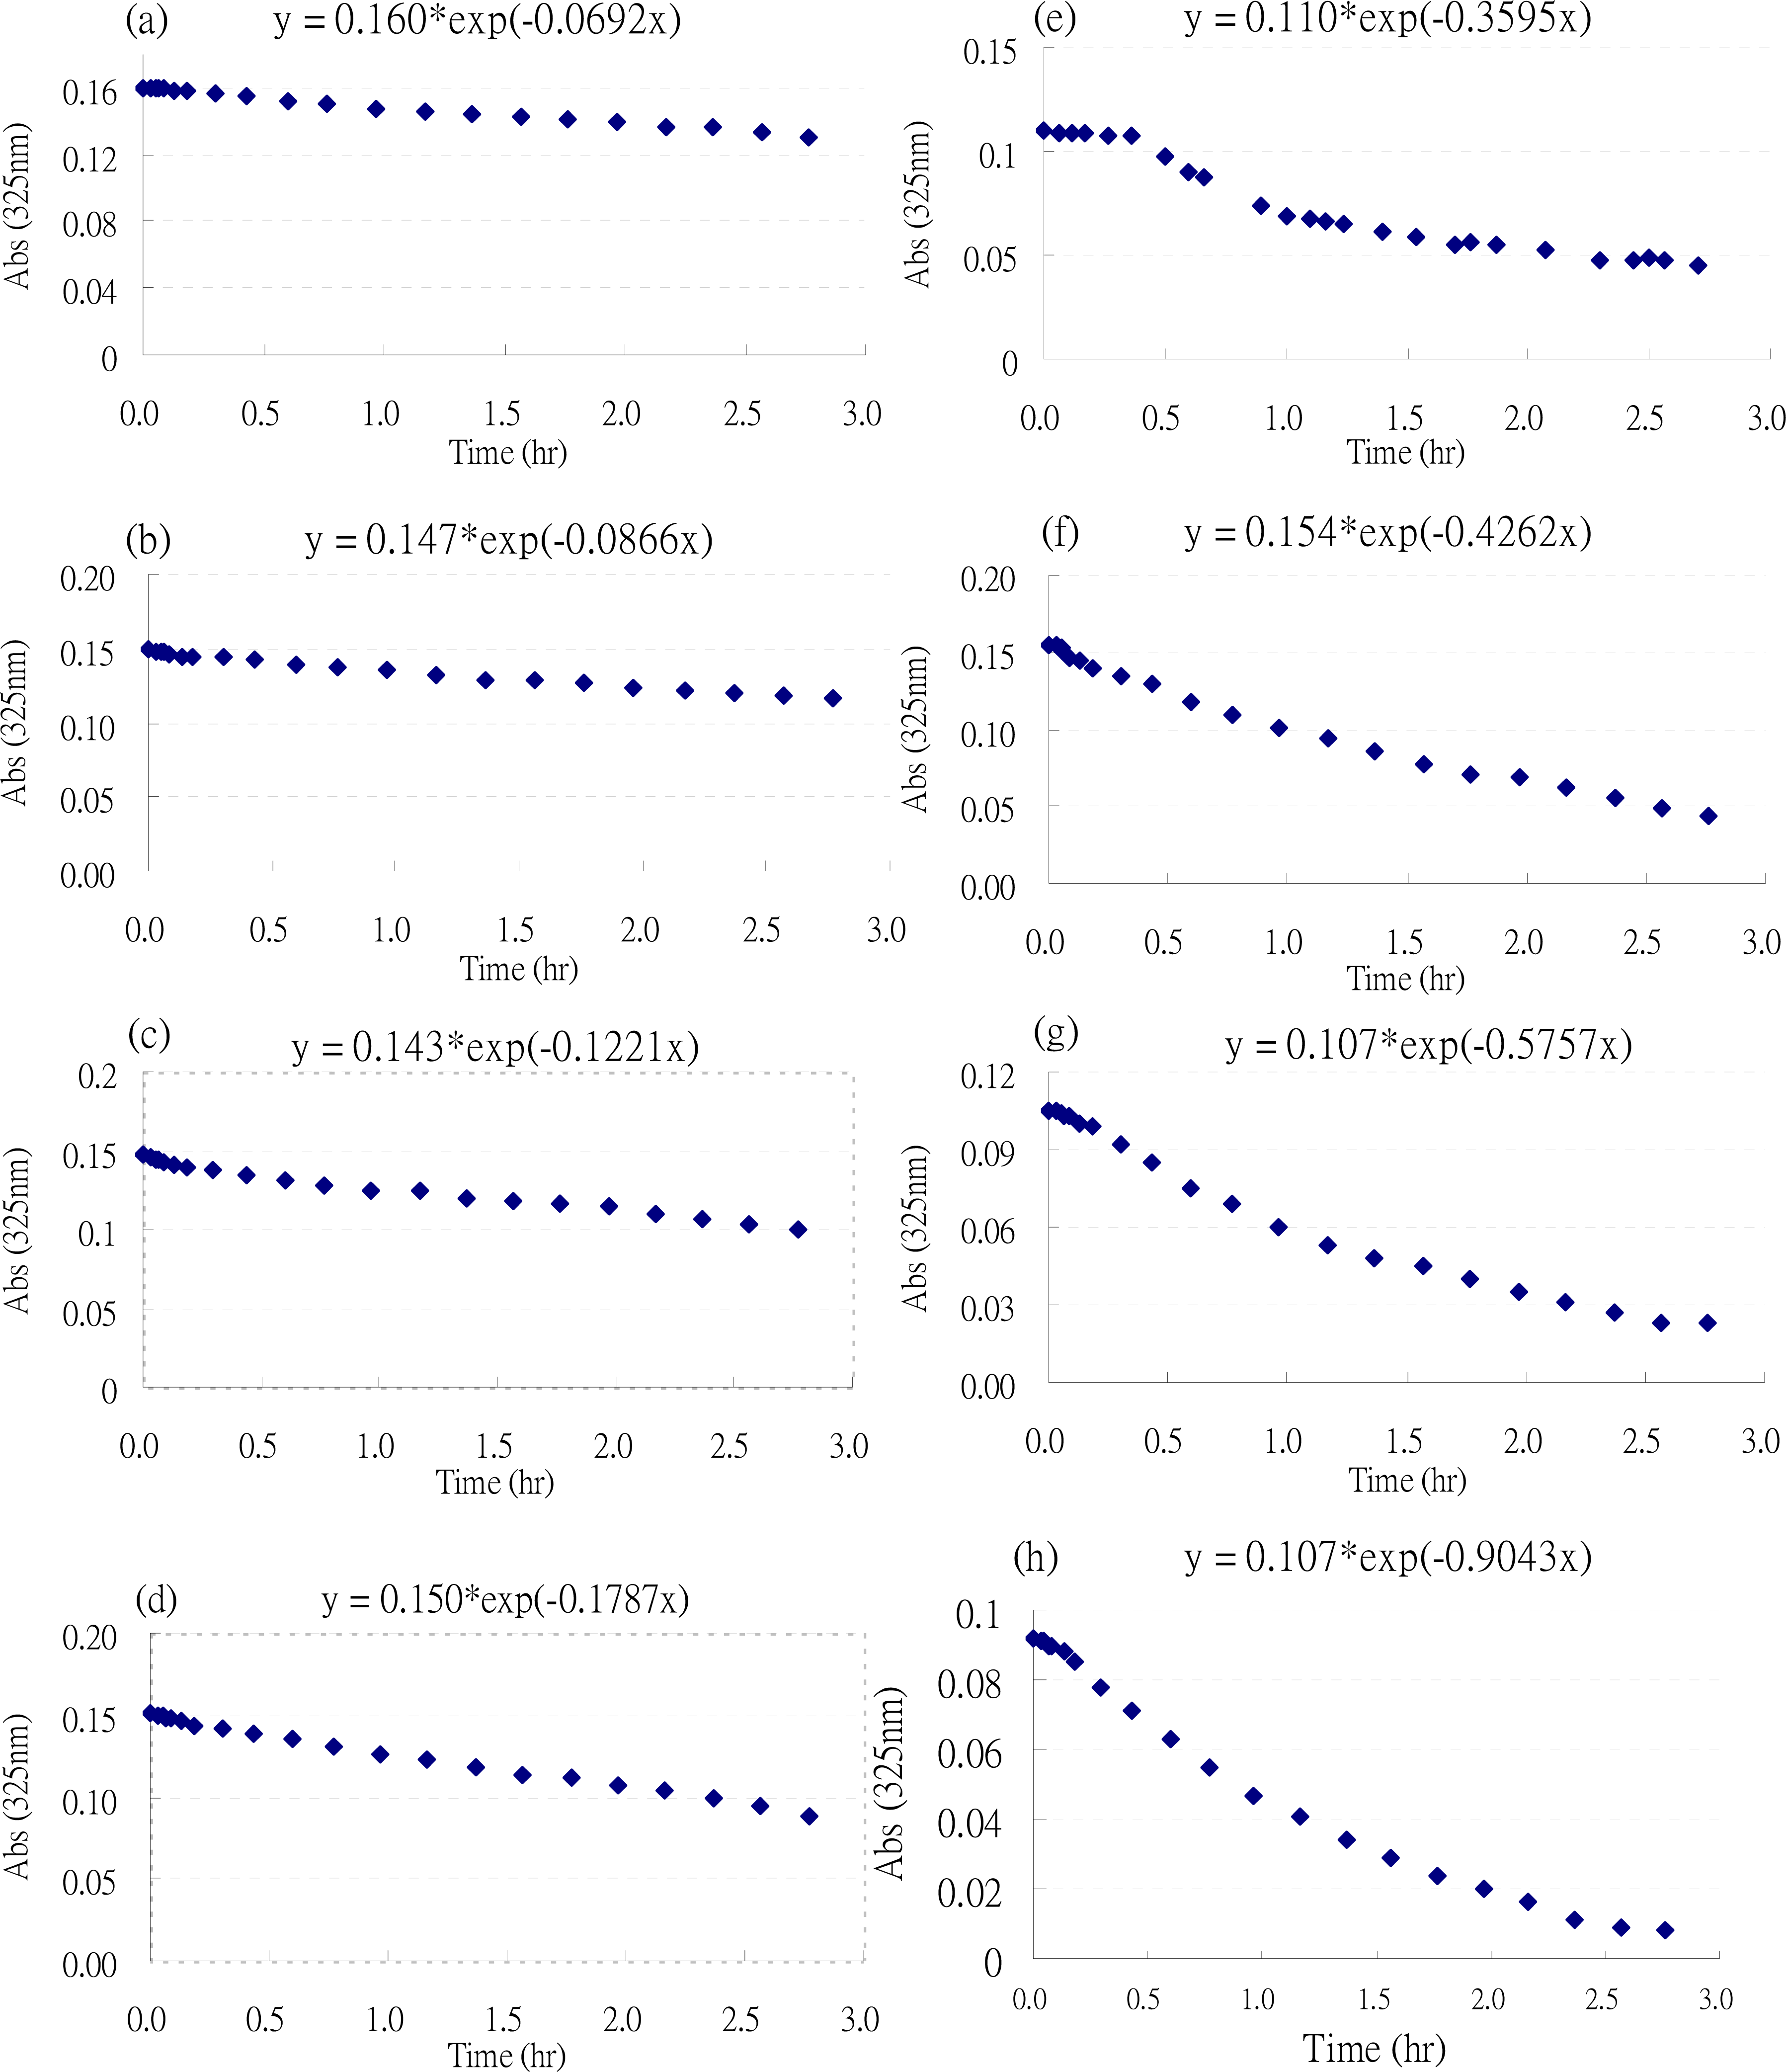
2.3 Half life determination of TRO and its application
2.4 Application of the model
3. Conclusion
4. Experimental
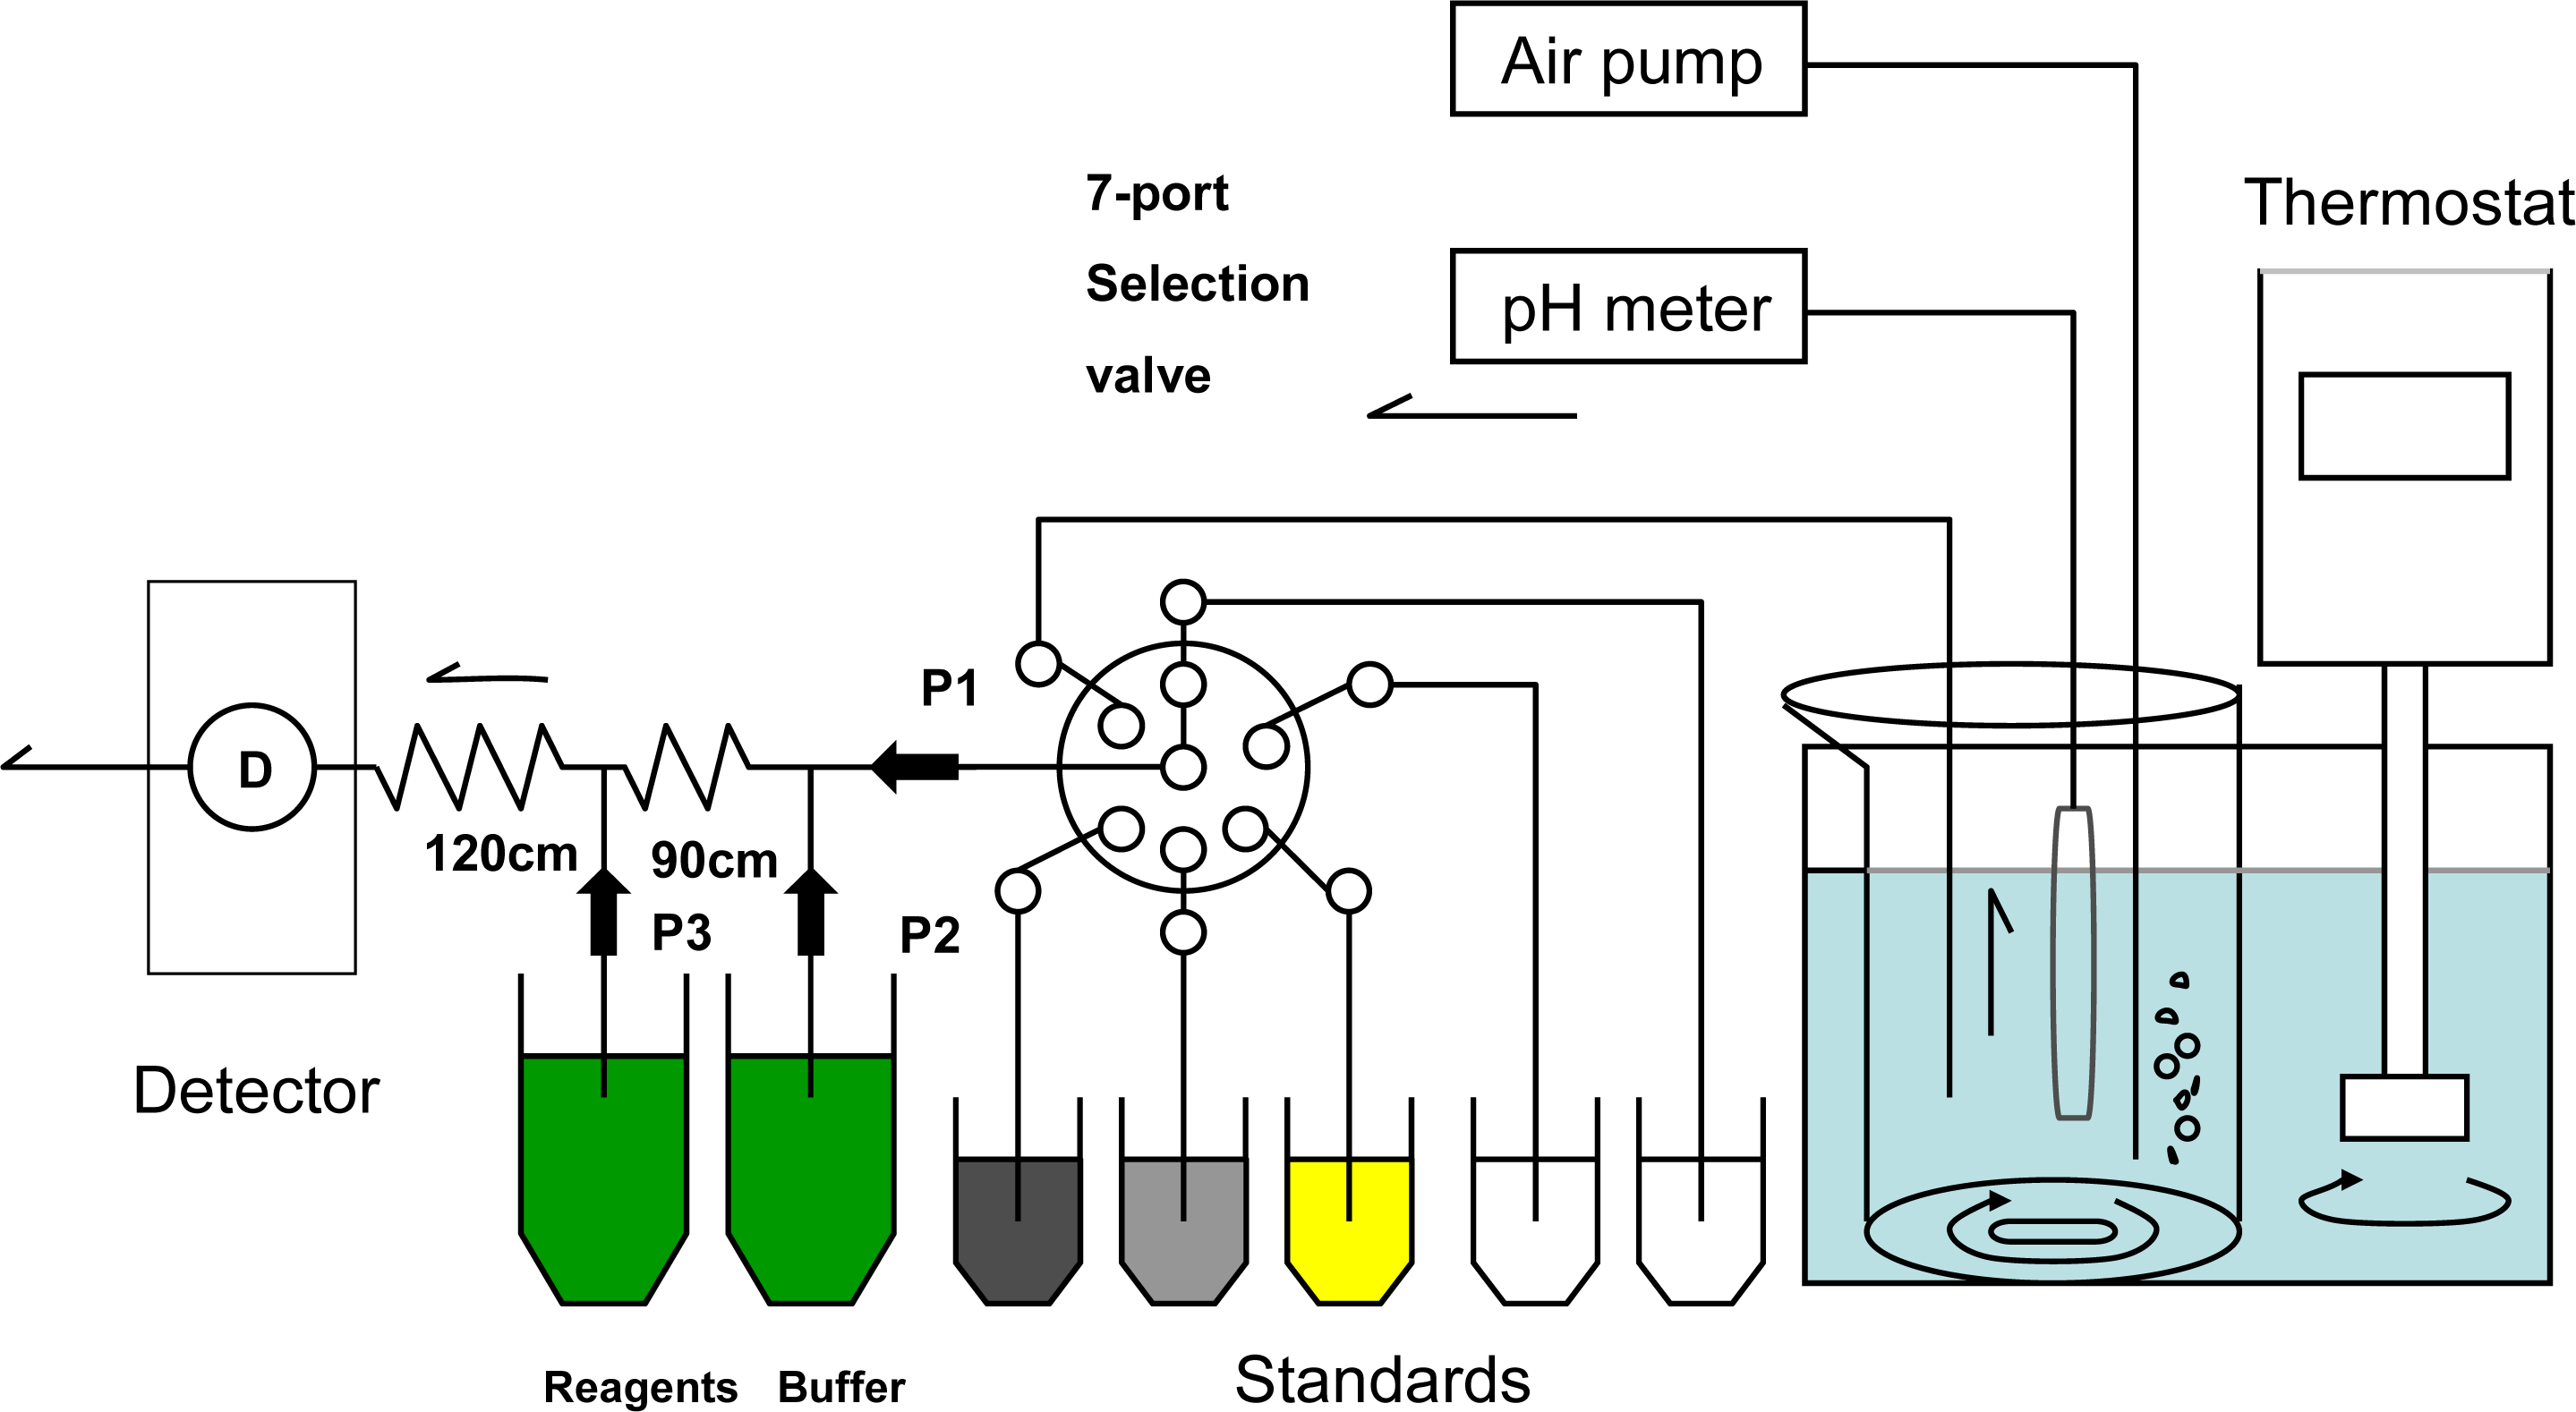
QA/QC system
Iodine colorimetry
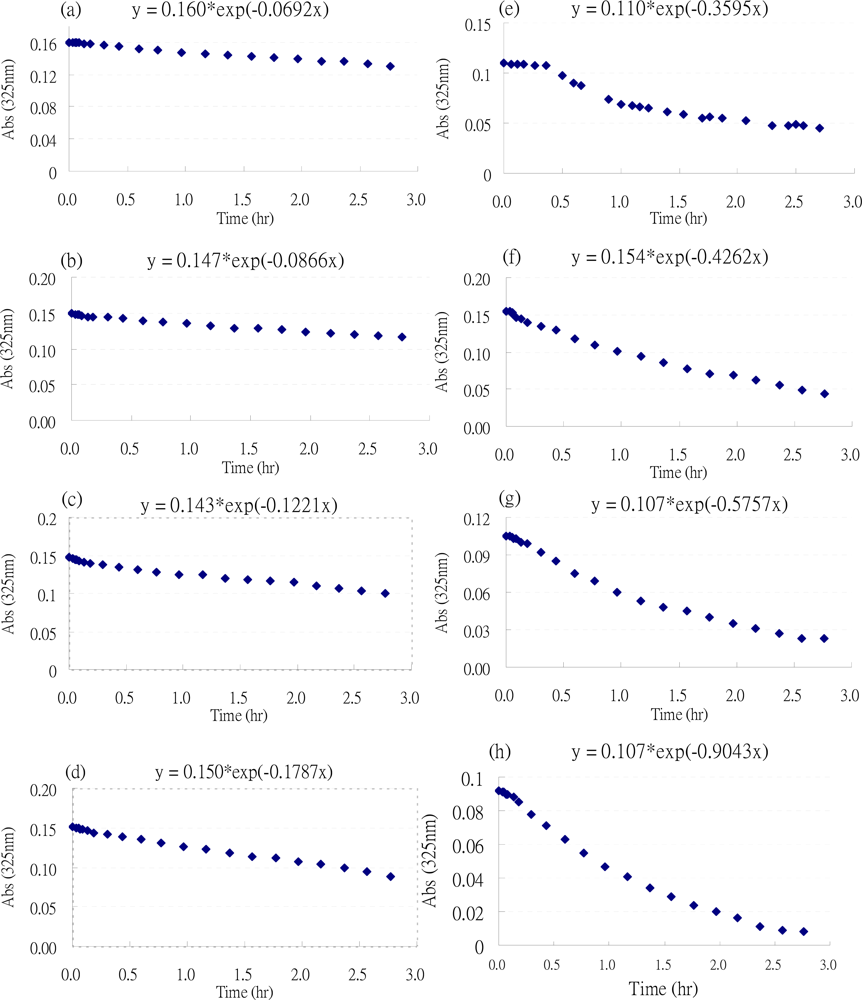
Stability of iodine colorimetry
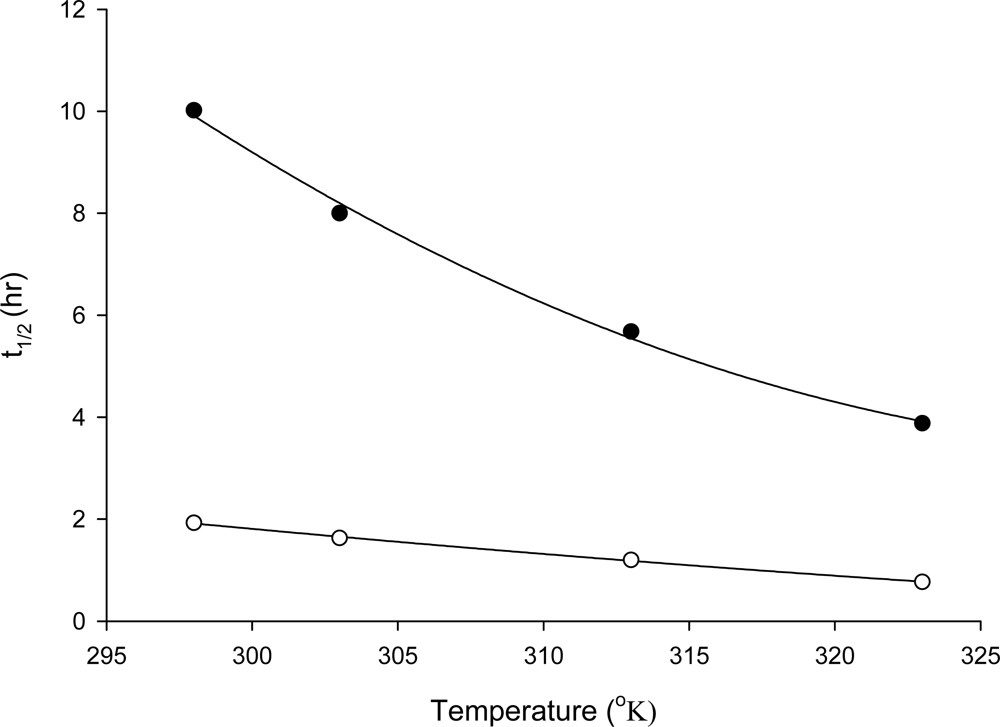
Determination of temperature-dependent decaying rate
Acknowledgments
References
- Fisher, SW; Stromberg, P; Bruner, KA; Boulet, LD. Molluscicidal activity of potassium to the zebra mussel Dreissena polymorpha toxicity and mode of action. Aqua Toxicol 1991, 20, 219–234. [Google Scholar]
- Videla, HA. Biofilms and corrosion interactions on stainless steel in seawater. Inter Biodeterioration and Biodegradation 1995, 34, 245–257. [Google Scholar]
- Sakaguchi, I; Shinshima, K; Kawaratani, K; Sugai, O. Control of mussel fouling with hot air injection and solid body abrasion (in Japanese); Denryoku Chuo Kenkyusho Hokoku; (U89031); 1989; pp. 1–51. [Google Scholar]
- Rajagopal, S; Nair, KVK; Azariah, A. Response of brown mussel, Perna indica, to elevated temperatures in relation to power plant biofouling control. J Therm Biol 1995, 20, 461–467. [Google Scholar]
- Konstantinou, IK; Albanis, TA. Worldwide occurrence and effects of antifouling paint booster biocides in the aquatic environment: a review. Environ Inter 2004, 30, 235–248. [Google Scholar]
- Yebra, DM; Kiil, S; Dam-Johansen, K. Antifouling technology-past, present and future steps towards efficient and environmentally friendly antifouling coatings (review). Prog Org Coat 2004, 50, 75–104. [Google Scholar]
- Löschau, M; Krätke, R. Efficacy and toxicity of self-polishing biocide-free antifouling paints. Environ Pollut 2005, 138, 260–267. [Google Scholar]
- Katranitsas, A; Castritsi-Catharios, J; Persoone, G. The effects of a copper-based antifouling paint on mortality and enzymatic activity of a non-target marine organism. Mar Pollut Bull 2003, 46, 1491–1494. [Google Scholar]
- Wong, GTF; Davidson, JA. The fate of chlorine in seawater. Wat Res 1977, 11, 971–978. [Google Scholar]
- Wong, GTF. Factor affecting the amperometric determination of trace quantitutle of total residual chlorine in seawater. Environ Sci Tech 1982, 16, 785–790. [Google Scholar]
- American Public Health Association, Standard Methods for the Examination of Water and Wastewater, 18th Ed ed; American Public Health Association: Washington, D.C., USA, 1992.
- Thatcher, TO. The relative sensitivity of Pacific Northwest fishes and invertebrates to chlorinated seawater. In Water Chlorination: Environmental Impact and Health Effects; Jolley, RL, Gorchev, H, Hamilton, DH, Eds.; Ann Arbor Sci. Publ: Ann Arbor, MI, USA, 1978; Volume 2, pp. 351–360. [Google Scholar]
- Dempsey, CH. The exposure of Herring postlarvae to chlorine in costal power stations. Mar Environ Res 1986, 20, 279–290. [Google Scholar]
- Fisher, DJ; Burton, DT; Yonkos, LT; Turley, SD; Turley, BS; Ziegler, GP; Zillioux, EJ. Acute and short-term chronic effects of continuous and intermittent chlorination on Mysidopsis bahia and Menidia beryllina. Environ Toxicol Chem 1994, 13, 1525–1534. [Google Scholar]
- Fisher, DJ; Burton, DT; Yonkos, LT; Turley, SD; Ziegler, GP. The relative acute toxicity of continuous and intermittent exposures of chlorine and bromine to aquatic organisms in the presence and absence of ammonia. Wat Res 1999, 33, 760–768. [Google Scholar]
- Allonier, AS; Khalanski, M; Camel, V; Bermond, A. Characterization of chlorination byproduct in cooling effluents of coastal nuclear power stations. Mar Pollut Bull 1999, 38, 1232–1241. [Google Scholar]
- Nebot, E; Casanueva, JF; Casanueva, T; Fernández-Bastóm, MM; Sales, D. In situ experimental study for the optimization of chlorine dosage in seawater cooling systems. Appl Therm Eng 2006, 26, 1893–1900. [Google Scholar]
- March, JG; Gual, M; Ramonell, J. A kinetic model for chlorine consumption in grey water. Desalination 2005, 181, 267–273. [Google Scholar]
- Hung, TC; Huang, R; Tan, TH; Shao, KT; Chen, JC; Huang, CC; Chu, TC; Fun, KL. An ecological survey on the waters adjacent to the northern Taiwan nuclear power plant sites including Yenliao coastlal area. SCOPE/ROC, Academia Sinica 1998, 103, 524. [Google Scholar]
- Su, JC; Hung, TC; Chiang, YM; Tan, TH; Chang, KH; Huang, CC; Huang, CY; Shao, KT; Huang, PP; Lee, KT; Huang, CC; Huang, CY; Fan, KL; Yeh, SY. An ecological and environmental survey on the waters adjacent to the nuclear power plant in southern Taiwan. SCOPE/ROC, Academia Sinica 1988, 59, 394. [Google Scholar]
- Hung, TC. Quality assurance on environmental analytical chemistry. Journal of Chinese Environmental Protection Society 1987, 10, A1–10. [Google Scholar]
- Yang, MH. Analytical techniques on environmental pollution. National Science Council Monthly 1987, 15, 45–54. [Google Scholar]
- USEPA. Handbook for analytical quality control in water and wastewater laboratories EPA-600/4-79-019. United States Environ. Prot. Agency. 1979.
- CEI/ACS. Principles of environmental analysis. Committee on Environmental Improvement of American Chemical Society. 1983.
- AOAC, Quality Assurance Principles for Analytical Laboratories. In Association Office Analytical Chemists; Garfield, FM (Ed.) 1984.
- Sugita, H; Hayashi, K; Asai, T; Mitsuya, T; Amanuma, K; Maruyama, C; Deguchi, Y. Spectrophotometric method for determination of total residual oxidants in seawater. Suisanzoshoku 1992, 40, 45–49. [Google Scholar]


| Temperature (°K) | DW
| SW
| ||||
|---|---|---|---|---|---|---|
| Q | r2 | t1/2 (hr) | Q | r2 | t1/2 (hr) | |
| 298 | –0.069 | 0.9985 | 10.02 | –0.360 | 0.9993 | 1.93 |
| 303 | –0.087 | 0.9988 | 8.00 | –0.426 | 0.9992 | 1.63 |
| 313 | –0.122 | 0.9981 | 5.68 | –0.576 | 0.9985 | 1.20 |
| 323 | –0.179 | 0.9994 | 3.88 | –0.904 | 0.9985 | 0.77 |
| Power plant | Date | Chlorine residue conc. (mg/L)
| Relative error (%) | |
|---|---|---|---|---|
| Predicted value | Real determination | |||
| Second Nuclear Power Plant
| Mar | 0.298 | 0.240 | 21.4 |
| May | 0.197 | 0.160 | 21.0 | |
| Aug
| 0.086
| 0.062
| 32.0
| |
| Third Nuclear Power Plant
| Mar | 0.093 | 0.088 | 5.3 |
| May | 0.081 | 0.070 | 14.7 | |
| Aug
| 0.048
| 0.041
| 15.6
| |
| Pong-Hu Chienshan Power Plant | Mar | 0.140 | 0.133 | 4.8 |
| May | 0.219 | 0.235 | 7.0 | |
| Aug | 0.069 | 0.046 | 40.2 | |
Share and Cite
Wang, J.-T.; Chen, M.-H.; Lee, H.-J.; Chang, W.-B.; Chen, C.-C.; Pai, S.-C.; Meng, P.-J. A Model to Predict Total Chlorine Residue in the Cooling Seawater of a Power Plant Using Iodine Colorimetric Method. Int. J. Mol. Sci. 2008, 9, 542-553. https://doi.org/10.3390/ijms9040542
Wang J-T, Chen M-H, Lee H-J, Chang W-B, Chen C-C, Pai S-C, Meng P-J. A Model to Predict Total Chlorine Residue in the Cooling Seawater of a Power Plant Using Iodine Colorimetric Method. International Journal of Molecular Sciences. 2008; 9(4):542-553. https://doi.org/10.3390/ijms9040542
Chicago/Turabian StyleWang, Jih-Terng, Ming-Hui Chen, Hung-Jen Lee, Wen-Been Chang, Chung-Chi Chen, Su-Cheng Pai, and Pei-Jie Meng. 2008. "A Model to Predict Total Chlorine Residue in the Cooling Seawater of a Power Plant Using Iodine Colorimetric Method" International Journal of Molecular Sciences 9, no. 4: 542-553. https://doi.org/10.3390/ijms9040542