Electrochemical Genotoxicity Assay Based on a SOS/umu Test Using Hydrodynamic Voltammetry in a Droplet

Abstract
: The SOS/umu genotoxicity assay evaluates the primary DNA damage caused by chemicals from the β-galactosidase activity of S. typhimurium. One of the weaknesses of the common umu test system based on spectrophotometric detection is that it is unable to measure samples containing a high concentration of colored dissolved organic matters, sediment, and suspended solids. However, umu tests with electrochemical detection techniques prove to be a better strategy because it causes less interference, enables the analysis of turbid samples and allows detection even in small volumes without loss of sensitivity. Based on this understanding, we aim to develop a new umu test system with hydrodynamic chronoamperometry using a rotating disk electrode (RDE) in a microliter droplet. PAPG when used as a substrate is not electroactive at the potential at which PAP is oxidized to p-quinone imine (PQI), so the current response of chronoamperometry resulting from the oxidation of PAP to PQI is directly proportional to the enzymatic activity of S. typhimurium. This was achieved by performing genotoxicity tests for 2-(2-furyl)-3-(5-nitro-2-furyl)-acrylamide (AF-2) and 2-aminoanthracene (2-AA) as model genotoxic compounds. The results obtained in this study indicated that the signal detection in the genotoxicity assay based on hydrodynamic voltammetry was less influenced by the presence of colored components and sediment particles in the samples when compared to the usual colorimetric signal detection. The influence caused by the presence of humic acids (HAs) and artificial sediment on the genotoxic property of selected model compounds such as 4-nitroquinoline-N-oxide (4-NQO), 3-chloro-4-(dichloromethyl)-5-hydroxy-2(5H)-furanone (MX), 1,8-dinitropyrene (1,8-DNP) and 1-nitropyrene (1-NP) were also investigated. The results showed that the genotoxicity of 1-NP and MX changed in the presence of 10 mg·L−1 HAs. The genotoxicity of tested chemicals with a high hydrophobicity such as 1,8-DNP and 1-NP were decreased substantially with the presence of 1 g·L−1 sediment. This was not observed in the case of genotoxins with a low log Kow value.1. Introduction
The advancement of industrialization, agricultural and urban activities have caused serious concerns about chemical substances that are discharged to the air, soil and water environment. They have a direct impact on the ecosystem and pose a threat to human health. The transformations of chemicals which accumulate in the environment can produce secondary pollutants from reactions with other chemicals. The absolute concentrations of known analytes in the environment can be determined by chemical analysis methods. However, these kinds of techniques do not provide adequate interpretation of their toxicities to biota. In order to gain a better understanding of the risk posed by various pollutants, there is an inevitable need for an effective analytical approach which is able to access the biological impacts. The use of bioassays in analytical research has provided an accurate evaluation of environmental risk.
Many researchers have reported on the existence of different mutagenic and carcinogenic compounds in river waters, suspended solids, soils, sediments and treated drinking waters [1–13]. These findings indicate a high concern about genotoxins in aquatic biota and their possible effects on human health. Microorganisms, bacteria in particular, have several attributes which make them attractive to be used in mutagenicity assays. Generally, microbial tests are simpler and more inexpensive than methods based on tissue culture and animal experiments. The Salmonella/microsome test (Ames test) and SOS induction assay (umu test) are two of the most common genotoxicity assays. The Ames test is based on a set of Salmonella typhimurium strains that revert to histidine independence upon exposure to mutagens [14]. On the other hand, umu test is one of the more rapid screening systems for genotoxins. This system is based on the ability of a number of chemicals to induce umu gene expression in a new tester strain S. typhimurium TA1535/pSKI002 in which an umuC‘-’lacZ fused gene had been introduced. Thus, the potentials of chemicals to induce SOS response can be monitored by measuring the cellular β-galactosidase activity produced by fusion gene [15–17]. The β-galactosidase activity is usually determined by measuring the products of the enzymatic reaction using UV/vis spectrometry or fluorometry. Reifferscheid et al. reported that the umu test was able to detect 86% of the Ames mutagens, while the Ames test (using at least five strains) detected 97% of the umu positive compounds [18]. The umu test is useful as a mass screening method because it can be carried out in a common 96-well microplate [19]. However, the umu test cannot be applied in direct evaluation of samples containing colored dissolved organic matter, sediment, and high concentrations of suspended matter because it depends on the spectrophotometric detection. Thus, the adsorbed genotoxins in the soil, sediment and suspended solids are assessed after extracting by an organic solvent such as hexane, dichloromethane, and acetone [1,3,5,10]. This extraction process not only complicates the assay operation but it is also makes impossible the evaluation of the genotoxicity changes caused by the presence of organic matter, suspended solids, soil and clay particles, etc.
Humic substances (HSs) are heterogeneous mixtures of polydispersed materials formed by biochemical and chemical reactions during the decay and transformation of plant and microbial matter that remains in soils, sediments and natural water. HSs are the most widely distributed natural organic compounds in various environments. The dissolved humic substances (DHSs) known as fulvic acid (FA) and humic acid (HA) are the main components of dissolved organic matter (DOM) in water [20]. HSs have affinity for a variety of heavy metal ions and hydrophobic organic compounds. Previous studies have reported on the adsorption behaviors of pollutants to HSs and soil particles [21–23]. Some of these studies even focused on the relationships between the partition coefficient (Koc) of organic pollutants and the chemical characteristics of DHSs [24–29]. HSs play an important role in aquatic and soil environment because they are strongly related to the changes in speciation and toxicity of numerous pollutants. Previous studies have showed that DHSs reduce the toxicity of pollutants such as cadmium, zinc, copper and DDT, etc. to zooplankton [30–33] and fishes [34,35]. However, reports on the changes in genotoxicity of pollutants to microbial species and animals caused by the presence of natural organic matters and soil particles are still scarce [36,37].
There are many advantages of eletrochemical detection in bioassays. For example, it is relatively a simple, rapid, inexpensive, sensitive and user-friendly method. It is applicable to optically opaque media and allows detection of a small sample volume without loss of sensitivity, unlike optical detection techniques such as UV/vis spectrometry and fluorometric detection. In some recent works, the benefits of electrochemical detection have been employed into genotoxicity assays based on the umu test [38,39]. For these assays, p-aminophenyl-β-D-galactopyranoside (PAPG) is used as a substrate to evaluate the enzymatic reaction. The β-galactosidase activity of S. typhimurium is determined by measuring the electrochemical oxidation of p-aminophenol (PAP) which is converted from PAPG by β-galactosidase.
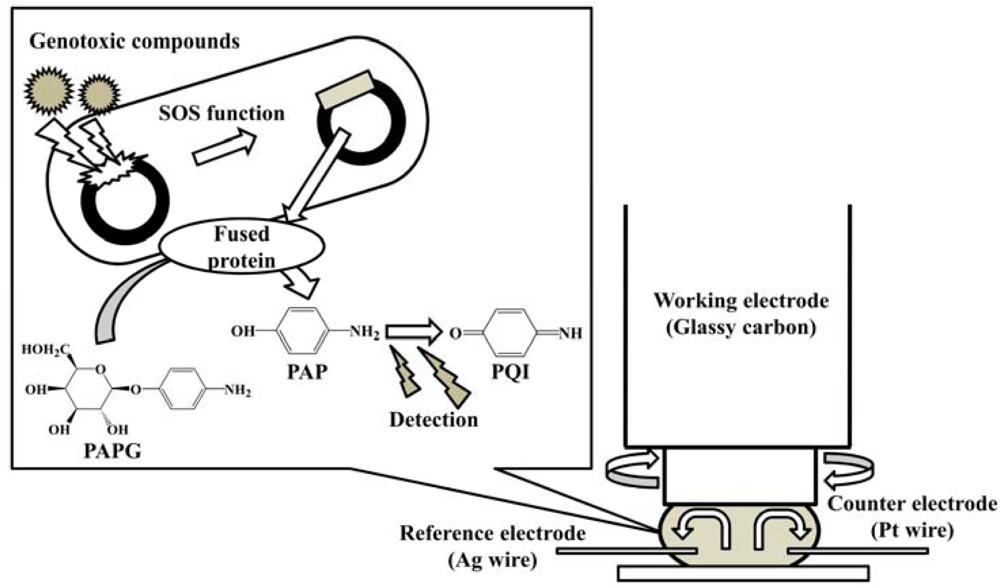
The purpose of this study is to develop a new electrochemical genotoxicity test which enables the analysis of turbid samples. It is based on the umu test with hydrodynamic electrochemical detection using a rotating disk electrode (RDE) in a microliter (ca. 45 μL) droplet, as shown in Figure 1. The RDE has a dual function. It can be used to effectively mix the sample solution and at the same time acts as an electrochemical detection device. The fast rotation speed of the RDE promotes the convective mass transport to the electrode surface. This decreases the incubation time for the enzymatic reaction. The advantages of using a microdroplet as a reaction vessel are reduced volume of reagents and waste produced, and as well as lower detection limits with shorter assay times [40–42]. The hydrodynamic electrochemical umu test proposed in this study was demonstrated with samples containing high concentration of DHSs and sediment particles, and it was compared with the regulatory umu test based on UV/vis spectrometric detection. Genotoxicity changes for several mutagens (4-nitroquinoline-N-oxide (4-NQO), 3-chloro-4-(dichloromethyl)-5-hydroxy-2(5H) furanone (MX), 1,8-dinitropyrene (1,8-DNP) and 1-nitropyrene (1-NP) caused by the presence of HAs from different sources and artificial sediment (Sphagnum moss peat 4%, kaolin 20%, quartz sand 76%, particle size is ≤25 μm) in the sample were evaluated.
2. Experimental Section
2.1. Chemicals
Bacto tryptone was obtained from Difco Co. (Detroit, MI, USA). Ampicillin, o-nitrophenyl-β-D-galactopyranoside (ONPG) and p-aminophenyl-β-D-galactopyranoside (PAPG) were from Sigma-Aldrich (St. Louis, MO, USA). D-(+)-Glucose, dimethyl sulfoxide (DMSO), 2-(2-furyl)-3-(5-nitro-2-furyl)-acrylamide (AF-2, log Kow = 1.14), 2-aminoanthracene (2-AA, log Kow = 4.13), 4-nitro-quinoline-N-oxide (4-NQO, log Kow = 0.82), 3-chloro-4-(dichloromethyl)-5-hydroxy-2(5H)-furanone (MX, log Kow = 0.61), 1,8-dinitropyrene (1,8-DNP, log Kow = 4.57), 1-nitropyrene (1-NP, log Kow = 4.75), kaolin and quartz sand were from Wako Pure Chemical Industry Ltd. (Osaka, Japan). The values for logKow of genetoxins were calculated by using KOWWIN v 1.68. Liver 9,000 × g supernatant fractions (S9) were prepared from rats pretreated with phenobarbital and 5,6-benzoflavone. The cofactors were obtained from Oriental Yeast Co. (Tokyo, Japan). The Sphagnum moss peat was purchased from a local market in Toyama, Japan. Kaolin, quartz sand, ground into a fine powder using a mortar and pestle, and passed through a 25 μm mesh sieve. All reagents used were of analytical grade, and water was sterile deionized water. The phosphate buffer solution (PBS, pH 7.4) consisted of 0.044 M NaH2PO4, 0.056 M Na2HPO4. B-buffer (pH 7.0) consisted of 0.1 M PBS, 0.01 M potassium chloride, 0.5 mM magnesium sulfate, 0.1% sodium dodecyl sulfate (SDS) and 0.05 M mercaptoethanol.
2.2. Bacterial Strain
Salmonella typhimurium NM2009 (TA1535/pSK1002/pNM12) was used as a bacterial strain. The strain was provided by Protein Purify Ltd. (Gunma, Japan). Tester strain NM2009 was constructed by subcloning the bacterial O-acetyltransferase (O-AT) gene into a plasmid vector pACYC184 and introducing the plasmid into the original strain S. typhimurium TA1535/pSK1002 harboring an umuC‘-’lacZ fusion gene [43–46]. O-AT is suggested to catalyze key steps in the mutagenic activation of aromatic amines. NM2009 strain indicated high mutagenic responses by aromatic amines [46].
2.3. Isolation and Purification for Humic Acids
Four different kinds of HAs were used as DHSs. A commercially available HA was obtained from Wako Pure Chemical Co. (WHA). This was dissolved in 0.1 M NaOH, and the solution was then treated with mixture of HF and HCl. The resulting precipitate was transferred to a dialysis tube (molecular weight cutoff 500 Da). After dialysis, the slurry was freeze dried. The soil, peat and sediment samples used in the isolated HAs were collected from tropical peat land (Central Kalimantan, Indonesia, KPHA), peat land of Shinshinotsu town (Hokkaido, Japan, SPHA), high moor peat of Amou moor (Gifu, Japan, APHA), brown forest soil (Toyama, Japan, FSHA). HAs of soil, peat and sediment were extracted by the method based on the International Humic Substances Society (IHSS) [47]. Prior to use the experiments, the purified HA was dissolved in 1 M NaOH solution (>pH 10) and stirred for 30 min. The pH of solution was adjusted to pH 8.0 with 1 M HCl.
2.4. Characterization of HAs
HAs used in this study were characterized by means of UV/vis spectroscopy, functional group analysis, elemental analysis, and size exclusion chromatography. The results for characterization of HAs are shown in Table 1.
2.4.1. Spectroscopic Characterization
The absorbance values at 250, 280, 365, 400, and 600 nm were recorded for the calculation of E4/E6, E280, E2/E3. The absorptivities at 280 nm and 400 nm were calculated as: E (1 cm−1·g−1 of C) = absorbance/[HS (g·L−1)] × (% C/100). The quotient E4/E6 (the ratio of absorbance at 400 and 600 nm) is widely used in soil science as an indicator for humification [48]. In generally, the progressive humification is indicated by decreasing of E4/E6 ratios. E280 and E2/E3 (the ratio of absorbance at 250 and 365 nm) correlated strongly with the total aromaticity and averaged molecular weight of all humic solutes [48].
2.4.2. Functional Group Analysis
The amount of total acidity and carboxylic acid content were measured by potentiometric methods using the barium hydroxide and Ca-acetate methods, respectively [20]. The contents of phenolic hydroxyl groups were calculated by subtracting the carboxylic acid contents from the total acidity.
2.4.3. Elemental Analysis
The analysis of C, H, N, S and ash contents of HAs were carried out by means of a Micro Corder JM 10 type CHN analyzer (J-Science Lab. Co. Ltd., Kyoto, Japan). The sulfate ion, which is absorbed in H2O2 aqueous, was analyzed using a DX-500 type ion chromatography (Dionex, Sunnyvale, CA, USA). The percentage of oxygen is found by subtracting the total sum percentage of C, H, N, S, and ash elements from 100.
2.4.4. Estimation of Molecular Weight by Size Exclusion Chromatography
A three hundred μL aliquot of 1 g·L−1 HAs solution dissolved in 0.01 M NaOH and 900 μL of 0.01 M phosphate buffer (pH 7.0) and acetonitrile (75/25 = v/v) was mixed. To determine the molecular weight of HAs, a 20 μL aliquot was injected into a Jasco PU-2080 plus Intelligent HPLC pump system equipped with a UV-2075 UV/vis detector (Japan Spectroscopic Co., Tokyo, Japan). The mobile phase consisted of a mixture of 0.01 M phosphate buffer (pH 7.0) and acetonitrile (75/25 = v/v), and the flow rate was set at 0.75 mL·min−1. A TSK-Gel α-M column (Tosoh, 7.8 mm inner diameter × 300 mm) was used as the solid phase, and the column temperature was maintained at 40 °C. The UV absorption of HAs was measured at 260 nm. Reference substances for construction of molecular weight calibration curves were sodium salts of polystyrene sulfonates with molecular weights of 1.4 k, 4.3 k, 6.8 k, 13 k, 17 k, 32 k, 49 k, 77 k, 150 k, 350 k, 990 k and 2,600 k Dalton (Fluka, Buchs, Switzerland). The number-average molecular weight (Mn) and weight-average molecular weight (Mw) for each HA were estimated.
2.5. SOS/umu Test Procedure
The umu test was performed in a 96-well round-bottom micro-plate made by polystyrene (Falcon, Franklin Lakes, NJ, USA). The S. typhimurium strains were grown in TGA medium (1% Bacto tryptone, 0.5% NaCl and 0.2% glucose) supplemented with 20 μg·mL−1 ampicillin at 37 °C for about 12–16 h. The overnight culture was diluted 50-fold with TGA medium and it was incubated at 37 °C until the bacterial density reached absorbance of 0.2 at 595 nm using a common square cell with 10 mm of optical path length. The bacterial culture was subdivided into 200 μL aliquots in the each of the microplate well where by 20 μL of test compound solution and 80 μL of 0.1 M PBS with or without HA and artificial sediment were added to it. The concentration of HA and artificial sediment shown in this manuscript are one in this incubation step in 300 μL of mixture solution. In the case where metabolic activation of test compounds are necessary, 20 μL of test compound, 20 μL of S9-mix (the S9 fractions combined with cofactors) and 60 μL of 0.1 M PBS with or without HA and artificial sediment were added to 200 μL of the bacteria culture. AF-2 and 2-AA were used as positive control chemicals in this study. 2-AA shows metabolically activated to a mutagenic compound by reacting with S9-mix. DMSO was used as negative control. After incubating the mixture for 2 h at 37 °C with gently shaking in incubator (M-BR-024, TAITEC, Tokyo, Japan), the measurements of β-galactosidase activity were performed. The minimal detectable concentration was defined as the concentration that gives twice of signal obtained by control experiment. Prior to the electrochemical measurements, the microplate with the exposed bacteria is kept on ice until usage to prevent bacterial growth.
2.5.1. Spectroscopic Detection Procedure
The spectrophotometric measurements were performed as follows: after incubation at 37 °C for 2 h, the bacterial density at 595 nm (OD595) was measured by microplate reader (Model 550, BIO-RAD, Hercules, CA, USA). Ninety μL of the treated bacterial cell suspension were diluted with 120 μL of B-buffer, and then 30 μL ONPG (4.5 mg·mL−1 in 0.1 M PBS) were added. The mixture was incubated at 37 °C for 30 min with gentle shaking. The reaction was terminated after 30 min by adding 60 μL of 1 M Na2CO3. The absorbance was measured at 415 nm (OD415) and 548 nm (OD548). The units of β-galactosidase activity were calculated based on the formula of Miller [49] as follows: β-galactosidase activity (Unit/A595) = 1,000 × (OD415 − 1.75 × OD548) / (t × v × OD595), where t is the enzymatic reaction time (min) and v is the volume of the bacterial suspension (mL).
2.5.2. Electrochemical Detection Procedure
Hydrodynamic amperometry with a rotating disk electrode (RDE) was done using an electrochemical analyzer (ALS-1200, Bioanalytical Systems Inc. (BAS) (West Lafayette, IN, USA). A glassy carbon disk electrode (6 mm outer diameter, 3 mm inner diameter (BAS)), a silver wire (0.7 mm diameter) and a platinum wire (0.5 mm diameter) were used as working, reference, and counter electrode, respectively. Prior to the measurement, the glassy carbon disk electrode was polished sequentially with 0.3 and 0.05 μm alumina paste and then rinsed well with water.
Forty μL of the S. typhimurium solution were sandwiched between the glassy carbon disk electrode surface and a Parafilm® (Pechiney Plastic Packaging Co., Chicago, IL, USA) covered a glass slide as illustrated in Figure 1. The potential was applied to the electrode and the rotation was set at 3,000 rpm. After an equilibration time of 5 s, the current was measured in order to establish a baseline current. At 20 s, 5 μL of 16 mg·mL−1 PAPG (final concentration 6.56 mM) were added to the droplet by a micropipette and the current was measured for an additional 20 s. The slope between 30 s and 40 s was corrected by subtracting the background slope, taken between 10 s and 20 s, to give the reaction velocity.
3. Results and Discussion
3.1. Investigation of Electrochemical Behavior of PAP and PAPG in the Sample with or without S9-mix by Liner Sweep Voltammetry Using RDE System
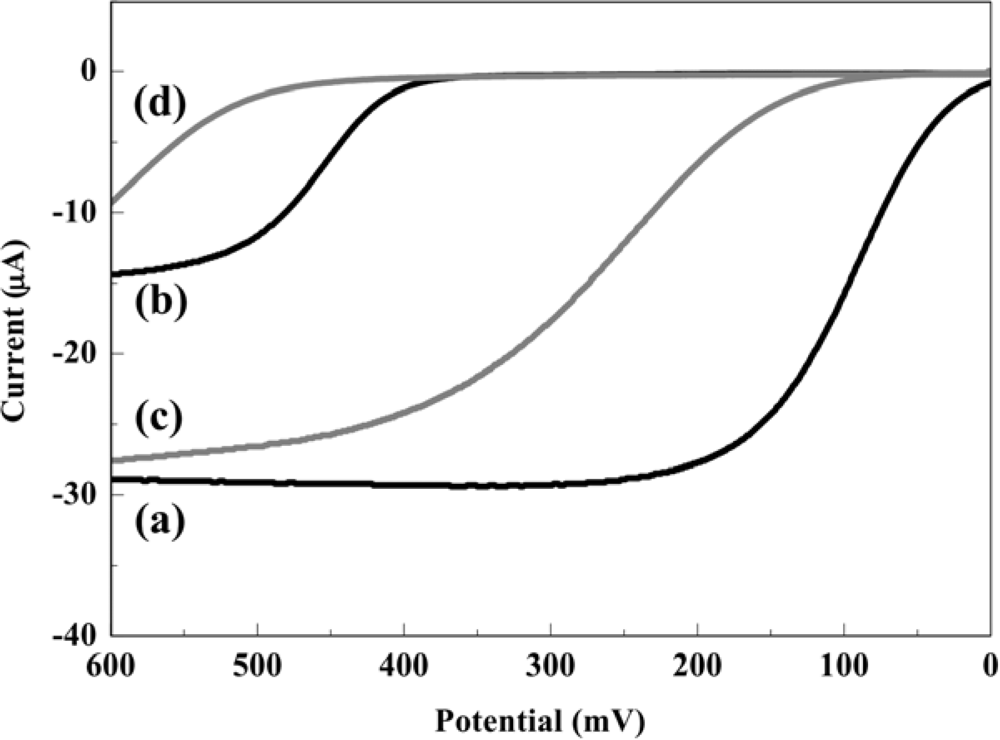
The electrochemical behaviors of PAP and PAPG at the RDE in 0.1 M PBS with or without S9-mix were investigated by hydrodynamic linear sweep voltammetry as shown in Figure 2. The measurements were performed at a scan rate of 100 mV·s−1 with a rotation rate of 3,000 rpm in a 45 μL droplet including 0.2 mM PAP or PAPG with or without 10% of S9-mix. In this assay, the electrochemical oxidation of PAPG should not influence the oxidation of PAP, because PAPG molecules exist at a much higher concentration compared with PAP molecules which are the enzymatic product. In the case without S9-mix, the mass-transfer limited current (Levich current) for PAP and PAPG oxidation was obtained at a potential over 200 mV and 500 mV, respectively. On the other hand, the electrochemical oxidation signals of PAP and PAPG were shifted toward positive potential when S9-mix was added in the sample. However, the mass-transfer limited currents obtained from PAP oxidation were almost the same in the samples with and without S9-mix. These results show that the presence of S9-mix hardly interfered with the electrochemical detection of PAP. Thus, the potential applied in the hydrodynamic choronoamperometric measurements in order to assess the genotoxicity were chosen at 300 mV for the sample without S9-mix and 400 mV for the sample with S9-mix.
3.2. Influence of HA and Sediment on the Electrode Response of PAP
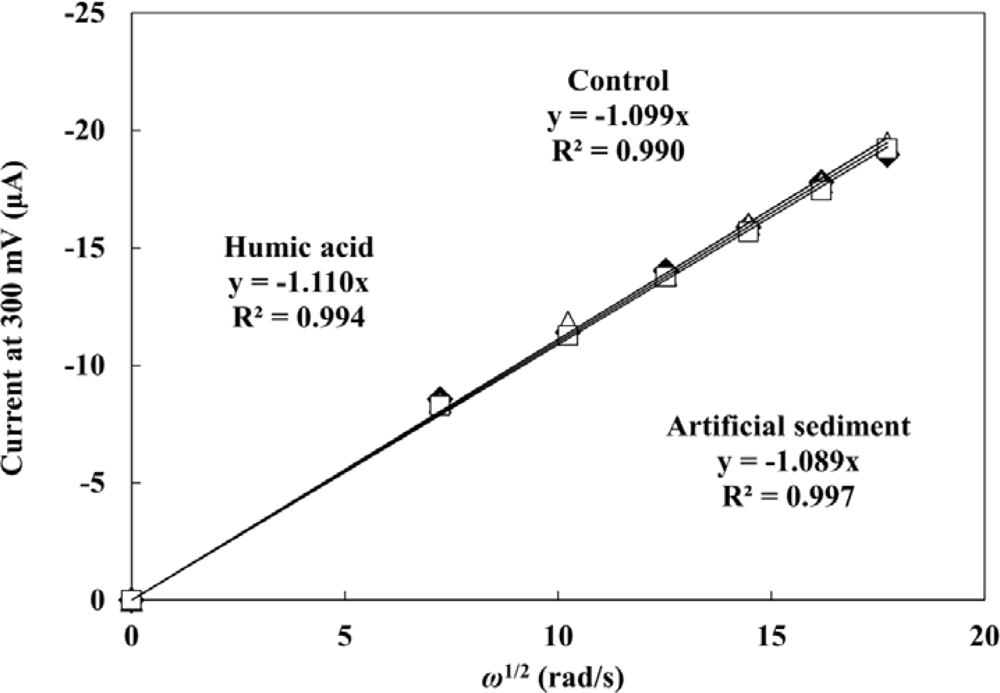
The influence of HA and sediment present in the sample on the PAP detection were evaluated by hydrodynamic linear sweep voltammetry. Forty five μL of droplet including 0.2 mM PAP were measured with different rotation rates of 500, 1,000, 1,500, 2,000, 2,500 and 3,000 rpm at a scan rate of 100 mV·s−1. A completely rigorous hydrodynamic treatment has been given by Levich’s equation [40] as follows: il = 0.620nFAC0D2/3ν−1/6ω1/2, where il is the mass-transfer limited current, n is the number of electrons involved in the reaction, C0 is the analyte concentration, ν is the kinematic viscosity of the fluid, and ω is the angular velocity of the disk (2π × rpm). The plots of mass-transfer limited current values against square root of ω are shown in Figure 3. The limiting currents showed a good linear relationship with square root of ω. This indicates that the electrochemical response of PAP is controlled by the convective mass transport resulting from the hydrodynamic flow caused by RDE. The linear relationship between the limiting currents of PAP and square root of ω did not change with the presence of 40 mg·L−1 WHA and 1 g·L−1 of the artificial sediment. It is clear that the hydrodynamic voltammetric detection for PAP is not affected by the high concentration of DHSs and sediment particles. Therefore, the application of hydrodynamic voltammetric detection to the umu test is an effective strategy to achieve the development of a genotoxicity test which can be used for the evaluation of samples including organic matter, suspended solids and soil, etc.
3.3. Demonstration of Hydrodynamic Electrochemical Genotoxicity Test for AF-2 Using RDE System
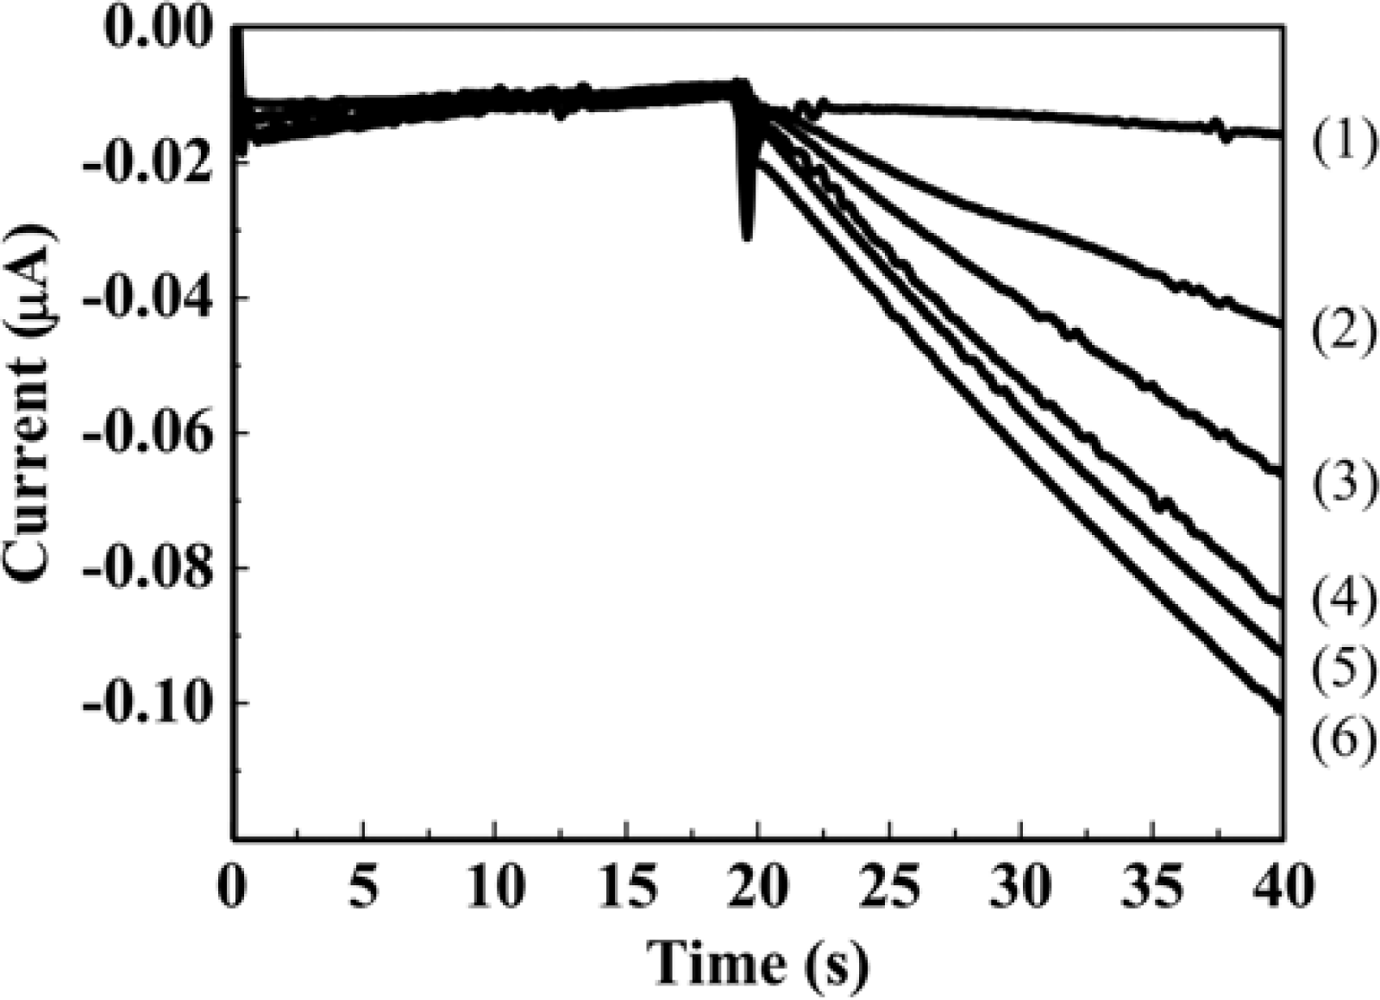
The genotoxicity tests based on hydrodynamic chronoamperometry using the RDE system in a microliter droplet were demonstrated for AF-2 as a model genotoxic compound. Figure 4 shows the hydrodynamic chronoamperograms obtained from different concentrations of PAPG as the enzyme substrate. Each concentration of PAPG (5 μL) was added to 40 μL of S. typhimurium solution. Prior to the measurements, S. typhimurium NM2009 strain was exposed to 30 ng·mL−1 AF-2 for 2 h at 37 °C with gentle shaking in an incubator. An obvious increment of anodic current with increasing concentration of PAPG injected into the droplet sample including S. typhimurium was obtained within only 40 s.
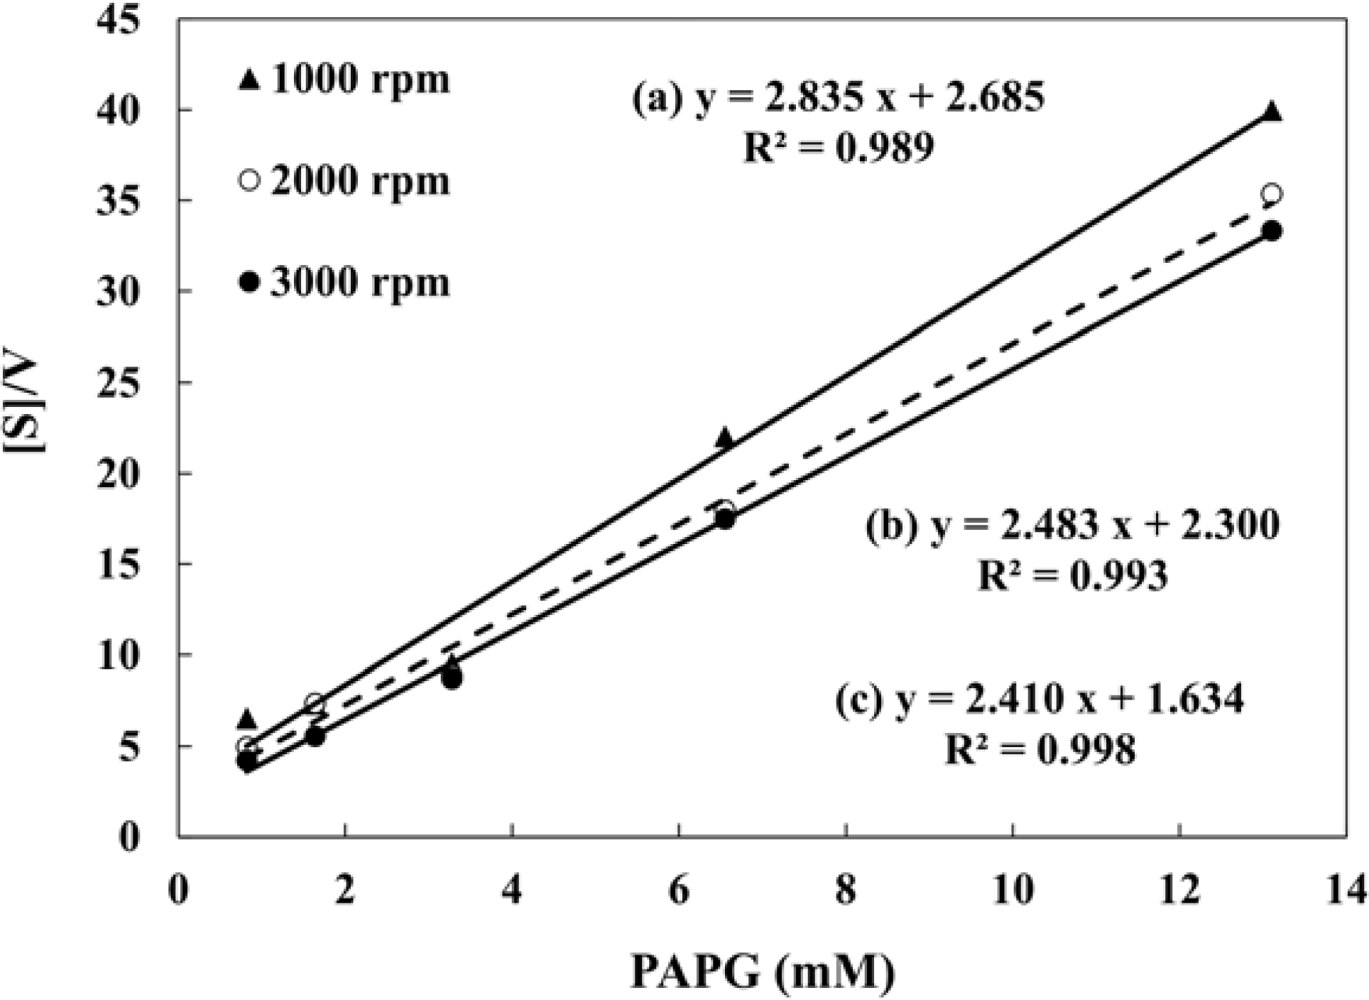
The hydrodynamic amperometric responses of S. typhimurium with different concentrations of PAPG were fitted according to the Michaelis-Menten equation (v = vmax [PAPG]/(KM + [PAPG])). Figure 5 shows the Hanes-Woolf plots of β-galactosidase in S. typhimurium obtained by the hydrodynamic voltammetry with a rotation rate of 1,000, 2,000, and 3,000 rpm. The Michaelis-Menten constant (KM) and the maximum velocity (vmax) obtained from the Hanes-Woolf plots are shown in Table 2. Buchinger et al. proposed the umu test based on chronoamperometric detection using the screen printed electrode, and the Michaelis-Menten constant was determined to be 1.78 mM [39]. As for this study, the obtained Michaelis-Menten constant was 0.68 mM at the 3,000 rpm. This indicates that the hydrodynamic amperometry with RDE system in a microliter droplet is usable in evaluating enzyme activity from S. typhimurium caused by exposure to genotoxins.
3.4. Comparison of Genotoxicity Tests with Spectrophotometric and Hydrodynamic Electrochemical Detection
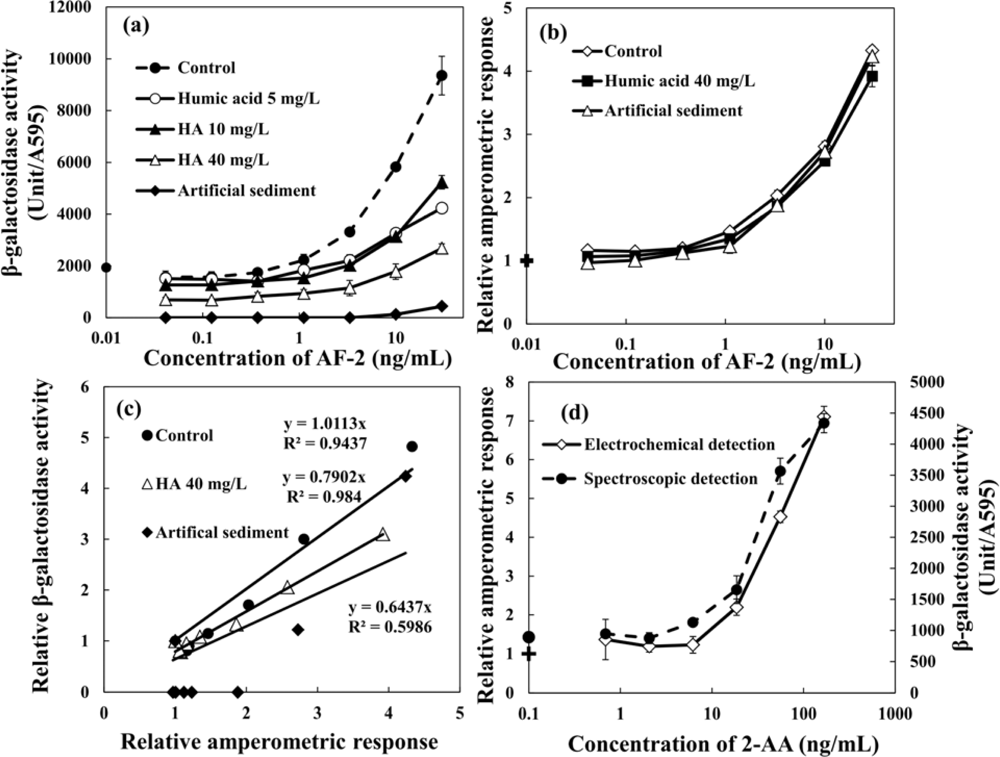
The dose-response curves of AF-2 obtained by the regular umu test based on spectrophotometric detection are shown in Figure 6(a). As compared with the control experiment, it is clear that the assay was strongly affected by the presence of WHA in the sample. This was even observed at a low concentration of HA (5 mg·L−1 of WHA). Moreover, the degree of interference increased with increasing HA concentration and the minimal detectable concentrations for AF-2 increases with increasing concentration of WHA. The presence of 1 g·L−1 artificial sediment in the sample strongly affected the genotoxicity assay results, and the genotoxicity of AF-2 was hardly detected in the sample which contained artificial sediment. The relative amperometric responses obtained from the umu test based on hydrodynamic amperometric detection using RDE system in a droplet are shown in Figure 6(b). The relative amperometric response represents the rate obtained from sample normalized by the rate of the negative control sample. In contrast with the umu test based on spectrophotometric detection, the assay based on hydrodynamic amperometric detection was unaffected by the presence of humic acid and sediment particles. The dose-response curves of AF-2, even in the presence of high concentration of WHA (40 mg·L−1) and 1 g·L−1 artificial sediment, showed a good correlation with the one obtained from control experiment. Figure 6(c) shows the relationships between the relative amperometric respose and the relative β-galacotosidase acitivity. The results obtained from the control experiment based on these two methods showed good agreement. However, the slope of the relative amperometric respose vs. the relative β-galacotosidase acitivity decreased by the presence of 40 mg·L−1 WHA and 1 g·L−1 artificial sediment. These results indicate that the proposed electrochemical umu test can be applied to samples containing HAs and sediment particles, contrary to the common umu test based on optical detection that is strongly interfered by the presence of HA and sediment particles.
In addition, the comparison of the umu test based on spectrophotometric detection and the hydrodynamic amperometric detection were performed for the metabolically activated genotoxicity of 2-AA as shown in Figure 6(d). Similar dose-response curves were obtained from both methods. Both the spectrophotometric and electrochemical detection methods showed the same value of the estimated minimal detectable concentration for 2-AA. Therefore, this method can also evaluate metabolically activated genotoxicity.
The detection time required for the enzymatic reaction with substrate using this method is only 40 s, which is a good improvement when compared to the spectrophotometric and other electrochemical detections that require much longer times, anywhere from 10 to 60 min [38,39].
3.5. The Changes in Genotoxicity of 4-NQO, MX, 1,8-DNP, 1-NP Caused by HAs and Soil Particles
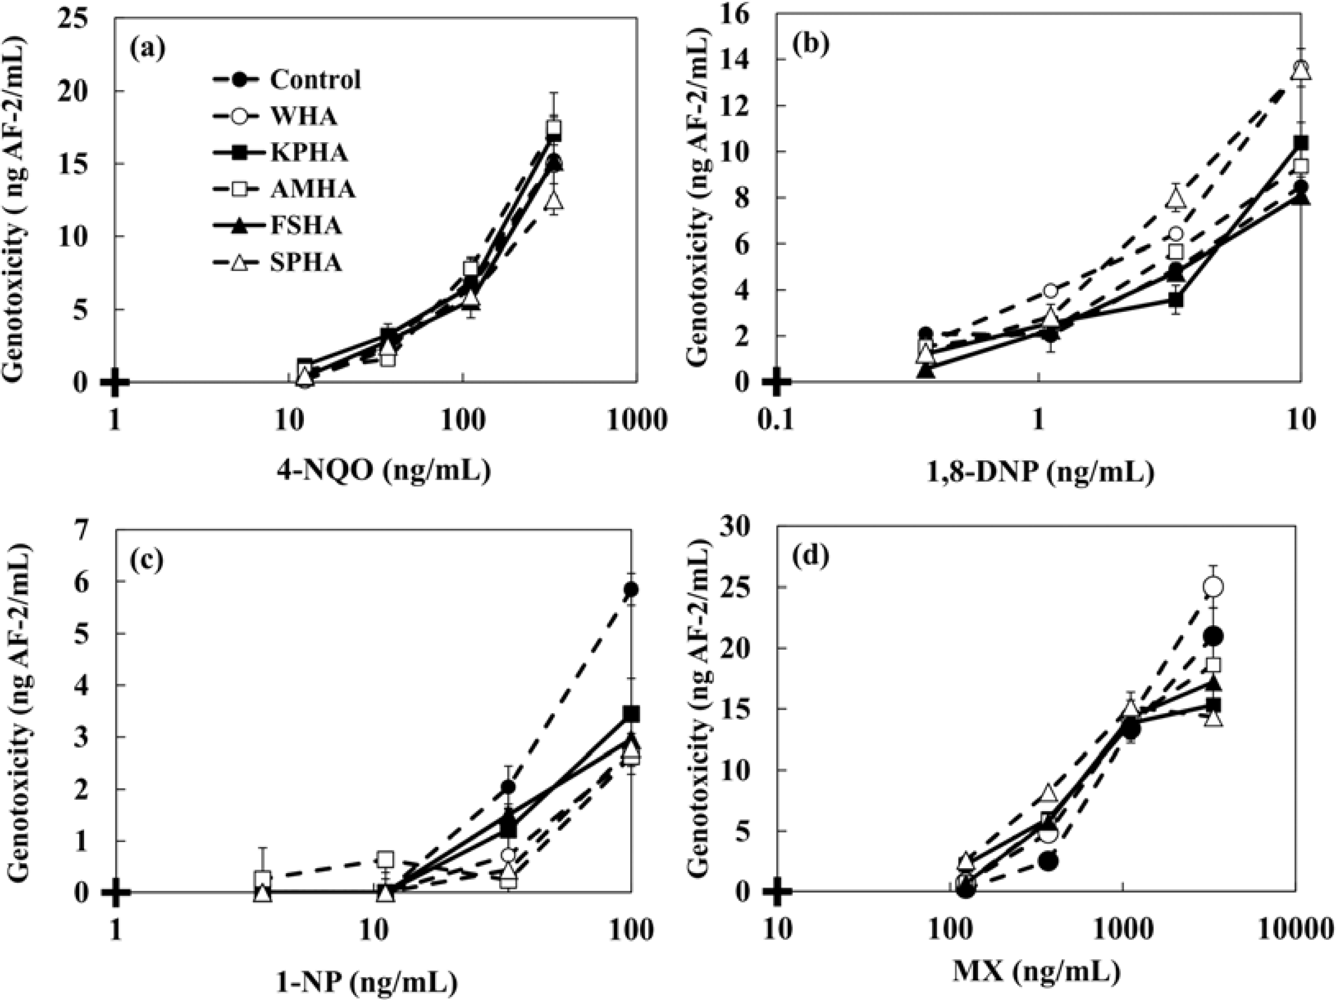
The changes in the genotoxicity of 4-NQO, MX, 1,8-DNP and 1-NP caused by the presence of humic acids (WHA, KPHA, AMHA, FSHA, SPHA) and artificial sediment (Sphagnum moss peat 4%, kaolin 20%, quartz sand 76%) were evaluated. 4-NQO is known to produce cancer in a number of organs and tissues. MX is a mutagenic and carcinogenic chlorinated franone and it is formed during chlorination of fulvic and humic acid [2,4,6,8]. Many researchers have reported that MX is a disinfection by-product found in drinking water at ng·L−1 levels [8,9,11]. 1,8-DNP and 1-NP were used as typical nitroarenes which have been detected in the extracts of diesel and gasoline emission, fly ash particles, cigarette smoke condensates and home heater emissions. Ten mg·L−1 HAs or 1 g·L−1 artificial sediment were added to each genotoxic compound and left at room temperature in the dark with gentle shaking. After 24 h, the mixture solutions were tested by adding the strain. Table 3 and Figure 7 show the minimal detectable concentrations of 4-NQO, MX, 1,8-DNP and 1-NP and the dose-response curves in the presence of 10 mg·L−1 of various HAs. The genotoxicity shown in y-axis of Figure 7 was converted to AF-2 concentration. In the case of 4-NQO, the changes of genotoxicity by the presence of 10 mg·L−1 HAs were not observed. An increment of genotoxicity was observed for MX. On the other hand, the presence of HAs mitigated the genotoxicity of 1-NP. The minimal detectable concentrations of each genotoxin in the presence of HAs are shown in Table 3. We investigated a correlation between the genotoxicity changes caused by the presence of HAs and each chemical character of HAs as shown in Table 1. The finding shows that there was no correlation between them.
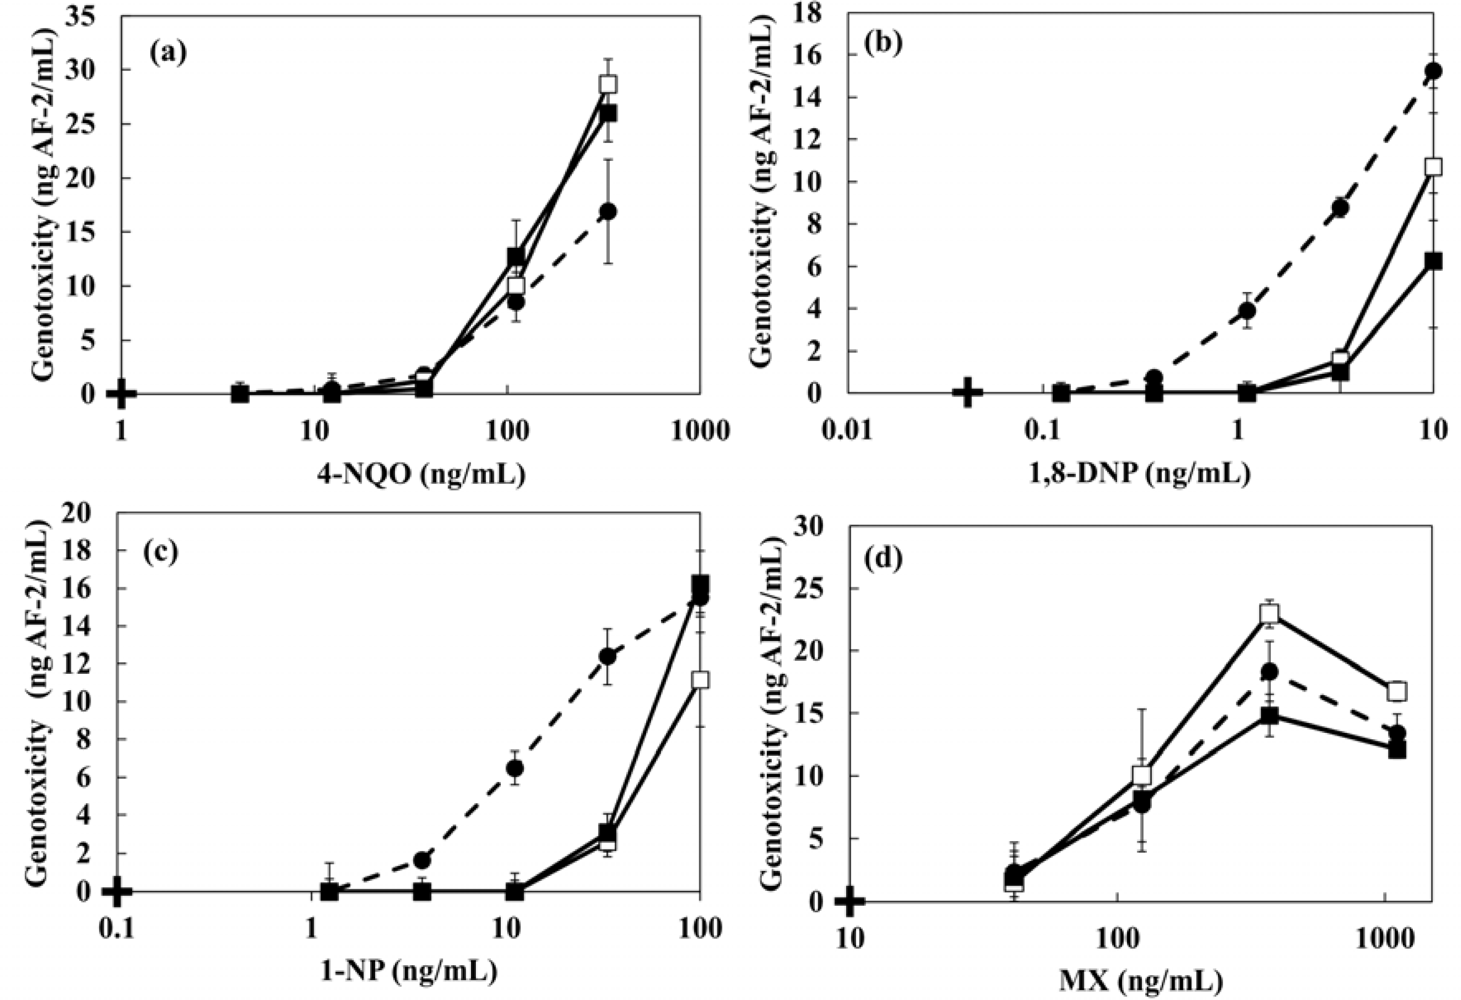
The dose-response curves and the minimal detectable concentrations of 4-NQO, MX, 1,8-DNP and 1-NP in the presence of 1 g·L−1 artificial sediment are shown in Figure 8 and Table 4, respectively. The genotoxicity of 4-NQO and MX did not change by the presence of sediment. However, a decrease of genotoxicity of 1,8-DNP and 1-NP were observed in the sample including sediment. The minimal detectable concentration of 1-NP in the presence of sediment showed 5.8-fold higher increase than the case without artificial sediment (Table 4). The reduction of genotoxicity could be caused by the changed bioavalability because hydrohobic genotoxic compounds with a high hydrophobic property tend to adsorb onto sendiment particles. The log Kow values of 1,8-DNP and 1-NP are 4.57 and 4.75, respectively. Zang et al. have also been reported that genotoxicity of pesticides against the earthworm (Eisenia fetida) was changed by the presence of artificial sediment [37]. In addition, similar results were obtained in the case of modified artificial sediment in which organic components were removed. These results indicate that the genotoxicity of hydrophobic organic compounds is influenced by the presence of inorganic constituents in sediments more than by organic components. Sun et al. reported that silica particles (75 μm of particle size and 6 nm of pore size) showed a high sorption constant (7.60) for both naphthalene and pyrene [23]. The particle size of the kaolin and quartz sand that comprise the artificial sediment used in this study are ≤25 μm. Therefore, it seems that the adhesion of genotoxins with a high hydrophobicity to the modified artificial sediment greatly affected the genotoxicity.
4. Conclusions
A new umu test based on hydrodynamic electrochemical detection in a microliter droplet using the rotating disk electrode (RDE) was developed. The dose-response curves of AF-2 obtained from the umu test based on spectrophotometric and electrochemical detection were compared. It is obvious from the comparison that even though the assay based on spectrophotometric detection is strongly influenced by the presence of humic acid (HA) and artificial sediment, the proposed assay is still able to evaluate the genotoxicity of AF-2 in the presence of 40 mg·L−1 HA and 1 g·L−1 artificial sediment. The analysis time for incubation step with NM2009 strain and genotoxins is about 2 h. One of the main advantages of this method is shorter detection time for enzymatic reaction with substrate (40 s) when compared to spectrophotometric and other electrochemical detection methods proposed in previous assays which require much longer times of 10 to 60 min. The changes in the genotoxicity of AF-2, 4-NQO, MX, 1,8-DNP and 1-NP due to the presence of HAs and artificial sediment were also investigated. The observations showed that the minimal detectable concentration of 1-NP increased by the presence of 10 mg·L−1 HAs. Fourthermore, the results also indicated that the presence of 1 g·L−1 sediment strongly mitigated the genotoxicity of chemicals with high hydrophobic properties, i.e., a high log Kow value, such as 1,8-DNP (4.57) and 1-NP (4.75). There wwas no such reduction in the genotoxicity for AF-2 (1.14), 4-NQO (0.82) and MX (0.61), which are also genotoxic compounds, but with a lower log Kow. The proposed hydrodynamic electrochemical method can be used in assessing the genotoxicity of real sediments, soils and suspended solids.
Acknowledgments
This research was supported by Kurita Water and Environment Foundation (No. 19177) and Grants-in-Aid for scientific Research from the Japan Society for the Promotion of Science (No. 21310048).
References
- Suzuki, J.; Sadamasu, T.; Suzuki, S. Mutagenic activity of organic matter in an urban river sediment. Environ. Pollut 1982, 29, 91–99. [Google Scholar]
- Meier, J.R.; Ringhand, H.P.; Coleman, W.E.; Munch, J.W.; Streicher, R.P.; Kaylor, W.H.; Schenck, K.M. Identification of mutagenic compounds formed during chlorination of humic acid. Mutat. Res 1985, 157, 111–122. [Google Scholar]
- West, W.R.; Smith, P.A.; Booth, G.M.; Wise, S.A.; Lee, M.L. Determination of genotoxic polycyclic aromatic hydrocarbons in a sediment from the black river (ohio). Arch. Environ. Contam. Toxicol 1986, 15, 241–249. [Google Scholar]
- Kronberg, L.; Holmbom, B.; Reunanen, M.; Tikkanen, L. Identigication and quantification of the ames mutagenic compound 3-chloro-4-(dichloromethyl)-5-hydroxy-2(5H)-franone and of its geometric isomer (E)-2-chloro-3-(dichloromethyl)-4-oxo-butenoic acid in chlorine-treated humic water and drinking water extracts. Environ. Sci. Technol 1988, 22, 1097–1103. [Google Scholar]
- Vahl, H.H.; Karbe, L.; Westendorf, J. Genotoxicity assessment of suspended particulate matter in the Elbe river: Comparision of salmonella microsome test, arabinose resistence test, and umu-test. Mutat. Res-Genet. Toxicol. E. M 1997, 394, 81–93. [Google Scholar]
- Chen, Z.; Yang, C.; Lu, J.; Zou, H.; Zhang, J. Factors on the formation of disinfection by-product MX, DCA and TCA by chlorination of fulvic acid from lake sediments. Chemosphere 2001, 45, 379–385. [Google Scholar]
- Kummrow, F.; Rech, C.M.; Coimbrao, C.A.; Roubicek, D.A.; Umbuzeiro, G.A. Comparison of the mutagenic activity of XAD4 and blue rayon extracts of surface water and related drinking water samples. Mutat. Res-Genet. Toxicol. E. M 2003, 541, 103–113. [Google Scholar]
- IARC. Monographs on the Evaluation of Carcinogenic Risks to Humans. In Some Drinking-Water Disinfectants and Contaminants, Including Arsenic; Volume 84, International Agency for Research on Cancer: Lyon, France, 2004. [Google Scholar]
- McDonald, T.A.; Komulainen, H. Carcinogenicity of the chlorination disinfection by-product MX. Environ. Carcinog. Ecotox. Rev 2005, 23, 163–214. [Google Scholar]
- Bihari, N.; Fafandel, M.; Hamer, B.; Bilen, B.K. PAH content, toxicity and genotoxicity of coastal marine sediments from the Rovinj area, Northern Adriatic, Croatia. Sci. Total Environ 2006, 366, 602–611. [Google Scholar]
- Richardson, S.D.; Plewa, M.J.; Wagner, E.D.; Schoeny, R.; DeMarini, D.M. Occurrence, genotoxicity, and carcinogenicity of regulated and emerging disinfection by-products in drinking water: A review and roadmap for research. Mutat. Res-Rev. Mutat. Res 2007, 636, 178–242. [Google Scholar]
- Singh, A.; Chandra, S.; Gupta, S.K.; Chauhan, L.K.S.; Rath, S.K. Mutagenicity of leachates from industrial solid wastes using Salmonella reverse mutation assay. Ecotoxicol. Environ. Saf 2007, 66, 210–216. [Google Scholar]
- Park, J.; Ball, L.M.; Richardson, S.D.; Zhu, H.B.; Aitken, M.D. Oxidative mutagenicity of polar fractions from polycyclic aromatic hydrocarbon-contaminated soil. Environ. Toxicol. Chem 2008, 27, 2207–2215. [Google Scholar]
- Maron, D.M.; Ames, B.N. Revised methods for the Salmonella mutagenicity test. Mutat. Res-Environ. Mutagen. R. S 1983, 113, 173–215. [Google Scholar]
- Oda, Y.; Nakamura, S.; Oki, I.; Kato, T.; Shinagawa, H. Evaluation of the new system (umu-test) for the detection of environmental mutagens and carcinogens. Mutat. Res-Environ. Mutagen. R. S 1985, 147, 219–229. [Google Scholar]
- Nakamura, S.; Oda, Y.; Shimada, T.; Oki, I.; Sugimoto, K. SOS-Inducing activity of chemical carcinogens and mutagens in Sallmonella typhimurium TA1535/pSK1002: Examination with 151 chremicals. Mutat. Res. Lett 1987, 192, 239–246. [Google Scholar]
- McDaniels, A.E.; Reyes, A.L.; Wymer, L.J.; Rankin, C.C.; Stelma, G.N., Jr. Comparison of the salmonella (ames) test, umu tests, and the SOS chromotests for detecting genotoxins. Environ. Mol. Mutagen 1990, 16, 204–215. [Google Scholar]
- Reifferscheid, G.; Heil, J. Validation of the SOS/umu test using test results of 486 chemicals and comparison with the Ames test and carcinogenicity data. Mutat. Res-Genet. Toxicol 1996, 369, 129–145. [Google Scholar]
- Reifferscheid, G.; Heil, J.; Oda, Y.; Zahn, R.K. A microplate version of SOS/umu test for rapid detection of genotoxins and genotoxic potentials of environmental samples. Mutat. Res-Environ. Mutagen. R. S 1991, 253, 215–222. [Google Scholar]
- Schinitzer, M.; Khan, S.U. Humic Substances in the Environment; Marcel Dekker, Inc: New York, NY, USA, 1972. [Google Scholar]
- Kan, A.T.; Fu, G.; Tomson, M.B. Adsorption/desorption hysteresis in organic pollutant and soil/sediment interaction. Environ. Sci. Technol 1994, 28, 859–867. [Google Scholar]
- Fleming, R.J.; Holmes, D.; Nixon, S.J. Toxicity of permethrin to Chironomus riparius in artificial and natural sediments. Environ. Toxicol. Chem 1998, 17, 1332–1337. [Google Scholar]
- Sun, H.; Tateda, M.; Ike, M.; Fujita, M. Short- and long-term sorption/desorption of polycyclic aromatic hydrocarbons onto artificial solids: effects of particle and pore sizes and organic matters. Water Res 2003, 37, 2960–2968. [Google Scholar]
- Paolis, F.D.; Kukkonen, J. Binding of organic pollutants to humic acid and fulvic acids: Influence of pH and the structure of humic material. Chemosphere 1997, 34, 1693–1704. [Google Scholar]
- Xing, B. The effect of the quality of soil organic matter on sorption of naphthalene. Chemosphere 1997, 35, 633–642. [Google Scholar]
- Kulikova, N.A.; Perminova, I.V. Binding of atrazine to humic substances from soil, peat, and coal related to their structure. Environ. Sci. Technol 2002, 36, 3720–3724. [Google Scholar]
- Salloum, M.J.; Chefetz, B.; Hatcher, P.G. Phenanthrene sorption by aliphatic-rich natural organic matter. Environ. Sci. Technol 2002, 36, 1953–1958. [Google Scholar]
- Gunasekara, A.S.; Xing, B. Sorption and desorption of naphthalene by soil organic matter: importance of aromatic and aliphatic compounds. J. Environ. Qual 2003, 32, 240–246. [Google Scholar]
- Khalaf, M.; Kohl, S.D.; Klumpp, E.; Rice, J.A.; Tombacz, E. Comparison of sorption domains in molecular weight fractions of a soil humic acid using solid-state 19F NMR. Environ. Sci. Technol 2003, 37, 2855–2860. [Google Scholar]
- Winner, R.W.; Gauss, J.D. Relationship between chronic toxicity and bioaccumulation of copper, cadmium and zinc as affected by water hardness and humic acid. Aquat. Toxicol 1986, 8, 149–161. [Google Scholar]
- Paulauskis, J.D.; Winner, R.W. Effects of water hardness and humic acid on zinc toxicity to daphnia magna straus. Aquat. Toxicol 1988, 12, 273–290. [Google Scholar]
- Ma, H.; Kim, S.D.; Cha, D.K.; Allen, H.E. Effect of kinetics of complexation by humic acid on toxicity of copper to ceriodaphnia dubia. Environ. Toxicol. Chem 1999, 18, 828–837. [Google Scholar]
- Mezin, L.C.; Hale, R.C. Effect of humic acids on toxicity of DDT and chlorpyrifos to freshwater and estuarine invertebrates. Environ. Toxicol. Chem 2004, 23, 583–590. [Google Scholar]
- Freidig, A.P.; Garicano, E.A.; Busser, F.J.M.; Hermens, J.L.M. Estimating impact of humic acid on bioavailability and bioaccumulation of hydrophobic chemicals in guppies using kinetic solid-phase extraction. Environ. Toxicol. Chem 1998, 17, 998–1004. [Google Scholar]
- McGeer, J.C.; Szebedinszky, C.; McDonald, D.G.; Wood, C.M. The role of dissolved organic carbon in moderating the bioavailability and toxicity of Cu to rainbow trout during chronic waterborne exposure. Comp. Biochem. Physiol. P. T. C 2002, 133, 147–160. [Google Scholar]
- Vinitketkumnuen, U.; Puatanachokchai, R.; Kongtawelert, P.; Lertprasertsuke, N.; Matsushima, T. Antimutagenicity of lemon grass (Cymbopogon citrates Stapf) to various known mutagens in salmonella mutation assay. Mutat. Res-Genet. Toxicol 1994, 341, 71–75. [Google Scholar]
- Zang, Y.; Luo, Z.Y.; Kong, Z.M. Genotoxicity of two novel pesticides for the earthworm, Eisenia fetida. Environ. Pollut 2000, 108, 271–278. [Google Scholar]
- Matsui, N.; Kaya, T.; Nagamine, K.; Yasukawa, T.; Shiku, H.; Matsue, T. Electrochemical mutagen screening using microbial chip. Biosens. Bioelectron 2006, 21, 1202–1209. [Google Scholar]
- Buchinger, S.; Grill, R.; Morosow, V.; Yoav, H.B.; Diamand, Y.S.; Biran, A.; Pedahzur, R.; Belkin, S.; Reifferscheid, G. Evaluation of chrono-amperometric signal detection for the analysis of genotoxicity by a whole cell biosensor. Anal. Chim. Acta 2010, 659, 122–128. [Google Scholar]
- Wijayawardhana, C.A.; Halsall, H.B.; Heineman, W.R. Micro volume rotating disk electrode (RDE) amperometric detection for a bead-based immunoassay. Anal. Chim. Acta 1999, 399, 3–11. [Google Scholar]
- Kuramitz, H.; Dziewatkoski, M.; Barnett, B.; Halsall, H.B.; Heineman, W.R. Application of an automated fluidic system using electrochemical bead-based immunoassay to detect the bacteriophage MS2 and ovalbumin. Anal. Chim. Acta 2006, 561, 69–77. [Google Scholar]
- Kuramitz, H.; Halsall, H.B.; Heineman, W.R. Magnetic microbead-based enzyme immunoassay for ovalbumin using hydrodynamic voltammetry and fluorometric detection. Anal. Methods 2012, 4, 1783–1789. [Google Scholar]
- Watanabe, M.; Ishidate, M., Jr.; Nohmi, T. Sensitive method for the detection of mutagenic nitroarenes and aromatic amines: new derivatives of Salmonella typhimurium tester strains possessing elevated O-acetyltransferase levels. Mutat. Res-Environ. Mutagen. R. S. 1990, 234, 337–348. [Google Scholar]
- Einistö, P.; Watanabe, M.; Ishidate, M., Jr.; Nohmi, T. Mutagenicity of 30 chemicals in Salmonella typhimurium strains possessing different nitroreductase or o-acetyltransferase activities. Mutat. Res-Genet. Toxicol 1991, 259, 95–102. [Google Scholar]
- Oda, Y.; Yamazaki, H.; Watanabe, M.; Nohmi, T.; Shimada, T. Highly sensitive umu test system for the detection of mutagenic nitroaresnes in Salmonella typhimurium NM3009 having high o-acetyltransferase and nitroreductase activities. Environ. Mol. Mutagen 1993, 21, 357–364. [Google Scholar]
- Oda, Y.; Yamazaki, H.; Watanabe, M.; Nohmi, T.; Shimada, T. Development of high sensitive umu test system: rapid detection of genotoxicity of promutagenic aromatic amines by Salmonella typhimurium strain NM2009 processing high o-acetyltransferase activity. Mutation Res 1995, 334, 145–156. [Google Scholar]
- Swift, R.S. Organic matter characterization. In Methods of Soil Analysis; Part 3. Chemical Methods-SSSA Book Series No. 5; Sparks, D.L., Ed.; Soil Science Society of America Inc.: Madison, WI, USA, 1996; pp. 1011–1069. [Google Scholar]
- Peuravuori, J.; Pihlaja, K. Molecular size distribution and spectroscopic properties of aquatic humic substances. Anal. Chim. Acta 1997, 337, 133–149. [Google Scholar]
- Miller, J.H. Experiments in Molecular Genetics; Cold Springs Harbor: Cold Springs Harbor, NY, USA, 1972. [Google Scholar]


| Sample Name | E280a | E400b | E4/E6c | E2/E3d | Total acidity (meq·g−1) | Carboxylic acid (meq·g−1) | Phenolic hydroxyl groups (meq·g−1)e |
|---|---|---|---|---|---|---|---|
| WHA | 91.6 | 33.9 | 4.20 | 2.28 | 5.24 | 2.08 | 3.16 |
| AMHA | 43.9 | 13.4 | 4.38 | 3.12 | 9.82 | 4.38 | 4.36 |
| KPHA | 59.5 | 19.3 | 6.38 | 2.58 | 13.13 | 3.74 | 9.39 |
| SPHA | 43.5 | 11.8 | 7.75 | 3.03 | 5.09 | 4.02 | 1.07 |
| FSHA | 38.6 | 10.6 | 5.40 | 3.10 | 6.96 | 3.73 | 4.74 |
| Sample Name | Mn (Da)f | Mw (Da)g | Mw/Mn | %C | %H | %N | %O | %S | %Ash |
|---|---|---|---|---|---|---|---|---|---|
| WHA | 490 | 1,548 | 3.46 | 63.2 | 3.3 | 1.3 | 31.3 | 0.9 | 0.1 |
| AMHA | 1,604 | 11,852 | 7.39 | 52.2 | 5.0 | 3.8 | 38.3 | 0.4 | 0.3 |
| KPHA | 1,117 | 3,812 | 3.41 | 52.9 | 4.4 | 1.9 | 39.6 | 0.3 | 1.0 |
| SPHA | 1,869 | 18,541 | 9.92 | 52.7 | 5.1 | 2.5 | 37.4 | 0.6 | 1.7 |
| FSHA | 2,027 | 14,084 | 6.95 | 51.1 | 5.2 | 4.0 | 37.7 | 0.4 | 1.1 |
Absorptivities ata280 nm andb400 nm (L·cm−1·g-C−1).cRatio of absorbance at 400 and 600 nm.dRatio of absorbance at 250 and 365 nm.eThe contents of phenolic hydroxyl groups were calculated by subtracting the carboxylic acid contents from the total acidity.fNumber-average molecular weight (Mn).gWeight-average molecular weight (Mw).
| Rotation rate (rpm) | Vmax | KM (mM) |
|---|---|---|
| 1,000 | 0.35 | 0.95 |
| 2,000 | 0.40 | 0.93 |
| 3,000 | 0.42 | 0.68 |
| Minimal detectable concentration (ng·mL−1) | ||||
|---|---|---|---|---|
| 4-NQO | 1,8-DNP | 1-NP | MX | |
| Control | 44.3 ± 6.6 | 2.0 ± 0.9 | 44.6 ± 5.1 | 219.8 ± 15.7 |
| WHA | 50.9 ± 11.0 | 1.2 ± 0.4 | 76.8 ± 2.9 | 167.7 ± 35.9 |
| KPHA | 41.1 ± 8.9 | 2.1 ± 0.5 | 55.1 ± 10.1 | 111.6 ± 32.4 |
| AMHA | 43.8 ± 7.0 | 1.1 ± 0.1 | 80.2 ± 16.7 | 156.7 ± 45.7 |
| FSHA | 52.4 ± 13.8 | 1.5 ± 0.2 | 101.6 ± 9.2 | 159.7 ± 55.6 |
| SPHA | 49.0 ± 7.9 | 0.9 ± 0.2 | 87.7 ± 15.3 | 80.1 ± 22.8 |
| Sample | Minimal detectable concentration (ng·mL−1) | |||
|---|---|---|---|---|
| 4-NQO | 1,8-DNP | 1-NP | MX | |
| Control | 39.3 ± 4.8 | 1.0 ± 0.1 | 5.6 ± 0 .9 | 46.8 ± 5.9 |
| Artificial sediment | 46.9 ± 3.5 | 4.2 ± 0.3 | 32.5 ± 3.2 | 51.7 ± 3.6 |
| Modified artificial sediment | 39.9 ± 2.7 | 6.2 ± 0.5 | 36.2 ± 4.0 | 50.0 ± 4.8 |
© 2012 by the authors; licensee MDPI, Basel, Switzerland This article is an open access article distributed under the terms and conditions of the Creative Commons Attribution license (http://creativecommons.org/licenses/by/3.0/).
Share and Cite
Kuramitz, H.; Sazawa, K.; Nanayama, Y.; Hata, N.; Taguchi, S.; Sugawara, K.; Fukushima, M. Electrochemical Genotoxicity Assay Based on a SOS/umu Test Using Hydrodynamic Voltammetry in a Droplet. Sensors 2012, 12, 17414-17432. https://doi.org/10.3390/s121217414
Kuramitz H, Sazawa K, Nanayama Y, Hata N, Taguchi S, Sugawara K, Fukushima M. Electrochemical Genotoxicity Assay Based on a SOS/umu Test Using Hydrodynamic Voltammetry in a Droplet. Sensors. 2012; 12(12):17414-17432. https://doi.org/10.3390/s121217414
Chicago/Turabian StyleKuramitz, Hideki, Kazuto Sazawa, Yasuaki Nanayama, Noriko Hata, Shigeru Taguchi, Kazuharu Sugawara, and Masami Fukushima. 2012. "Electrochemical Genotoxicity Assay Based on a SOS/umu Test Using Hydrodynamic Voltammetry in a Droplet" Sensors 12, no. 12: 17414-17432. https://doi.org/10.3390/s121217414