A Novel Method for Measuring In-Shoe Navicular Drop during Gait

Abstract
: Analysis of foot movement is essential in the treatment and prevention of foot-related disorders. Measuring the in-shoe foot movement during everyday activities, such as sports, has the potential to become an important diagnostic tool in clinical practice. The current paper describes the development of a thin, flexible and robust capacitive strain sensor for the in-shoe measurement of the navicular drop. The navicular drop is a well-recognized measure of foot movement. The position of the strain sensor on the foot was analyzed to determine the optimal points of attachment. The sensor was evaluated against a state-of-the-art video-based system that tracks reflective markers on the bare foot. Preliminary experimental results show that the developed strain sensor is able to measure navicular drop on the bare foot with an accuracy on par with the video-based system and with a high reproducibility. Temporal comparison of video-based, barefoot and in-shoe measurements indicate that the developed sensor measures the navicular drop accurately in shoes and can be used without any discomfort for the user.1. Introduction
The human foot comprises a lightweight complex system combining passive and active elements which act in conjunction allowing for weight transfer, maintenance of balance and generation of propulsive forces during gait. Thus its function or malfunction will have effect on the rest of the body and vice versa. Measurement of foot function during activity is a requirement to provide meaningful interventions for treatment or prevention of foot-related disorders.
Several methods exist for measuring how the foot moves during bare foot walking. The two most commonly used methods include 3D motion capture using optical systems [1,2] or the use of inertial sensors [3,4]. Both methods require the foot to be visible to the cameras or require cutting a hole in the shoe or using sandals so that the inertial sensors can be attached directly to the foot. However, measurement of foot movement should be done in situations that reflect everyday life and normal loading of the foot. Therefore it is necessary to measure how the foot moves inside the shoe that people normally wear during everyday life. Measurement of in-shoe foot movement enables the study of how the foot and shoe interacts. A few attempts have been made to measure in-shoe foot movement but none of these has been successful in creating a method that is feasible in clinical practice. Current methods to measure in-shoe foot movement rely on specially designed shoes [5,6], radiostereometric analysis (RSA) [7,8] and dynamic MRI [9,10]. All these methods are expensive, time consuming, and not suitable for routine clinical use.
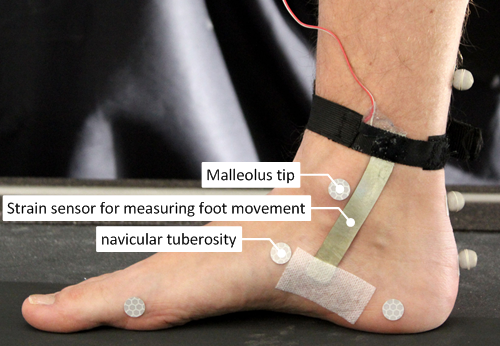
One of the methods currently used in clinical practice is measurement of the navicular drop [11]. The navicular drop describes the range of sagittal deformation of the midfoot during the stance phase of gait. Depending of the foot size the dynamic navicular drop for healthy persons is on average 5.3 mm (±1.8 mm) [12] but can vary up to 15 mm in problematic cases. The dynamic navicular drop is measured as the change in the navicular height (NH) from the time of heal strike (HS) to the time of lowest navicular height (NHL) during the stance phase of gait [13] The navicular drop has been suggested to be the most appropriate parameter for the assessment of foot pronation [14] as it is a valid indicator of talonavicular motion [8] and rear foot movement [15]. The size of navicular drop appears to have important consequences for subjects who participate in weight bearing sports such as running. Too much movement of the navicular (i.e., the foot collapses during loading) places the subject in higher risk of developing injuries to the medial side of the shin [16,17] as well as the knee [18]. It is believed that when the navicular moves excessively and the foot collapses, it causes increased forces being transmitted to the tibia (shin bona) as well as increased internal rotation of the tibia which alters the biomechanics of the lower extremity [19,20].
In a previous project a Multi Video Sequence Analysis (MVSA) system was developed. The system is described in [13]. The MVSA system measures the navicular drop during gait, by using a camera to record the movement of a set of markers attached to the skin on the medial side of the foot. Research has shown that MVSA is a reliable technology to measure bare foot dynamic navicular drop with an accuracy of 0.5–0.8 mm [13]. However, the major shortcoming of the MVSA system is that it is limited to measuring the navicular drop during walking on a treadmill and only with bare feet.
Thus, the objective of this study was to develop a system that could meet the limitations of the MVSA system, by enabling a dynamic measurement of foot movement during in-shoe walking. The navicular drop was used to measure foot movement, and the MVSA system was used as reference system. The focus of the current study was to develop a thin flexible strain sensor that measures distance between the two endpoints, enabling a dynamic measurement of in-shoe navicular drop.
Strain sensors have been made with many different techniques such as capacitive strain gauges [21], conductive polymer composite [22–24] and dielectric electroactive polymer (DEAP) [25]. DEAP was chosen due to flexibility, thickness and accuracy of the measured strain of sensor.
2. Methods
In the following we describe a new type of strain sensor, data acquisition as well as the optimal position of a strain sensor on the foot.
2.1. The Newly Developed Strain Sensor
The new strain sensor is based on a DEAP material produced by Danfoss PolyPower. The material is called PolyPower and acts as an elastic capacitive material [25] that is strainable in one direction (Table 1).
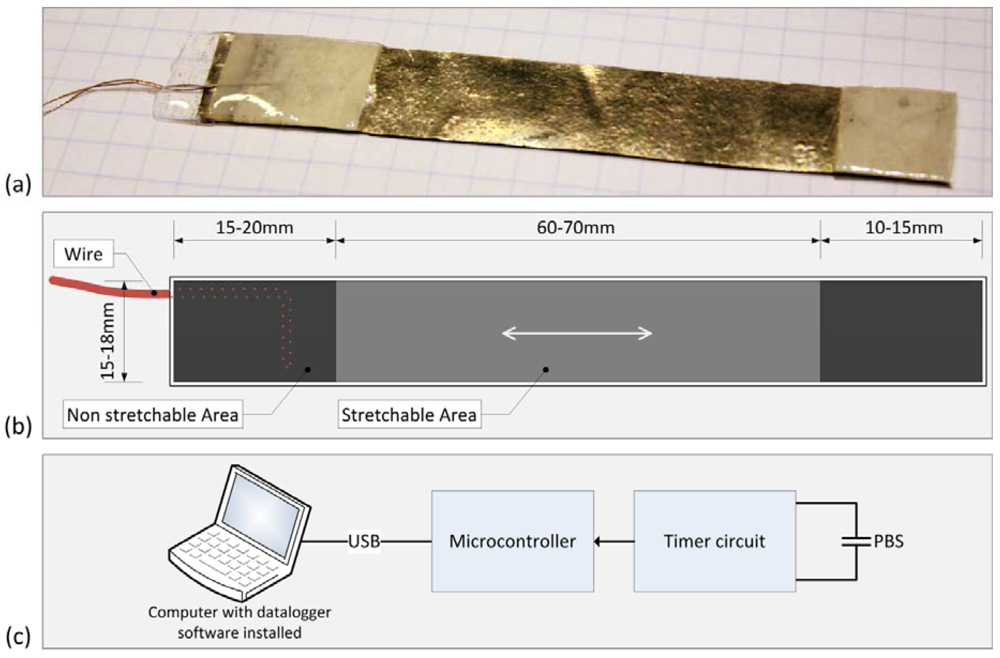
Based on sheets of PolyPower, we designed a PolyPower based sensor (PBS) (Figure 1(a,b)). The sensor is mechanically stable, reusable, portable and resistant to perspiration from the foot. The sensor enables measurements of dynamic strain between two points of attachment on the medial side of the foot.
The non-strainable area of the developed PBS has a maximal thickness of 1.5 mm, and the strainable area has a thickness in the range of 0.40 mm–0.60 mm and can withstand a maximal strain of 50% of the strainable area. The thickness of a sensor enables it to be easily strainable, and comfortable to wear. For this reason a sensor has little impact on gait and foot movement. The thickness of a sensor also enables in-shoe measurements.
To measure the change in capacitance of a PBS, an electrical circuit was built with a timer (Figure 1(c)). The circuit was built in such a way that a change in capacitance of a PBS corresponded to a change in the timer frequency. The frequency from the timer circuit was measured by a microcontroller using a sample rate of 200 Hz which enable measurements of the navicular drop during running. The method enables measurements of the capacity with a resolution of 0.13 pF and a bandwidth of 200 Hz. To minimize the influence of parasitic electrical capacitances, the timer circuit was attached to the ankle of the test person to reduce the length of the wires from the sensor.
The data samples were transferred to a computer via a USB cable and were collected in a data logger program on the computer. The data logger program enabled real time visualization and logging of the data.
2.3. Validation of the PBS System with the MVSA System
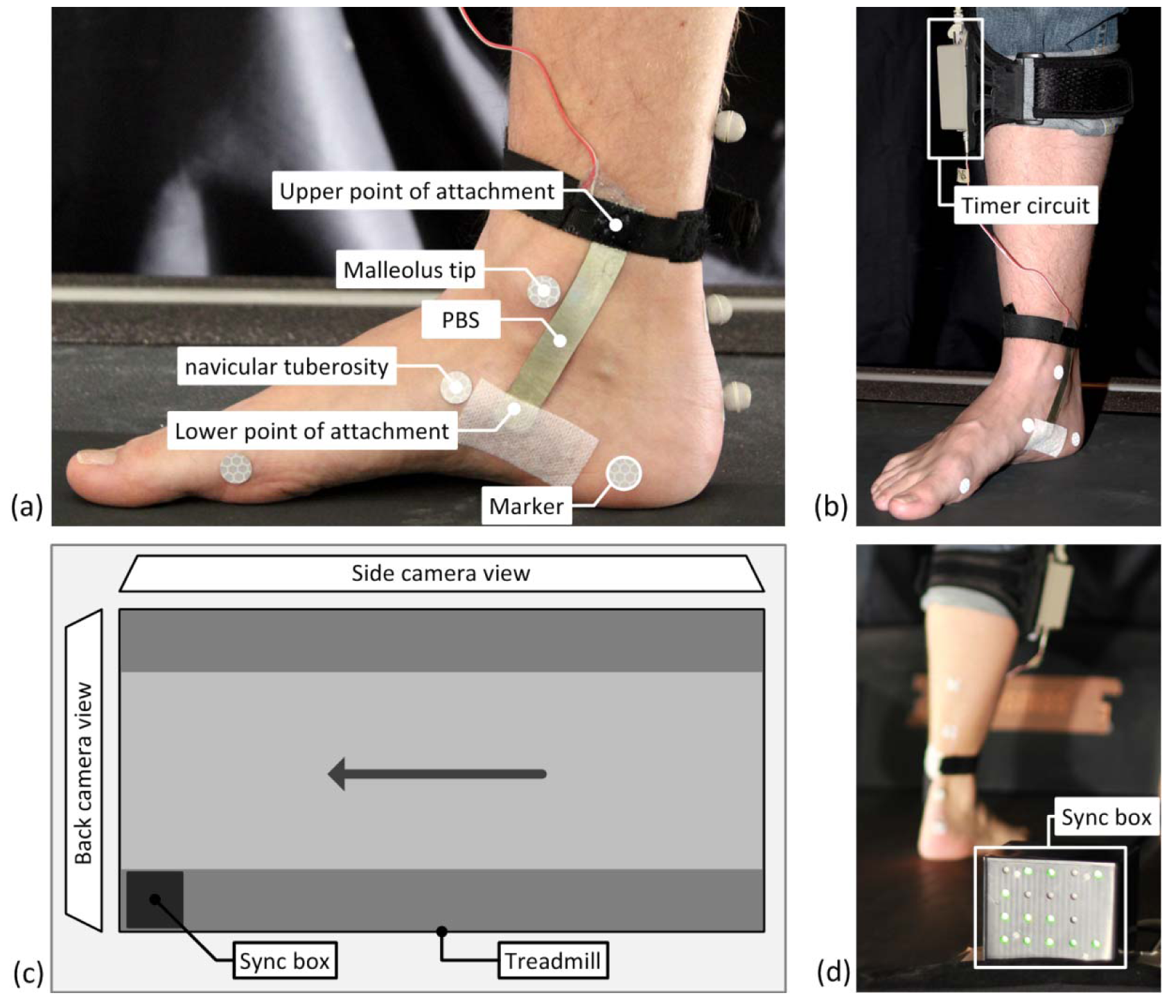
To be able to validate the PBS system with the MVSA system, the data from the two systems needed to be synchronized. A synchronization box (sync box) containing a microcontroller and 18 LEDs was created to enable synchronization of the samples from a PBS and the MVSA system during walking and running (Figure 3(d)). The sync box was positioned in the field of view of the back camera of the MVSA system (Figure 3(c)). The microcontroller measures the frequency of the timer circuit (Figure 3(b)) and was integrated in the sync box. Two of the LEDs on the sync box were left turned on, while the remaining 16 LEDs were used to display the measurement number in gray code [27]. Hence, the recordings from MVSA and PBS could be synchronized.
A Matlab® script was used to recognize the PBS sample number displayed by the LEDs in the pictures from the MVSA system. This enabled sample by sample synchronization of the samples from MVSA system and the PBS system, respectively. Since the sample rate of the PBS system is 200 Hz and the frame rate of the MVSA system is 114 Hz, an interpolation algorithm was used to upsample the data from the MVSA system.
A synchronized navicular drop was calculated for each step based on synchronized data from the MVSA and PBS measurements, respectively. This method allowed for a comparison of the data step by step.
The data from the MVSA system was processed using a custom written Matlab® script called Fodex [13]. Fodex calculates the time of HS, NHL and toe off (TO). The analysis of the PBS data was based on data from Fodex. The HS based on the PBS data was calculated as the local minima in a window of ±10% of a step length around the MVSA position of HS. The location of NHL based on the PBS data, was calculated as the maximal strain.
The measurements to validate the PBS system with the MVSA systems were performed on the test person described in Table 3. Data were collected during walking on a treadmill. The person was asked to choose his preferred walking speed [26] which was 5 km/h.
A PBS and the markers from the MVSA system were attached to the bare foot of the test person simultaneously, as shown in Figure 3(a). The markers were attached according to the procedure described in [13]. The lower part of a PBS was attached to the foot using pre-tape spray and fixation plaster. The upper part of a PBS was attached using a Velcro band.
The test person was asked to walk on a treadmill and after obtaining a consistent gait the data acquisition was started. The data were acquired over approximately 70 seconds. Retest was performed with the same test person and PBS after 2 hours. The PBS was removed from the foot and the test person was wearing a shoe between the test and retest.
2.4. In-Shoe Measurements Using the PBS System
The response of the PBS system to in-shoe measurements was tested using the same test person as used in the validation of the PBS system. To enable comparison of in-shoe and bare foot measurements, a bare foot measurement was acquired initially. After this recording the test person was asked to take on his socks and shoes and a new measurement was acquired. Both measurements were acquired using exact same setup and procedures as used in the validation measurements. The only factor of change was the person wearing socks and shoes during the in-shoe measurement. The test person's shoe was a white Adidas® Superstar European size 42 (a common male shoe size).
The time of the characteristic events during gait (NHL and HS) on the in-shoe measurement was approximated by hand, since the MVSA system cannot be used for in-shoe measurements. The navicular drop was calculated for each step based on the events of NHL and HS on the bare foot and in-shoe measurements, respectively.
3. Results
3.1. Technical Accuracy of a PBS
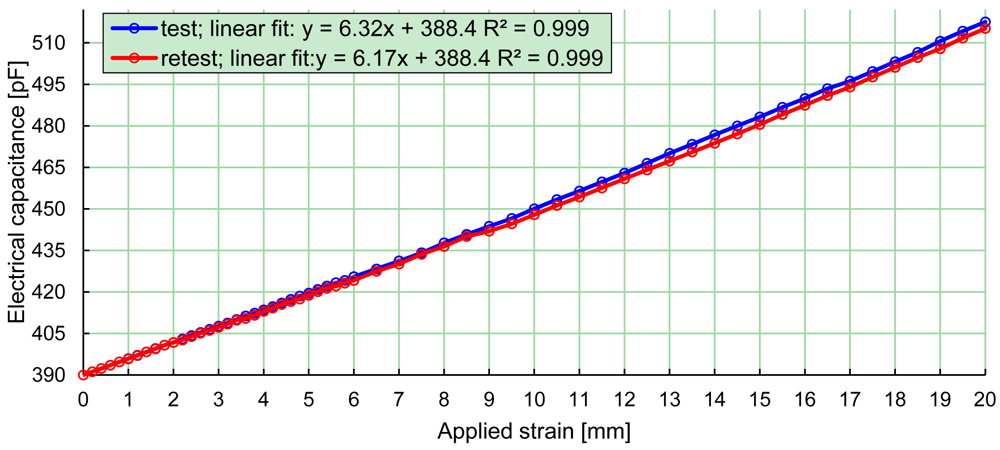
The relationship between the electrical capacitance and strain of a PBS is illustrated in Figure 4. The PBS system was used to measure the capacitance of the PBS and the strain of the PBS was measured using a vernier caliper. The PBS was strained in maximal intervals of 0.5 mm with a strain of up to 20 mm, which corresponded to a strain of 50%. A linear fitting and the coefficient of determination was calculated for the test and the retest, respectively (Figure 4). Test-retest was performed to test the reliability of a PBS. The change in the slope of the linear fitting from test to retest was 2.5%. The test-retest is representative for a typical PBS used in the project.
To test the change in the slope of the linear fitting over time, a typical PBS was calibrated a number of times during nine months. The capacitance was measured at two different strain values, and a linear fitting was calculated. The measurements showed a maximal change in the slope of 4% (Figure 5), which corresponds to an accuracy of 0.4 mm in a typical PBS with a navicular drop of 10 mm.
4. Discussion
The purpose of the study was to develop a system that enables a dynamic measurement of the navicular drop during bare foot and in-shoe walking. The relation between the electrical capacitance and strain of a PBS was measured and the calculations of the coefficient of determination justify that the inaccuracy caused by linear fitting is negligible. Due to the linear relationship between strain and electrical capacitance, calibration of a PBS can be performed using only two calibration measurements.
The error in the calibration of the PBS observed over time was most likely caused by inaccuracy in the calibration method, where only two strain values are used to calculate the slope of the linear fitting. This calibration method was used because it reflects everyday use of the sensor, and the measurements imply that the sensor has an acceptable accuracy over time when using this calibration. To validate the PBS system with the MVSA system, measurements using the PBS system and the MVSA system were acquired simultaneously and subsequently synchronized.
The scatterplots (Figure 6) of the synchronized measurements of the navicular drop display a similar variation around the fitted line for low and high measurements of the navicular drop, which indicates a linear relationship between PBS and MVSA measurements. Pearsons product-moments show a statistical significant correlation between the measurements. Visually, some scattering is noticeable. The scattering could be caused by the slightly different movements of the foot that the PBS system and the MVSA system measures. The PBS is attached to the ankle and for this reason the movement of the ankle will have an influence on the strain of the sensor. Furthermore, a PBS is attached in a way that the sensor is in contact with the skin of the foot between the two points of attachment. This means a PBS captures a combination of both sagital and frontal plane movement of the midfoot, while the MVSA system only captures sagital deformation of the midfoot because only one camera is used. Previous research support this notion of both cyclic downwards movement and sideways movement of the navicular [28]. In addition to this we know that the movement of the navicular is a bit different from stride to stride why we would expect small changes in navicular drop during the strides [26].
The change in the mean navicular drop from test to retest using the MVSA system (Table 4) is in the range of the technical accuracy of the MVSA system, even though the change is statistically significant (p = 0.015). The change in measurements of navicular drop from test to retest using a PBS system was not found to be statistically significant (p = 0.509). This indicates that the accuracy of the PBS measurements is compatible to the accuracy the measurements from the MVSA system, which is also reflected in the better technical accuracy of a PBS.
The mean differences given in Table 4 are the differences in the mean values based on measurements from the MVSA system and PBS system, respectively. Even though the two systems capture a different movement of the foot, the difference in the mean values is in the range of the accuracy of the MVSA system, which has an accuracy of 0.5–0.8 mm [13].
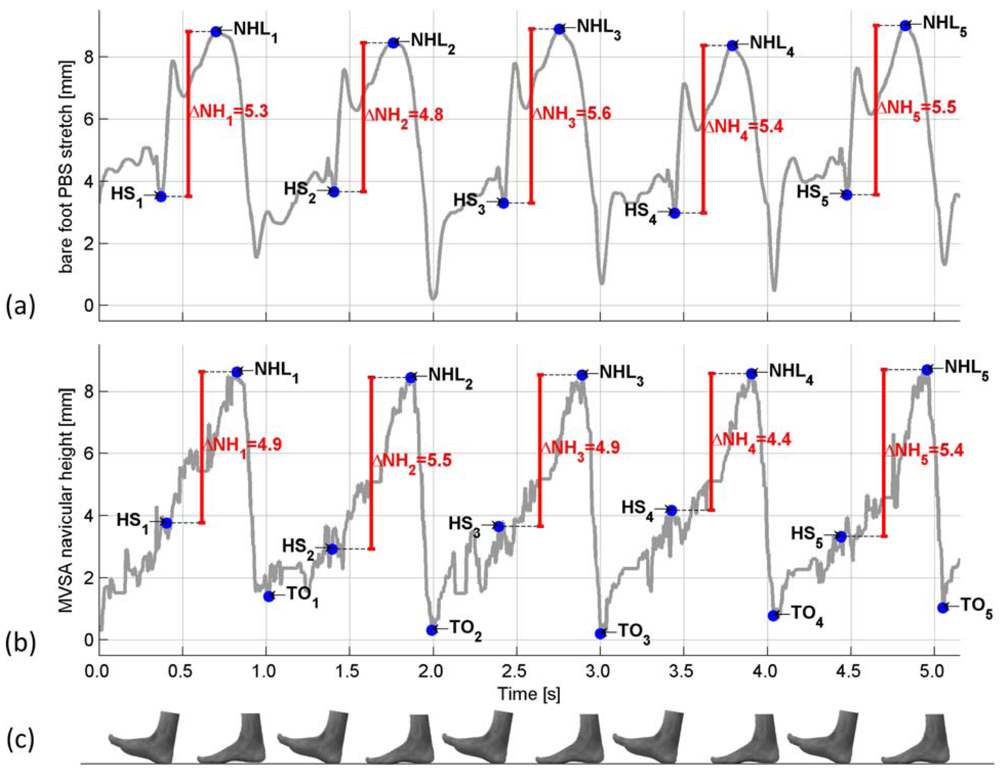
The temporal comparison between the PBS and MVSA measurements (Figure 7) show that the time of HS based on the PBS measurements is very similar to the time of HS based on the MVSA measurements. The PBS based HS is characterized by a drop in the strain of the PBS. Using the fact that the NHL is the lowest height of the navicular during stance, the NHL is located very similar at the two measurements. The difference in the time of HS and NHL on the MVSA and PBS measurements could most likely be explained by the difference in the movement of the foot which the two systems capture. The difference between the navicular drop (ΔNH) measured using the MVSA system and the BPS system is in the range of the accuracy of the MVSA system [13]. Based on these preliminary measurements it is indicated that the PBS system measures the navicular drop.
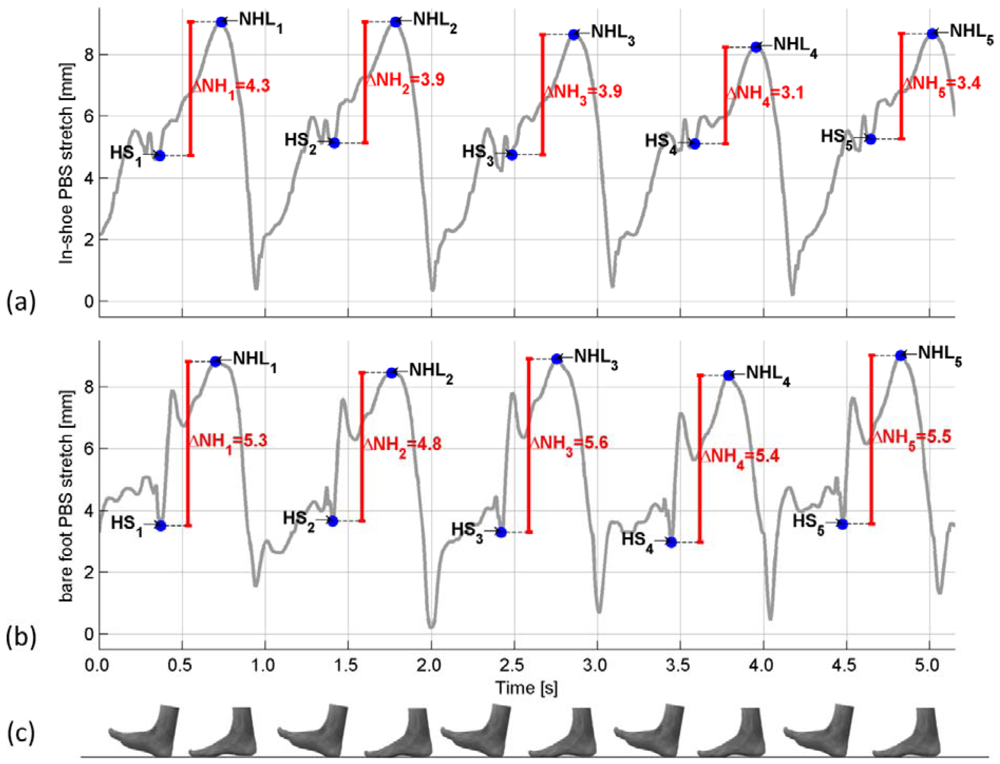
We observed a decrease in navicular drop when comparing in-shoe measurements to bare-foot walking. One possible explanation could be that the contours of the insole and the shoe might support the arch of the foot and thereby decrease navicular drop [29]. This is, however, only a hypothesis and other explanations such as measurement error are also likely.
By examination of Figure 8 it is seen that the characteristic drop in strain of the PBS at HS is found in both measurements, and the maximal strain is located at approximately the same distance from HS in both measurements. Despite the preliminary character of the measurements this suggests that a PBS used in-shoe measures the same movement of the foot as a PBS used on a bare foot. Based on the validation of the PBS in the previous section this indicates that a PBS is capable of measuring the in-shoe navicular drop during walk. The calibration of the sensor before and after the in-shoe measurements and the fact that no damage to the sensor was noticed, indicates that a PBS is resistant to the influence of a person wearing a shoe.
5. Conclusions
In the current paper we have described the development of a strain sensor to measure navicular drop, which is a frequently used measure of foot movement.
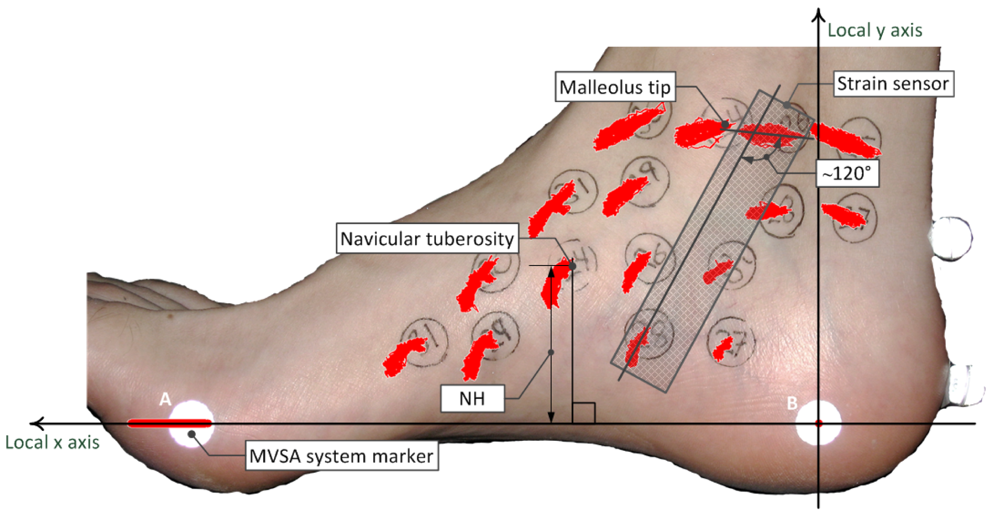
A strain sensor based on a DEAP material from Danfoss PolyPower and a system to measure the strain of a sensor was constructed. An analysis was performed to locate an estimate of the optimal position of a strain sensor, to measure the navicular drop, and two estimated points of optimal attachment on the foot were located.
A strain sensor and markers from the MVSA system were attached to the bare foot, and measurements using both systems were acquired simultaneously to validate the strain sensor measurements. The measurements showed a linear relationship between the navicular drop measurements acquired using the MVSA and PBS system, respectively. A temporal comparison of time synchronized measurements of navicular height was also performed, and this comparison showed a similarity in the location of characteristic points of gait.
Preliminary in-shoe measurements were also acquired, and indicated that a strain sensor was resistant to the influence of a person wearing a shoe. The person wearing the sensor did not notice the sensor during walk. Temporal comparison of bare foot and in-shoe measurements indicated a similarity in the strain of the sensor. Calculations of the mean navicular drop indicated a minor decrease in navicular drop, when the person was wearing a shoe. This decrease could be explained by the shoe supporting the foot during gait.
Despite the preliminary nature of these results, the correlation between the strain of a sensor and the navicular drop has implications for future research. Clinical trials are needed to test the applicability of this device for in-shoe measurements of navicular drop in a clinical setting.
Acknowledgments
The authors acknowledge The Bevica Foundation and Aarhus University for funding this research. The authors further acknowledge Wacker-Kemi AB and Danfoss PolyPower A/S for material samples used in production of the strain sensor.
References
- Leardini, A.; Benedetti, M.G.; Berti, L.; Bettinelli, D.; Nativo, R.; Giannini, S. Rear-foot, mid-foot and fore-foot motion during the stance phase of gait. Gait Posture 2007, 25, 453–462. [Google Scholar]
- Carson, M.C.; Harrington, M.E.; Thompson, N.; O'Connor, J.J.; Theologis, T.N. Kinematic analysis of a multi-segment foot model for research and clinical applications: A repeatability analysis. J. Biomech. 2001, 34, 1299–1307. [Google Scholar]
- Liu, T.; Inoue, Y.; Shibata, K. Development of a wearable sensor system for quantitative gait analysis. Measurement 2009, 42, 978–988. [Google Scholar]
- Rouhani, H.; Favre, J.; Crevoisier, X.; Aminian, K. Measurement of multi-segment foot joint angles during gait using a wearable system. J. Biomech. Eng. 2012, 134, 061006. [Google Scholar]
- Liu, T.; Inoue, Y.; Shibata, K. A wearable ground reaction force sensor system and its application to the measurement of extrinsic gait variability. Sensors 2010, 10, 10240–10255. [Google Scholar]
- Do, T.N.; Suh, Y.S. Gait analysis using floor markers and inertial sensors. Sensors 2012, 12, 1594–1611. [Google Scholar]
- Lundberg, A.; Goldie, I.; Kalin, B.; Selvik, G. Kinematics of the ankle/foot complex: Plantarflexion and dorsiflexion. Foot Ankle 1989, 9, 194–200. [Google Scholar]
- Lundberg, A.; Svensson, O.K.; Bylund, C.; Goldie, I.; Selvik, G. Kinematics of the ankle/foot complex--Part 2: Pronation and supination. Foot Ankle 1989, 9, 248–253. [Google Scholar]
- Stindel, E.; Udupa, J.K.; Hirsch, B.E.; Odhner, D. An in vivo analysis of the motion of the peri-talar joint complex based on MR imaging. IEEE Trans. Biomed. Eng. 2001, 48, 236–247. [Google Scholar]
- Hirsch, B.E.; Udupa, J.K.; Samarasekera, S. New method of studying joint kinematics from three-dimensional reconstructions of MRI data. J. Am. Podiatr. Med. Assoc. 1996, 86, 4–15. [Google Scholar]
- Nielsen, R.G.; Rathleff, M.S.; Moelgaard, C.M.; Simonsen, O.; Kaalund, S.; Olesen, C.G.; Christensen, F.B.; Kersting, U.G. Video based analysis of dynamic midfoot function and its relationship with Foot Posture Index scores. Gait Posture 2010, 31, 126–130. [Google Scholar]
- Nielsen, R.G.; Rathleff, M.S.; Simonsen, O.H.; Langberg, H. Determination of normal values for navicular drop during walking: A new model correcting for foot length and gender. J. Foot Ankle Res. 2009, 2. [Google Scholar] [CrossRef]
- Jensen, K.; Juhl, J. Gait analysis by multi video sequence analysis. Photogramm. J. Fin. 2009, 21, 25–34. [Google Scholar]
- Menz, H.B. Alternative techniques for the clinical assessment of foot pronation. J. Am. Podiatr. Med. Assoc. 1998, 88, 119–129. [Google Scholar]
- McPoil, T.G.; Cornwall, M.W. The relationship between static lower extremity measurements and rearfoot motion during walking. J. Orthop. Sports Phys. Ther. 1996, 24, 309–314. [Google Scholar]
- Reinking, M.F. Exercise-related leg pain in female collegiate athletes: The influence of intrinsic and extrinsic factors. Am. J. Sports Med. 2006, 34, 1500–1507. [Google Scholar]
- Moen, M.H.; Bongers, T.; Bakker, E.W.; Zimmermann, W.O.; Weir, A.; Tol, J.L.; Backx, F.J. Risk factors and prognostic indicators for medial tibial stress syndrome. Scand. J. Med. Sci. Sports 2012, 22, 34–39. [Google Scholar]
- Boling, M.C.; Padua, D.A.; Marshall, S.W.; Guskiewicz, K.; Pyne, S.; Beutler, A. A prospective investigation of biomechanical risk factors for patellofemoral pain syndrome: The Joint Undertaking to Monitor and Prevent ACL Injury (JUMP-ACL) cohort. Am. J. Sports Med. 2009, 37, 2108–2116. [Google Scholar]
- Tiberio, D. The effect of excessive subtalar joint pronation on patellofemoral mechanics: A theoretical model. J. Orthop. Sports Phys. Ther. 1987, 9, 160–165. [Google Scholar]
- Rathleff, M.S.; Kelly, L.A.; Christensen, F.B.; Simonsen, O.H.; Kaalund, S.; Laessoe, U. Dynamic midfoot kinematics in subjects with medial tibial stress syndrome. J. Am. Podiatr. Med. Assoc. 2012, 102, 205–212. [Google Scholar]
- Bingger, P.; Zens, M.; Woias, P. Highly flexible capacitive strain gauge for continuous long-term blood pressure monitoring. Biomed. Microdevices 2012, 14, 573–581. [Google Scholar]
- Cochrane, C.; Koncar, V.; Lewandowski, M.; Dufour, C. Design and development of a flexible strain sensor for textile structures based on a conductive polymer composite. Sensors 2007, 7, 473–492. [Google Scholar]
- Mattmann, C.; Clemens, F.; Tröster, G. Sensor for measuring strain in textile. Sensors 2008, 8, 3719–3732. [Google Scholar]
- Martinez, F.; Obieta, G.; Uribe, I.; Sikora, T.; Ochoteco, E. Polymer-based self-standing flexible strain sensor. J. Sens. 2010, 2010. [Google Scholar] [CrossRef]
- Benslimane, M.Y.; Kiil, H.E.; Tryson, M.J. Electromechanical properties of novel large strain polypower film and laminate components for DEAP actuator and sensor applications. Proc. SPIE 2010, 764231:1–764231:110. [Google Scholar]
- Rathleff, M.S.; Olesen, C.G.; Moelgaard, C.M.; Jensen, K.; Madeleine, P.; Olesen, J.L. Non-linear analysis of the structure of variability in midfoot kinematics. Gait Posture 2010, 31, 385–390. [Google Scholar]
- Gray, F. Pulse Code Communication. US Patent 2,632,058. filed 13 November 1947, and issued 17 March 1953.
- Cornwall, M.W.; McPoil, T.G. Relative movement of the navicular bone during normal walking. Foot Ankle Int. 1999, 20, 507–512. [Google Scholar]
- Nester, C.J.; van der Linden, M.L.; Bowker, P. Effect of foot orthoses on the kinematics and kinetics of normal walking gait. Gait Posture 2003, 17, 180–187. [Google Scholar]


| Maximal strain in compliant direction: | 100% |
| Maximal strain in stiff direction: | 1% |
| Young's modulus: | 1.1 MPa |
| Density: | 1.11 g/cm3 |
| Height | Foot Length | Weight | Age | Sex | Navicular Drop |
|---|---|---|---|---|---|
| 192 cm | 280 mm | 80 kg | 25 years | male | 7.2 mm (95% CI: 7.0;7.5) |
| Height | Foot Length | Weight | Age | Sex |
|---|---|---|---|---|
| 175 cm | 245 mm | 66 kg | 28 years | Male |
| Item | Test | Retest |
|---|---|---|
| MVSA mean ND [mm] | 4.8 (95%CI: 4.6;5.0) | 5.1 (95%CI: 5.0;5.2) |
| PBS mean ND [mm] | 4.4 (95%CI: 4.3;4.6) | 4.5 (95%CI: 4.4;4.6) |
| Mean difference [mm] | 0.4 (95%CI: 0.1;0.6) | 0.6 (95%CI: 0.4;0.7) |
| Number of measurements | 63 | 88 |
© 2012 by the authors; licensee MDPI, Basel, Switzerland. This article is an open access article distributed under the terms and conditions of the Creative Commons Attribution license (http://creativecommons.org/licenses/by/3.0/).
Share and Cite
Kappel, S.L.; Rathleff, M.S.; Hermann, D.; Simonsen, O.; Karstoft, H.; Ahrendt, P. A Novel Method for Measuring In-Shoe Navicular Drop during Gait. Sensors 2012, 12, 11697-11711. https://doi.org/10.3390/s120911697
Kappel SL, Rathleff MS, Hermann D, Simonsen O, Karstoft H, Ahrendt P. A Novel Method for Measuring In-Shoe Navicular Drop during Gait. Sensors. 2012; 12(9):11697-11711. https://doi.org/10.3390/s120911697
Chicago/Turabian StyleKappel, Simon L., Michael S. Rathleff, Dan Hermann, Ole Simonsen, Henrik Karstoft, and Peter Ahrendt. 2012. "A Novel Method for Measuring In-Shoe Navicular Drop during Gait" Sensors 12, no. 9: 11697-11711. https://doi.org/10.3390/s120911697