Coumarin-Based Fluorescent Probes for Dual Recognition of Copper(II) and Iron(III) Ions and Their Application in Bio-Imaging


Abstract
: Two new coumarin-based “turn-off” fluorescent probes, (E)-3-((3,4-dihydroxybenzylidene)amino)-7-hydroxy-2H-chromen-2-one (BS1) and (E)-3-((2,4-dihydroxybenzylidene)amino)-7-hydroxy-2H-chromen-2-one (BS2), were synthesized and their detection of copper(II) and iron(III) ions was studied. Results show that both compounds are highly selective for Cu2+ and Fe3+ ions over other metal ions. However, BS2 is detected directly, while detection of BS1 involves a hydrolysis reaction to regenerate 3-amino-7-hydroxycoumarin (3) and 3,4-dihydroxybenzaldehyde, of which 3 is able to react with copper(II) or iron(III) ions. The interaction between the tested compounds and copper or iron ions is associated with a large fluorescence decrease, showing detection limits of ca. 10−5 M. Preliminary studies employing epifluorescence microscopy demonstrate that Cu2+ and Fe3+ ions can be imaged in human neuroblastoma SH-SY5Y cells treated with the tested probes.1. Introduction
Fluorescent probes may be defined as synthetic small molecules that react specifically with analytes to induce a marked change in their fluorescence properties; on the basis of such changes, the analytes can be determined [1–5]. These probes have been extensively investigated and widely used in many fields because of their powerful ability to improve analytical sensitivity, and in particular to be used in in vivo imaging studies. Of particular interest is the development of fluorescent probes for transition metal ions, such as Cu2+ and Fe3+, due to their biological relevance [6–8]. However, due to the low concentrations at which these metal ions are present in biosystems [9], high-sensitivity probes are necessary for practical applications. In recent years the literature has reported a large number of probes for Cu2+ and Fe3+ detection [10–13]. For the former ion, most of the probes involve a turn-off process, since copper ion often acts as a quencher via energy- or electron-transfer processes. However there are some probes designed on the basis of rhodamines, which show a fluorescence off-on response with reversible behavior upon complexation [14,15].
It is well known that Cu2+ can induce the hydrolysis of activated esters, Schiff bases, and hydrazones, which provides alternative approaches for the design of Cu2+ probes. These probes show a change in their fluorescence response to Cu2+ via Cu2+-promoted hydrolysis of the ester, imine or hydrazone function [16–18]. Interestingly, regarding Fe3+ ion detection, Lee et al. [19] have demonstrated that the strategy of a combination of Fe3+-induced Schiff-base hydrolysis and rhodamine spirolactam ring-opening in one system is an efficient model to achieve specific detection of Fe3+. Other fluorochromes with excellent photophysical properties, such as coumarin-based sensors, have also been reported for these metal ions [20]. However, in most of the cases studied, a high percentage of organic solvents is required due to the low water solubility of these probes. Thus, based on the fluorescent properties of coumarin derivatives and the importance of the presence of a Schiff base for the sensing mechanism of Cu2+ and Fe3+ ions, we have now synthesized, characterized and assessed two coumarin-based fluorescent probes for these biologically relevant ions, namely (E)-3-((3,4-dihydroxybenzylidene)amino)-7-hydroxy-2H-chromen-2-one (BS1) and (E)-3-((2,4-dihydroxybenzylidene)amino)-7-hydroxy-2H-chromen-2-one (BS2).
2. Experimental Section
2.1. Instruments and Reagents
All analytes were purchased from Sigma-Aldrich (Santiago, Chile) and were used as received. Unless indicated otherwise, all solutions employed in this study were prepared in Chelex-100-treated HEPES buffer (30 mM; pH 7.4). Melting points were determined on a Reichert-Jung Galen III hot-plate microscope equipped with a thermocouple. 1H-NMR spectra were recorded with a Bruker Avance 400 MHz spectrometer. All measurements were carried out in DMSO-d6. Absorption spectra were recorded at 25 °C using a Hewlett-Packard model HP 8453 instrument. The emission spectra were recorded at 25 °C on an Agilent Technologies Cary Eclipse fluorescence spectrophotometer. The fluorescence imaging was evaluated using a Zeiss Hal 100 epifluorescence inverted microscope.
2.2. Synthesis of the Probes
2.2.1. (E)-3-((3,4-Dihydroxybenzylidene)amino)-7-hydroxy-2H-chromen-2-one (BS1)
3-Amino-7-hydroxy-2H-chromen-2-one (3, 0.56 g, 31 mmol) and 3,4-dihydroxybenzaldehyde (0.44 g, 31 mmol) were dissolved in absolute EtOH (10 mL) and refluxed for 2 h, during which a precipitate formed. After cooling, the product was collected and washed with an excess of hot EtOH to afford the product as a red solid, 0.93 g, 92%. m.p. > 320 °C. 1H-NMR (DMSO-d6): δ 10.46 (br, 1H, O-H), 10.17 (br, 1H, O-H), 9.87 (br, 1H, O-H), 8.80 (s, 1H, -N=CH-Ar), 7.72 (s, 1H, =C-H), 7.52 (d, 1H, Ar-H, J = 8.0 Hz) 7.49 (s, 1H, Ar-H), 7.30 (d, 1H, Ar-H, J = 8.0 Hz), 6.89 (d, 1H, Ar-H, J = 8.0 Hz), 6.80 (d, 1H, Ar-H, J = 8.0 Hz), 6.74 (s, 1H, OCH3).
2.2.2. (E)-3-((2,4-Dihydroxybenzylidene)amino)-7-hydroxy-2H-chromen-2-one (BS2)
3-Amino-7-hydroxy-2H-chromen-2-one (3, 0.56 g, 31 mmol) and 2,4-dihydroxybenzaldehyde (0.43 g, 31 mmol) were dissolved in absolute EtOH (10 mL), and treated as above to give a red solid, 0.91 g, 98%. m.p. > 320 °C. 1H-NMR, δ 13.36 (s, 1H, O-H- -O=C), 10.57 (br, 1H, O-H), 10.37 (br, 1H, O-H), 9.02 (s, 1H, -N=CH-Ar), 7.93 (s, 1H, =C-H), 7.52 (d, 1H, J = 8.6 Hz), 7.39 (d, 1H, J = 8.6 Hz), 6.81 (dd, 1H, J = 8.0, 2.0 Hz), 6.75 (s, 1H), 6.40 (dd, 1H, J = 8.0, 2.0 Hz), 6.28 (d, 1H, J = 2.0 Hz).
2.3. Association Constant (Benesi-Hildebrand Plot)
Fluorescence intensity data for the complexes were plotted according to the Benesi-Hildebrand equation [21]:
2.4. Calculation of the Fluorescence Quantum Yield
The fluorescence quantum yield was determined using quinine sulfate dissolved in 0.05 M H2SO4 ( ) as standard and was calculated using Equation (2) [22,23]:
2.5. Computational Details
Optimization calculations were performed to find the ground state, transition state, intermediate and reaction product structures for BS1 and BS2. The systems were optimized using the M05–2X method and 6-311G(d,p) basis set. The same method was used with Cu(II), but the LANL2DZ basis set was included. All other atoms of the molecule (C, H, O and N) and structures were optimized using the GAUSSIAN 03 suite of programs [24].
2.6. Cell Culture and Fluorescence Imaging for Cu2+
Human neuroblastoma SH-SY5Y cells (CRL-2266, American Type Culture Collection, Rockville, MD, USA) were cultured in MEM-F12 medium supplemented with 10% FBS, non-essential amino acids, antibiotic-antimycotic mixture, and 20 mM HEPES buffer, pH 7.2. The medium was replaced every 2 days. Cells were washed and the basal fluorescence was measured. They were then treated with the tested compounds (5 μM, 20 min) and washed with FBS, after which their fluorescence was determined. The cells were then incubated with Cu-His (200 μM, 15 min). The fluorescence was measured using an epifluorescence microscope at 63× amplification [25].
2.7. Cell Culture and Fluorescence Imaging for Fe3+
SH-SY5Y cells were cultured as described above. The cells were exposed to 20 μM Fe-NTA for 24 h and then incubated with the tested compounds (10 μM, 20 min). The fluorescence was measured as before.
3. Results and Discussion
3.1. Synthesis of BS1 and BS2
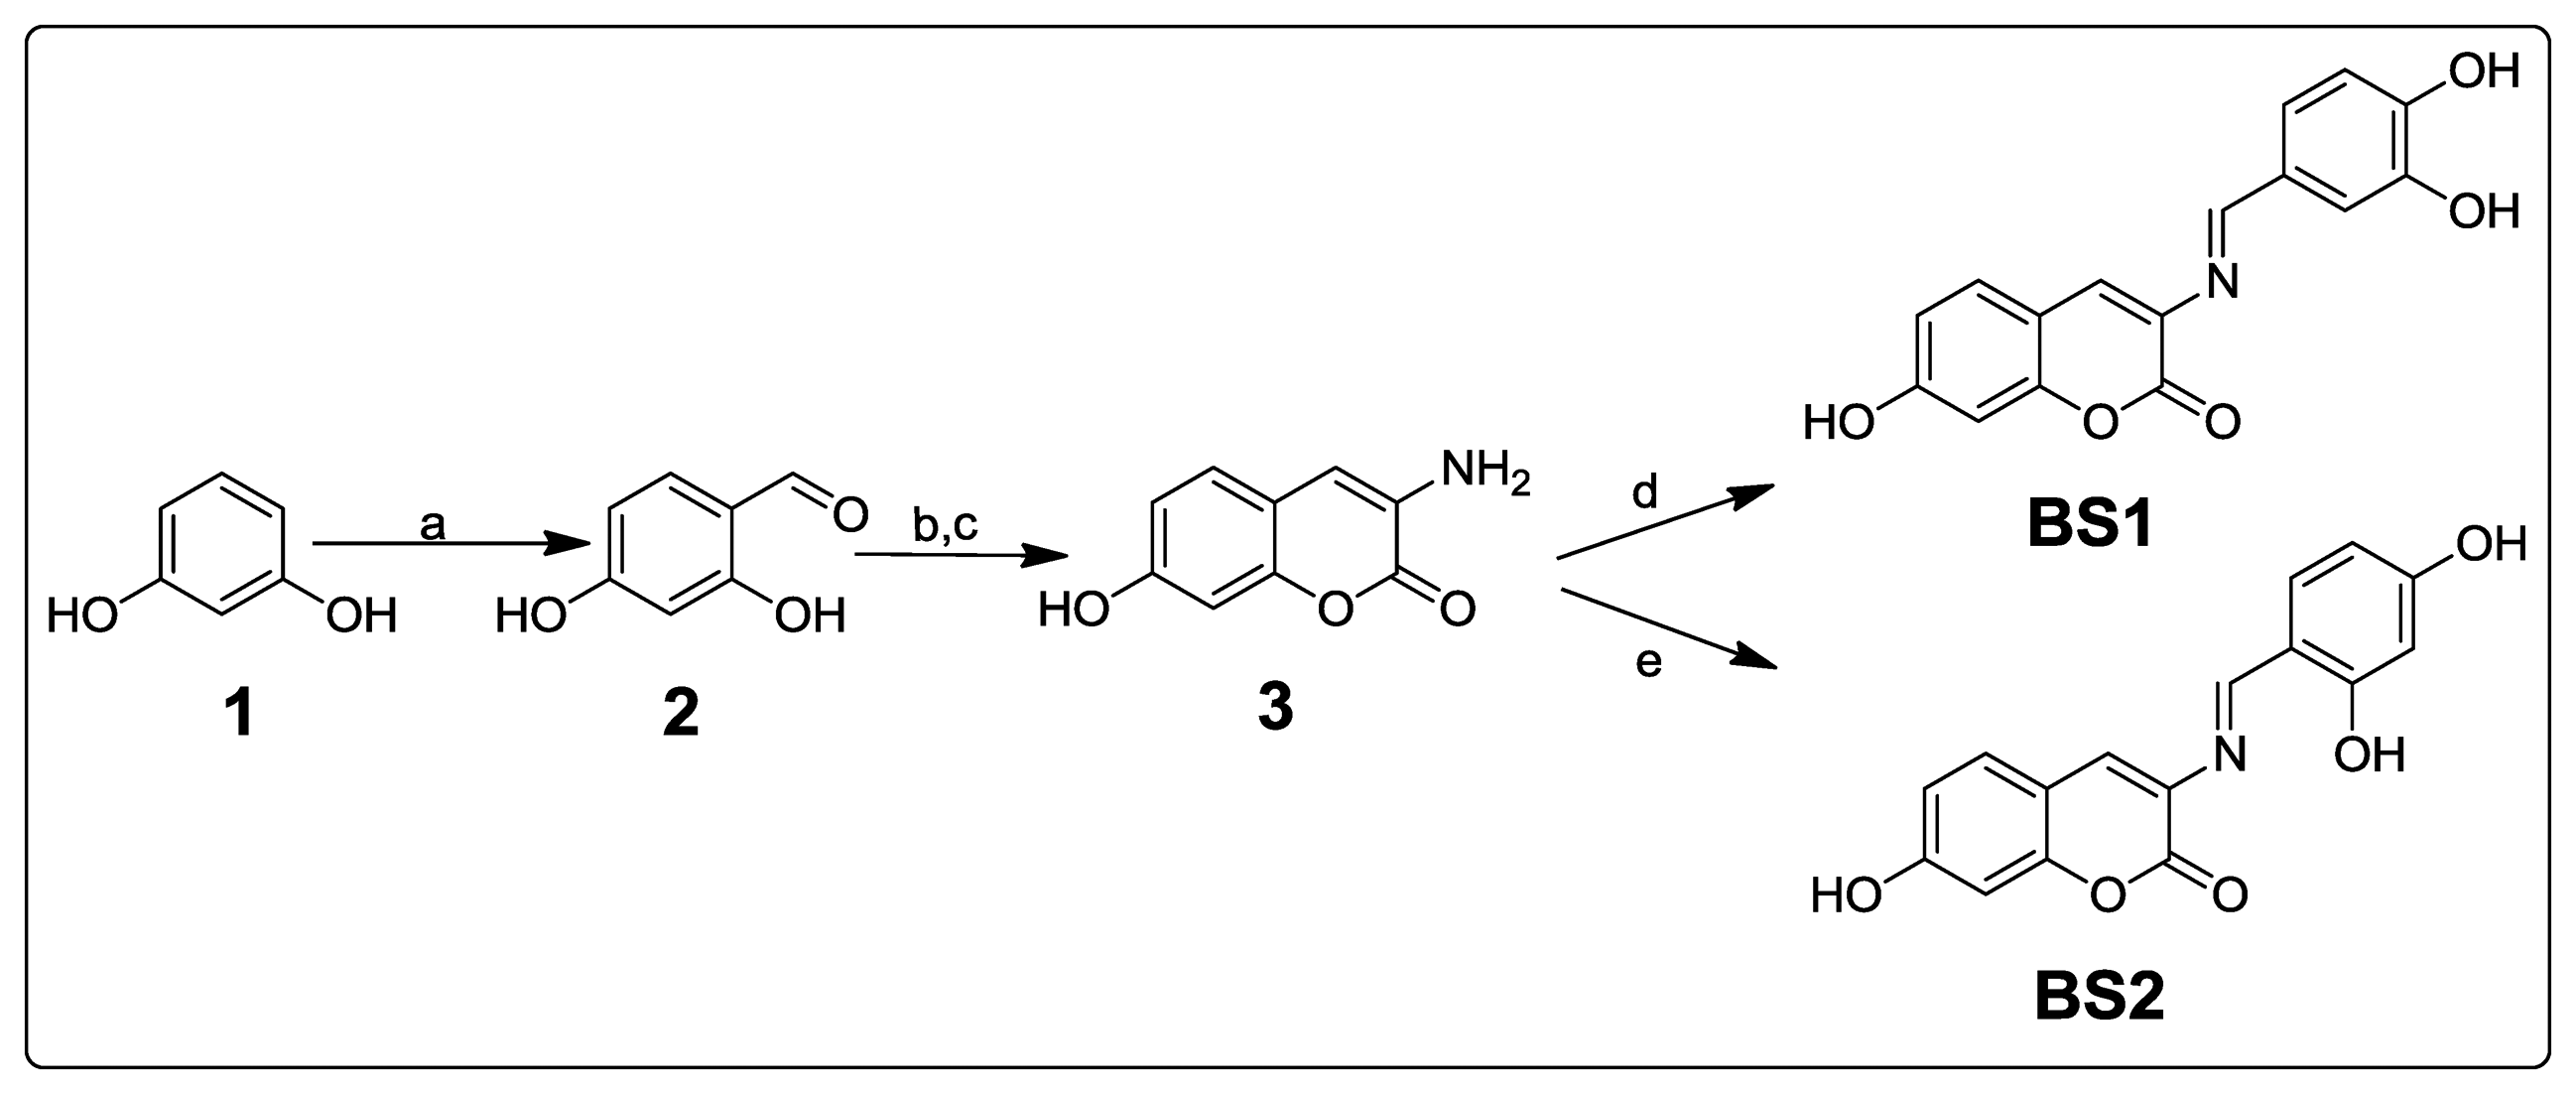
As shown in Scheme 1, resorcinol (1) was formylated (Vilsmeier-Haack conditions) giving 2,4-dihydroxybenzaldehyde (2), which was subsequently condensed (Knoevenagel reaction) with acetylglycine and hydrolysed in one step to afford 3-amino-7-hydroxycoumarin (3). The coumarin was condensed with 3,4-dihydroxybenzaldehyde or 2,4-dihydroxybenzaldehyde to obtain BS1 and BS2, by analogy with a literature procedure [26,27].
3.2. Spectral Characterization Studies
The compounds were characterized by 1H-NMR (in DMSO-d6), UV-Vis and fluorescence spectroscopy, the latter (in aqueous solution) as described in the Experimental section.
Figure 1A,B shows the absorption spectra of BS1 and BS2. The former displays a well-defined band at 360 nm (molar extinction coefficient of 22,830 M−1 cm−1). In the case of BS2 its absorption spectrum exhibits a well-defined band at 364 nm (molar extinction coefficient of 18,600 M−1 cm−1).
The emission spectra were recorded by exciting BS1 and BS2 at 360 nm and 364 nm, respectively. To obtain the excitation spectra, the emissions were fixed at 458 nm and 437 nm, respectively, as shown in Figures S1 and S2 (Supplementary Data).
The Stokes shift values (the differences between excitation and emission maxima) were calculated from spectral data and are given in Table 1.
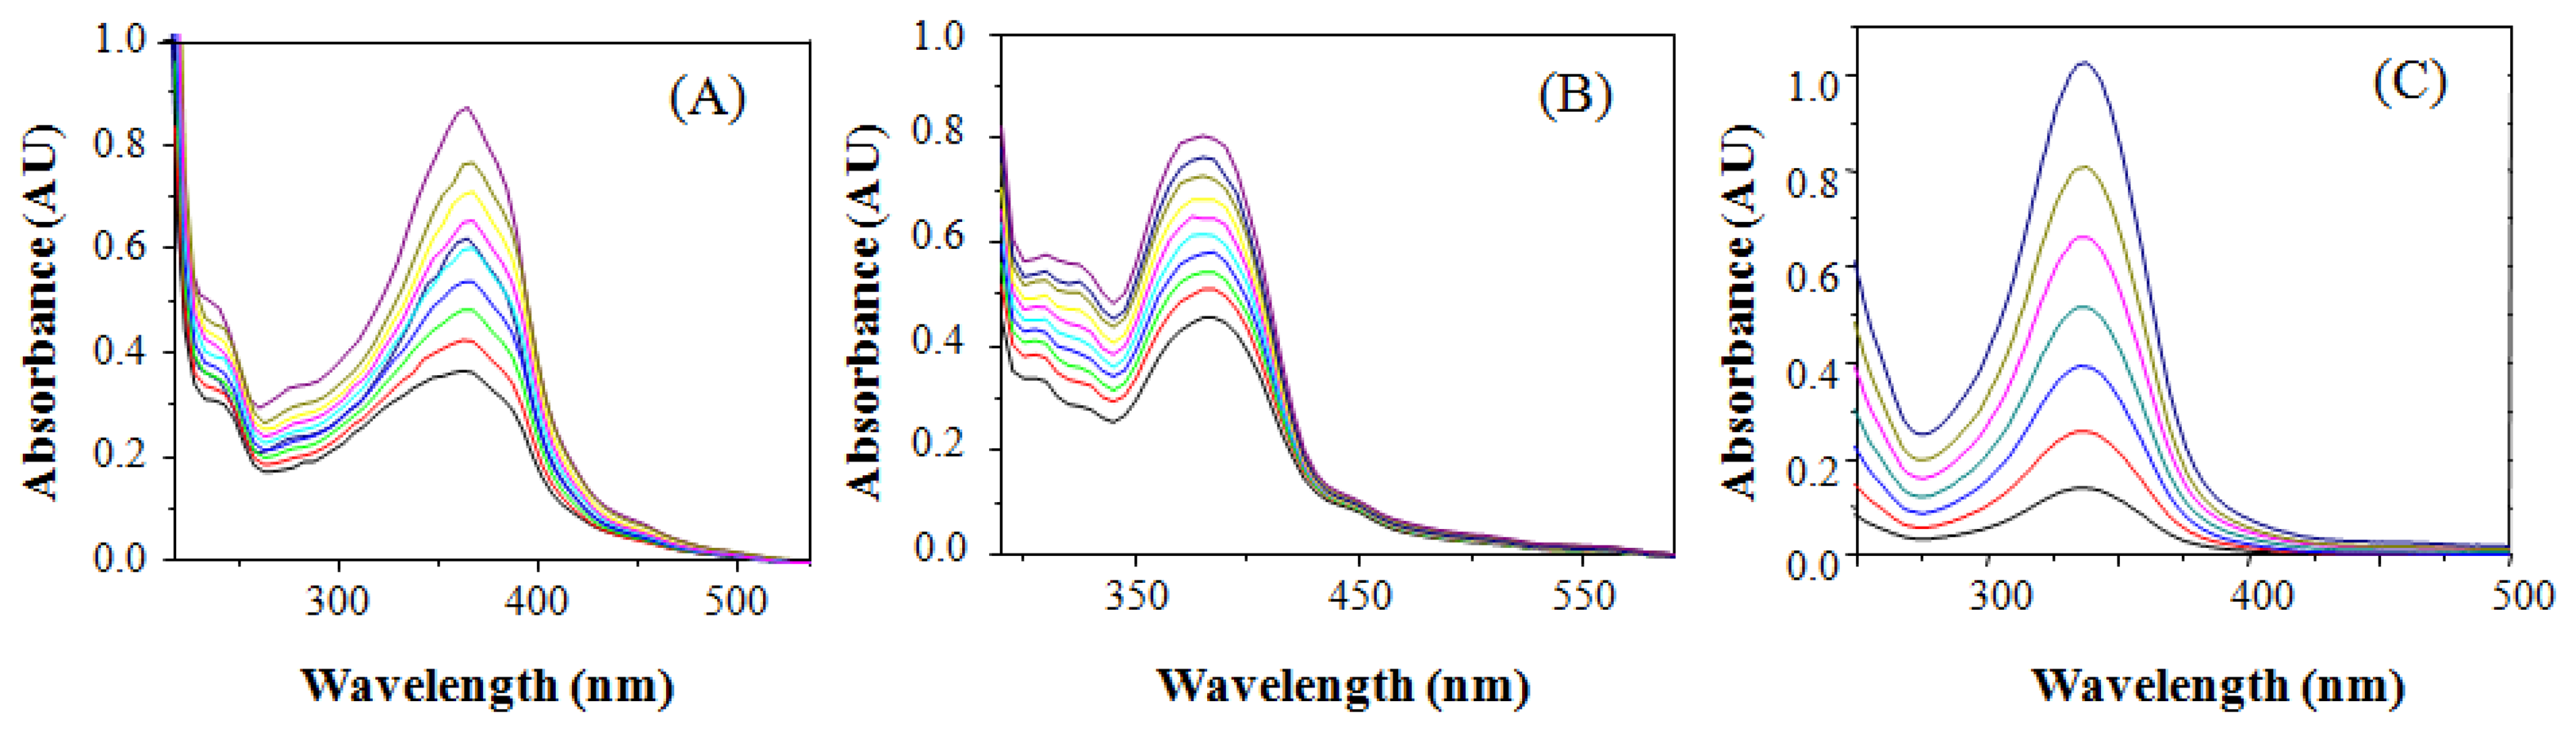
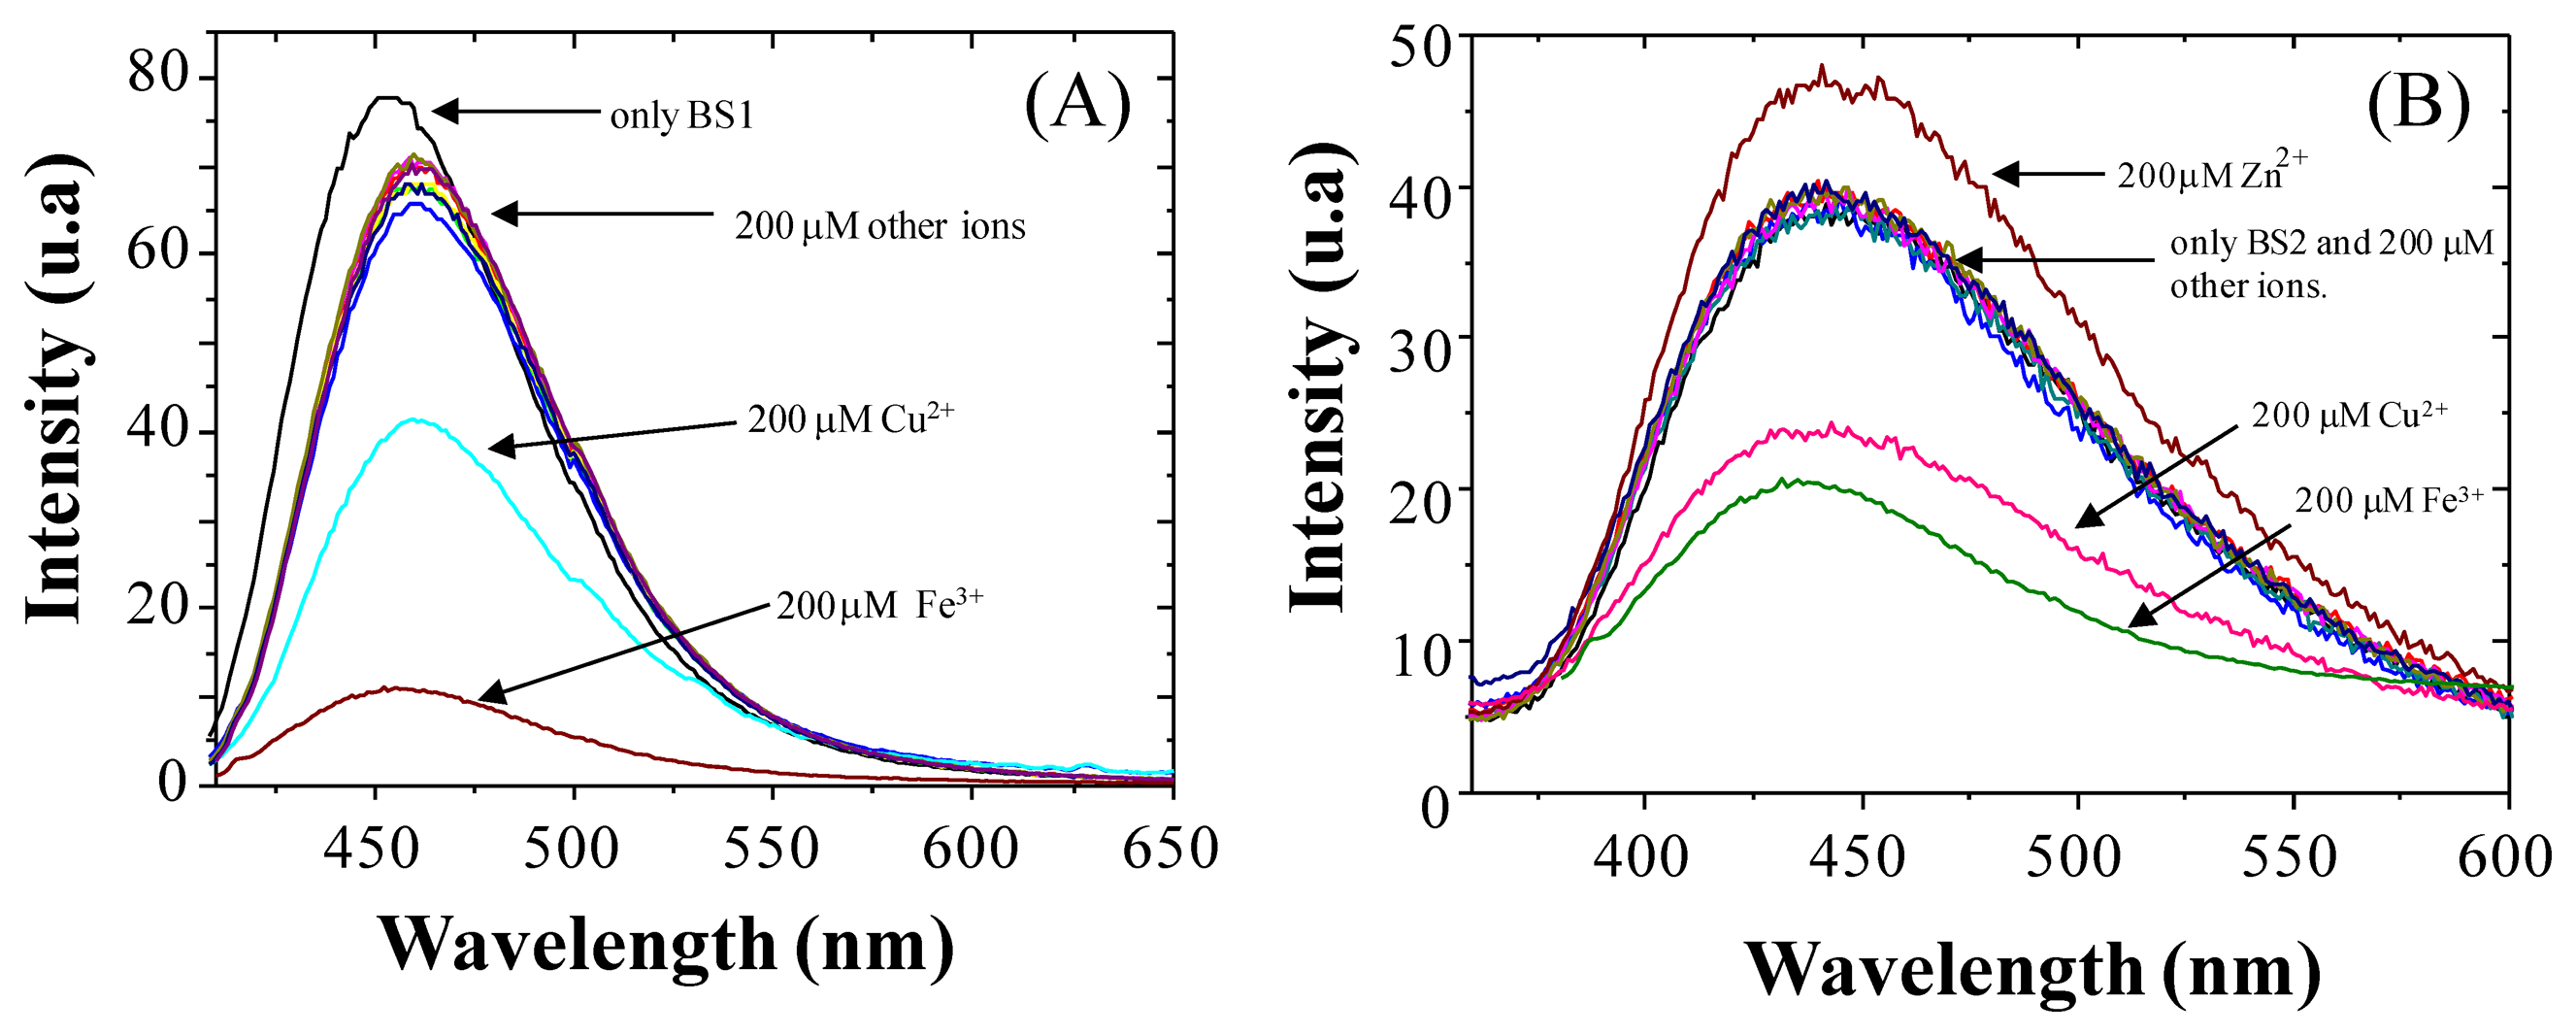
To examine the molecular recognition of a variety of different metal cations by BS1 and BS2 we conducted fluorescence spectroscopy studies. As shown in Figure 2A,B, the fluorescence exhibited by each compound decreases in the presence of Cu2+/Fe3+ ions. It is important to note that other metal ions of interest (at 200 μM concentration) failed to show any significant interference at 458 nm for BS1 and at 437 nm for BS2. However, for BS2 a slight fluorescence increase was observed when a concentration of 200 μM of Zn2+ was added.
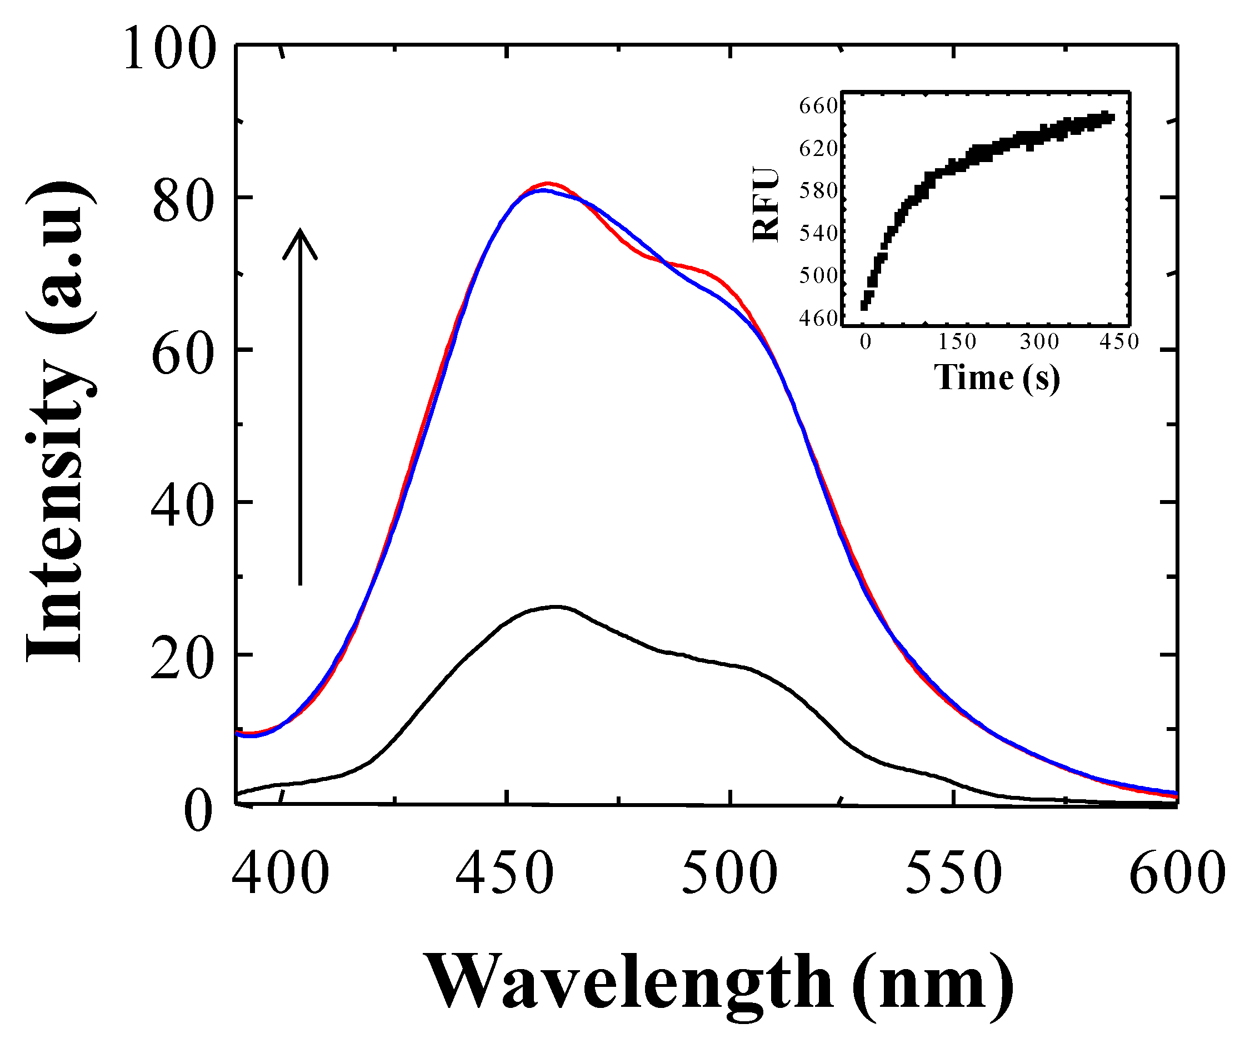
Considering the ability of BS1 and BS2 to interact with free Cu2+ or Fe3+ ions in aqueous solution, we assessed the effect of the addition of increasing concentration of these ions on the fluorescence intensity of BS1 and BS2. Controls conducted with solutions containing either BS1 or BS2 showed that, under the conditions of the assay (e.g., incubation at 25 °C during 360 s), BS1 exhibits–in the absence of metal- an almost threefold increase of its fluorescence intensity (see Figure 3). In the case of BS2 no changes in fluorescence intensity were observed under identical experimental conditions (not shown).
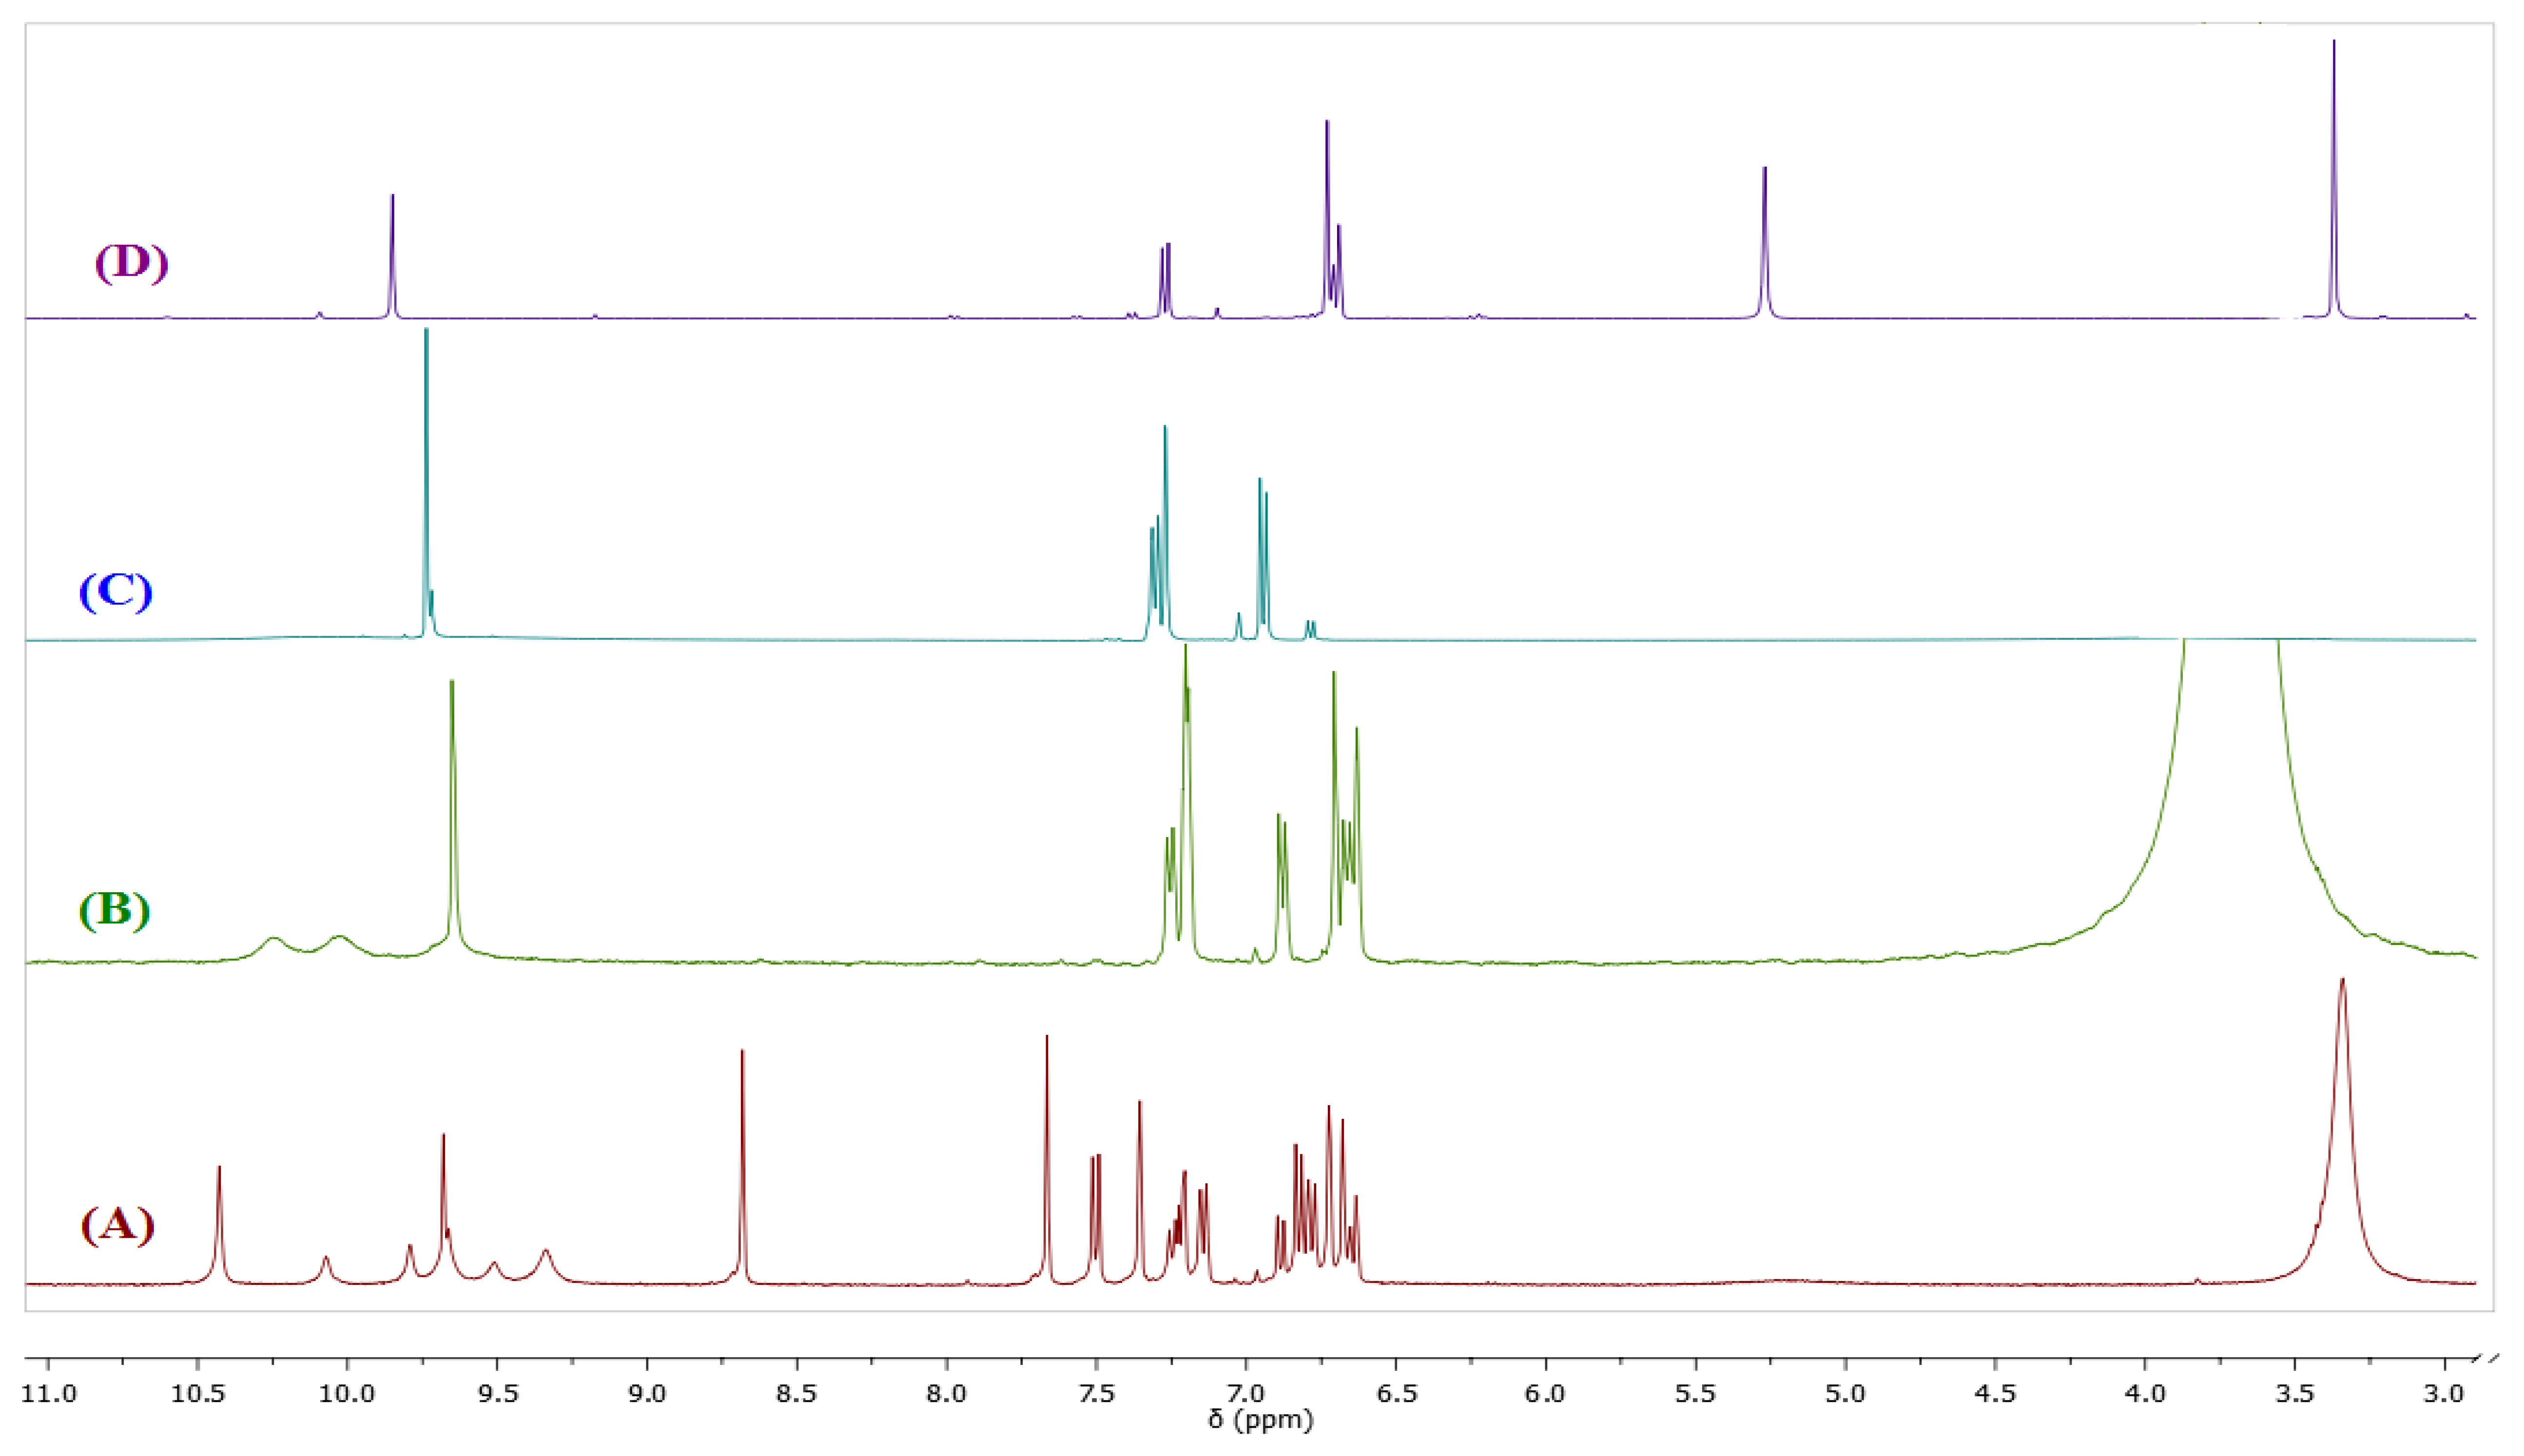
In view of the results presented in Figure 3 and considering the reported susceptibility to hydrolysis of compounds containing a Schiff base, we decided to evaluate the possibility that BS1 might, in addition to its sensing action, be decomposing in the buffered aqueous medium. With the aim of elucidating the chemical nature of the compound(s) that might be arising during the incubation of a BS1 solution, we conducted suitable 1H-NMR experiments.
Figure 4 depicts the spectra of BS1 (1 mM in part A), when adding 10% of water to BS1 (part B), and of its precursors, 3,4-dihydroxybenzaldehyde (part C) and 3-amino-7-hydroxy-2H-chromen-2-one (3) (part D). Spectrum (B) shows the disappearance of some characteristic resonances of BS1 and depicts features that are present in both spectra (C) and (D). Based on these NMR results we propose that BS1 indeed undergoes hydrolysis giving rise to its precursors, i.e., 3-amino-7-hydroxy-2H-chromen-2-one (3) and 3,4-dihydroxybenzaldehyde.
In line with the previous observation, the fluorescence spectra of BS1 (Figure S1) show an excitation band at 340 nm and an emission band at 461 nm, spectral features that are practically indistinguishable from those presented by the precursor 3 (Figure S3). The latter result is consistent with the NMR data and strongly suggests that the compound formed by decomposition of BS1 in solution is 3-amino-7-hydroxy-2H-chromen-2-one (3), as indicated in Scheme 2.
Regarding the stability of precursor 3, it is important to note that its NMR spectrum recorded after 10 h of incubation with added water is identical to that obtained for the freshly prepared solution in DMSO-d6 (see Supplementary Data, Figure S4).
The stability of 3 in aqueous solution suggests that this compound might be the substance actually involved in the Cu2+/Fe3+ ion detection presented in Figure 2A. Therefore, we focused our study further on evaluating whether the fluorescence intensity of 3 might decrease as a result of its interaction with these metal ions.
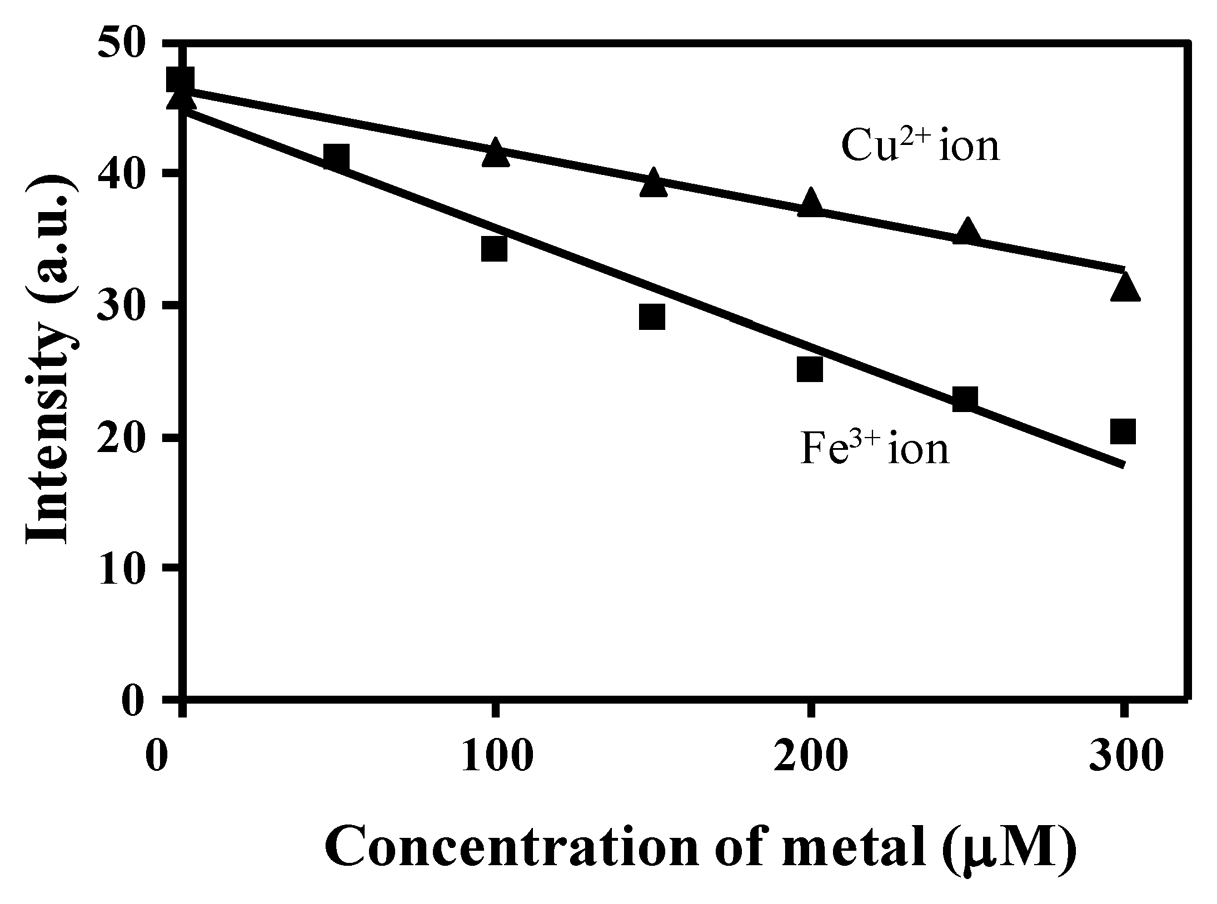
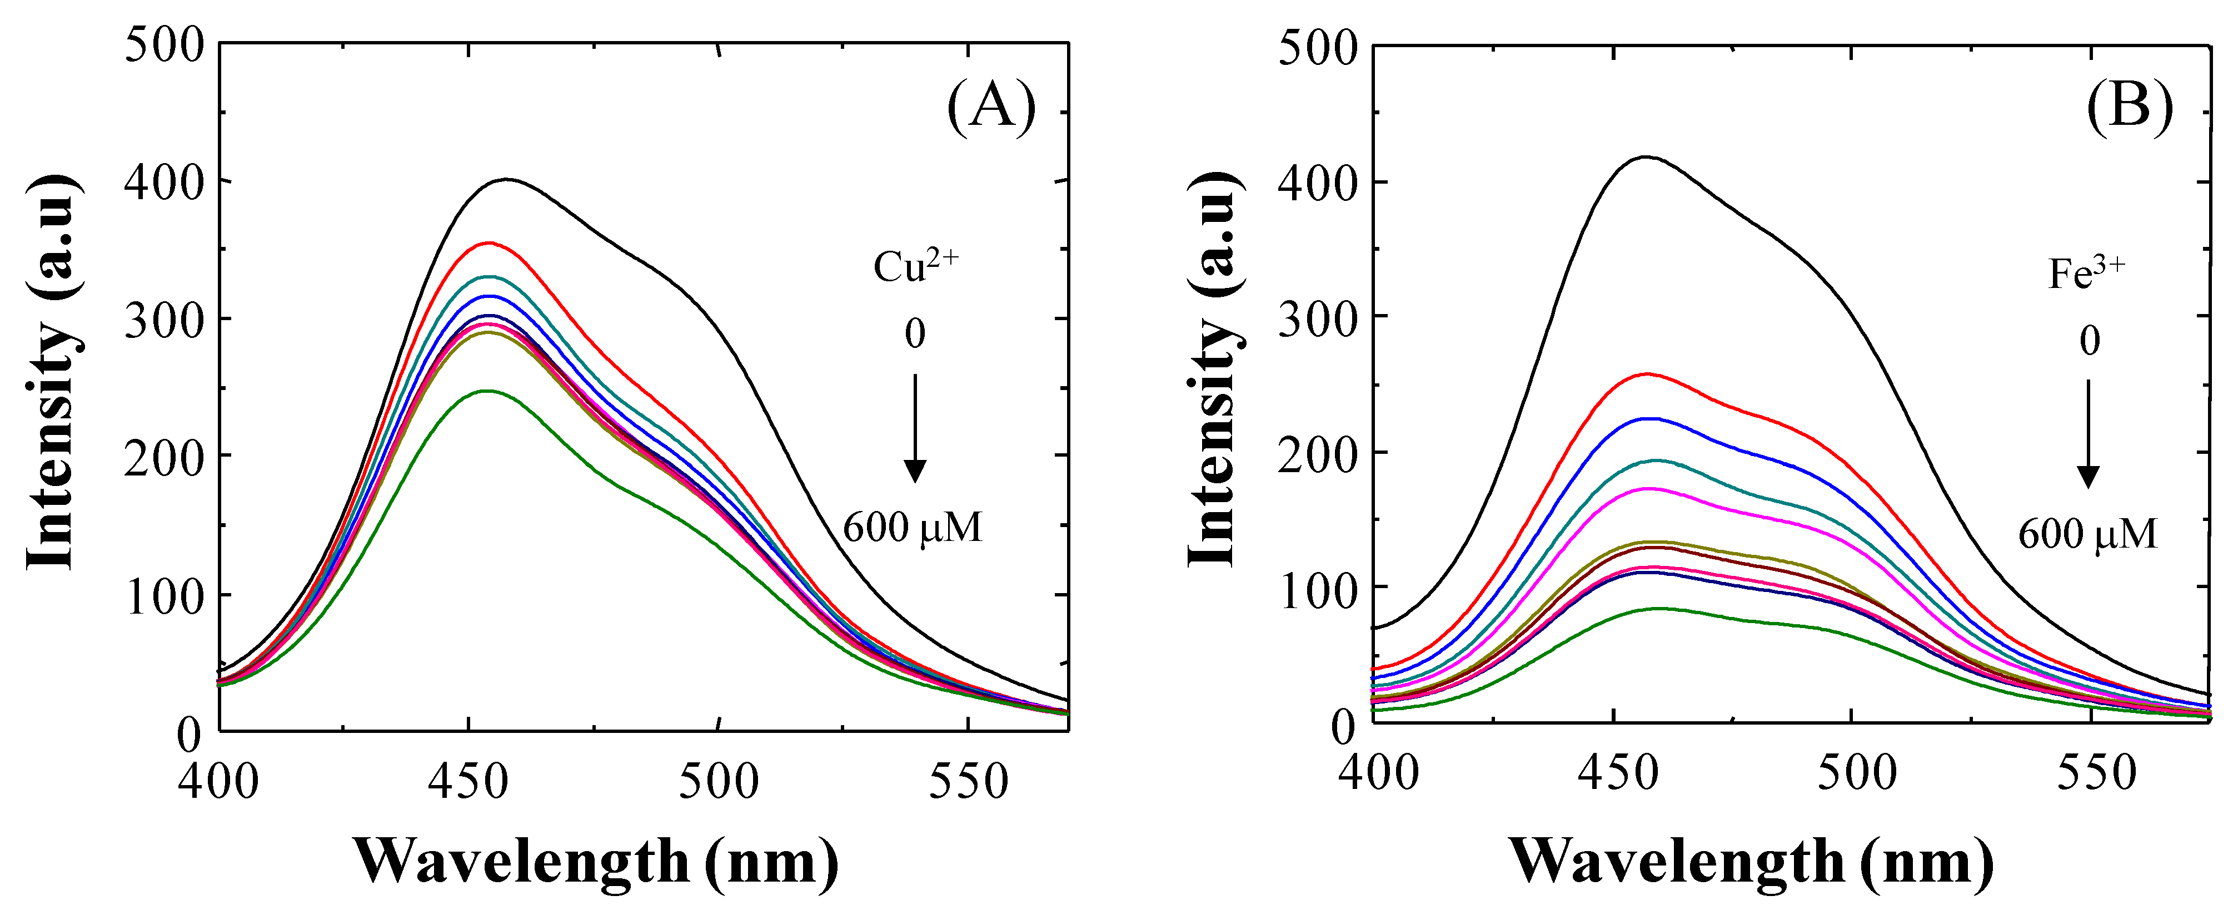
As shown in Figure 5, upon incremental addition of Cu2+ ion (0–300 equiv.) to a solution containing 3, the fluorescence emission is gradually quenched and reaches the saturation state when 300 equiv. of Cu2+ ion are employed (not shown). This fluorescence quenching of 3 may occur by excitation energy transfer from the ligand (probe) to the metal d-orbital and/or LMCT [28]. A similar quenching of fluorescence was observed when Fe3+ ion was tested. In fact, when 600 μM of Fe3+ ion was added to a solution of 3, a quenching efficiency of (I0 − I)/I0 × 100 = 79.80% was observed at 454 nm. Based on the evidence presented here, we propose that under our experimental conditions 3 is a good probe for detecting both Cu2+ and Fe3+.
Recently, other authors [29] have reported the importance of the presence of an o-OH group in the benzylidene moiety of the Schiff base, which serves as an additional binding site for Cu2+ ion coordination to provide a stable complex. In view of the latter and the results presented above related to the hydrolysis of BS1, we propose that the o-OH unit of BS2, by forming an intramolecular hydrogen bond, makes BS2 more resistant to this decomposition reaction. In fact, we observed that the NMR spectrum of BS2 remains unaltered after its exposure to water or a long incubation time (Figure S5). Therefore, considering the stability of BS2, we also characterized the sensitivity of this probe toward Cu2+ and Fe3+ ions in aqueous medium. The results are presented in Figure 6. At pH 7.4 a decrease in the fluorescence emission intensity of BS2, dependent on the metal concentration, was observed at 437 nm upon addition of Fe3+ ions and a smaller decrease was seen after adding Cu2+ ions (Figure 6). Quenching efficiencies of (I0 − I)/I0 × 100 = 31.53% and 56.76% for Cu2+ and Fe3+ ion, respectively, were determined at 437 nm.
Benesi-Hildebrand plots from fluorescence titration data of BS1, BS2 and 3 with Cu2+ or Fe3+ ions were non-linear, indicating changes in the stoichiometry of the metal-containing complexes (data not shown). As can be seen in Table 2, in most cases the detection limits were ca. 5 × 10⁻⁵ mol/L, based on 3 × σ/k (where σ is the standard deviation of the blank solution and k is the slope of the calibration plot obtained from spectra data in Figures 2,5,S6). These values are similar to values reported in the literature for other Cu2+/Fe3+ probes [28,30].
3.3. Computational Study
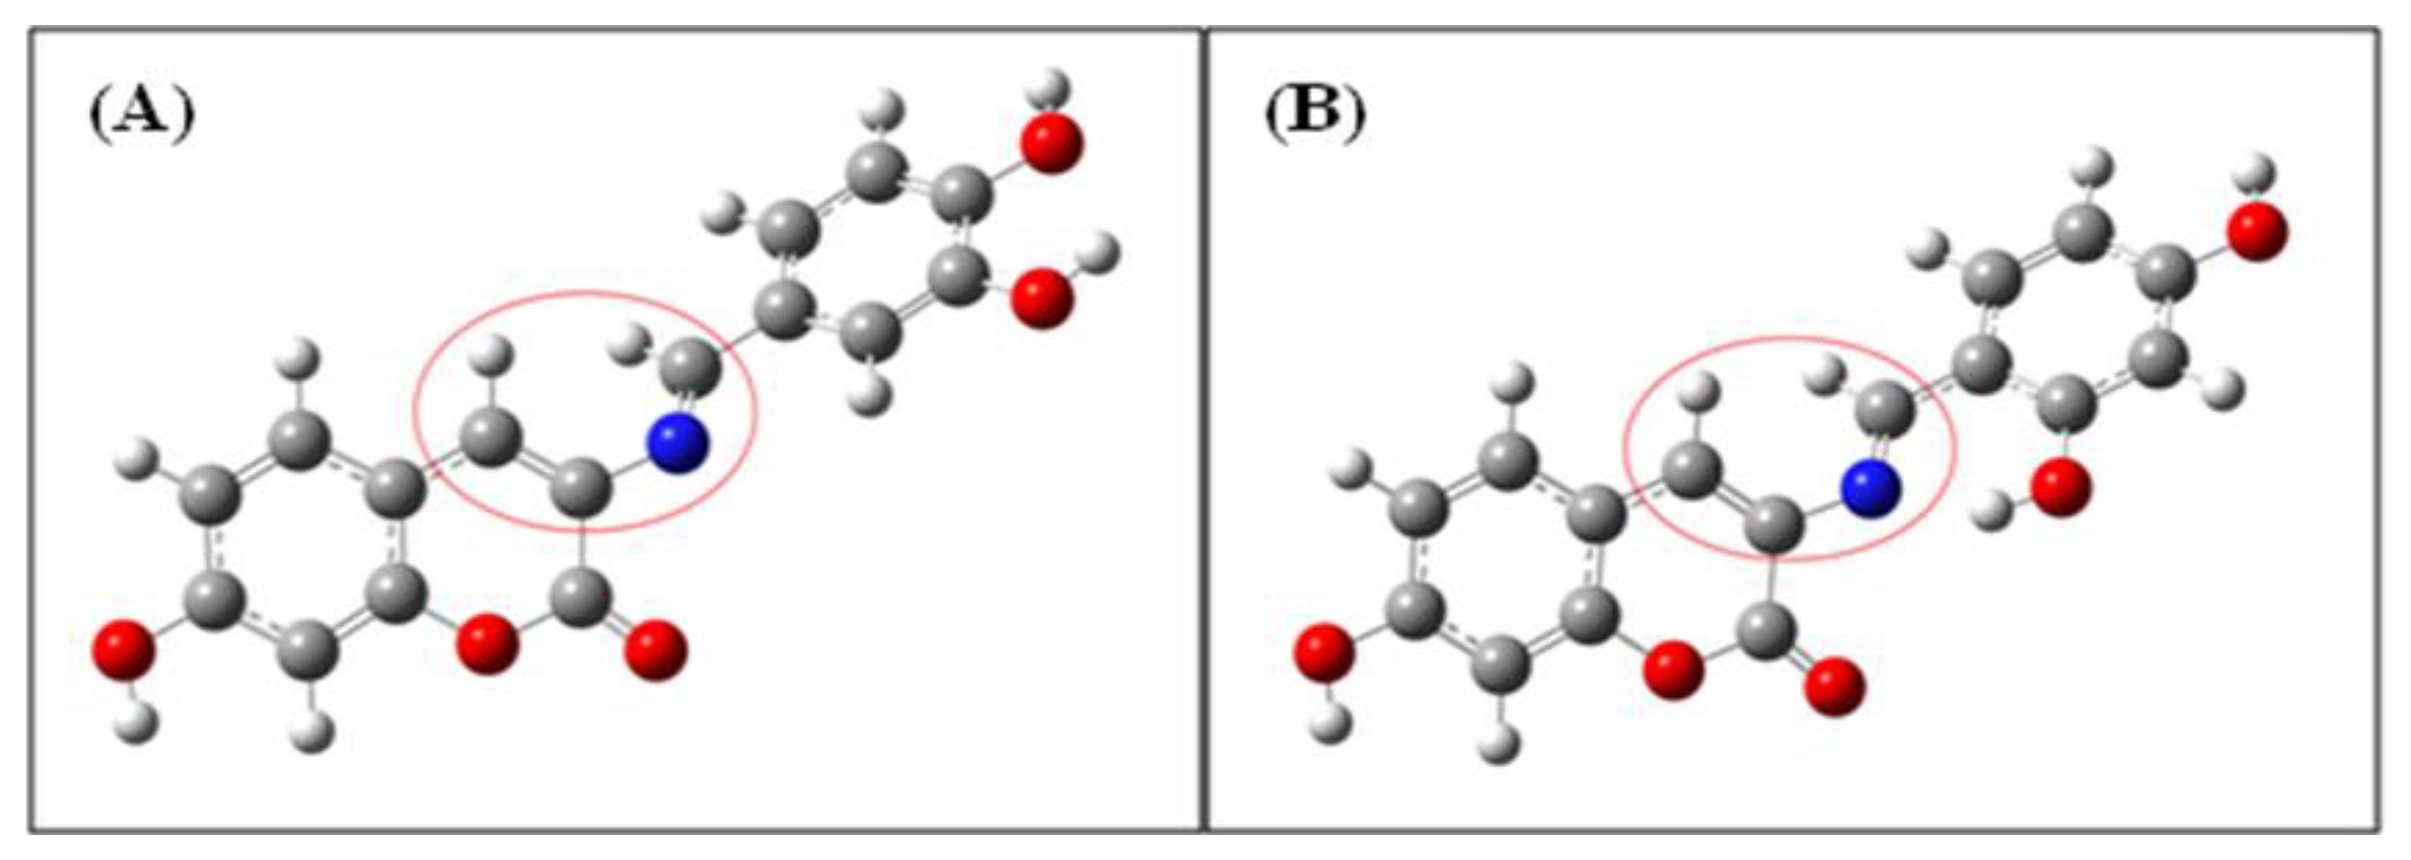
To assess the stability of BS2 in comparison with BS1, a theoretical study within the framework of Natural Bond Orbital (NBO) analysis was carried out [31]. This procedure shows that the proposed intramolecular hydrogen bond for BS2 has a distance of 1.738 Å and energy of 30.88 kcal mol−1. These values are within the established range for strong hydrogen bonds [32,33]. Therefore, the stability of BS2 could be associated with this intramolecular interaction. In addition, Table 3 and Figure 7A,B shows that for BS1 and BS2 their dihedral angles (between atoms depicted inside the red circles in Figure 7) decrease from 44.22° for BS1 to 41.03° for BS2. The latter could be another consequence of the presence of the intramolecular hydrogen bond formed between the hydrogen of the hydroxyl group and the nitrogen atom of the imine group present in BS2.
On the other hand, with the aim of understanding why BS1 undergoes a decomposition reaction to regenerate its precursors, it is necessary to calculate the reaction profile. This profile is shown in Figure S7. This shows that the reaction proceeds through a stepwise mechanism, where the rate-determining step is the formation of the first transition state. The activation energies are shown in Table 3.
The data presented in Table 3 indicate that the first step for BS2 requires slightly more energy than in the reaction of BS1, which suggest that the reaction should be faster for BS1 than for BS2. Taking into consideration the latter and the stability of BS2 (assessed under our experimental conditions), we pursued additional theoretical studies to investigate the binding of copper ion to BS2. As shown in Figure S8, the imine, carbonyl, and hydroxyl groups present in BS2 can be important coordination sites for a copper ion.
3.4. Competitive Binding Studies
To examine the interferences of different metal ions with the recognition of Cu2+ or Fe3+ by 3 and BS2, fluorescence competition experiments were subsequently carried out. As shown in Figure S9A,B, the fluorescence intensity of 3 and BS2 solutions, respectively, was not significantly quenched in the presence of the selected potential competitive metal ions, whereas subsequent addition of Fe3+ ions led to strong quenching. Similar results were obtained in the presence of Cu2+ ions (data not shown). These results demonstrate that the coexisting metal ion does not interfere significantly with Fe3+ or Cu2+ recognition.
3.5. Application of the Proposed Probes for the Detection of Copper or Iron Ions in Living Cells
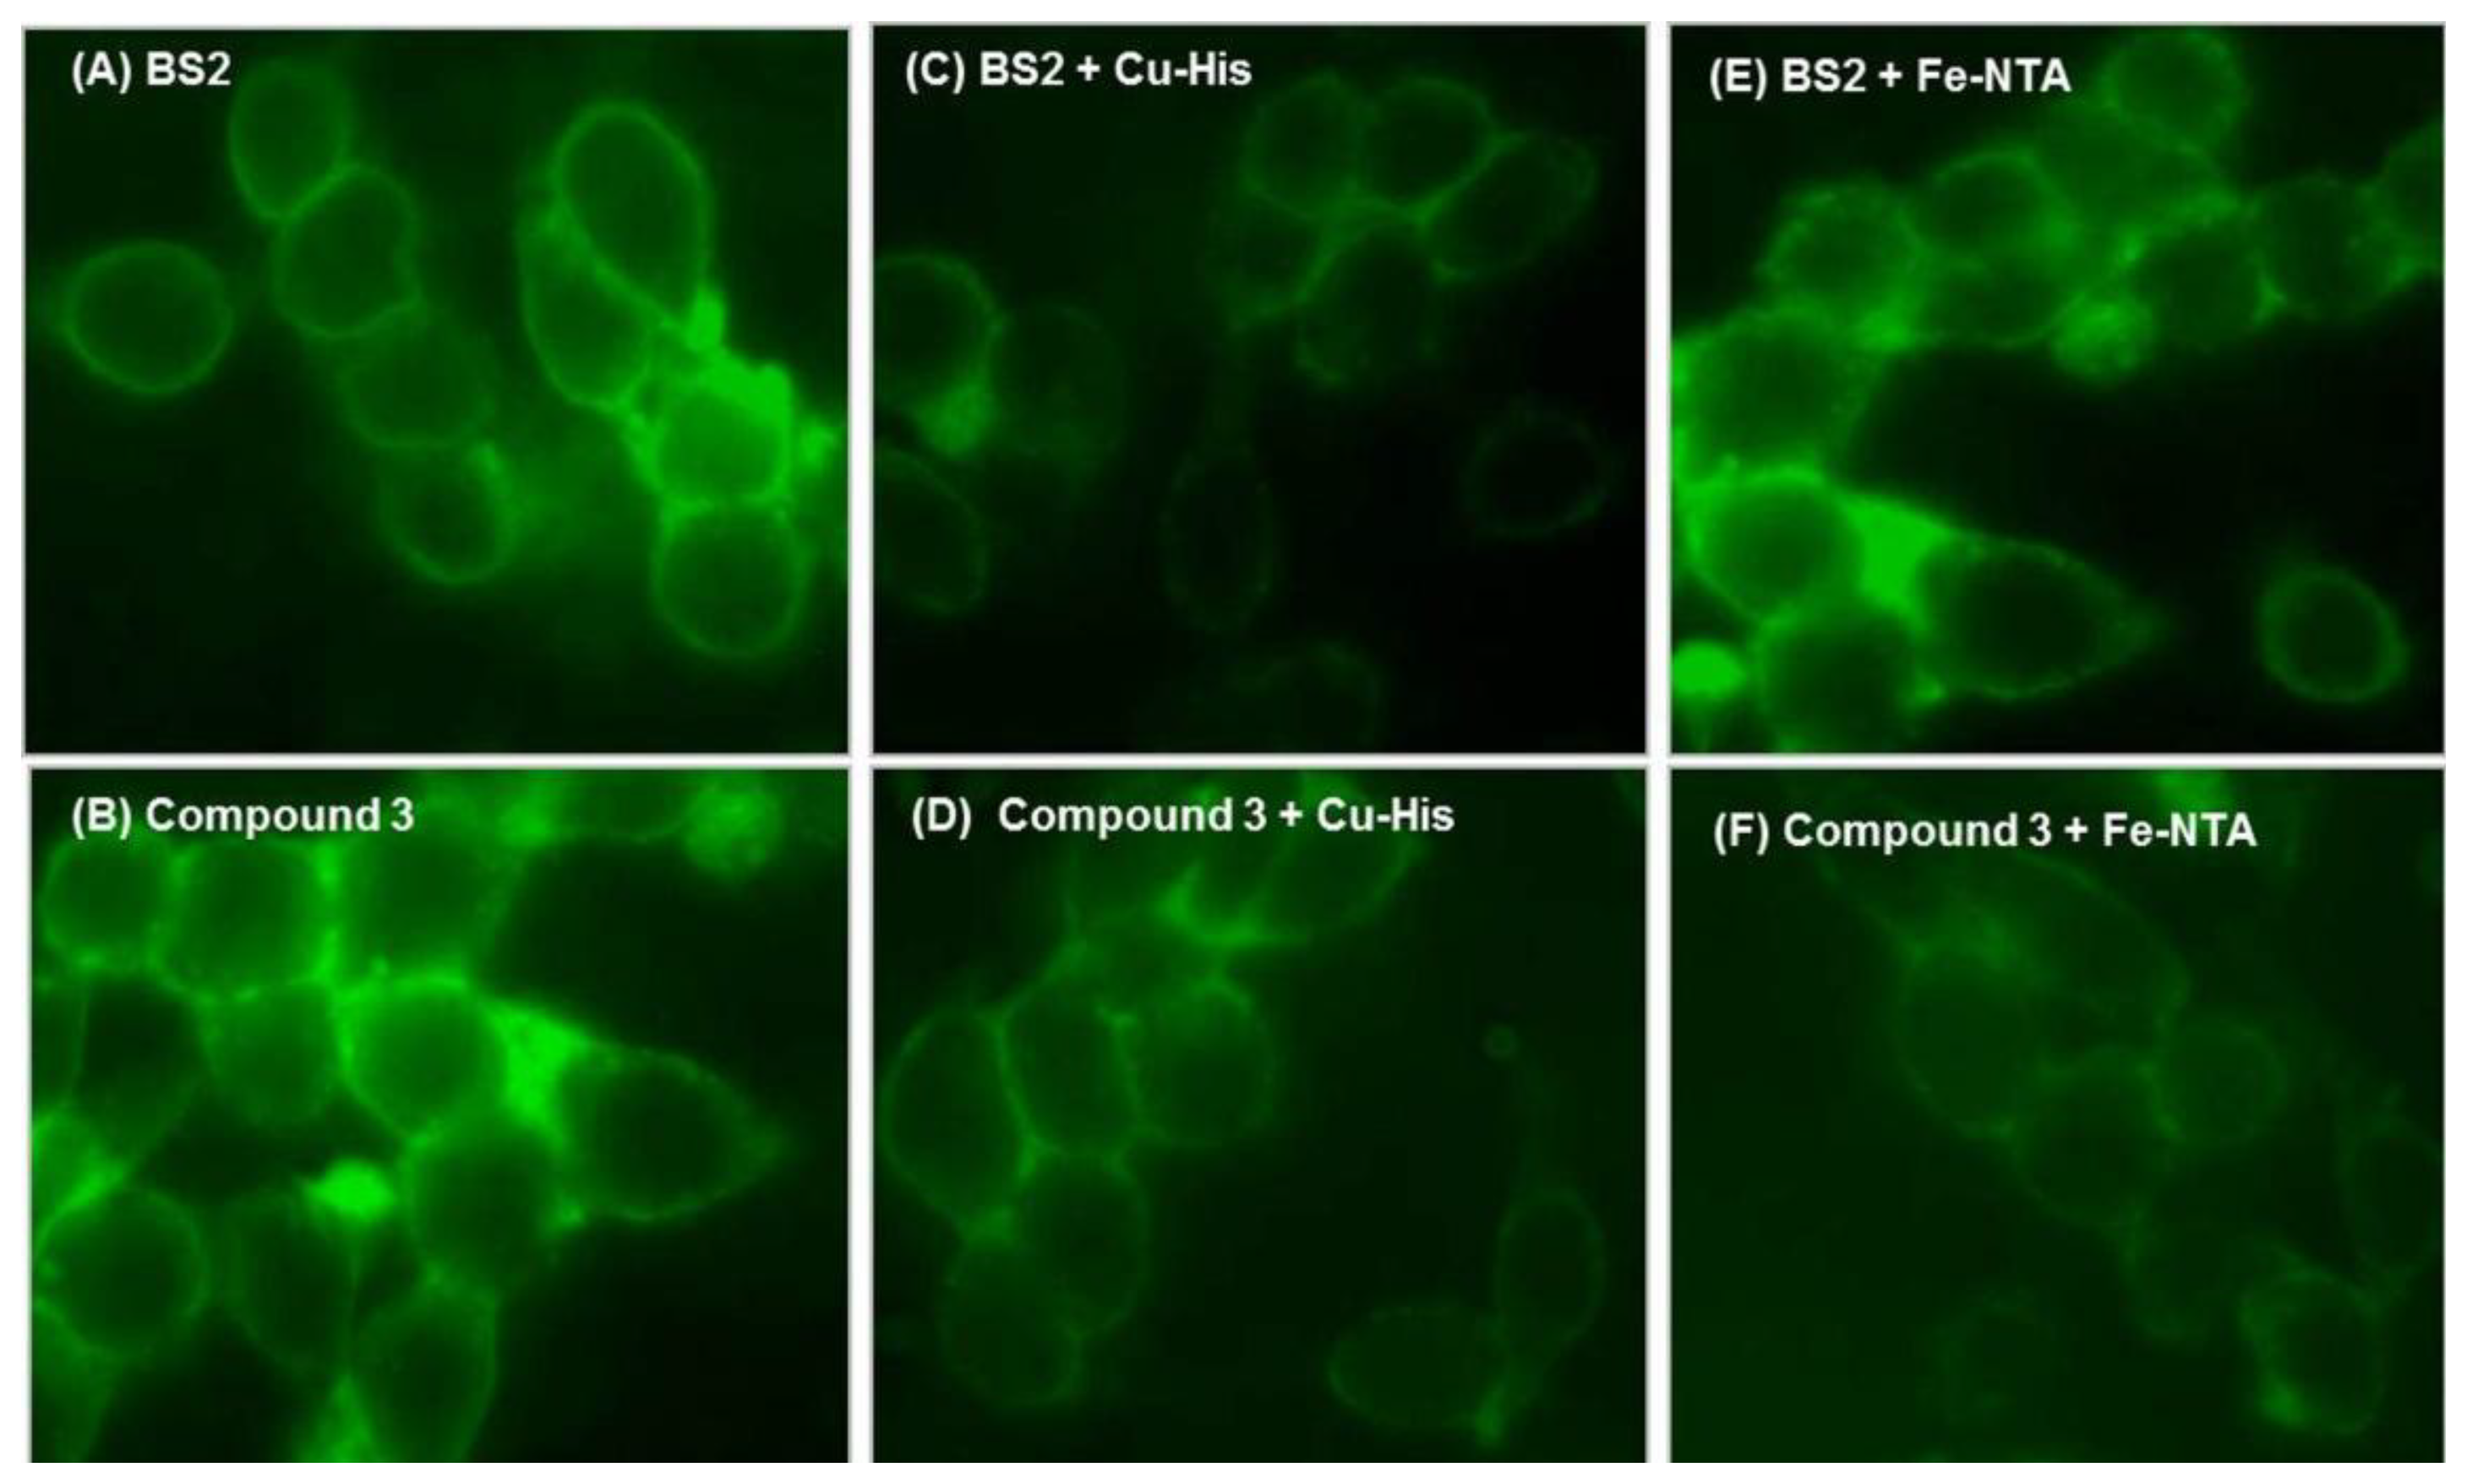
To further demonstrate the practical applicability of the tested probes to detect Cu2+ and Fe3+ in living cells, the fluorescence images of SH-SY5Y cells were recorded before and after addition of Cu2+ and Fe3+ ions (Figure 8).
First, to determine the cell permeability of BS2 or 3, the cells were initially incubated either with BS2 or 3, under physiological conditions. Figure 8A,B shows that both probes have the ability to penetrate the cell and generate a fluorescent signal distributed throughout the cytoplasm. From recent work [34] showing the intracellular localization of fluorescent probes in living cells it is expected that BS2 will be more uniformly distributed in the cytoplasm, while 3 would be expected to accumulate in lysosomes. After adding Cu2+-histidine complex as a source of Cu2+, a decrease in the fluorescence intensity is observed (Figure 8C,D). In the case of cells incubated with BS2 the addition of Fe3+ as Fe-NTA complex was not associated with changes in the fluorescence intensity (Figure 8E). The latter result could be explained considering that BS2 is unable to remove Fe3+ ion from the Fe-NTA complex, due to the high value of the Fe(III)-NTA stability constant (Ka = 1012) [35].
On the other hand, when this assay was carried out using 3, the fluorescent hydrolysis product of BS1, 3 accumulates within the cell (Figure 8B) and responds by fluorescence quenching to Cu2+ (Figure 8D) and Fe3+ (Figure 8F). This behavior is in accordance with the abovementioned results (Figure 5).
4. Conclusions/Outlook
Coumarin-based probes (compounds BS1 and BS2) were synthesized and characterized for recognition of Cu2+/Fe3+. Our studies indicate that these compounds present high selectivity for Cu2+ and Fe3+ ions over other metal ions. However, the detection mode for such ions is different, being a direct reaction in the case of BS2 and an indirect reaction with BS1. The latter involves a hydrolysis reaction to generate 3-amino-7-hydroxycoumarin (3) and 3,4-dihydroxybenzaldehyde, where 3 is the actual substance reacting with Cu2+ or Fe3+ ions and undergoing fluorescence quenching. On the basis of a theoretical study, a binding mode between 3 and Cu2+ is proposed. Finally, the applicability of the proposed probes was demonstrated in living cells with satisfactory results: BS2 is suitable for the detection of Cu2+ ion while 3 allows dual recognition of Cu2+ and Fe3+ ions in biological systems.
Supplementary Material
sensors-14-01358-s001.pdfAcknowledgments
This work was supported by FONDECYT Grant #1130062 and by FONDEF VIU-110063.
Conflicts of Interest
The authors declare no conflict of interest.
References
- Lakowicz, J.R. Topics in Fluorescence Spectroscopy: Probe Design and Chemical Sensing; Plenum Press: New York, NY, USA, 1994; Volume 4, pp. 21–68. [Google Scholar]
- De Silva, A.P.; Gunaratne, H.Q.N.; Gunnlaugsson, T.; Huxley, A.J.M.; McCoy, C.P.; Rademacher, J.T.; Rice, T.E. Signaling recognition events with fluorescent sensors and switches. Chem. Rev. 1997, 97, 1515–1566. [Google Scholar]
- Demchenko, A.P. Introduction to Fluorescence Sensing, 1st ed.; Springer: Heidelberg, Germany, 2008; pp. 1–6. [Google Scholar]
- Chen, X.; Sun, M.; Ma, H.M. Progress in spectroscopic probes with cleavable active bonds. Curr. Org. Chem. 2006, 10, 477–489. [Google Scholar]
- Li, X.; Gao, X.; Shi, W.; Ma, H. Design strategies for water-soluble small molecular chromogenic and fluorogenic probes. Chem. Rev. 2013. [Google Scholar] [CrossRef]
- Linder, M.C. Biochemistry of Copper; Plenum Press: New York, NY, USA, 1991; pp. 73–134. [Google Scholar]
- Ponka, P. Cellular iron metabolism. Kidney Int. 1999, 55, S2–S11. [Google Scholar]
- Wood, R.J.; Ronnenberg, A.G. Iron. In Modern Nutrition in Health and DiseaseShils, M.E., Shike, M., Ross, A.C., Caballero, B., Cousins, R.J., Eds.; 10th ed.; Lippincott Williams & Wilkins: Philadelphia, PA, USA, 2006; pp. 248–270. [Google Scholar]
- Atkins, P.; Overton, T.; Rourke, J.; Weller, M.; Armstrong, F. Inorganic Chemistry, 4th ed.; Prentice Hall: Oxford, UK, 2006; p. p. 712. [Google Scholar]
- Guo, Z.Q.; Zhu, W.H.; Tian, H. Hydrophilic copolymer bearing dicyanomethylene-4H-pyran moiety as fluorescent film sensor for Cu2+ and pyrophosphate anion. Macromolecules 2010, 43, 739–744. [Google Scholar]
- Que, E.L.; Domaille, D.W.; Chang, C.J. Metals in neurobiology: Probing their chemistry and biology with molecular imaging. Chem. Rev. 2008, 108, 1517–1549. [Google Scholar]
- Luo, W.; Ma, Y.M.; Quinn, P.J.; Hider, R.C.; Liu, Z.D. Design, synthesis and properties of novel iron(III)-specific fluorescent probes. J. Pharm. Pharmacol. 2004, 56, 529–536. [Google Scholar]
- Yao, J.; Dou, W.; Qin, W.; Liu, W. A new coumarin-based chemosensor for Fe3+ in water. Inorg. Chem. Comm. 2009, 12, 116–118. [Google Scholar]
- Chen, X.; Pradhan, T.; Wang, F.; Kim, J.S.; Yoon, J. Fluorescent chemosensors based on spiroring-opening of xanthenes and related derivatives. Chem. Rev. 2012, 112, 1910–1956. [Google Scholar]
- Zhao, Y.; Zhang, X.-B.; Han, Z.-X.; Qiao, L.; Li, C.-Y.; Jian, L.-X.; Shen, G.-L.; Yu, R.-Q. Highly sensitive and selective colorimetric and off-on fluorescent chemosensor for Cu2+ in aqueous solution and living cells. Anal. Chem. 2009, 81, 7022–7030. [Google Scholar]
- Zhao, C.; Feng, P.; Cao, J.; Wang, X.; Yang, Y.; Zhang, Y.; Zhang, J.; Zhang, Y. Borondipyrromethene-derived Cu2+ sensing chemodosimeter for fast and selective detection. Org. Biomol. Chem. 2012, 10, 3104–3109. [Google Scholar]
- Li, N.; Xiang, Y.; Tong, A.J. Highly sensitive and selective “turn-on” fluorescent chemodosimeter for Cu2+ in water via Cu2+-promoted hydrolysis of lactone moiety in coumarin. Chem. Commun. 2010, 46, 3363–3365. [Google Scholar]
- Kim, M.H.; Jang, H.H.; Yi, S.J.; Chang, S.K.; Han, M.S. Coumarin-derivative-based off–on catalytic chemodosimeter for Cu2+ ions. Chem. Commun. 2009, 45, 4838–4840. [Google Scholar]
- Lee, M.H.; Giap, T.V.; Kim, S.H.; Lee, Y.H.; Kang, C.; Kim, J.S. A novel strategy to selectively detect Fe(III) in aqueous media driven by hydrolysis of a rhodamine 6G Schiff base. Chem. Commun. 2010, 46, 1407–1409. [Google Scholar]
- Lim, N.C.; Pavlova, S.V.; Bruckner, C. Squaramide hydroxamate-based chemidosimeter responding to iron(iii) with a fluorescence intensity increase. Inorg. Chem. 2009, 48, 1173–1182. [Google Scholar]
- Benesi, H.A.; Hildebrand, J.H. A spectrophotometric investigation of the interaction of iodine with aromatic hydrocarbons. J. Am. Chem. Soc. 1949, 71, 2703–2707. [Google Scholar]
- García-Beltrán, O.; Mena, N.; Yañez, O.; Caballero, J.; Vargas, V.; Nuñez, M.T.; Cassels, B.K. Design, synthesis and cellular dynamics studies in membranes of a new coumarin-based “turn-off” fluorescent probe selective for Fe2+. Eur. J. Med. Chem. 2013, 67, 60–63. [Google Scholar]
- Brouwer, A.M. Standards for photoluminescence quantum yield measurements in solution (IUPAC Technical Report). Pure Appl. Chem. 2011, 83, 2213–2228. [Google Scholar]
- Hohenstein, E.G.; Chill, S.T.; Sherrill, C.D. Assessment of the performance of the M05–2X and M06–2X exchange-correlation functionals for noncovalent interactions in biomolecules. J. Chem. Theory Comput. 2008, 4, 1996–2000. [Google Scholar]
- Mena, N.; Bulteau, A.L.; Salazar, J.; Hirsch, E.C.; Núñez, M.T. Effect of mitochondrial complex I inhibition on Fe-S cluster protein activity. Biochem. Biophys. Res. Commun. 2011, 409, 241246. [Google Scholar]
- García-Beltrán, O.; Mena, N.; Friedrich, L.C.; Netto-Ferreira, J.C.; Vargas, V.; Quina, F.H.; Núñez, M.T.; Cassels, B.K. Design and synthesis of a new coumarin-based “turn-on” fluorescent probe selective for Cu2+. Tetrahedron Lett. 2012, 53, 5280–5283. [Google Scholar]
- Li, H.-Y.; Gao, S.; Xi, Z. A colorimetric and “turn-on” fluorescent chemosensor for Zn(II) based on coumarin Schiff-base derivative. Inorg. Chem. Commun. 2009, 12, 300–303. [Google Scholar]
- Jung, H.S.; Kwon, P.S.; Lee, J.W.; Kim, J.I.; Hong, C.S.; Kim, J.W.; Yan, S.; Lee, J.Y.; Lee, J.H.; Joo, T.; et al. Coumarin-derived Cu2+-selective fluorescence sensor: synthesis, mechanisms, and applications in living cells. J. Am. Chem. Soc. 2009, 131, 2008–2012. [Google Scholar]
- Jung, H.S.; Han, J.H.; Habata, Y.; Kang, C.; Kim, J.S. An iminocoumarin–Cu(II) ensemble-based chemodosimeter toward thiols. Chem. Commun. 2011, 47, 5142–5144. [Google Scholar]
- Chen, Z.; Wang, L.; Zou, G.; Tang, J.; Cai, X.; Teng, M.; Chen, L. Highly selective fluorescence turn-on chemosensor based on naphthalimide derivatives for detection of copper(II) ions. Spectrochim Acta A Mol. Biomol. Spectrosc. 2013, 105, 57–61. [Google Scholar]
- Reed, A.E.; Curtiss, L.A.; Weinhold, F. Intermolecular interactions from a natural bond orbital, donor-acceptor viewpoint. Chem. Rev. 1988, 88, 899–926. [Google Scholar]
- Larson, J.W.; McMahon, T.B. Gas-phase bihalide and pseudobihalide ions. An ion cyclotron resonance determination of hydrogen bond energies in XHY- species (X, Y = F, Cl, Br, CN). Inorg. Chem. 1984, 23, 2029–2033. [Google Scholar]
- Emsley, J. Very strong hydrogen bonding. Chem. Soc. Rev. 1980, 9, 91–124. [Google Scholar]
- Horobin, R.W.; Rashid-Doubell, F.; Pediani, J.D.; Milligan, G. Predicting small molecule fluorescent probe localization in living cells using QSAR modeling. 1. Overview and models for probes of structure, properties and function in single cells. Biotech. Histochem. 2013, 88, 440–460. [Google Scholar]
- Anderegg, G. Critical survey of stability constants of NTA complexes. Pure Appl. Chem. 1982, 54, 2693–2758. [Google Scholar]
| Nomenclature | |
|---|---|
| BS1 | (E)-3-((3,4-Dihydroxybenzylidene)amino)-7-hydroxy-2H-chromen-2-one |
| BS2 | (E)-3-((2,4-Dihydroxybenzylidene)amino)-7-hydroxy-2H-chromen-2-one |
| FBS | Fetal bovine serum |
| MEM-F12 | Modified Eagle Medium-F12 |
| His | Histidine |
| LMCT | Ligand to metal charge transfer |
| HEPES | (4-(2-Hydroxyethyl)-1-piperazineethanesulfonic acid) |
| NTA | Nitrilotriacetic acid |
| DMSO | Dimethyl sulfoxide |
| DMF | Dimethyl formamide |
| Fe-NTA | Nitrilotriacetic acid-Fe(III) |


| Compound | UV-Vis | Fluorescence | ||||
|---|---|---|---|---|---|---|
| λmáx (nm) | ε (M−1 cm−1) | λexc (nm) | λem (nm) | Relative Quantum Yield ( ) | Stokes' Shift (nm) | |
| BS1 | 360 | 22,830 | 340 | 458 | nd | 118 |
| BS2 | 364 | 18,600 | 364 | 437 | 0.09 | 73 |
| 3 | 336 | 12,919 | 336 | 454 | 0.44 | 118 |
nd = not determined.
| Compound | Limit of Detection (mol/L) | Limit of Quantification (mol/L) |
|---|---|---|
| BS1-Cu2+ | 1.27 × 10⁻⁴ | 4.22 × 10⁻⁴ |
| BS1-Fe3+ | 5.17 × 10⁻⁵ | 1.72 × 10⁻⁴ |
| BS2-Cu2+ | 1.04 × 10⁻⁴ | 3.45 × 10⁻⁴ |
| BS2-Fe3+ | 4.87 × 10⁻⁵ | 1.62 × 10⁻⁴ |
| 3-Cu2+ | 5.41 × 10⁻⁵ | 1.80 × 10⁻⁴ |
| 3-Fe3+ | 5.03 × 10⁻⁵ | 1.68 × 10⁻⁴ |
| Reaction | Dihedral Angle | ΔG*1 kcal/mol | ΔG*2 kcal/mol |
|---|---|---|---|
| BS1 | 44.22° | 51.03 | 36.42 |
| BS2 | 41.03° | 52.84 | 37.15 |
© 2014 by the authors; licensee MDPI, Basel, Switzerland. This article is an open access article distributed under the terms and conditions of the Creative Commons Attribution license (http://creativecommons.org/licenses/by/3.0/).
Share and Cite
García-Beltrán, O.; Cassels, B.K.; Pérez, C.; Mena, N.; Núñez, M.T.; Martínez, N.P.; Pavez, P.; Aliaga, M.E. Coumarin-Based Fluorescent Probes for Dual Recognition of Copper(II) and Iron(III) Ions and Their Application in Bio-Imaging. Sensors 2014, 14, 1358-1371. https://doi.org/10.3390/s140101358
García-Beltrán O, Cassels BK, Pérez C, Mena N, Núñez MT, Martínez NP, Pavez P, Aliaga ME. Coumarin-Based Fluorescent Probes for Dual Recognition of Copper(II) and Iron(III) Ions and Their Application in Bio-Imaging. Sensors. 2014; 14(1):1358-1371. https://doi.org/10.3390/s140101358
Chicago/Turabian StyleGarcía-Beltrán, Olimpo, Bruce K. Cassels, Claudio Pérez, Natalia Mena, Marco T. Núñez, Natalia P. Martínez, Paulina Pavez, and Margarita E. Aliaga. 2014. "Coumarin-Based Fluorescent Probes for Dual Recognition of Copper(II) and Iron(III) Ions and Their Application in Bio-Imaging" Sensors 14, no. 1: 1358-1371. https://doi.org/10.3390/s140101358
APA StyleGarcía-Beltrán, O., Cassels, B. K., Pérez, C., Mena, N., Núñez, M. T., Martínez, N. P., Pavez, P., & Aliaga, M. E. (2014). Coumarin-Based Fluorescent Probes for Dual Recognition of Copper(II) and Iron(III) Ions and Their Application in Bio-Imaging. Sensors, 14(1), 1358-1371. https://doi.org/10.3390/s140101358