The Coefficient of the Voltage Induced Frequency Shift Measurement on a Quartz Tuning Fork

Abstract
: We have measured the coefficient of the voltage induced frequency shift (VIFS) of a 32.768 KHz quartz tuning fork. Three vibration modes were studied: one prong oscillating, two prongs oscillating in the same direction, and two prongs oscillating in opposite directions. They all showed a parabolic dependence of the eigen-frequency shift on the bias voltage applied across the fork, due to the voltage-induced internal stress, which varies as the fork oscillates. The average coefficient of the VIFS effect is as low as several hundred nano-Hz per millivolt, implying that fast-response voltage-controlled oscillators and phase-locked loops with nano-Hz resolution can be built.1. Introduction
The piezoelectric (PE) effect (including the reverse PE effect) refers to the approximately linear response of the mechanical and electrical mutual interactions in crystalline materials that lack inversion symmetry [1]. The importance of the PE effect is well known. One famous application utilizes the dimension change of the PE material under applied voltage to produce voltage controlled motion or positioning in real space. We can therefore call this type of PE effect the space domain PE effect. Its application examples are nano-positioners [2,3], piezoelectric motors [4–6], precise focusing of modern optical assemblies [7,8] and atomically and sub-atomically resolved scanning probe microscopes [9–16], etc. An obvious reason for these important applications is that the coefficient of the PE deformation is very low, around 0.1 micrometers per volt (or 1 Å per millivolt), providing very precise yet fast enough control of displacement.
Another particularly important application of the PE effect is the precise measurement of time, which exploits the ultrahigh stability of the eigen-frequency of a PE oscillator. We call this type of PE effect the frequency domain PE effect. Examples include quartz tuning forks in watches, crystal oscillators in computers, quartz crystal microbalances [17–20], voltage controlled oscillators (VCO), phase lock loops (PLL) [21], and cantilever excitors of atomic force microscopes [22–26]. However, the precise control or adjustment of the eigen-frequency of a PE oscillator is always an issue. The VCO's frequency shift is typically adjusted by an external capacitor whose capacitance is changed by the applied voltage on it. In this manner, the frequency stability is reduced and a high adjustment precision cannot be provided. For example, a 3.3 V voltage control crystal oscillator (VCXO) has a total pull range of 250 ppm and its initial frequency accuracy is typically within ±10 ppm [27], as the center frequency of the VCXO is usually several million hertz or even higher, it is not precise enough to be used for frequency measurements. Adding mass to the oscillator also can adjust the frequency shift, but this is not a controllable method. Zhou et al. have reported that the stress applied on a constrained quartz plate by a piezo-electric/piezo-magnetic ceramic plate can cause a very small frequency shift [28]. The frequency shift is of the order of 10−5 when the applied electric field is of the order of 100 V/mm or the magnetic field is of the order of 10 A/mm. This effect is small enough to be used in precise frequency control and measurement. However, the device is complicated since it uses an external piezo-electric/piezo-magnetic ceramic plate to control the stress.
Thus, a small voltage-induced frequency shift effect of the PE materials with simpler structures is urgently demanded in precise frequency control and measurement areas. This frequency domain PE effect could be as important as the space domain PE effect mentioned above, but nevertheless it has not been reported before.
Recently, quartz tuning forks (QTF) have been widely used as force sensors in scanning probe microscopes such as the atomic force microscope (AFM) and magnetic force microscope [29–31], in which the frequency shift of the QTFs is detected to measure the interaction between tip and sample.
In this paper, we will show that the frequency shift of a QTF can be controlled by a bias voltage applied on it, and the coefficient of this voltage induced frequency shift (VIFS) will be reported. The coefficient was found to be smaller than 1 mHz per volt (or sub micro-Hertz per millivolt). This extremely low value implies its immediate important applications in the high precision versions of VCO and PLL. Other possible applications include: a precise frequency sweeper, adjustable timing devices, and microbalances.
2. Experimental Setup
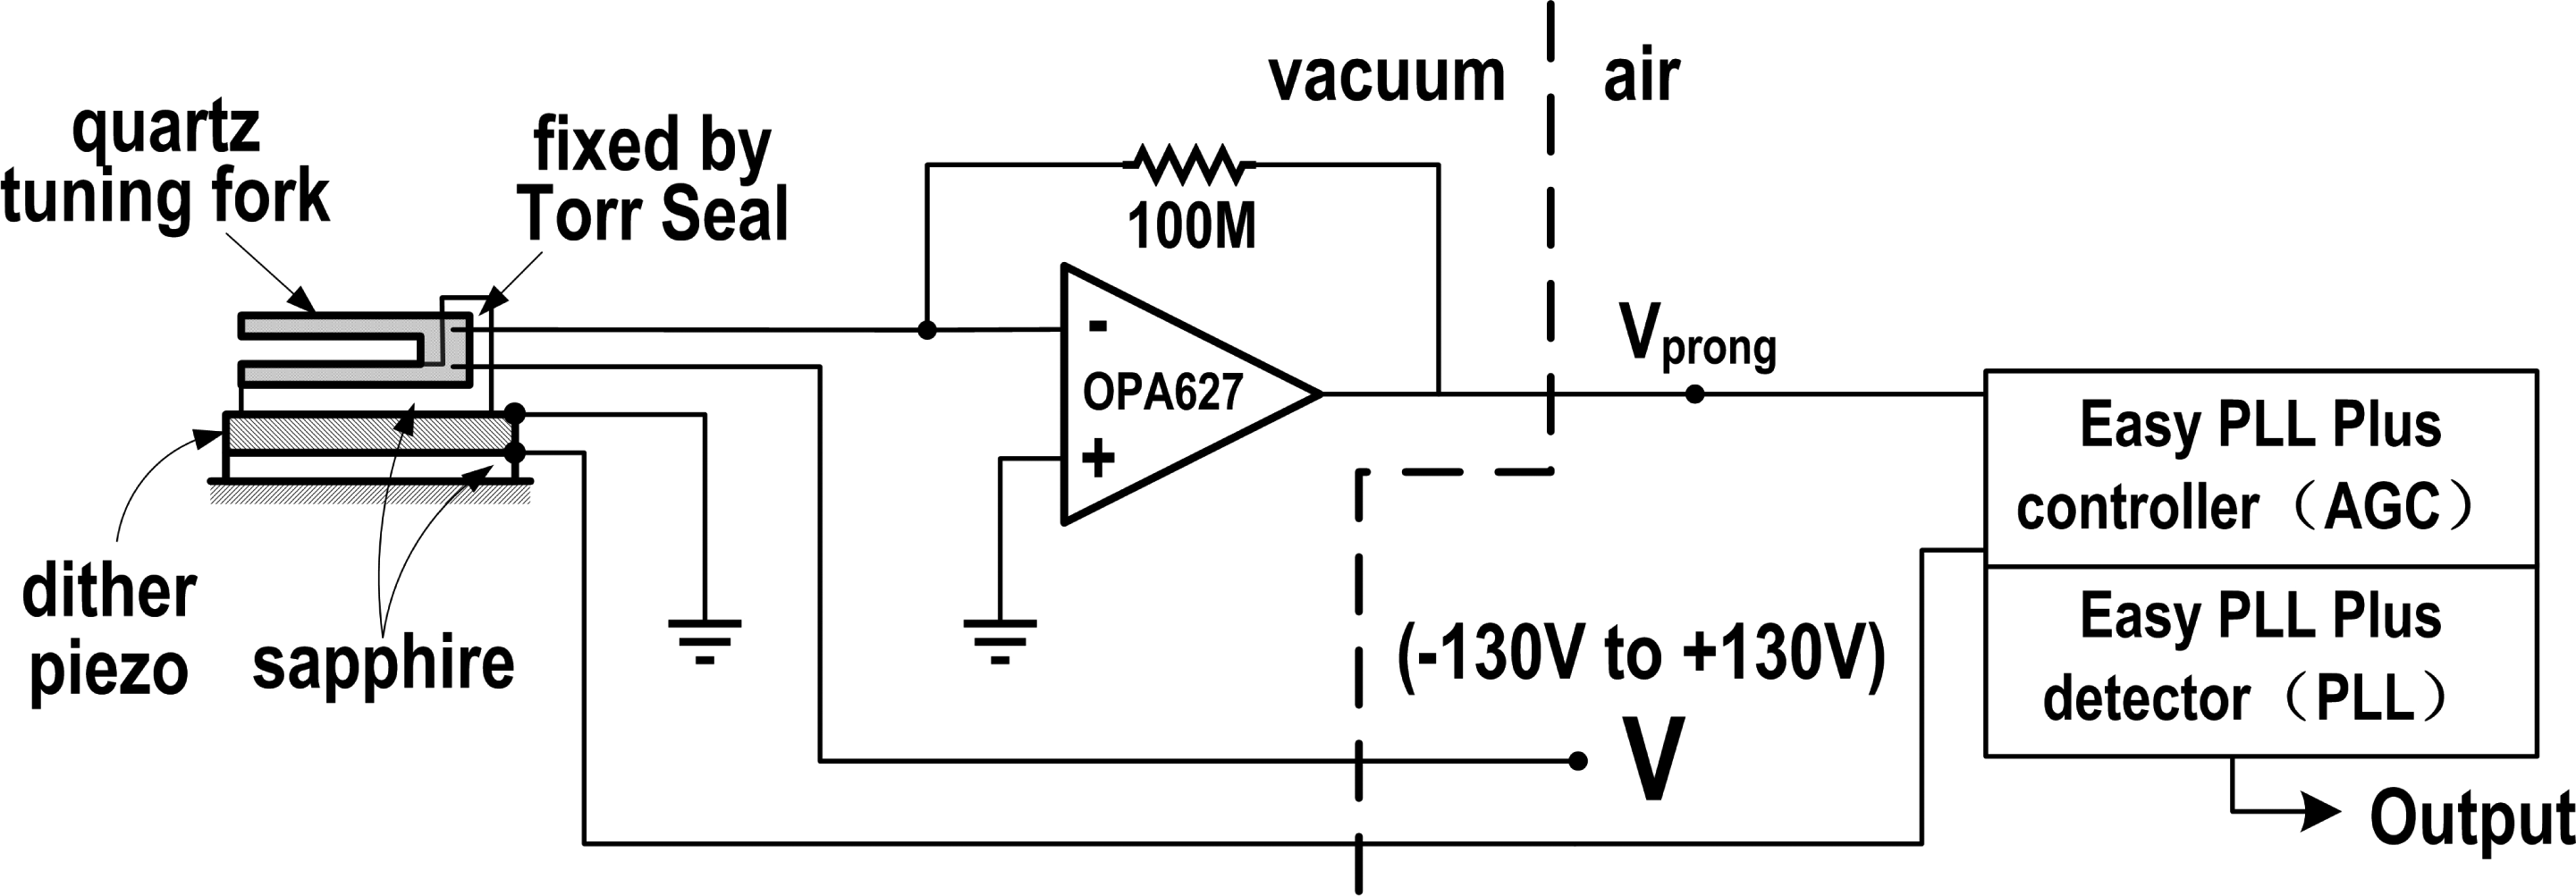
Figure 1 shows the schematic diagram of the setup employed to measure the coefficient of the VIFS. One prong of the QTF (type E158 from Nanosurf AG, Liestal, Switzerland) was glued with Torr Seal on an L-shaped sapphire piece, which was in turn mounted by the same glue on a dither piezo plate. This type of QTF with one prong being fixed is often called qPlus QTF [31–33]. Another sapphire piece was sandwiched between the dither piezo and the base of the apparatus for good isolation. The oscillation details of the free prong of the QTF were measured by a current to voltage converter consisting of a 100 MOhm feedback resistor wired across an OPA627 operational amplifier (Texas Instruments, Dallas, TX, USA) with its input connected to the corresponding lead of the QTF [34]. When the free prong oscillates, the charge on it (due to the space domain PE effect) will change. The resultant current was converted into a voltage signal, Vprong, by the preamp and then connected back to the driving dither piezo via an automatic gain control, AGC, inside a commercial Easy PLL Plus controller by Nanosurf to form a closed loop oscillation circuit. The purpose of the AGC was to maintain constant oscillation amplitude.
A bias voltage (−130 to +130 V manually adjustable, generated from an SPM100 scanning probe microscope controller, RHK, Troy, MI, USA) was applied to the QTF between the virtual ground of the preamp and the remaining lead of the QTF. The oscillation loop ensured that the oscillation frequency tracked the QTF's instant eigen-frequency, so that we could measure the QTF's dynamic eigen-frequency and how it changed by measuring the oscillation frequency of the circuit loop with a PLL (Nanosurf Easy PLL Plus).
In the setup described above, only one prong of the QTF can oscillate. We can also vibrate both prongs in the same direction by using the dither piezo to vibrate the portion of the QTF where the two prongs join (i.e., by mounting the joint on the dither piezo, not any of the prongs). This type of the mounted QTF is hereafter called in-phase QTF for simplicity. There is also the third vibration mode in which both prongs vibrate in the opposite direction (hereafter called anti-phase QTF). To this end, the setup is similar to that of the in-phase QTF except that the dither piezo is removed and the oscillation driving signal is connected to the non-inverting input of the preamp (the joint of the prongs is fixed on the base). In the work reported here, the qPlus, in-phase and anti-phase vibration modes were all studied and compared.
3. Results and Theoretical Explanation
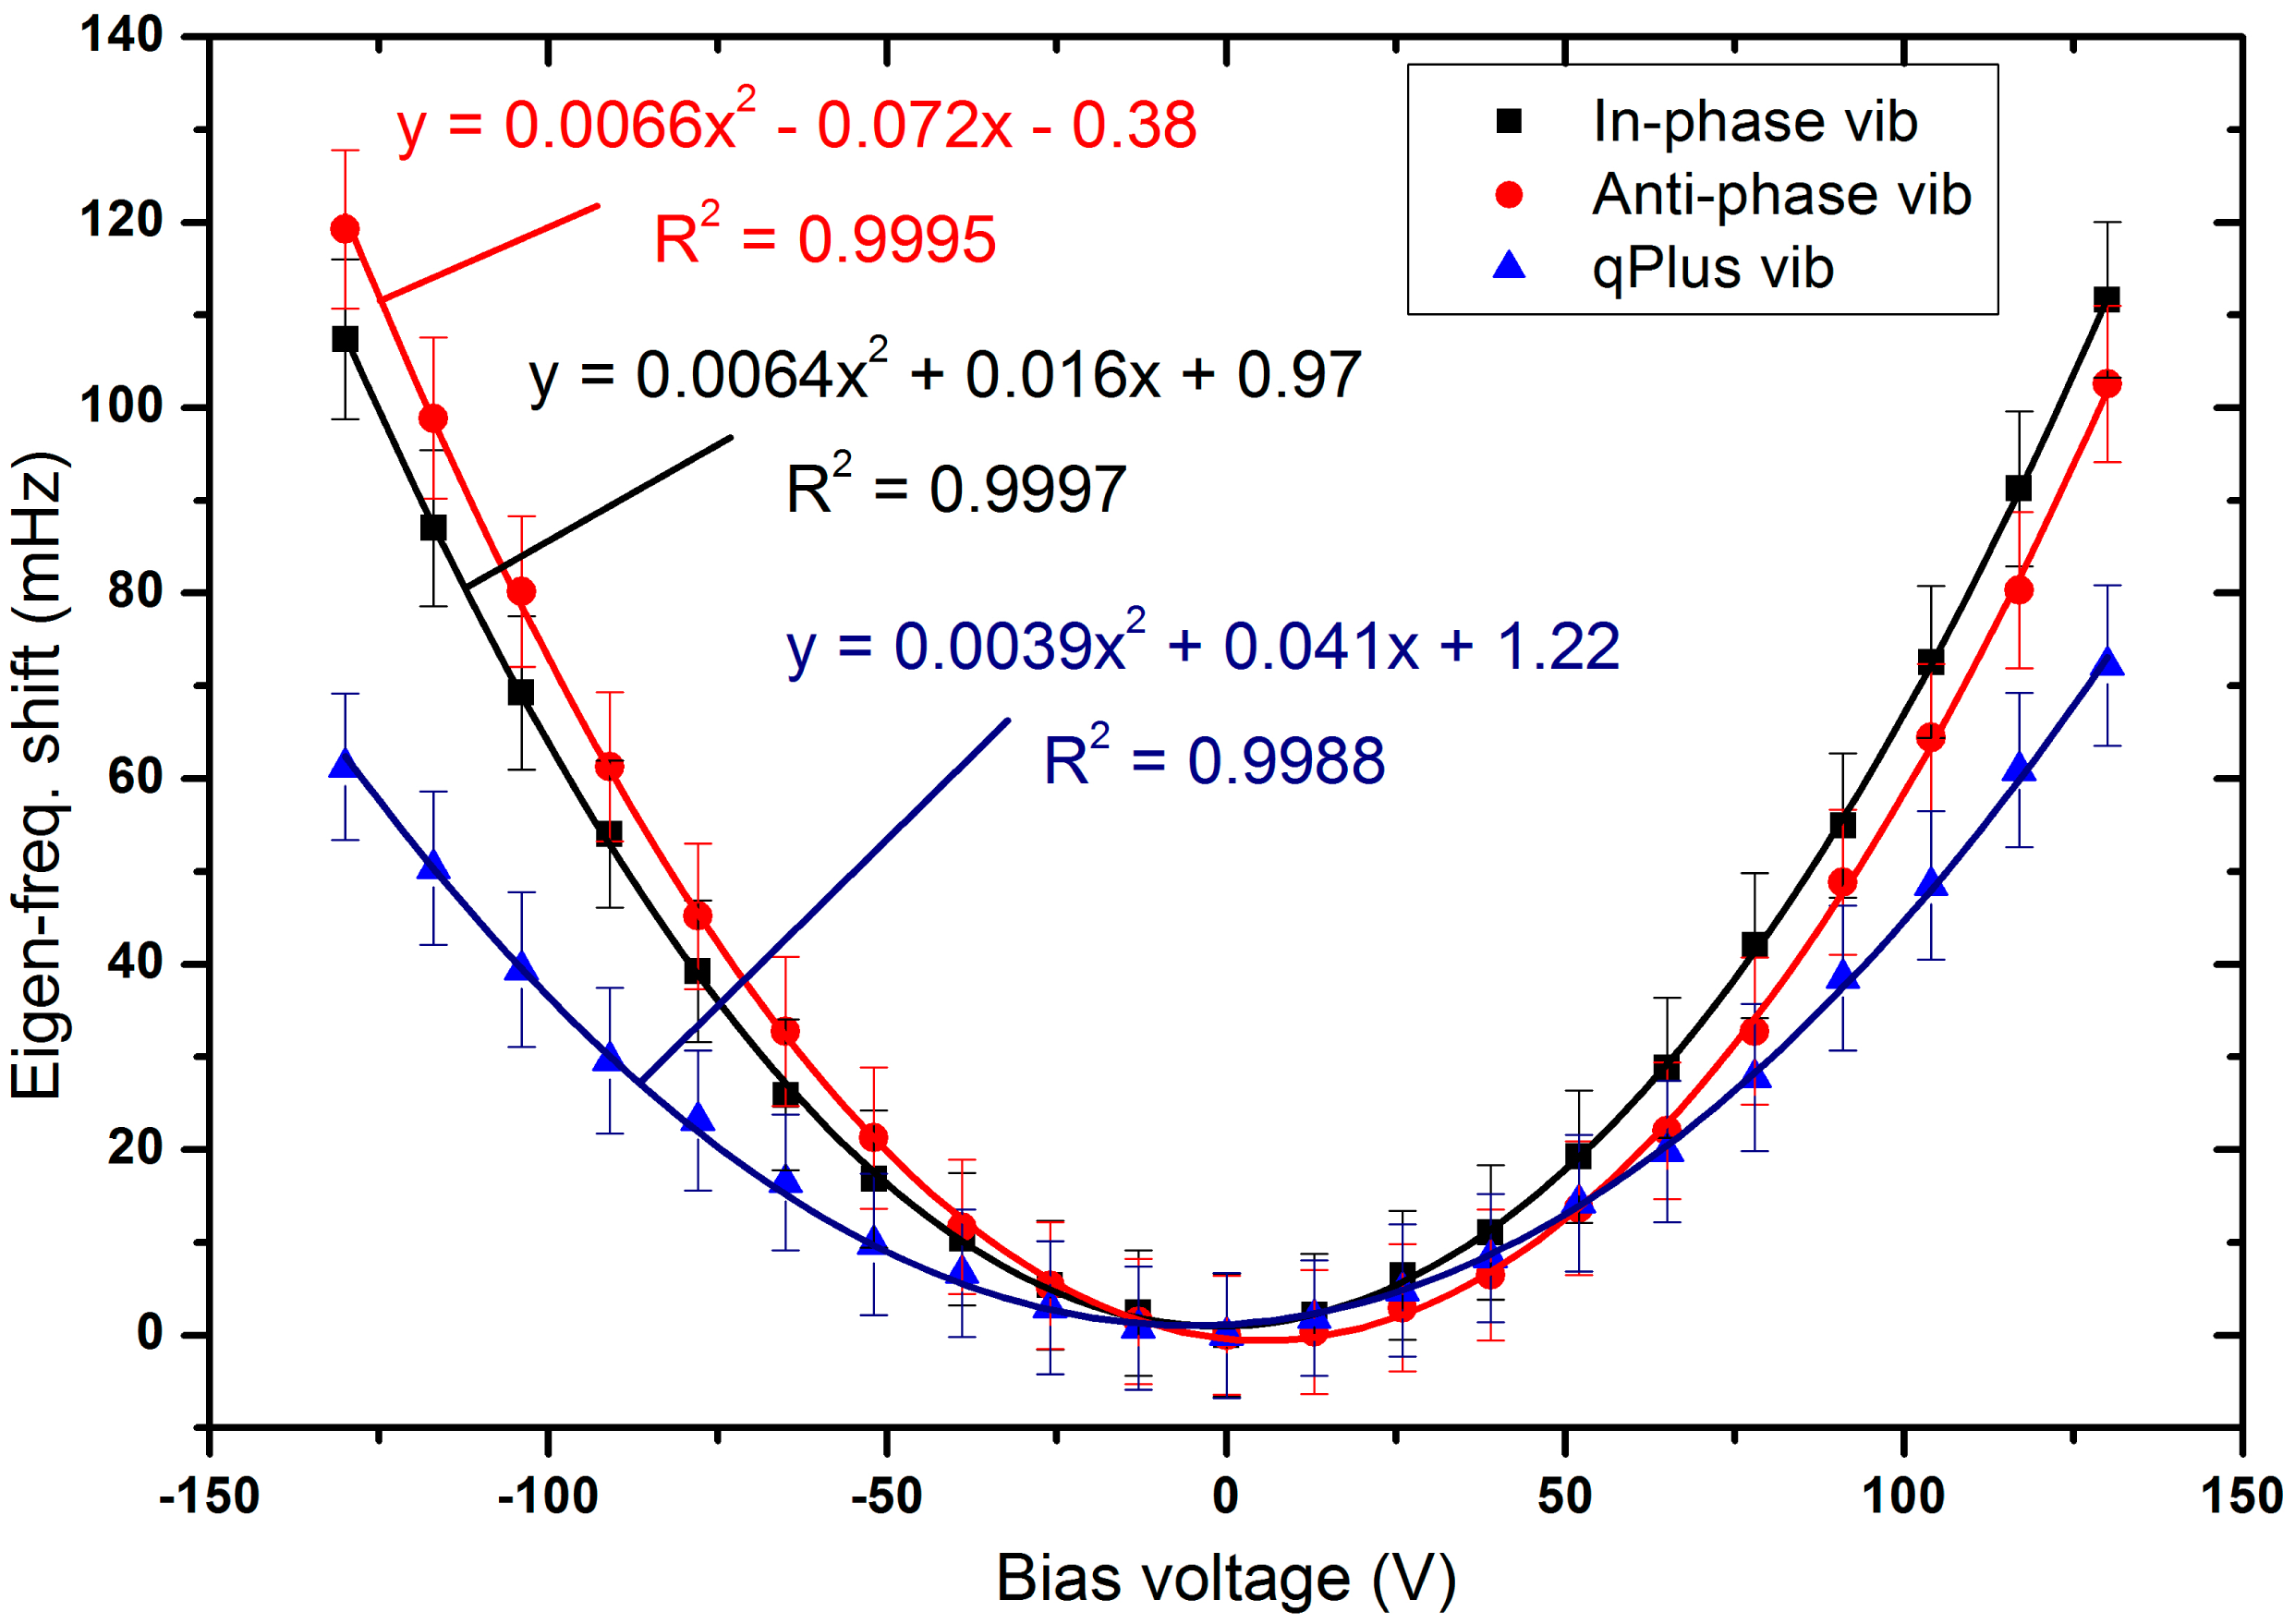
The measured dependences of the eigen-frequency shifts of the qPlus, in-phase and anti-phase QTF on the bias voltage applied to the QTF are shown in Figure 2. Each is excellently fit by a quadratic function. The fitted parabolic curves approximately pass through the origin, so they can be written in the form y = ax2 with a = 0.0039, 0.0066, and 0.0064 mHz/V2, respectively. Since the eigen-frequency shift is not linearly dependent on the bias voltage, the VIFS coefficient is not a constant. Nevertheless, we can still discuss its average VIFS coefficient defined as the eigen-frequency change divided by the bias voltage change.
The average VIFS coefficients were extremely low and were 470, 917 and 826 nano-Hz per millivolt for the qPlus, in-phase and anti-phase QTFs, respectively, implying that the most precise nano-Hz resolution VCOs and PLLs can be built based on the VIFS effect.
To check the repeatability of the VIFS of the three QTF modes, we mechanically switched the bias voltages on the three types of QTF repeatedly between 0 V and +130 V and watched the output signals of the Easy PLL Plus. It turned out that they all looked similar. As an example, the step response of the anti-phase QTF is shown in Figure 3a. The big fluctuations between high and low outputs are apparently due to the mechanical switching. Figure 3b is the Gaussian distributions of the data (the data of the big fluctuations due to the mechanical switching were removed). It shows that the data with bias voltages of 0 V and +130 V separated completely. The center values of the frequency shifts at low and high bias voltages are both very close, implying the excellent repeatability. All the experiments were done in low vacuum and room temperature.
The resonance curve for the qPlus QTF is shown in Figure 4. It is rather symmetric. The curves are a little skewed for the in-phase and anti-phase QTFs. The Q values are all above 3000, which is typical for QTFs in low vacuum and room temperature, showing that the QTFs were functioning well.
To explain why the VIFS effect can happen, we notice that applying a bias voltage V on the QTF will produce an electrostatic force on the QTF just as applying a voltage on a capacitor will exert an electrostatic force on the dielectric. This force FV is given by:
The Young's modulus of quartz is 7.87×10¹¹N/m2 [29], which is large, meaning that the change of d under V is small. The change of d due to x is also small. Therefore, d(V,x) can be expanded in a Taylor series, and F1 can be re-written as:
Note that V is a constant which is determined by the voltage source. Any terms that do not vary with x should not cause the force constant (and of course the eigen-frequency) of the QTF to change. Thus, the dynamic force constant becomes k0+C3βV2. The dynamic resonant frequency becomes:
4. Conclusions
In summary, we have measured the VIFS effect on three vibration modes of the QTFs. Owing to the voltage-induced internal stress, which varies as the fork oscillates, the eigen-frequency shifts in term of a parabolic function of the voltage applied on the QTFs. Since the time domain VIFS effect and the space domain PE effect have the same cause, they will have the same response time. The average coefficient of the VIFS is very small (several hundred nano-Hz per millivolt). From this, we expect that the most precise (nano-Hz) yet fast-responding voltage-controlled oscillators and phase-locked loops can be built.
Acknowledgments
This work was supported by the National Natural Science Foundation of China (Grant No. 11204306, 11374278, and U1232210), the project of Chinese National High Magnetic Field Facilities and the Fundamental Research Funds for the Central Universities (Program No. WK2340000035).
Author Contributions
Yubin Hou and Qingyou Lu conceived and designed the experiments; Yubin Hou performed the experiments; all of them analyzed the data and prepared the manuscript.
Conflicts of Interest
The authors declare no conflict of interest.
References
- Gautschi, G. Piezoelectric Sensorics: Force, Strain, Pressure, Acceleration and Acoustic Emission Sensors, Materials and Amplifiers, 1st ed.; Springer Verlag: Berlin/Heidelberg, Germany, 2002; p. 5. [Google Scholar]
- Yong, Y.K.; Fleming, A.J.; Moheimani, S.O.R. A novel piezoelectric strain sensor for simultaneous damping and tracking control of a high-speed nanopositioner. IEEE/ASME Trans. Mechatron. 2013, 18, 1113–1121. [Google Scholar]
- Shim, J.-Y.; Gweon, D.-G. Piezo-driven metrological multiaxis nanopositioner. Rev. Sci. Instrum. 2002, 72, 4183–4187. [Google Scholar]
- Wang, Q.; Lu, Q. A simple, compact, and rigid piezoelectric step motor with large step size. Rev. Sci. Instrum. 2009, 80, 085104. [Google Scholar]
- Renner, C.; Niedermann, P.; Kent, A.D. A vertical piezoelectric inertial slider. Rev. Sci. Instrum. 1990, 61, 965–967. [Google Scholar]
- Frohn, J.; Wolf, J.F.; Bescoke, K.; Teske, M. Coarse tip distance adjustment and positioner for a scanning tunneling microscope. Rev. Sci. Instrum. 1989, 60, 1200–1201. [Google Scholar]
- Ko, H.-P.; Jeong, H.; Koc, B. Piezoelectric actuator for mobile auto focus camera applications. J. Elecroceram 2009, 23, 530–535. [Google Scholar]
- Lanni, F. Feedback stabilized focal plane control for light microscopes. Rev. Sci. Instrum. 1993, 64, 1474–1477. [Google Scholar]
- Pan, S.H.; Hudson, E.W.; Davis, J.C. 3He refrigerator based very low temperature scanning tunneling microscope. Rev. Sci. Instrum. 1999, 70, 1459–1462. [Google Scholar]
- Hou, Y.; Wang, J.; Lu, Q. All low voltage lateral junction scanning tunneling microscope with very high precision and stability. Rev. Sci. Instrum. 2008, 79, 113707. [Google Scholar]
- Giessibl, F.J. Atomic resolution on Si(111)-(7×7) by noncontact atomic force microscopy with a force sensor based on a quartz tuning fork. Appl. Phys. Lett. 2000, 76, 1470–1472. [Google Scholar]
- Giessibl, F.J.; Hembacher, S.; Bielefeldt, H.; Mannhart, J. Subatomic Features on the Silicon(111)-(7×7) Surface Observed by Atomic Force Microscopy. Science 2000, 289, 422–425. [Google Scholar]
- Albers, B.J.; Liebmann, M.; Schwendemann, T.C.; Baykara, M.Z.; Heyde, M.; Salmeron, M.; Altman, E.I.; Schwarz, U.D. Combined low-temperature scanning tunneling/atomic force microscope for atomic resolution imaging and site-specific force spectroscopy. Rev. Sci. Instrum. 2008, 79, 033704. [Google Scholar]
- Hug, H.J.; Stiefel, B.; van Schendel, P.J.A.; Moser, A.; Martin, S.; Güntherodt, H.-J. A low temperature ultrahigh vaccum scanning force microscope. Rev. Sci. Instrum. 1999, 70, 3625–3640. [Google Scholar]
- Pertaya, N.; Braun, K.-F.; Rieder, K.-H. On the stability of Besocke-type scanners. Rev. Sci. Instrum. 2004, 75, 2608–2612. [Google Scholar]
- Arai, T.; Tomitori, M. Observation of Electronic States on Si(111)-(7×7) through Short-Range Attractive Force with Noncontact Atomic Force Spectroscopy. Phys. Rev. Lett. 2004, 93, 256101. [Google Scholar]
- Lucklum, R.; Henning, B.; Hauptmann, P.; Schierbaum, K.D.; Vaihinger, S.; Göpel, W. Quartz microbalance sensors for gas detection. Sens. Actuators A Phys. 1991, 27, 705–710. [Google Scholar]
- Soares, D.M. A quartz microbalance with the capability of viscoelasticity measurements for in situ electrochemical investigations. Meas. Sci. Technol. 1993, 4, 549–553. [Google Scholar]
- Herrmann, U.; Jonischkeit, T.; Bargon, J.; Hahn, U.; Li, Q.Y.; Schalley, C.A.; Vogel, E.; Vögtle, F. Monitoring apple flavor by use of quartz microbalances. Anal. Bioanal. Chem. 2002, 372, 611–614. [Google Scholar]
- Pennazza, G.; Marchetti, E.; Santonico, M.; Mantini, G.; Mummolo, S.; Marzo, G.; Paolesse, R.; D'Amico, A.; di Natale, C. Application of a quartz microbalance based gas sensor array for the study of halitosis. J. Breath Res. 2008, 2, 017009. [Google Scholar]
- Kobayashi, K.; Yamada, H.; Itoh, H.; Horiuchi, T.; Matsushige, K. Analog frequency modulation detector for dynamic force microscopy. Rev. Sci. Instrum. 2001, 72, 4383–4387. [Google Scholar]
- Khan, Z.; Leung, C.; Tahir, B.A.; Hoogenboom, B.W. Digitally tunable, wide-band amplitude, phase, and frequency detection for atomic-resolution scanning force microscopy. Rev. Sci. Instrum. 2010, 81, 073704. [Google Scholar]
- Fukuma, T.; Kimura, M.; Kobayashi, K.; Matsushige, K.; Yamada, H. Development of low noise cantilever deflection sensor for multienvironment frequency-modulation atomic force microscopy. Rev. Sci. Instrum. 2005, 76, 053704. [Google Scholar]
- An, T.; Nishio, T.; Eguchi, T.; Ono, M.; Nomura, A.; Akiyama, K.; Hasegawa, Y. Atomically resolved imaging by low-temperature frequency-modulation atomic force microscopy using a quartz length-extension resonator. Rev. Sci. Instrum. 2008, 79, 033703. [Google Scholar]
- Fukuma, T.; Kilpatrick, J.I.; Jarvis, S.P. Phase modulation atomic force microscope with true atomic resolution. Rev. Sci. Instrum. 2006, 77, 123703. [Google Scholar]
- Rasool, H.I.; Wilkinson, P.R.; Stieg, A.Z.; Gimzewski, J.K. A low noise all-fiber interferometer for high resolution frequency modulated atomic force microscopy imaging in liquids. Rev. Sci. Instrum. 2001, 81, 023703. [Google Scholar]
- VCXO Tuning Slope (Kv), Stability, and Absolute Pull Range (APR). Available online: http://www.silabs.com/support=20documents/technicaldocs/an266.pdf (accessed on 19 November 2014).
- Zhou, Y.; Chen, W.; Yang, J.; Du, J. Thickness-shear vibration of a quartz plate connected to piezoelectric plates and electric field sensing. Ultrasonics 2011, 51, 131–135. [Google Scholar]
- Karrai, K. Lecture Notes on Shear and Friction Force Detection with Quartz Tuning Forks; Center for NanoScience: Munchen, Germany, 2000. [Google Scholar]
- Tung, R.C.; Wutscher, T.; Martinez-Martin, D.; Reifenberger, R.G.; Giessibl, F.; Raman, A. Higher-order eigenmodes of qPlus sensors for high resolution dynamic atomic force microscopy. J. Appl. Phys. 2010, 107, 104508. [Google Scholar]
- Schneiderbauer, M.; Wastl, D.; Giessibl, F.J. qPlus magnetic force microscopy in frequency-modulation mode with millihertz resolution. Beilstein J. Nanotechnol. 2012, 3, 174–178. [Google Scholar]
- Giessibl, F.J. High-speed force sensor for force microscopy and profilometry utilizing a quartz tuning fork. Appl. Phys. Lett. 1998, 73, 3956–3958. [Google Scholar]
- Berger, J.; Švec, M.; Müller, M.; Ledinský, M.; Fejfar, A.; Jelínek, P.; Majzik, Z. Characterization of the mechanical properties of qPlus sensors. Beilstein J. Nanotechnol. 2014, 4, 1–9. [Google Scholar]
- Hembacher, S.; Giessibl, F.J.; Mannhart, J. Evaluation of a force sensor based on a quartz tuning fork for operation at low temperatures and ultrahigh vacuum. Appl. Surf. Sci. 2002, 188, 445–449. [Google Scholar]


© 2014 by the authors; licensee MDPI, Basel, Switzerland. This article is an open access article distributed under the terms and conditions of the Creative Commons Attribution license ( http://creativecommons.org/licenses/by/4.0/).
Share and Cite
Hou, Y.; Lu, Q. The Coefficient of the Voltage Induced Frequency Shift Measurement on a Quartz Tuning Fork. Sensors 2014, 14, 21941-21949. https://doi.org/10.3390/s141121941
Hou Y, Lu Q. The Coefficient of the Voltage Induced Frequency Shift Measurement on a Quartz Tuning Fork. Sensors. 2014; 14(11):21941-21949. https://doi.org/10.3390/s141121941
Chicago/Turabian StyleHou, Yubin, and Qingyou Lu. 2014. "The Coefficient of the Voltage Induced Frequency Shift Measurement on a Quartz Tuning Fork" Sensors 14, no. 11: 21941-21949. https://doi.org/10.3390/s141121941