Measurement of the D/H, 18O/16O, and 17O/16O Isotope Ratios in Water by Laser Absorption Spectroscopy at 2.73 ?m


 ,
,
Abstract
: A compact isotope ratio laser spectrometry (IRLS) instrument was developed for simultaneous measurements of the D/H, 18O/16O and 17O/16O isotope ratios in water by laser absorption spectroscopy at 2.73 μm. Special attention is paid to the spectral data processing and implementation of a Kalman adaptive filtering to improve the measurement precision. Reduction of up to 3-fold in standard deviation in isotope ratio determination was obtained by the use of a Fourier filtering to remove undulation structure from spectrum baseline. Application of Kalman filtering enables isotope ratio measurement at 1 s time intervals with a precision (<1‰) better than that obtained by conventional 30 s averaging, while maintaining a fast system response. The implementation of the filter is described in detail and its effects on the accuracy and the precision of the isotope ratio measurements are investigated.1. Introduction
The stable isotopes of water (in the vapor or liquid phase) are powerful tracers for the study of the hydrological cycle, climate change, ecological process and paleoclimatic archives (see, e.g., [1–4]), as well as for biomedicine [5]. Analysis of the stable isotope abundance has been the domain of stable isotope ratio mass spectrometry (IRMS), which generally achieves a very high precision, but IRMS is incompatible with condensable gases like water. In the case of water isotopologue analysis, reduction of water to H2 and equilibration with CO2 is commonly used for the determination of the 2H (or D) and 18O isotope ratios [6,7]. In addition, as the 17O12C16O and 16O13C16O molecules appear in the same mass channel, accurate and direct determination of the isotope ratio H217O/H216O is practically impossible. This ratio is usually inferred from the natural relation between the 17O and 18O abundance ratios [8] or determined on O2 after fluorination of the water sample [9]. No reliable high precision mass spectrometric method is available for direct isotopic analysis of water. Moreover, since the equipment is quite bulky it cannot be used in the field and is generally incapable of performing real-time measurements.
Measurements of the stable isotope ratio by optical spectroscopy, in particular by laser absorption spectroscopy (LAS), have attracted a growing interest in recent years [10,11]. Laser spectroscopy provides an excellent opportunity to perform in situ real-time continuous measurements without requiring chemical conversion. Nowadays isotope ratio laser spectrometry (IRLS) becomes a serious competitor to IRMS. Water isotope spectrometers operating in the near infrared around 1.4 μm [12–14], in the mid infrared at 2.7 μm [15,16] and 6.7 μm [17,18] have been developed. Cavity enhanced spectroscopy approaches have been implemented for achieving high sensitivity and high precision [18–20]. High precision IRLS instruments are now commercially available from LGR Inc. (Mountain View, CA, USA) (using off-axis Integrated Cavity Output Spectroscopy, known as OA-ICOS) [21–23] and from Picarro Inc. (Santa Clara, CA, USA) (using Cavity Ring Down Spectroscopy—CRDS) [24–27].
In this paper, we report on the development of a compact IRLS instrument for simultaneous real-time measurements of the D/H, 18O/16O and 17O/16O isotope ratios in water by laser absorption spectroscopy at 2.73 μm. The 2.7 μm fundamental stretching mode is about one order of magnitude stronger than the band at 1.4 μm, and even the bending mode near 6.7 μm is not much stronger than that the 2.7 μm band. More important is that the selected absorption lines at 2.73 μm for measurements of water isotopologues (H218O, H216O, H217O and HDO) may have relatively similar line strengths and similar ground state energies (Table 1). Recently available, commercial 2.73 μm distributed feed-back (DFB) lasers offer the following advantages compared to a color center laser previously used for water isotopologue measurement [15]: single mode and single frequency emission at room temperature, high electronic bandwidth (as high as kilohertz repetition rates), in combination with compactness (mounted inside a TO-8 package) and cost-effectiveness [16].
In the present work, special attention is paid to the spectral data processing by use of digital filtering techniques to improve the measurement precision. Oscillatory structure on spectrum baseline affecting the measurement precision was analyzed. Fourier analysis of spectral residuals resulting from a fit was performed, which enabled the identification and filtering of the noise in spectral signals with the help of Fourier filter. The paper also provides a detailed description of Kalman filtering of the data, as recently introduced by us to the field of isotope ratio measurements [28]. We demonstrate that a faster temporal response (1 s) can be achieved by Kalman filtering with a precision better than that obtained by conventional 30 s averaging. Effects of Kalman filtering on the accuracy and the precision of the isotope ratio measurements are also studied in the present work.
2. Experimental Consideration
2.1. Isotopic Composition Analysis by Laser Absorption Spectroscopy
According to the Beer-Lambert law of linear absorption, the absorbance A(v) can be related to the transmitted light I(v) and incident intensity I0(v) intensities:
The isotope ratio can thus be determined from the ratio of the integrated areas AI and the absorption line intensities S of the major and minor isotopic components:
The relative deviation of the isotope ratio in water with respect to the international standard reference known as Vienna Standard Mean Ocean Water (VSMOW), is expressed in terms of the δ-value:
In the present work, the laser instrument was calibrated against the working standards GS-49 (δ18O = 0.39‰, δ17O = 0.21‰, and δ2H = 1.7‰, with respect to VSMOW, determined by repeated IRMS analyses at the Center for Isotope Research of the University of Groningen). The accuracy of the laser instrument was evaluated by measurement of another working standard GS-42 with different isotopic composition (δ18O = −24.62‰, δ17O = −13.1‰, and δ2H = −187.7‰). Bottled water (Vittel, France) was used as unknown sample material.
2.2. Selection of the Absorption Lines
Selection of suitable absorption lines for water isotopic ratio measurements is one of the most important aspects in instrumental design since the choice of absorption lines has a direct impact on the instrumental performance in terms of measurement sensitivity, precision and selectivity.
Measurements of the isotopic ratios δ18O, δ17O, δ2H of the stable isotopologues of water require probing of absorption lines of the four isotopologues H218O, H216O, H217O and HDO within the laser tuning range. It is very desirable that the used absorption lines exhibit similar absorption depths at natural abundance with an absorption intensity as large as possible (for high sensitivity and high precision measurements), are free from interference from the same or other species (high selectivity consideration), and have similar ground state energy (in order to minimize the effects of temperature-dependent line intensities). The spectral region near 2.73 μm, covered by recently commercially available DFB lasers, meets these requirements to a high degree. Parameters of the four molecular lines selected in the present work are summarized in Table 1. Parameters of the previously used lines at 1.4 μm and 6.7 μm are also given for comparison.
The line absorption strength depends on the population of the ground state level and this population in turn depends on the temperature. Temperature drift during measurements may introduce a systematic error in the isotope ratio determination. The temperature coefficients defined as ΔS/S(T0) for the selected lines are listed in Table 1. A thermal drift of 1 K would lead to a relative variation in the line strength of +1.5‰, +4.6‰, −1.4‰, −3.4‰ for the selected lines of H18OH, H16OH, H17OH and H16OD respectively. Therefore, realization of a temperature stability better than 0.1 K is essential for high precision measurements.
3. Experimental description
3.1. Experimental Set-Up
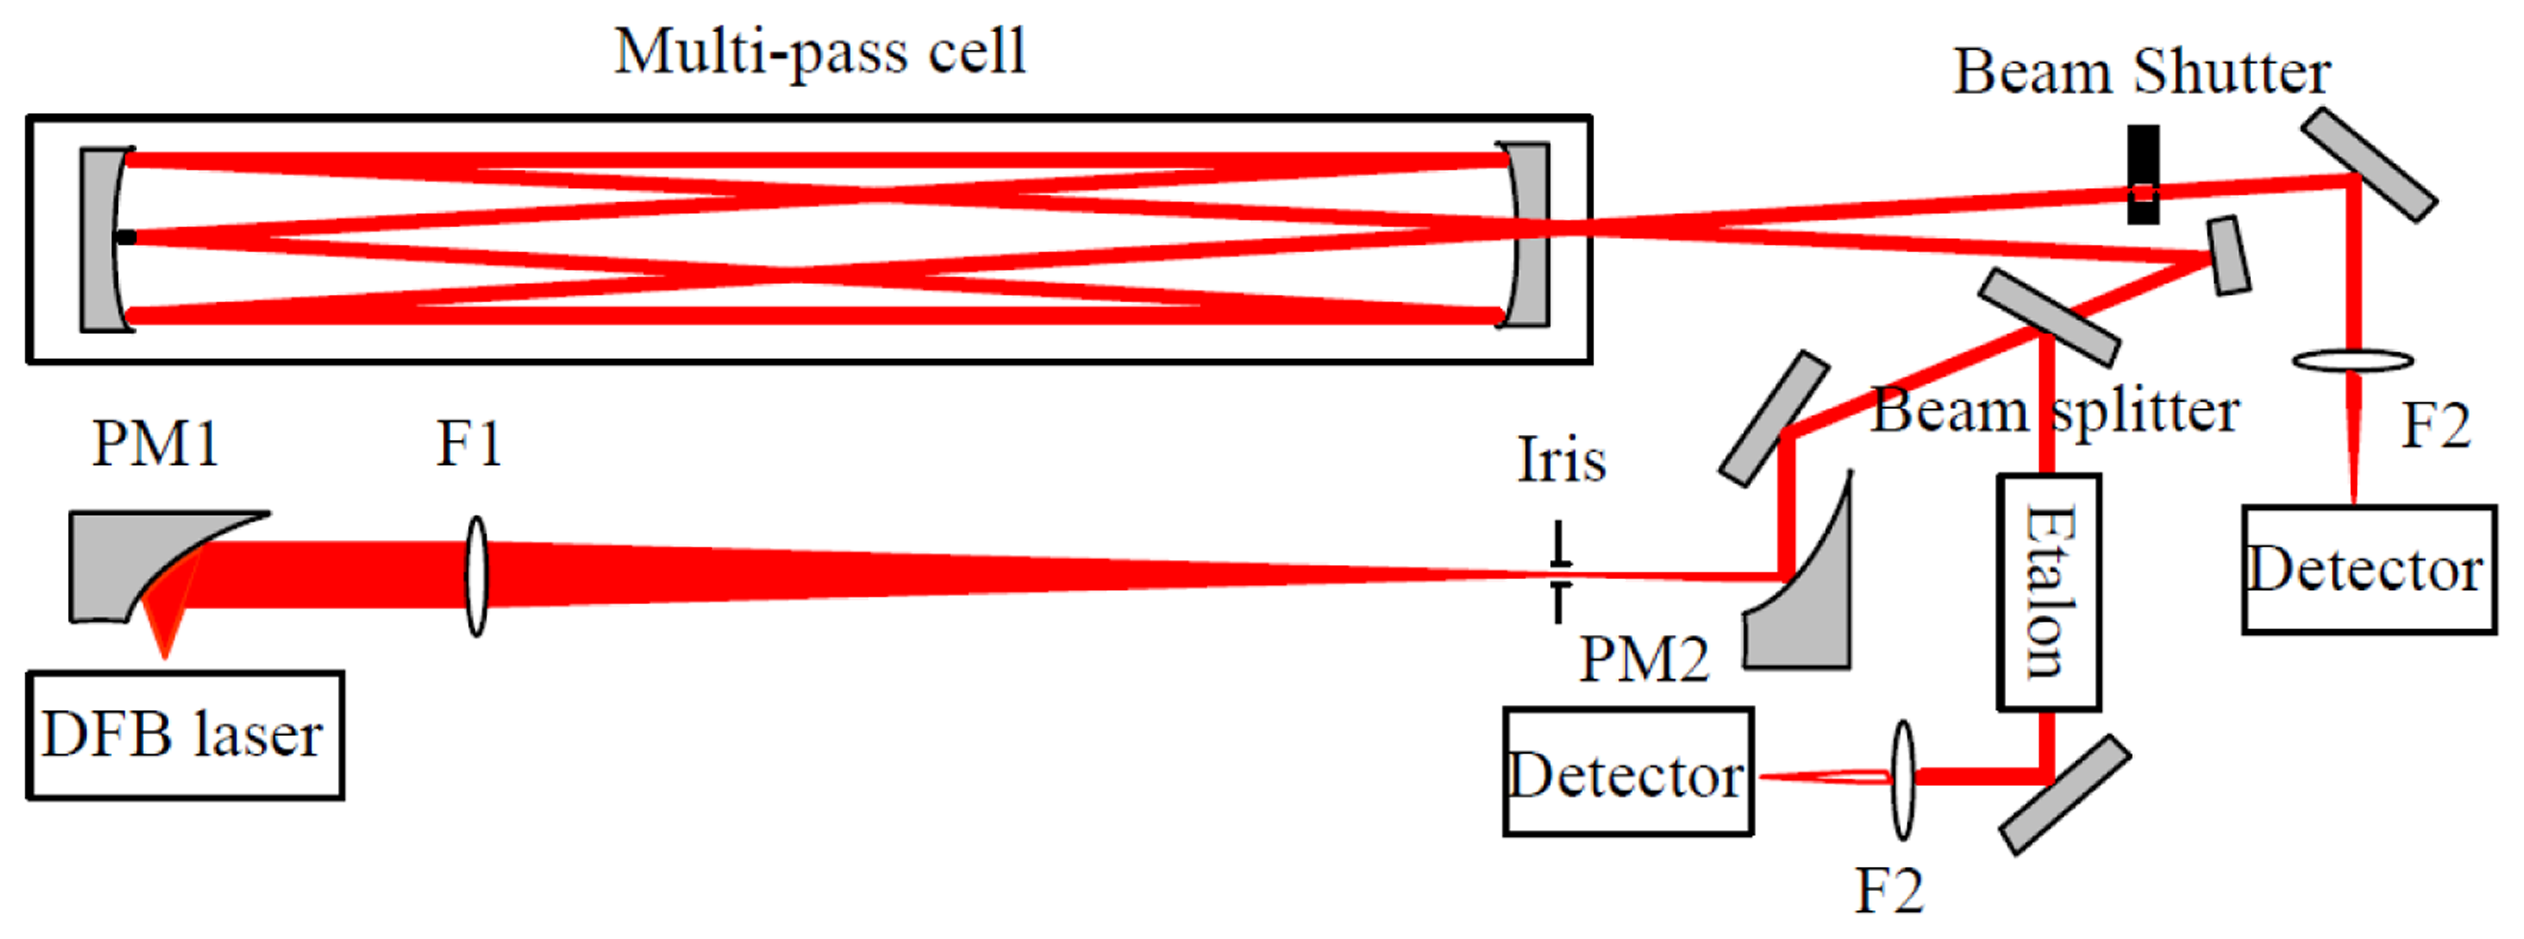
The experimental set-up, mounted on a 50 × 70 cm2 optical breadboard, is depicted in Figure 1. The laser source was a room temperature single mode DFB diode laser operating at 2.73 μm (Nanoplus GmbH, Gerbrunn, Germany). It is tunable from 2729 to 2732 nm with an output power of 2 mW. A Thorlabs (Newton, NJ, USA) ITC 502 diode laser controller provided the laser temperature control and laser drive current. The diverging laser beam was collected by an off-axis parabolic mirror PM1 with an effective focal length (EFL) of 25 mm. The laser beam was then transformed into a quasi-parallel beam with a diameter of ∼4 mm by a combination of an antireflection coated CaF2 lens F1 (f = 200 mm) and an off-axis parabolic mirror PM2 (EFL = 50 mm).
The collimated beam was then divided into two parts. The first part (∼8%) was reflected by a beam splitter (CaF2) and directed to a homemade Fabry-Perot etalon for spectral metrology. The frequency scale was linearized by means of the interference fringes produced by the etalon consisting of two air-separated uncoated CaF2 plates with a free spectral range (FSR) of ∼0.0283 cm−1. Positions of the H2O vapor absorption lines provided by the HITRAN database [29] were used as absolute frequency reference for laser frequency calibration. The main part of the laser beam was coupled into a Herriott cell with an absorption path of 20 m in a 36-pass configuration. The emerging absorption signal was focused with a 50 mm CaF2 lens F2 onto a LN2 cooled HgCdTe detector (J15D22-M204-S01M-60). A home-built bridge circuit was employed to realize DC coupling of the HgCdTe detector to a low noise preamplifier (Model 5113, EG&G, Albuquerque, NM, USA).
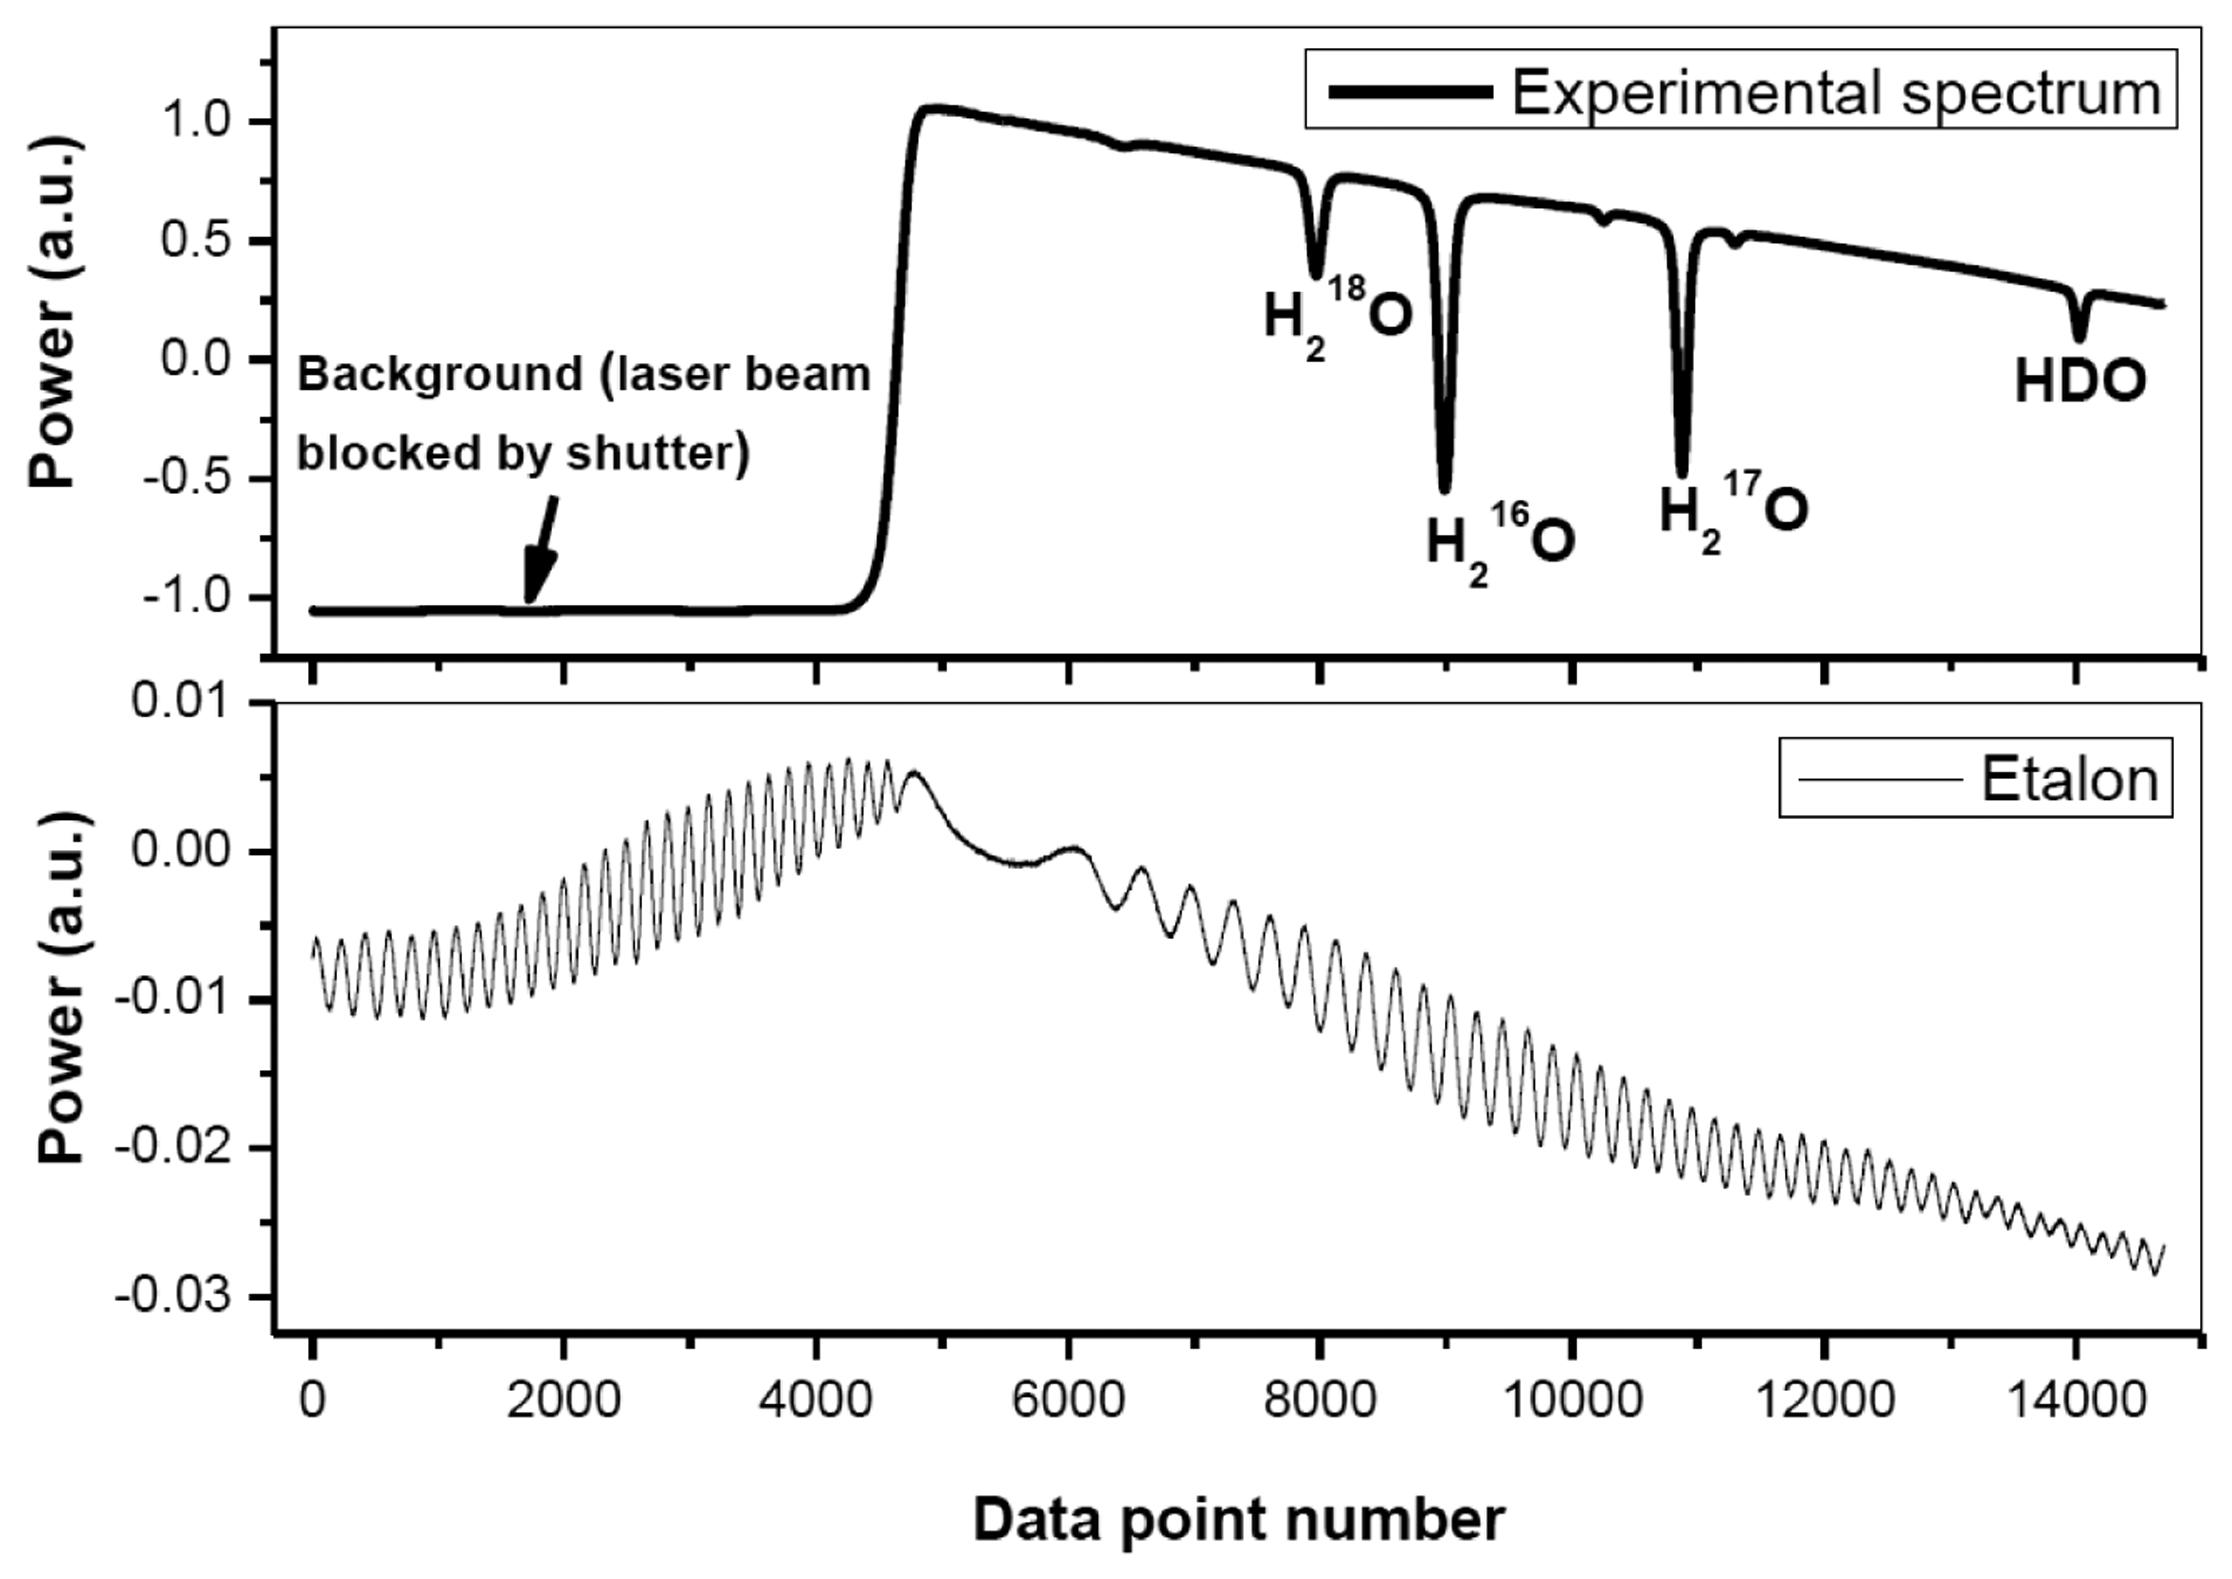
The signal background (corresponding to “laser off”), determined by the dark current level of the detector, was found to be fluctuating by about 1% over a 1 h time interval. This probably was due to variation of the detector temperature or its DC power supply. In order to correctly retrieve absorption spectra, a beam shutter (Thorlabs, SH05) was placed before the detector for background level acquisition at the beginning of each absorption spectral scan.
The laser frequency was periodically scanned at a rate of 10 Hz across the absorption lines of the water isotopologues H16OH, H17OH, H18OH, and HDO by means of a triangular wave voltage. The output signal from the preamplifier was digitized with a laptop using a 16-bit analogue/digital data acquisition card (DAQ Card-6036E, National Instruments, (Austin, TX, USA) controlled with a Lab Windows-based program.
3.2. Experimental Protocol
Careful attention has been paid in the present work to sample mass effects and sample memory effects that affect the determination of the isotopic ratios, as discussed in detail by, among others, Kerstel et al. [15] and more recently Lis et al. [21]. Liquid water samples of 12 μL were injected into the pre-evacuated gas cell through a silicon membrane using a syringe resulting in a water vapor pressure of ∼4.5 mbar inside the gas cell (the saturated vapor pressure is ∼42 mbar), which corresponds to a H2O molecule number density of 1.1 × 10¹⁷ mol/cm3 in the cell. Besides temperature fluctuations, variations in sample pressure inside the cell, resulting from sample injection by a syringe through a silicon membrane, will have a strong effect on the precision and accuracy of the measurements. Although constant volume was used for both sample and reference standard injections in our experiments, variances in the H2O number density in the cell may occur due to H2O leakage through the silicon membrane, over-tightening or under-tightening of the silicon membrane. In order to minimize the impact of this effect on the final results, only those injections resulting in a gas cell pressure within ±0.1 mbar of 4.5 mbar were accepted. Furthermore, in order to avoid sample memory effects due to the “stickiness” of water on the gas cell wall, the first three injections were discarded for each isotope ratio determination.
The temperature of the gas cell was actively controlled to 30 °C by the use of a heater band, and maintained constant within ±0.1 °C by a PID controller. The cell temperature was monitored with calibrated platinum resistors (Pt100) with an accuracy of 0.03 °C and a precision of 0.01 °C. No temperature gradient along the cell axis was observed within the measurement precision of the temperature sensors.
In our experiment, a slight drift of the laser wavelength with time has been observed. In order to minimize the effects of the instrumental drift on the determination of AI, only 10 laser scans were co-added, resulting in a raw δ-value at 1Hz averaged data acquisition rate. Further improvement in precision has been achieved through the use of Kalman filtering technique. As can be seen in the results presented in Section 5, the use of Kalman filtering approach allows minimizing the effect of laser wavelength drift since it filters the measurement data at 1 s time intervals.
4. Data Processing and Retrievals
Figure 2 shows a typical experimentally recorded spectrum of H2O isotopologues around 2.73 μm. The spectrum, resulting from an average of 10 laser scans, was recorded at a pressure of 4.5 mbar and a temperature of 30 °C. Spectral data processing for isotopic composition determination is discussed in detail in the following subsections.
4.1. Spectral Fitting Algorithm
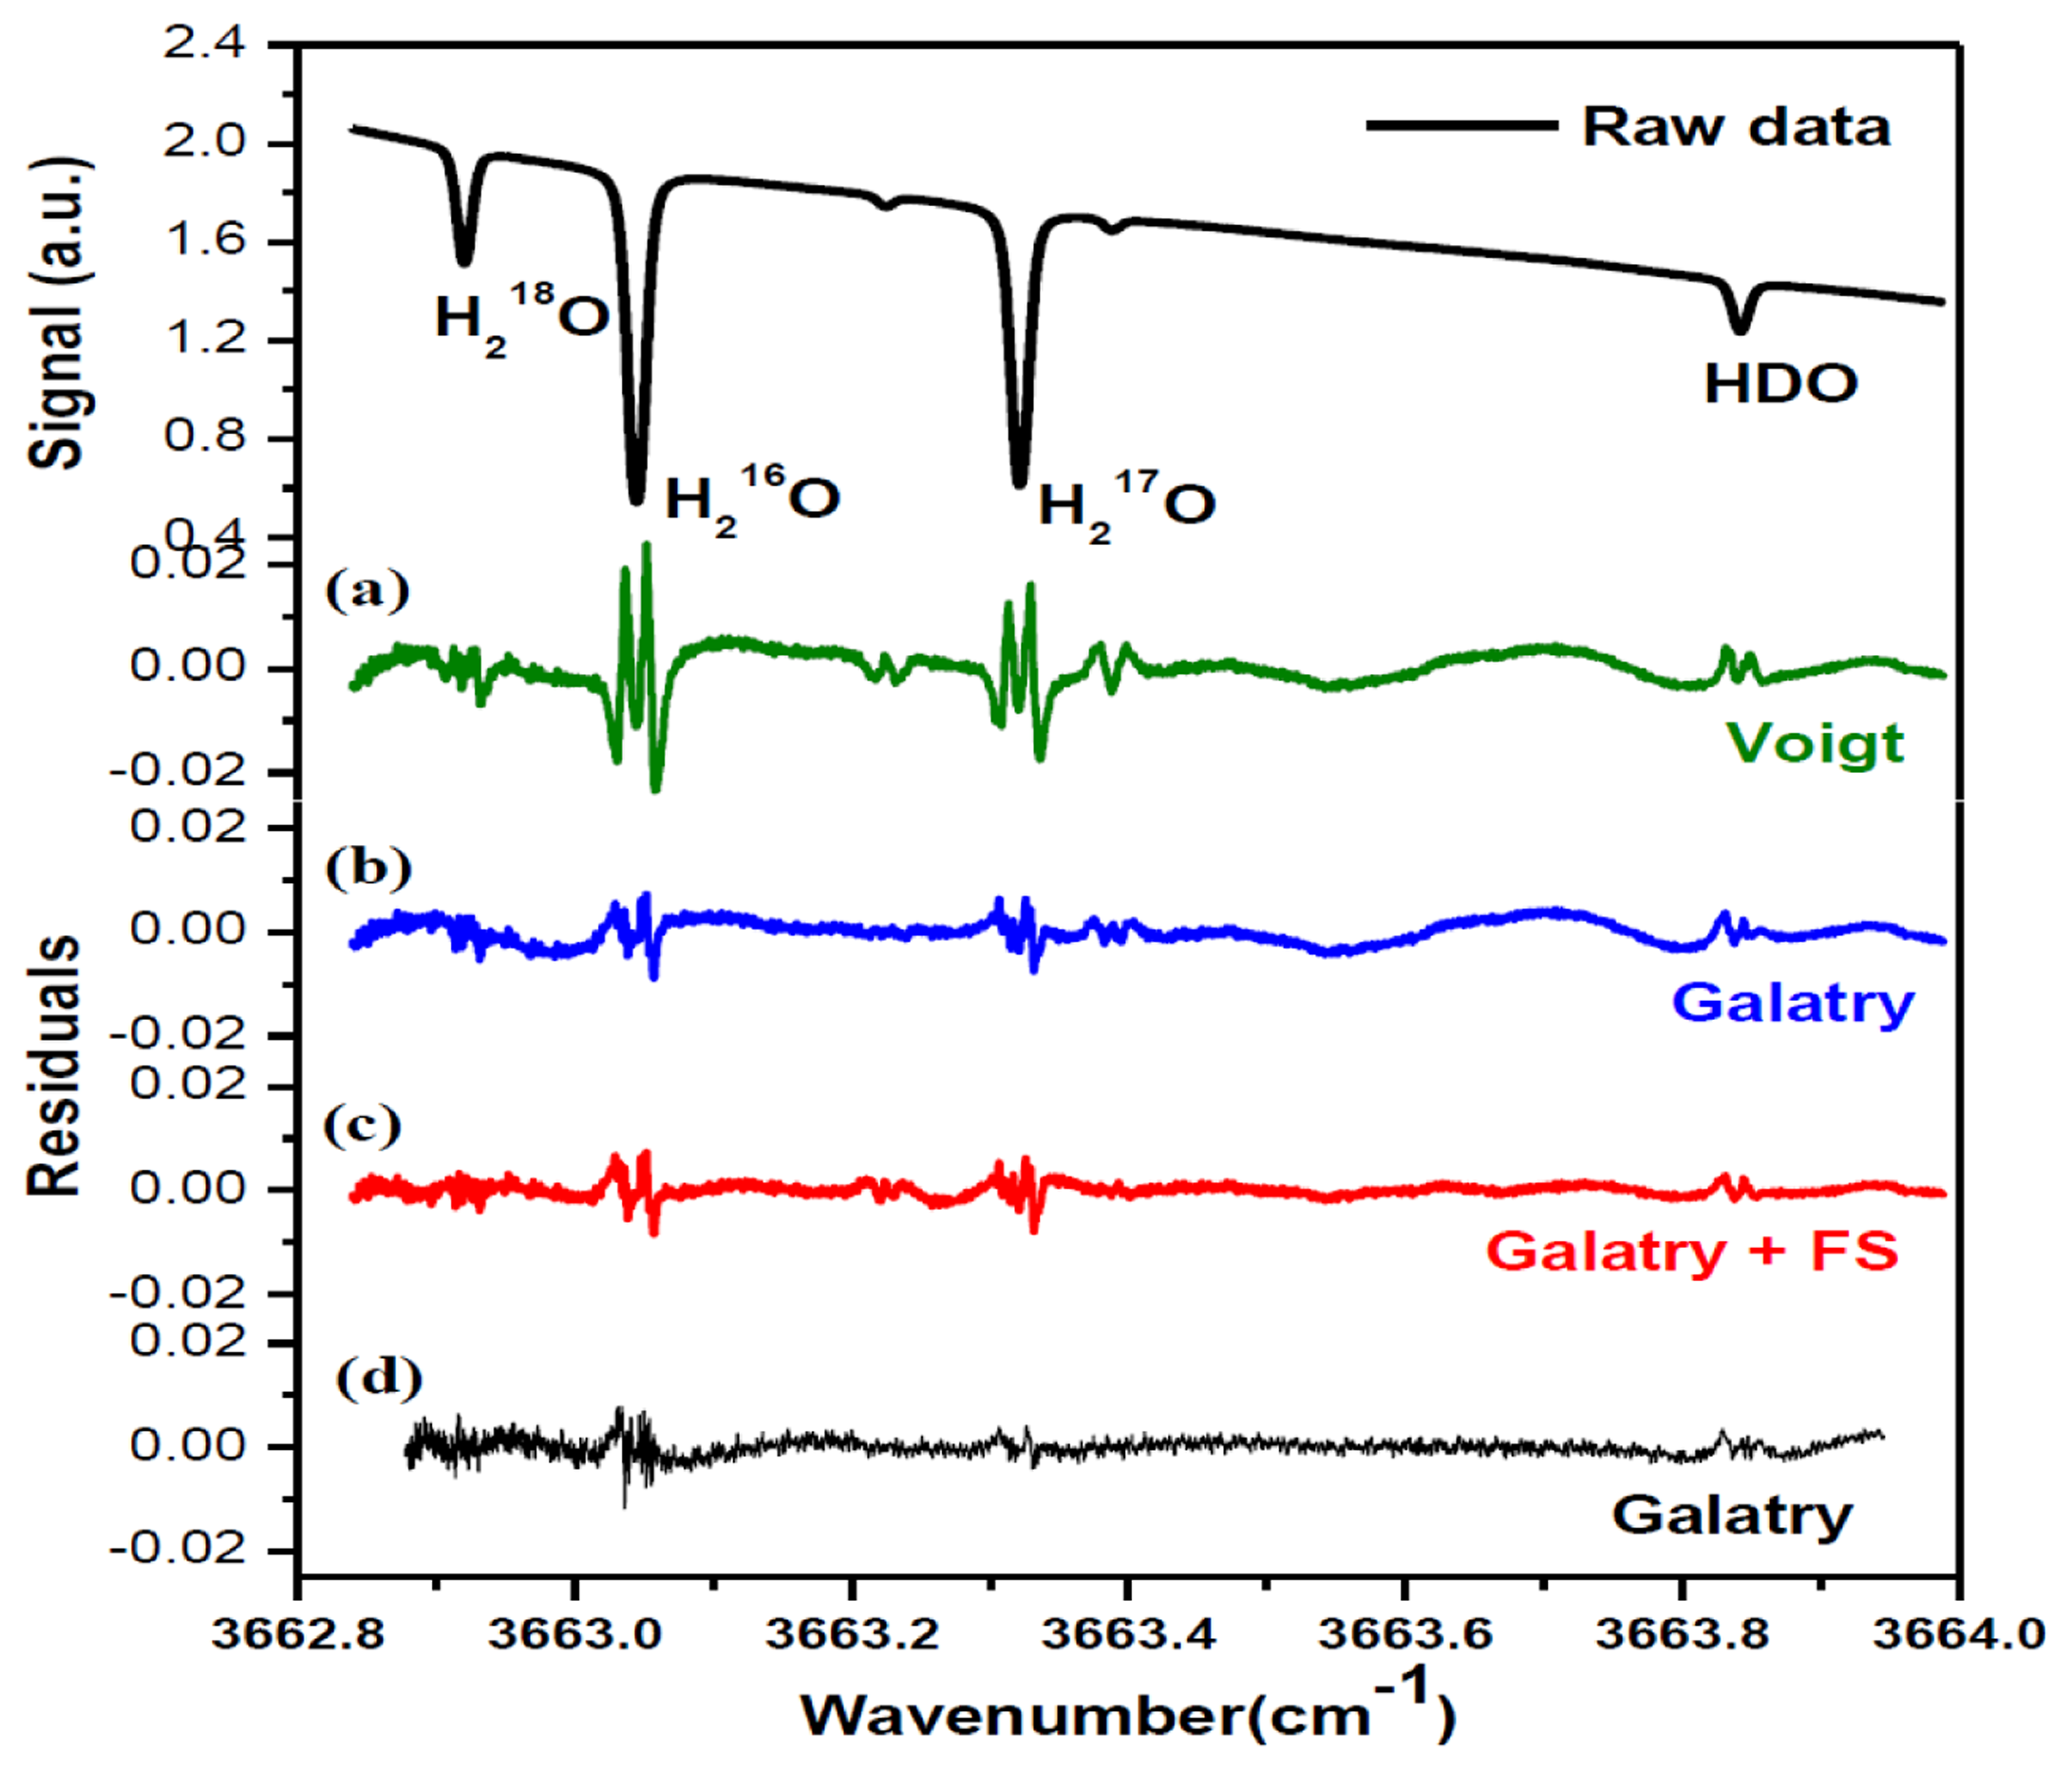
In order to determine the integrated absorbance AI (the area under the absorption line profile), absorption spectra were fitted to Voigt [32] and Galatry [33] profiles, using a Levenberg-Marquardt multi-line fitting algorithm. In the fit procedure, the baseline approximated with a 4th-order polynomial was experimentally found to well represent laser power ramp, allowing good removal of the variation of laser power in the fitted residual. Apart from the four selected lines of H18OH, H16OH, H17OH and H16OD, two H16OD lines at 3663.2250 cm−1 and 3663.3879 cm−1 on either side of the H17OH line were also taken into account in the spectral fitting program. As indicated by the fit residuals shown in Figure 3, the Galatry profile (b) fit resulted in a better residual than using the Voigt profile (a). In fact, the Voigt profile does not take into account correlations between molecular velocities and collisional processes. Corrections for velocity-changing collisions are included in the soft-collision (Galatry) model [33]. Speed dependence of the relaxation rates can be accounted for with the speed-dependent (SD) Voigt profile [34]. Both Galatry and SD-Voigt profiles are reported for recovering the experimentally observed lineshapes, and Galatry profile essentially behaves like the speed-dependent Voigt model [35]. However, Galatry profile and SD-Voigt profile are based on completely different processes. As can be seen in Figure 3c, d, relatively big residuals around absorption peaks are still evidenced even using Galatry model, which leads to a bigger uncertainty in the determination of the integrated area AI. In order to significantly minimize the uncertainty in the determination of the integrated area under the absorption features, a more sophisticated model could be adopted in the future (for instance, the speed-dependent Galatry profile), to take into account the narrowing due to the speed-dependence of relaxation rates as well as the averaging effect of velocity-changing collisions.
4.2. Suppression of Oscillation Structure on the Baseline
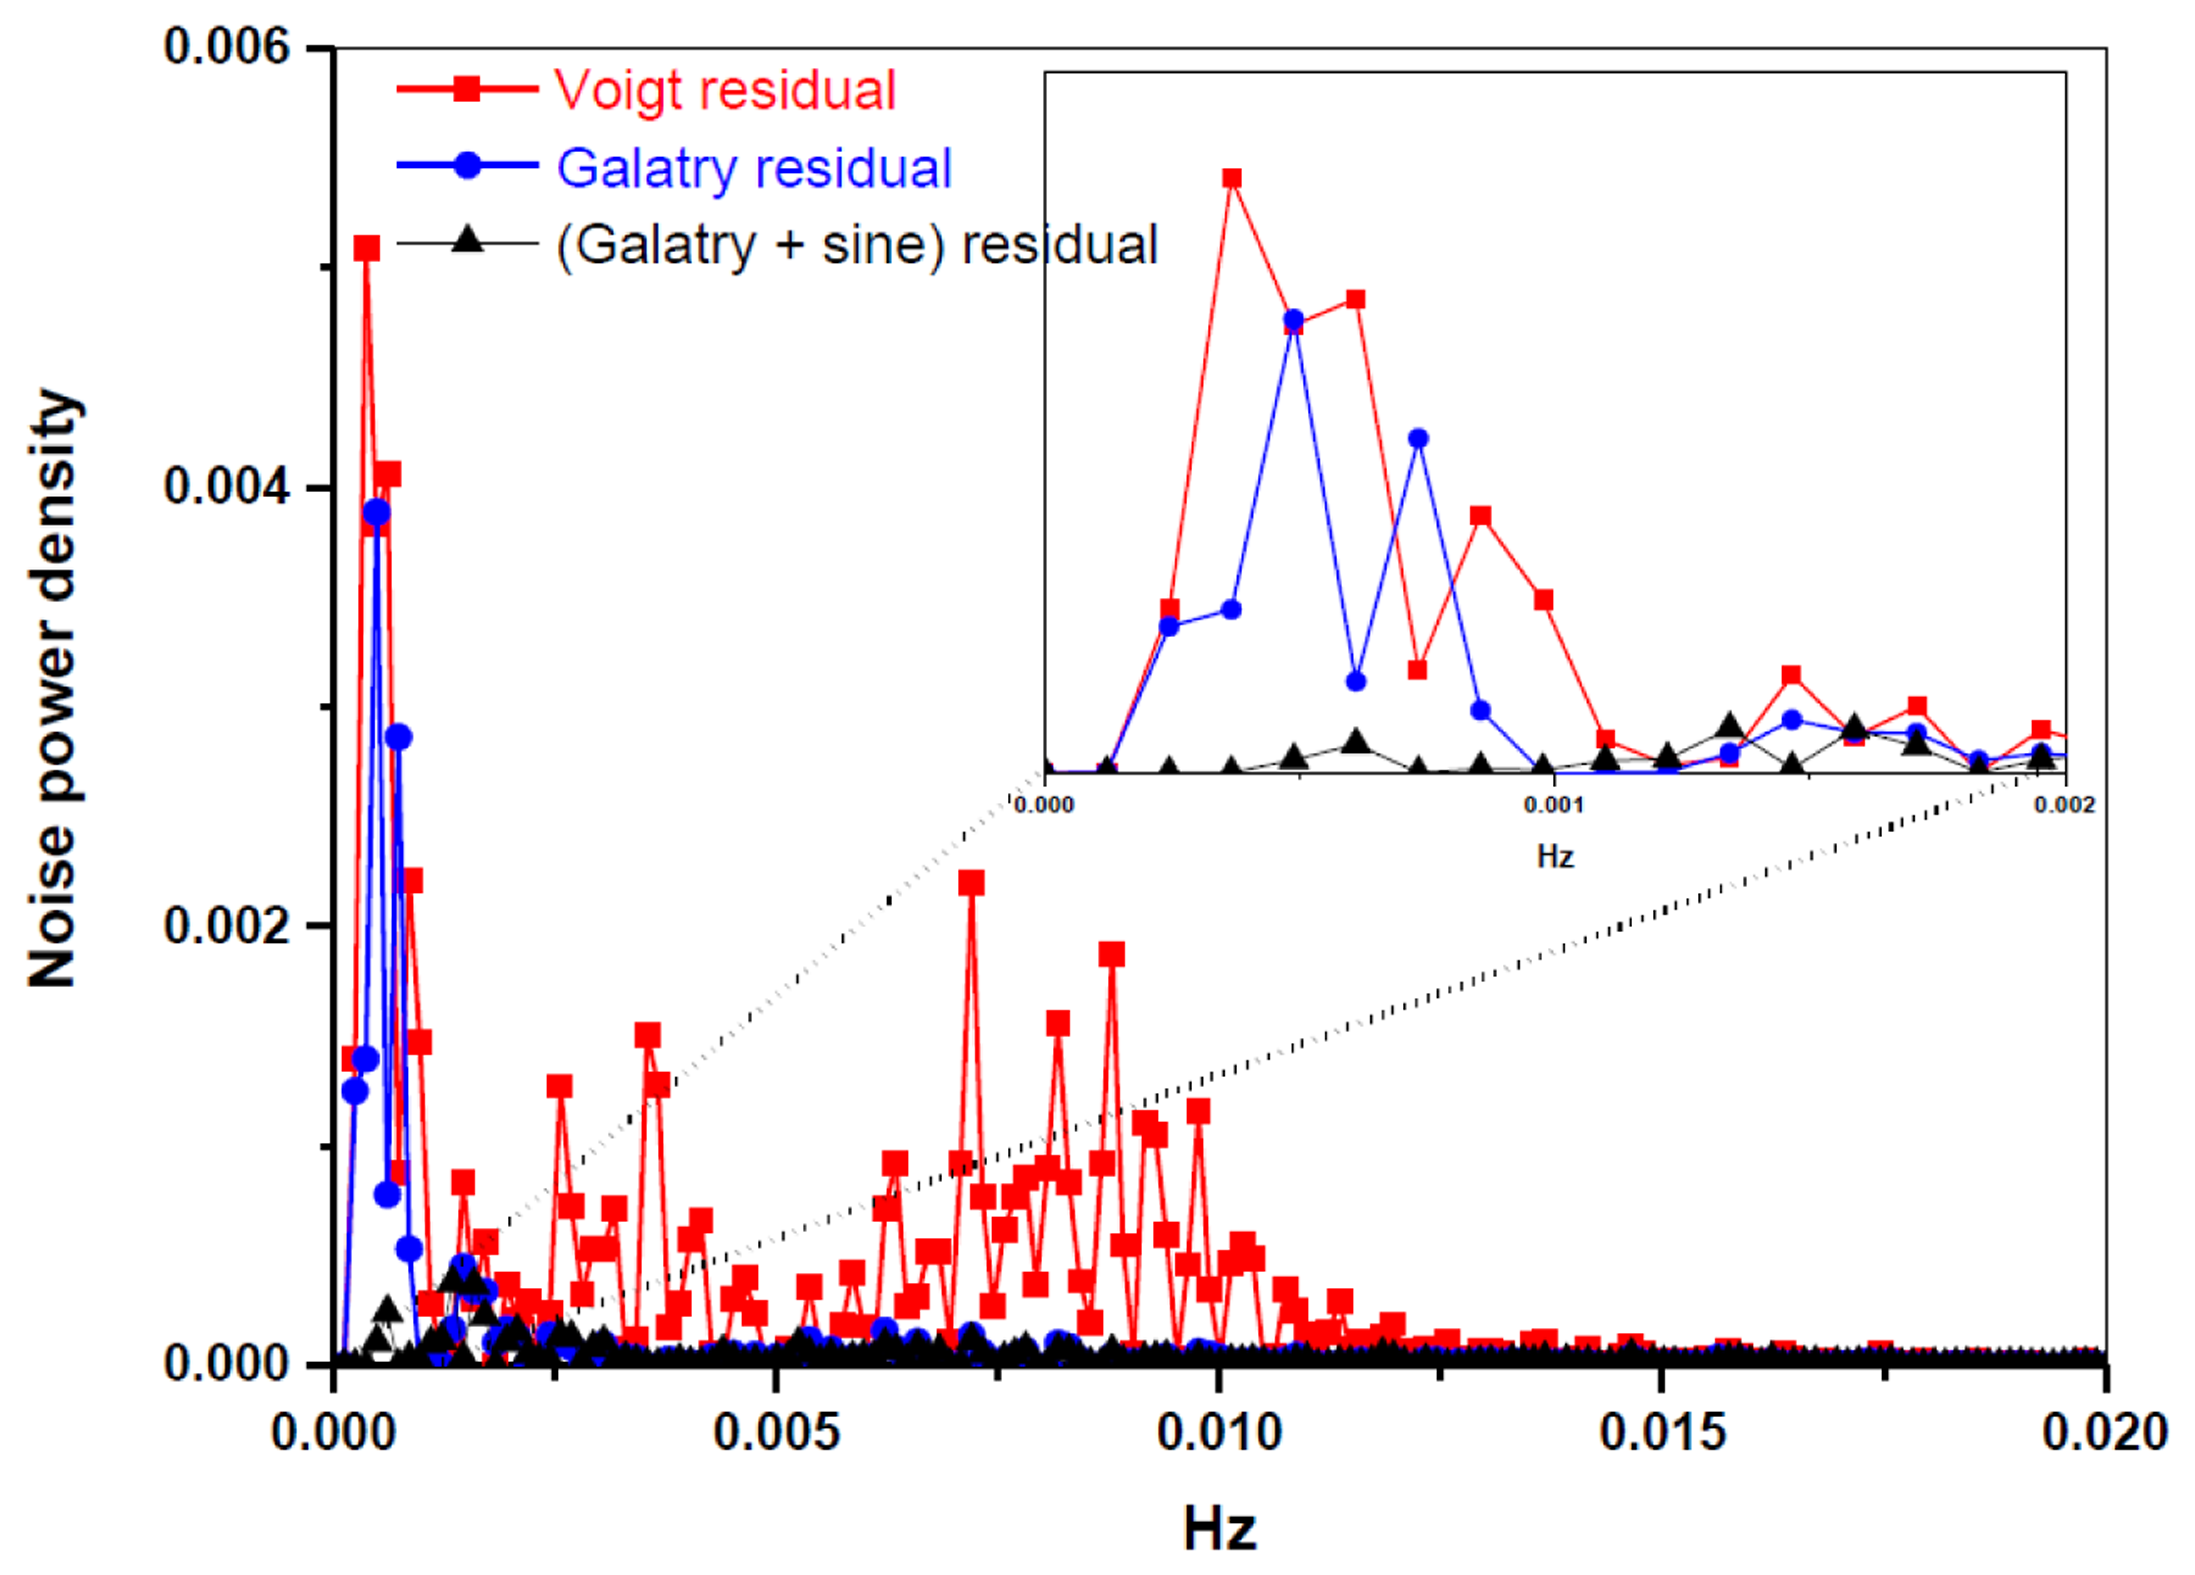
A periodic oscillatory structure on the baseline was observed in both the Voigt (Figure 3a) and the Galatry fit residuals (Figure 3b). This kind of sinewave-like undulation, usually assumed to be fringes resulting from optical interference, was, however, also observed with laser turned off. This means that the periodic oscillatory structure was caused by an electrical perturbation. In order to further improve the measurement precision, we applied a Fourier filtering approach [18] to suppress this oscillatory baseline structure. For this purpose, Fourier transformation of the residuals of the fit was performed in order to determine the oscillation frequencies. As can be seen in the noise power spectral density graph (Figure 4), the noise at frequencies higher than 0.001 Hz was associated with the Voigt fit residual as it has been almost completely removed in the Galatry fit. We determined that the noise peaks at frequencies lower than 0.001 Hz were associated with the baseline oscillatory structure. In order to take this undulation structure into account, the baseline was then modeled as a composition of a 4th-order polynomial and a Fourier series (FS) function of sine and cosine waves (for simulation of the sinewave-like oscillatory structure of the baseline). The transmitted power signal recorded by experiment was thus fitted to the following function:
To obtain the integrated absorbance AI, we fitted the Ffit function (Equation (6)) to the experimentally recorded data with fixed isotope-dependent Doppler width γD (scaled with the square root of the isotopologue mass), while the following parameters were determined in the fit: the integrated absorbance AI, the line center position ν0, the Lorentzian pressure broadening width γL, the Dicke narrowing parameter βC, and the baseline modeling parameters.
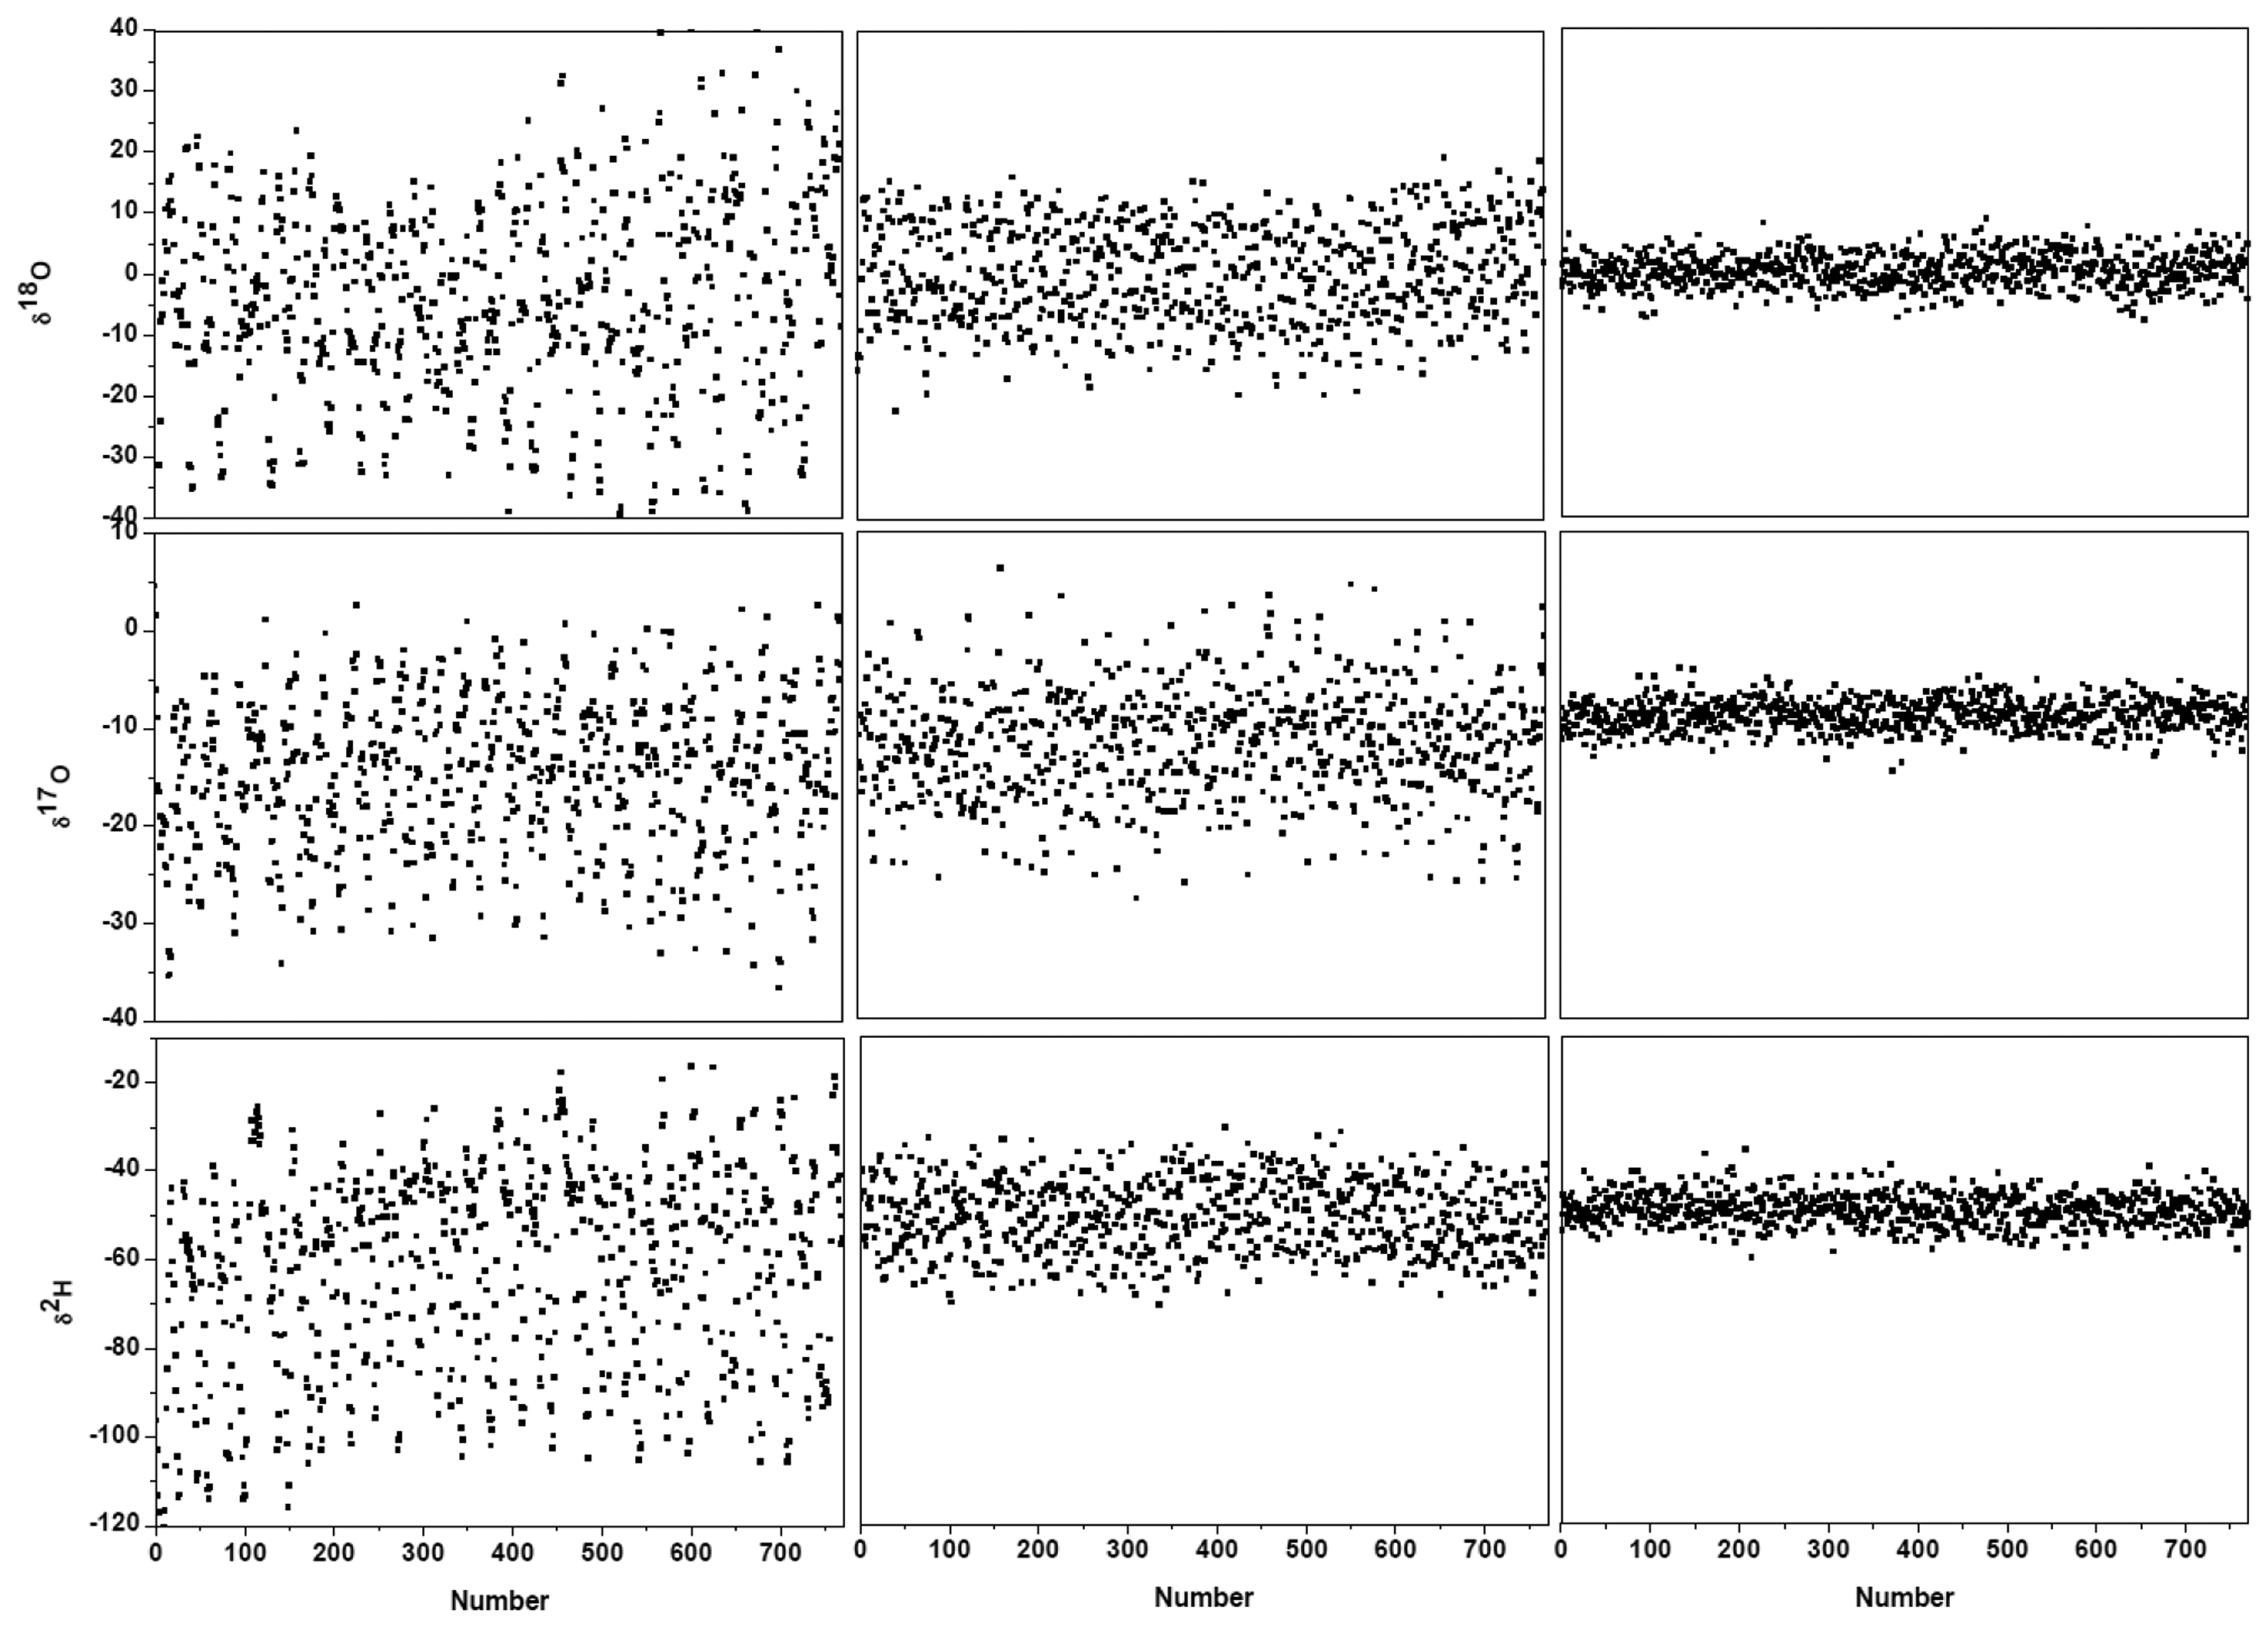
Figure 3c and the black lines in Figure 4 show the results after suppression of the periodic undulation structure by fitting the spectrum to Equation (6). As can be observed in Figure 5, compared to the results obtained with a simple 4th-order polynomial as baseline model (left panel in Figure 5), baseline correction using a composition of a 4th-order polynomial and a Fourier series function (central panel in Figure 5) leads to a reduction of up to 3-fold in the standard deviation (SD) in the isotope ratio determination.
Though application of Fourier filtering can improve the measurement precision by removing oscillatory structure from the baseline, it is hard to completely account for the exact baseline structure with only three Fourier components. In fact, the residuals of Figure 3c still show signs of a residual periodic structure. We therefore proceeded to eliminate the source of the electrical perturbation, which was determined to be related to an electronic component failure in the preamplifier. In the case of no electrical perturbation, as shown in Figure 3d, a 3.7-fold improvement in the measurement precision was obtained (right panel in Figure 5), in comparison with the results achieved using a Fourier filtering (middle panel in Figure 5).
4.3. Allan Variance
The measurement precision is usually affected by the instrument instability and measurement errors related to sample handing and injection (e.g., incomplete evacuation of the gas cell between two consecutive measurements will lead to memory effects and thus affect the measurement precision). Another important limiting factor to achieving high precision is the signal-to-noise ratio (SNR) of the spectral data. In LAS, high SNR can be obtained by enhancing the signal (by selecting stronger absorption lines and using long absorption path length or cavity enhanced spectroscopy) and reducing the noise (by averaging N laser scans and using modulation or/and balanced-beam detection techniques). With the signal averaging approach, the optimal averaging number N, limited by the stability of the instrument, can be determined by an Allan variance analysis [36]. Alternatively, the individual spectral scans can be processed, and the resulting isotope ratios may be further averaged (within the system's stability time) to obtain the desired precision level. In the present work, due to laser wavelength drift, the maximum averaging number of the laser scans was limited at about N = 10, corresponding to an acquisition time of 1 s. The 1 s raw data were processed to provide 1 s raw δ values with a 1σ precision of 7.8‰ for δ18O, 6.6‰ for δ17O, and 8.0‰ for δ2H of a bottled water (Vittel, France).
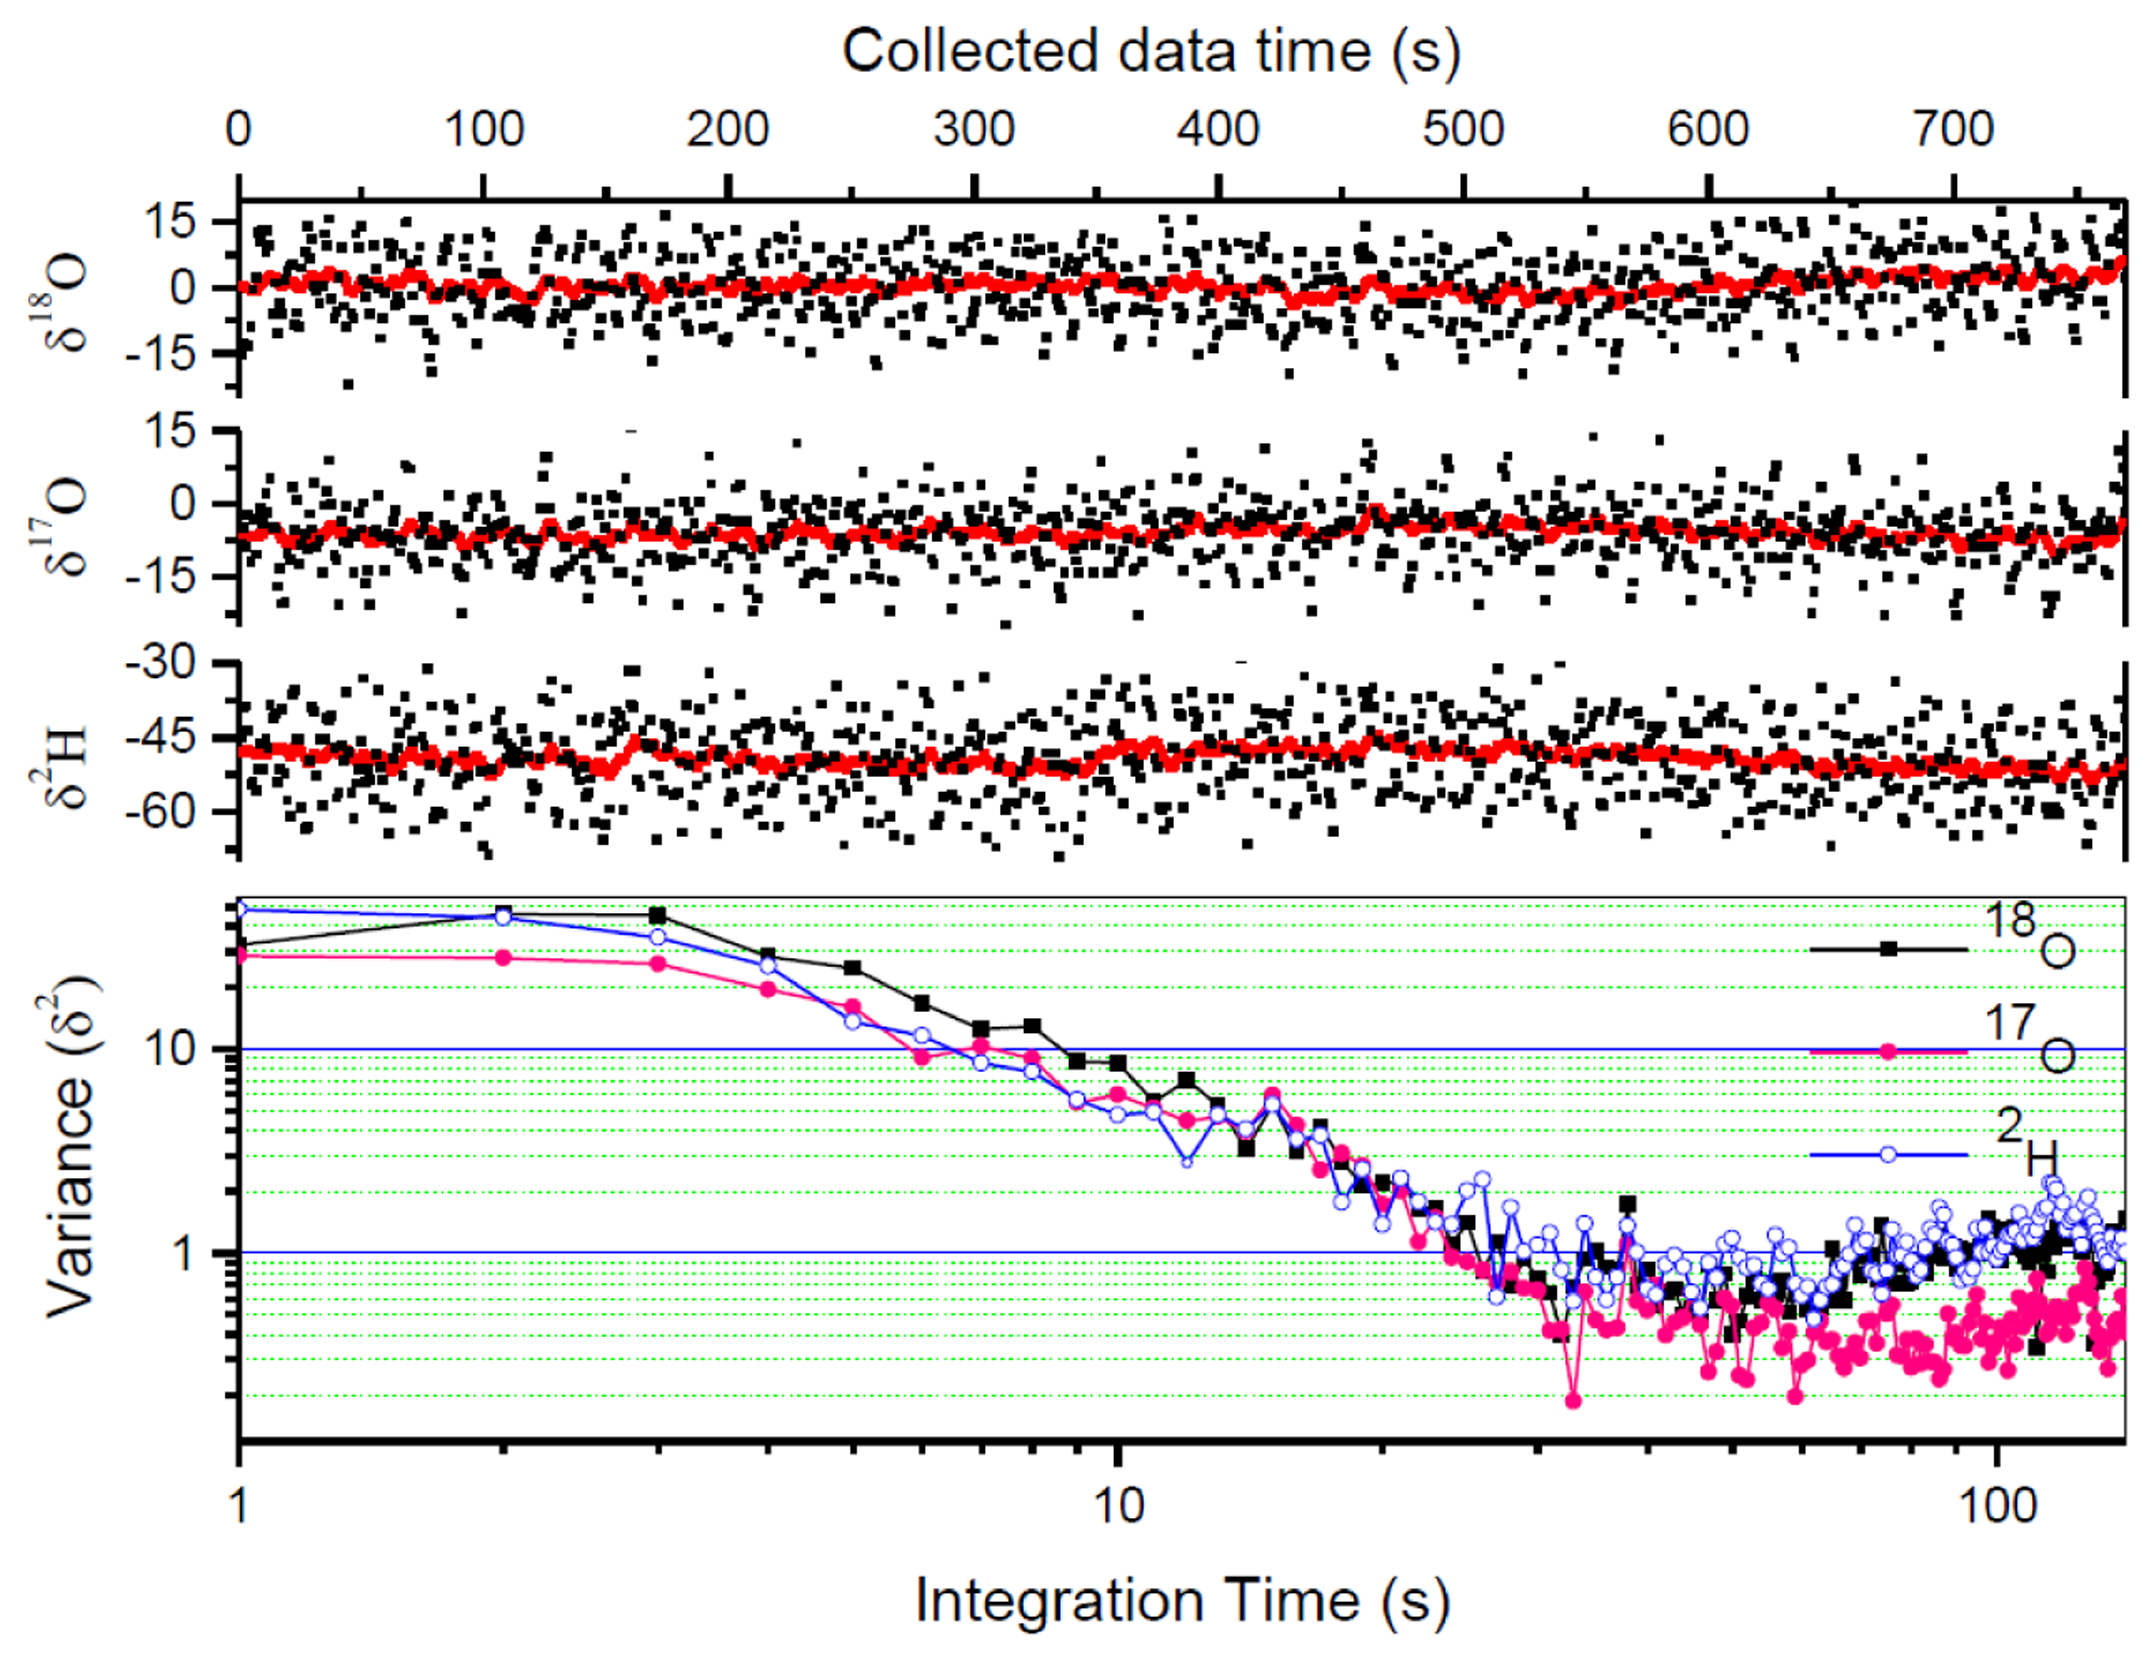
In order to further improve the measurement precision, the 1 s raw δ values are further averaged. Allan variance analysis has been performed to determine the optimum averaging number. As can be seen in Figure 6 (lower panel), the optimum averaging time for the present instrument was ∼30 s. We then used conventional averaging of 30 measured δ -values corresponding to the optimum averaging time of 30 s. Herewith the precision was improved to 1.4‰ for δ18O, 1.1‰ for δ17O, and 1.5‰ for δ2H, respectively.
4.4. Kalman Filtering
Though signal averaging enables one to improve the measurement precision [1,11], such “post-processing” results in a slow temporal response of the system. For certain specific applications, such as the on-line monitoring of exhaled breath [37], it is highly desirable to be able to perform real-time measurements with high sensitivity and precision, while maintaining a fast system response. Kalman filtering, being an adaptive filtering technique uses a recursive procedure for “true value” prediction based on the previously determined values. It can efficiently remove the shot-to-shot variability related to the real-time noise in the measured data with minimal deformation of the physical quantity to be measured. Kalman filtering has been successfully applied before to real-time trace gas concentration measurements [38,39]. We recently introduced this technique to the field of isotope ratio measurements [28] in order to perform fast and high precision measurements. In this section, we describe in detail the theoretical consideration of a Kalman filter model for application to isotope ratio measurements.
Using a linear stochastic difference model, the true isotope ratio δ̂k+1 at time k+1 is evolved from the value δ̂k given at k according to:
At time k the measured isotope ratio zk of the true value δ̂k can be expressed as follows:
The time update procedure projects forward in time current isotope ratio and error variance estimates to obtain a priori estimates for the next time step. The prediction equations can be expressed as:
The measurement update incorporates a new measurement into the a priori isotope ratio estimate to obtain an improved a posteriori estimate as filtered isotope ratio value, δ. The filtering equations involved in the measurement update are:
In practical applications, the measurement noise σ2v and the true δ variability σ2w (related to real isotope abundance variation and real-time drifts resulting from laser frequency shift, thermal fluctuation, pressure variation, etc.) should be well defined.
Information on the measurement noise variance σ2v is usually known, because it depends on the quality of the measurement instrument, while the variance σ2w of the true isotopic ratio variability is quite subjective. Whereas both σ2v and σ2w vary with real variations of the isotope abundance, once the measurement system has reached equilibrium, the ratio of σ2v to σ2w should be constant. We therefore define:
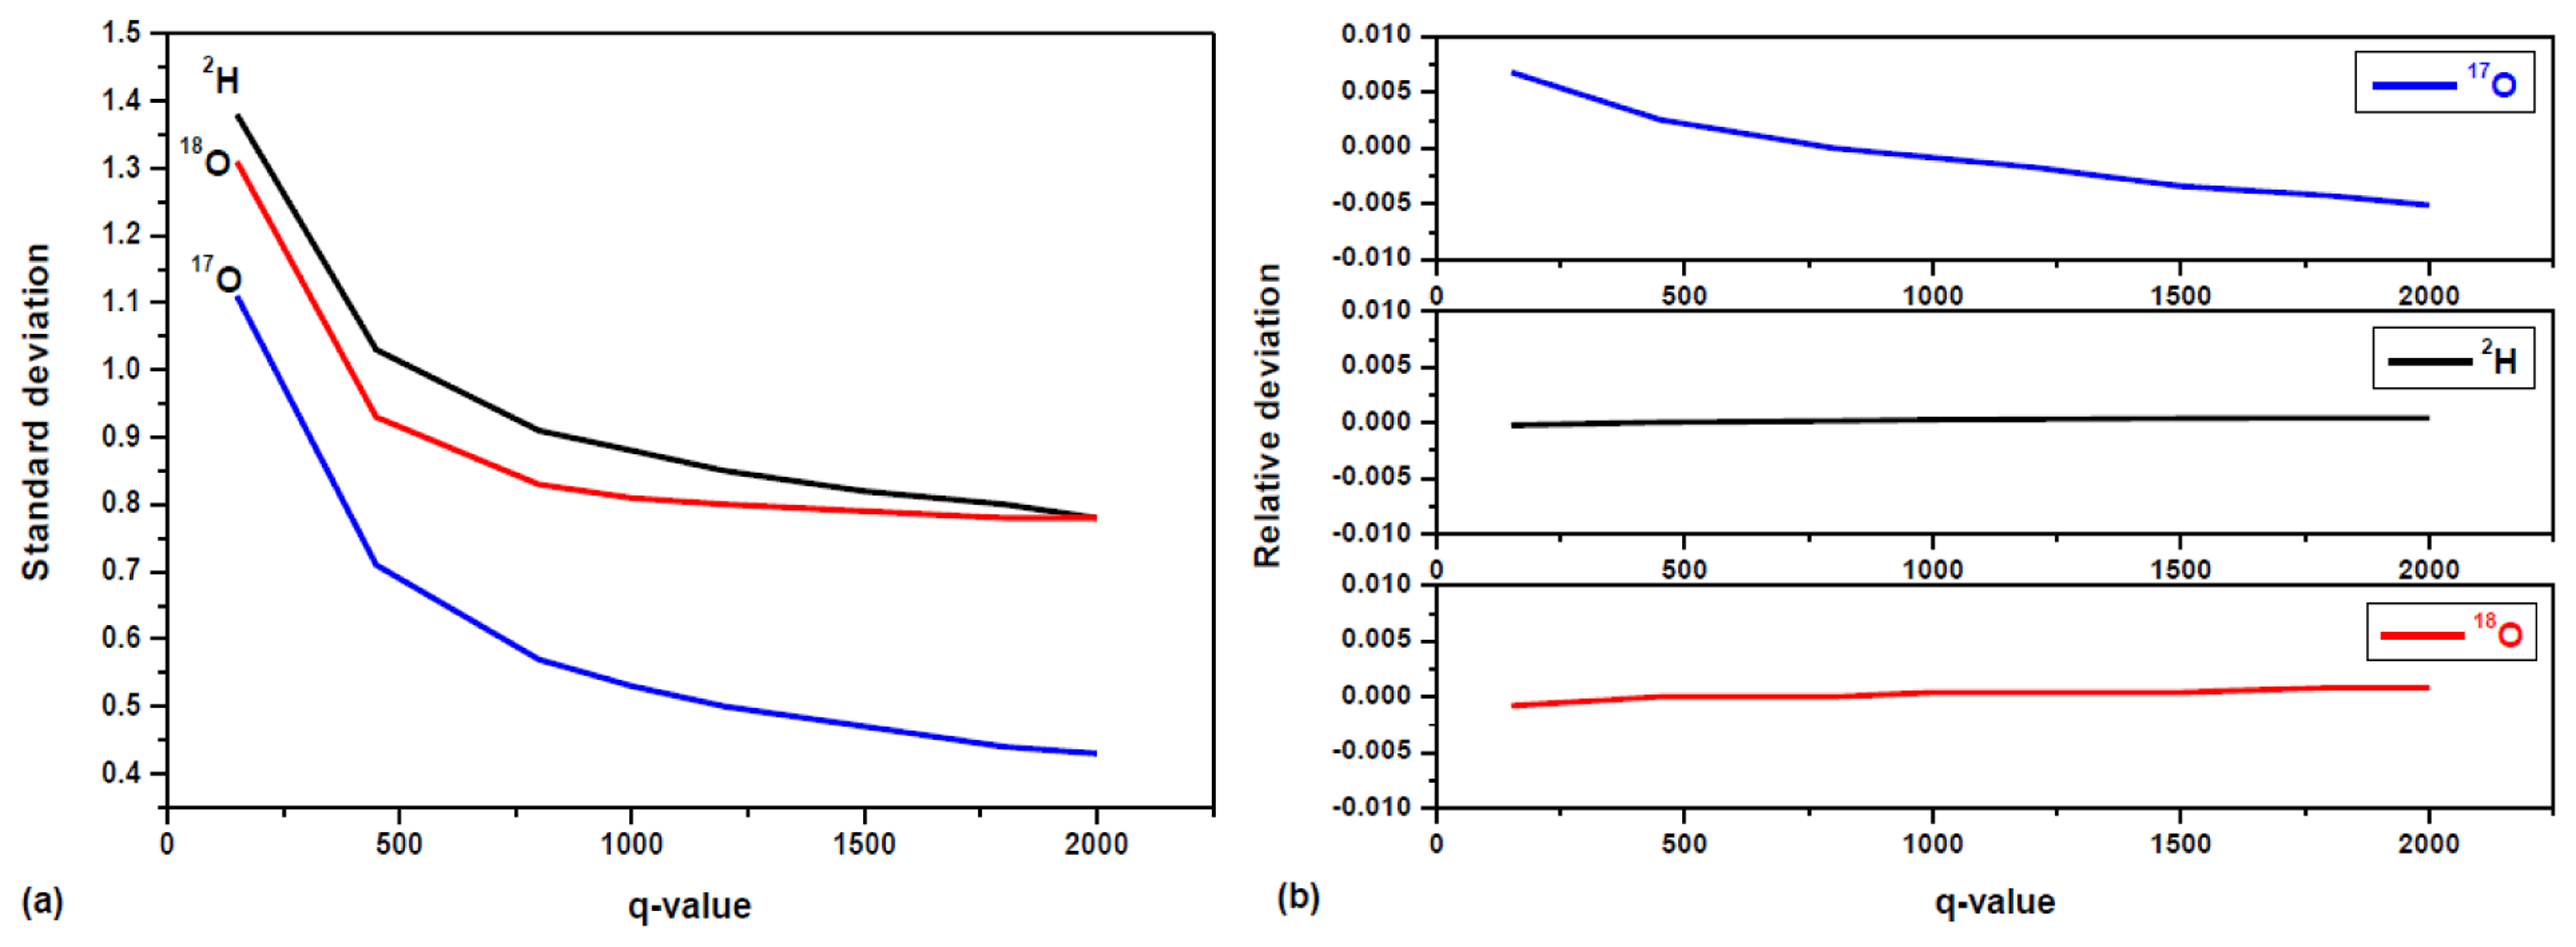
The parameter q is known as the filter tuning parameter. The choice of q depends on the particular instrument and its application environment. For a larger q value, the system's response time is longer to follow real-time variation in isotopic composition. Conversely, the filtering is less efficient in removing shot-to-shot real-time noise when a smaller q value is used. Figure 7a shows the 1σ precision (standard deviations) in isotope ratios determination of a bottled water (Vittel) as a function of q. As shown in Figure 7a, the improvement in the precision is clearly evident, as the standard deviation decreases exponentially with increased q value. The decreasing trend for δ18O is toward a steady state value for q > 800. For δ17O and δ2H, the decreasing trend slowed down for q > 800, while toward a steady state value for q > 2000. This may be explained by small drift in δ17O, δ2H resulting a Gaussian distribution, high q value is needed to get steady state, because the larger q value, the more efficient is the filtering δ-value fluctuations due to random noise. In the present work, a value of q = 800 was chosen as a compromise between fast temporal response and high filtering efficiency (thus high measurement precision) for the developed laser instrument. In the present work, a value of q = 800 was chosen as a compromise between fast temporal response and high filtering efficiency (thus high measurement precision) for the developed laser instrument. In our experiment, σ2v was determined by the δ-value variance deduced from the first 10 raw measurements, and σ2w was calculated by dividing σ2v by q.
The effects of the Kalman filtering on the measurement accuracy were investigated in the present work. For this purpose, the working standard GS-42 with well known isotope ratios was used. The relative deviation in water (GS-42) isotope ratio measurement accuracy, (δ − δ̄);/δ̄, is plotted in function of the q-parameter in Figure 7b. As can be seen, the relative deviation for δ18O and δ2H are almost constant in the range of ±1% with increased q-value. Though the relative deviation for δ17O varies evidently with q-value, the values are under a range of ±0.7%. The Kalman filtering is more effective to remove fluctuations due to random white noise. However, apart from the measurement random noise, temperature fluctuations of the gaseous sample and baseline drift may result in drift over time in δ values, which cannot be removed by the Kalman filtering. Because of slow drift in δ17O values, the fluctuation of δ17O mean for different q-value is almost two times larger than δ18O and δ2H. The maximal differences in relative deviation for the measurement accuracy are 1.6 × 10⁻³ for δ18O, 1 × 10⁻² for δ17O, and 5 × 10⁻⁴ for δ2H in Figure 7b.
5. Results and Discussion
Table 2 summarizes the measurement accuracy of our IRLS instrument, compared to the IRMS calibrated value of GS-42.
The deviation of the measured values from the reference was −0.2‰ for δ18O, 1.4‰ for δ17O and 1.5‰ for δ2H. The large measurement deviation, especially for δ17O and δ2H, would be mainly caused sample mass effects. Though careful attention has been paid to sample amount effects in the present work, more precise control of injection volume and sample pressure was still needed. The 1σ standard deviation is 1.2‰ for δ18O, 0.7‰ for δ17O, and 1.4‰ for δ2H for five injections of water (GS-42). Moreover, the precision of 0.8‰ for δ18O, 0.6‰ for δ17O and 0.9‰ for δ2H with 1 s Kalman filtering also had certain influence on the measurement deviation. It should be noted that the δ17O value in water could not be directly determined with IRMS; the value given in the table is not a measured value, but was calculated based on a natural relation between the 17O and 18O abundance ratios [8]: δ17O = (1 + δ18O)0.5281 − 1.
The measurement precisions using 1 s Kalman filtering (q = 800) are given in parentheses in Table 2 in terms of the standard error of the mean values, SE (= SD/N1/2). We converted the standard deviation into SE with the same N values for the reason of comparison with the standard working reference GS-42.
Figure 6 shows raw measured results of a bottled water Vittel (black dots) in comparison with Kalman filtering results (black lines). With a q-value of 800, the Kalman filtered data obtained in 1 s reached a precision level better than the results obtained from conventional 30 s averaging. The 1σ standard deviation has been improved to 0.83‰ for δ18O, 0.57‰ for δ17O, and 0.91‰ for δ2H, with a measurement time of 1 s. Comparison of the measurement precisions is given in Table 3. 1 s Kalman filtering δ values (with q = 800) are compared with the raw measured δ values from the average of 10 laser scans (1 s) and the data from conventional averaging of 30 measured δ-value within the optimal averaging time of 30 s.
It is also worth noting, as can be seen in Figure 6, that the Kalman filtering does not affect the mean value of the data, and therefore does not affect the accuracy of the measurement.
6. Conclusions
We have described a compact IRLS instrument for simultaneous measurements of the D/H and 18O/16O, 17O/16O isotope ratios in water by laser absorption spectroscopy at 2.73 μm. We demonstrated the potential of application of Kalman filtering for fast and high precision isotope ratio measurements. The measurement precision achieved at 1 s Kalman filtering time intervals is better than that obtained by conventional 30 s averaging. The Kalman filter can be optimized to filter out the maximum amount of shot-to-shot real-time noise while following the real variation in measured physical quantity. The impact of the Kalman filtering on the measurement precision and accuracy were investigated. The measurement precision was improved clearly with high q value, while measurement accuracy was less impact by the Kalman filtering and mainly determined by calibration with known standard materials. The Voigt and Galatry profiles were used to investigate the possible influence of the choice of the line shape model on the determination of the integrated absorbance. The Galatry profile fit resulted in a smaller residual than using the Voigt profile. However, relatively big residuals around absorption peaks are still evidenced even using Galatry model, which leads to a bigger uncertainty in the determination of the integrated area AI. A more sophisticated model should be adopted in the future (for instance, the speed-dependent Galatry profile), to take into account simultaneously the narrowing due to the speed-dependence of relaxation rates and to the averaging effect of velocity-changing collisions. Fourier analysis of fitted spectral residuals allowed for determination of the Fourier frequency components in the undulation structure on the baseline. Reduction of up to three times in standard deviation in the isotope ratio determination was obtained by application of Fourier filtering to remove the undulation structure from spectrum baseline. However, a further reduction by a factor of 3.7 was obtained by the elimination of the electrical noise source. Measurement accuracy comparison of isotope ratios in water reference GS-42 between IRLS and IRMS was performed. Measured value of δ18O was more close to reference value, while measured values δ17O and δ2H presented a deviation from reference value. The measurement deviation would be mainly caused sample mass effects. Though careful attention has been paid to sample amount effects in the present work, more precise control of injection volume and sample pressure was still needed. Moreover, the precision of δ18O, δ17O and δ2H with 1 s Kalman filtering also had certain influence on the measurement deviation.
Further improvements in isotope ratio determination precision and accuracy can be envisaged as follows: (1) precise control of injection volume and sample pressure; (2) real-time calibration by alternating the introduction into the cell of a reference and the sample [21,40,41]; (3) real-time precise control and measurement of gas cell temperature for correction for temperature drifts during the measurements.
Acknowledgments
This work is mainly supported by the IRENI program of the Région Nord-Pas de Calais. The support of the Groupement de Recherche International SAMIA between CNRS (France), RFBR (Russia) and CAS (China) is acknowledged. This research was supported by National Natural Science Foundation of China (No. 41265011), International Cooperation of Jiangxi Province of China (No.20132BDH80006) and Natural Science Foundation of Jiangxi Province, China (No. 20114BAB212008). We acknowledge helpful discussions with Peter Werle and Frank Tittel on signal processing and the Kalman filtering technique and with Erik Kerstel on isotope issues. The authors thank Francis Leveugle for prompt technical help.
Conflicts of Interest
The authors declare no conflict of interest.
References
- Aggarwal, P.K.; Gat, J.R.; Froehlich, K.F. Isotopes in the Water Cycle: Past, Present and Future of a Developing Science; Aggarwal, P.K., Gat, J.R., Froehlich, K.F., Eds.; Springer: Berlin, Germany, 2005. [Google Scholar]
- Sturm, C.; Zhang, Q.; Noone, D. An introduction to stable water isotopes in climate models: Benefits of forward proxy modelling for paleoclimatology. Clim. Past 2010, 6, 115–129. [Google Scholar]
- Lee, X.; Sargent, S.; Smith, R.; Tanner, B. In Situ Measurement of the Water Vapor 18O/16O Isotope Ratio for Atmospheric and Ecological Applications. J. Atmos. Ocean. Technol. 2005, 22, 555–565. [Google Scholar]
- Andersen, K.K.; Azuma, N.; Barnola, J.-M.; Bigler, M.; Biscaye, P.; Caillon, N.; Chappellaz, J.; Clausen, H.B.; Dahl-Jensen, D.; Fischer, H. High-resolution record of Northern Hemisphere climate extending into the last interglacial period. Nature 2004, 431, 147–151. [Google Scholar]
- Smith, D.; Engel, B.; Diskin, A.M.; Spanel, P.; Davies, S.J. Comparative measurements of total body water in healthy volunteers by online breath deuterium measurement and other near-subject methods. Am. J. Clin. Nutr. 2002, 76, 1295–1301. [Google Scholar]
- Begley, I.S.; Scrimgeour, C.M. High-precision δ2H and δ18O measurement for water and volatile organic compounds by continuous-flow pyrolysis isotope ratio mass spectrometry. Anal. Chem. 1997, 69, 1530–1535. [Google Scholar]
- Epstein, S.; Mayada, T.K. Variation of 18O content of waters from natural sources. Geochim. Cosmochim. Acta 1953, 4, 213–224. [Google Scholar]
- Meijer, H.A.J.; Li, W.J. The use of electrolysis for accurate δ17O and δ18O isotope measurements in water. Isot. Environ. Health Stud. 1998, 34, 349–369. [Google Scholar]
- Barkan, E.; Luz, B. High precision measurements of 17O/16O and 18O/16O of O2 in H2O. Rapid Comm. Mass. Spectrom. 2005, 19, 3737–3742. [Google Scholar]
- Kerstel, E.R.Th. Isotope Ratio Infrared Spectrometry. In Handbook of Stable Isotope Analytical Techniques; de Groot, P.A., Ed.; Elsevier: Amsterdam, The Netherlands, 2004; pp. 759–787. [Google Scholar]
- Kerstel, E.; Gianfrani, L. Advances in laser-based isotope ratio measurements: Selected applications. Appl. Phys. B 2008, 92, 439–449. [Google Scholar]
- Kerstel, E.R.Th.; Gagliardi, G.; Gianfrani, L.; Meijer, H.A.J.; van Trigt, R.; Ramaker, R. Determination of the 2H/1H, 17O/16O, and 18O/16O isotope ratios in water by means of tunable diode laser spectroscopy at 1.39 μm. Spectrochim. Acta A 2002, 58, 2389–2396. [Google Scholar]
- Gianfrani, L.; Gagliardi, G.; van Burgel, M.; Kerstel, E.R.Th. Isotope analysis of water by means of near-infrared dual-wavelength diode laser spectroscopy. Opt. Express 2003, 11, 1566–1576. [Google Scholar]
- Nadezhdinsky, A.I.; Shapovalov, Y.P.; Ponurovsky, Ya.Ya.; Popov, I.P.; Stavrovsky, D.B.; Khattatov, V.U.; Galaktionov, V.V.; Kuzmichev, A.S. Preliminary results of an aircraft system based on near-IR diode lasers for continuous measurements of the concentration of methane, carbon dioxide, water and its isotopes. Appl. Phys. B 2012, 109, 505–510. [Google Scholar]
- Kerstel, E.R.Th.; van Trigt, R.; Dam, N.; Reuss, J.; Meijer, H.A.J. Simultaneous determination of the 2H/1H, 17O/16O, and 18O/16O isotope abundance ratios in water by means of laser spectrometry. Anal. Chem. 1999, 71, 5297–5303. [Google Scholar]
- Dyroff, C.; Fütterer, D.; Zahn, A. Compact diode-laser spectrometer ISOWAT for highly sensitive airborne measurements of water-isotope ratios. Appl. Phys. B 2010, 98, 537–548. [Google Scholar]
- Webster, C.R.; Heymsfield, A.J. Waterisotope ratios D/H, 18O/16O, 17O/16O in and out of clouds map dehydration pathways. Science 2003, 302, 1742–1745. [Google Scholar]
- Sayres, D.S.; Moyer, E.J.; Hanisco, T.F.; St.Clair, J.M.; Keutsch, F.N.; O'Brien, A.; Allen, N.T.; Lapson, L.; Demusz, J.N.; Rivero, M.; et al. A new cavity based absorption instrument for detection of water isotopologues in the upper troposphere and lower stratosphere. Rev. Sci. Instrum. 2009, 80, 044102. [Google Scholar]
- Iannone, R.Q.; Romanini, D.; Cattani, O.; Meijer, H.A.J.; Kerstel, E.R.Th. Water isotope ratio (δ2H and δ18O) measurements in atmospheric moisture using an optical feedback cavity enhanced absorption laser spectrometer. J. Geophys. Res. 2010, 115. [Google Scholar] [CrossRef]
- Kerstel, E.R.Th.; Iannone, R.Q.; Chenevier, M.; Kassi, S.; Jost, H.-J.; Romanini, D. A water isotope (2H, 17O, and 18O) spectrometer based on optical feedback cavity-enhanced absorption for in situ airborne application. Appl. Phys. B 2006, 85, 397–406. [Google Scholar]
- Lis, G.; Wassenaar, L.I.; Hendry, M.J. High-precision laser spectroscopy D/H and 18O/16O measurements of microliter natural water samples. Anal. Chem. 2008, 80, 287–293. [Google Scholar]
- Berman, E.S.F.; Levin, N.E.; Landais, A.; Li, S.; Owano, T. Measurement of δ18O, δ17O, and17O excess in Water by Off-Axis Integrated Cavity Output Spectroscopy and Isotope Ratio Mass Spectrometry. Anal. Chem. 2013, 85, 10392–10398. [Google Scholar]
- Kurita, N.; Newman, B.D.; Araguas-Araguas, L.J.; Aggarwal, P. Evaluation of continuous water vapor δD and δ18O measurements by off-axis integrated cavity output spectroscopy. Atmos. Meas. Tech. 2012, 5, 2069–2080. [Google Scholar]
- Gupta, P.; Noone, D.; Galewsky, J.; Sweeney, C.; Vaughn, B.H. Demonstration of high-precision continuous measurements of water vapor isotopologues in laboratory and remote field deployments using wavelength-scanned cavity ring-down spectroscopy (WS-CRDS) technology. Rapid Commun. Mass Spectrom. 2009, 23, 2534–2542. [Google Scholar]
- Arienzo, M.M.; Swart, P.K.; Vonhof, H.B. Measurement of δ18O and δ2H values of fluid inclusion water in speleothems using cavity ring-down spectroscopy compared with isotope ratio mass spectrometry. Rapid Commun. Mass Spectrom. 2013, 27, 2616–2624. [Google Scholar]
- Steig, E.J.; Gkinis, V.; Schauer, A.J.; Schoenemann, S.W.; Samek, K.; Hoffnagle, J.; Dennis, K.J.; Tan, S.M. Calibrated high-precision 17Oexcess measurements using laser-current tuned cavity ring-down spectroscopy. Atmos. Meas. Tech. Discuss. 2013, 6, 10191–10229. [Google Scholar]
- Godoy, J.M.; Godoy, M.L.D.P.; Neto, A. Direct determination of δ(D) and δ(18O) in water samples using cavity ring down spectrometry: Application to bottled mineral. J. Geochem. Explor. 2012, 119–120, 1–5. [Google Scholar]
- Wu, T.; Chen, W.; Kerstel, E.; Fertein, E.; Gao, X.; Koeth, J.; Röβner, K.; Bruekner, D. Kalman Filtering Real-Time Measurements of H2O Isotopologue Ratios by Laser Absorption Spectroscopy at 2.73 μm. Opt. Lett. 2010, 35, 634–636. [Google Scholar]
- Rothman, L.S.; Jacquemart, D.; Barbe, A.; Chris Benner, D.; Birk, M.; Brown, L.R.; Carleer, M.R.; Chackerian, C.; Chance, K.; Coudert, L.H.; et al. The HITRAN 2004 molecular spectroscopic database. J. Quant. Spectrosc. Radiat. Transfer 2005, 96, 139–204. [Google Scholar]
- Bohkle, J.K.; Coplen, T.B. Reference and Intercomparison Materials for Stable Isotopes of Light Elements. Proceedings of the IAEA-TECDOC-825 Consultants Meeting Held in Vienna, Vienna, Austria, 1–3 December 1993.
- Martin, P.; Gröning, M. Reference Sheet for VSMOW2 and SLAP2 International Measurement Standards; International Atomic Energy Agency: Vienna, Austria, 2009; pp. 1–5. [Google Scholar]
- Rehle, D.; Leleux, D.; Erdelyi, M.; Tittel, F.; Fraser, M.; Friedfeld, S. Formaldehyde Detection with a Laser Spectrometer based on Difference Frequency Generation in PPLN. Appl. Phys. B 2001, 72, 947–952. [Google Scholar]
- Ouyang, X.; Varghese, P.L. Reliable and efficient program for fitting Galatry and Voigt profiles to spectral data on multiple lines. Appl. Opt. 1989, 28, 1538–1545. [Google Scholar]
- Berman, P.R. Speed-dependent collisional width and shift parameters in spectral profiles. J. Quant. Spectrosc. Radiat. Transfer 1972, 12, 1331–1342. [Google Scholar]
- Castrillo, A.; Dinesan, H.; Casa, G.; Galzerano, G.; Laporta, P.; Gianfrani, L. Amount-ratio determinations of water isotopologues by dual-laser absorption spectrometry. Phys. Rev. A 2012, 86, 052515. [Google Scholar]
- Werle, P.; Mücke, R.; Slemr, F. The limits of signal averaging in atmospheric trace-gas monitoring by tunable diode-laser absorption spectroscopy (TDLAS). Appl. Phys. B 1993, 57, 131–139. [Google Scholar]
- Bartlome, R.; Sigrist, M.W. Laser-based human breath analysis: D/H isotope ratio increase following heavy water intake. Opt. Lett. 2009, 34, 866–868. [Google Scholar]
- Riris, H.; Carlisle, C.B.; Warren, R.E. Kalman filtering of tunable diode laser spectrometer absorbance measurements. Appl. Opt. 1994, 33, 5506–5508. [Google Scholar]
- Leleux, D.P.; Claps, R.; Chen, W.; Tittel, F.K.; Harman, T.L. Applications of Kalman filtering to real-time trace gas concentration measurements. Appl. Phys. B 2002, 74, 85–93. [Google Scholar]
- Richter, D.; Wert, B.P.; Frid, A.; Weibring, P.; Walega, J.G.; White, J.W.C.; Vaughn, B.H.; Tittel, F.K. High-precision CO2 isotopologue spectrometer with a difference-frequency generation laser source. Opt. Lett. 2009, 34, 172–174. [Google Scholar]
- Croizé, L.; Mondelain, D.; Camy-Peyret, C.; Delmotte, M.; Schmidt, M. Precise measurements of the total concentration of atmospheric CO2 and 13CO2/12CO2 isotopic ratio using a lead-salt laser diode spectrometer. Rev. Sci. Instrum. 2008, 79, 043101. [Google Scholar]


| Reference | Isotopologue | Frequency (cm−1) | Intensity (10−23 cm·mol−1) | Ground state energy (cm−1) | Temp. coef. at 296 K (K−1) |
|---|---|---|---|---|---|
| H18OH | 7183.5858 | 0.62 | 733.7 | 6.9‰ | |
| [10,11] | H16OH | 7183.6858 | 0.31 | 661.6 | 5.7‰ |
| H17OH | 7183.7354 | 0.12 | 95 | −3.4‰ | |
| H16OD | 7183.9727 | 0.035 | 156.4 | −2.5‰ | |
| H18OH | 1483.9261 | 8.4 | 550.5 | 4.1‰ | |
| H16OD | 1484.1064 | 2.3 | 225.9 | −1.3‰ | |
| [16] | H16OH | 1484.2573 | 1.8 | 1899.0 | 26.2‰ |
| H17OH | 1484.5109 | 2.0 | 205.5 | −1.6‰ | |
| H18OH | 1484.9716 | 10.0 | 325.2 | 0.3‰ | |
| H16OH | 1485.1336 | 6.2 | 1907.6 | 26.4‰ | |
| H18OH | 3662.9196 | 2.1 | 398.3 | 1.5‰ | |
| [13,14] and our work | H16OH | 3663.0452 | 8.5 | 586.4 | 4.6‰ |
| H17OH | 3663.3213 | 7.2 | 224.3 | −1.4‰ | |
| H16OD | 3663.8419 | 1.2 | 100.4 | −3.4‰ |
| N | δ18O (SE) | δ17O (SE) | δ2H (SE) | |
|---|---|---|---|---|
| IRMS (CIO) | 3 | −24.62 (0.02) | −13.1 (0.1) | −187.7 (0.3) |
| IRLS (present work) | 5 | −24.83 (0.50) | −11.7 (0.3) | −186.2 (0.6) |
| Method / Time | Measurement precision | |||||
|---|---|---|---|---|---|---|
| δ18O (SD) | δ17O (SD) | δ2H (SD) | ||||
| Raw measurement / 1 s | 7.8 ‰ | 6.6 ‰ | 8.0 ‰ | |||
| Kalman filtering / 1 s | 1.4 ‰ | 1.1 ‰ | 1.5 ‰ | |||
| Averaging 30-δ / 30 s | 0.8 ‰ | 0.6 ‰ | 0.9 ‰ | |||
© 2014 by the authors; licensee MDPI, Basel, Switzerland. This article is an open access article distributed under the terms and conditions of the Creative Commons Attribution license ( http://creativecommons.org/licenses/by/3.0/).
Share and Cite
Wu, T.; Chen, W.; Fertein, E.; Masselin, P.; Gao, X.; Zhang, W.; Wang, Y.; Koeth, J.; Brückner, D.; He, X. Measurement of the D/H, 18O/16O, and 17O/16O Isotope Ratios in Water by Laser Absorption Spectroscopy at 2.73 ?m. Sensors 2014, 14, 9027-9045. https://doi.org/10.3390/s140509027
Wu T, Chen W, Fertein E, Masselin P, Gao X, Zhang W, Wang Y, Koeth J, Brückner D, He X. Measurement of the D/H, 18O/16O, and 17O/16O Isotope Ratios in Water by Laser Absorption Spectroscopy at 2.73 ?m. Sensors. 2014; 14(5):9027-9045. https://doi.org/10.3390/s140509027
Chicago/Turabian StyleWu, Tao, Weidong Chen, Eric Fertein, Pascal Masselin, Xiaoming Gao, Weijun Zhang, Yingjian Wang, Johannes Koeth, Daniela Brückner, and Xingdao He. 2014. "Measurement of the D/H, 18O/16O, and 17O/16O Isotope Ratios in Water by Laser Absorption Spectroscopy at 2.73 ?m" Sensors 14, no. 5: 9027-9045. https://doi.org/10.3390/s140509027
APA StyleWu, T., Chen, W., Fertein, E., Masselin, P., Gao, X., Zhang, W., Wang, Y., Koeth, J., Brückner, D., & He, X. (2014). Measurement of the D/H, 18O/16O, and 17O/16O Isotope Ratios in Water by Laser Absorption Spectroscopy at 2.73 ?m. Sensors, 14(5), 9027-9045. https://doi.org/10.3390/s140509027