
Optical Nano Antennas: State of the Art, Scope and Challenges as a Biosensor Along with Human Exposure to Nano-Toxicology

Abstract
:1. Introduction
- (i)
- are point detectors which secure a recognition space of almost the square of the wavelength [2].
- (ii)
- combine optical radiation into minute volumes for generating currents in the wire which are identified by a rectifying component of almost 0.02 µm3 volume. This minute material volume permits one to achieve faster responses. Initial assessments of this response time are about 100 ns for devices without optimization [3]. Conversely, one of the rectifying tools employed in detecting the signal is constructed on the basis of a tunnel effect, which has a response time of approximately 10–14 s, 10–15 s [4].
- (iii)
- are known as polarization-sensitive sensors like the RF versions [2].
- (iv)
- are capable of being tuned to a particular wavelength region. At optical frequencies, the metallic structures have a lossy character and as a result, the resonances are likely to be widened, which possibly limits the tuning ability [5].
- (v)
- are directionally sensible subject to the metallic structure design and the addition of peripheral optical devices [6].
2. State of the Art
2.1. History of Optical Antennas

2.2. Physical Properties of Optical Antenna
2.2.1. Local Density of Electromagnetic States (LDOS)
2.2.2. Antenna Impedance
2.2.3. Antenna Efficiency

2.2.4. Directivity
2.2.5. Gain
2.2.6. Reciprocity
2.2.7. Antenna Aperture
2.2.8. Effective Wavelength
2.2.9. Conductivity of Antenna Materials
2.2.10. Antenna Resonance
2.3. Challenges and Outlook of Optical Antennas
2.3.1. Following the Analogy of RF Antenna

2.3.2. Impedance Matching
2.3.3. Electro-Optical Conversion
2.3.4. Selection Rules
2.3.5. Reproducibility and Repeatability

3. Optical Antennas as Biosensors

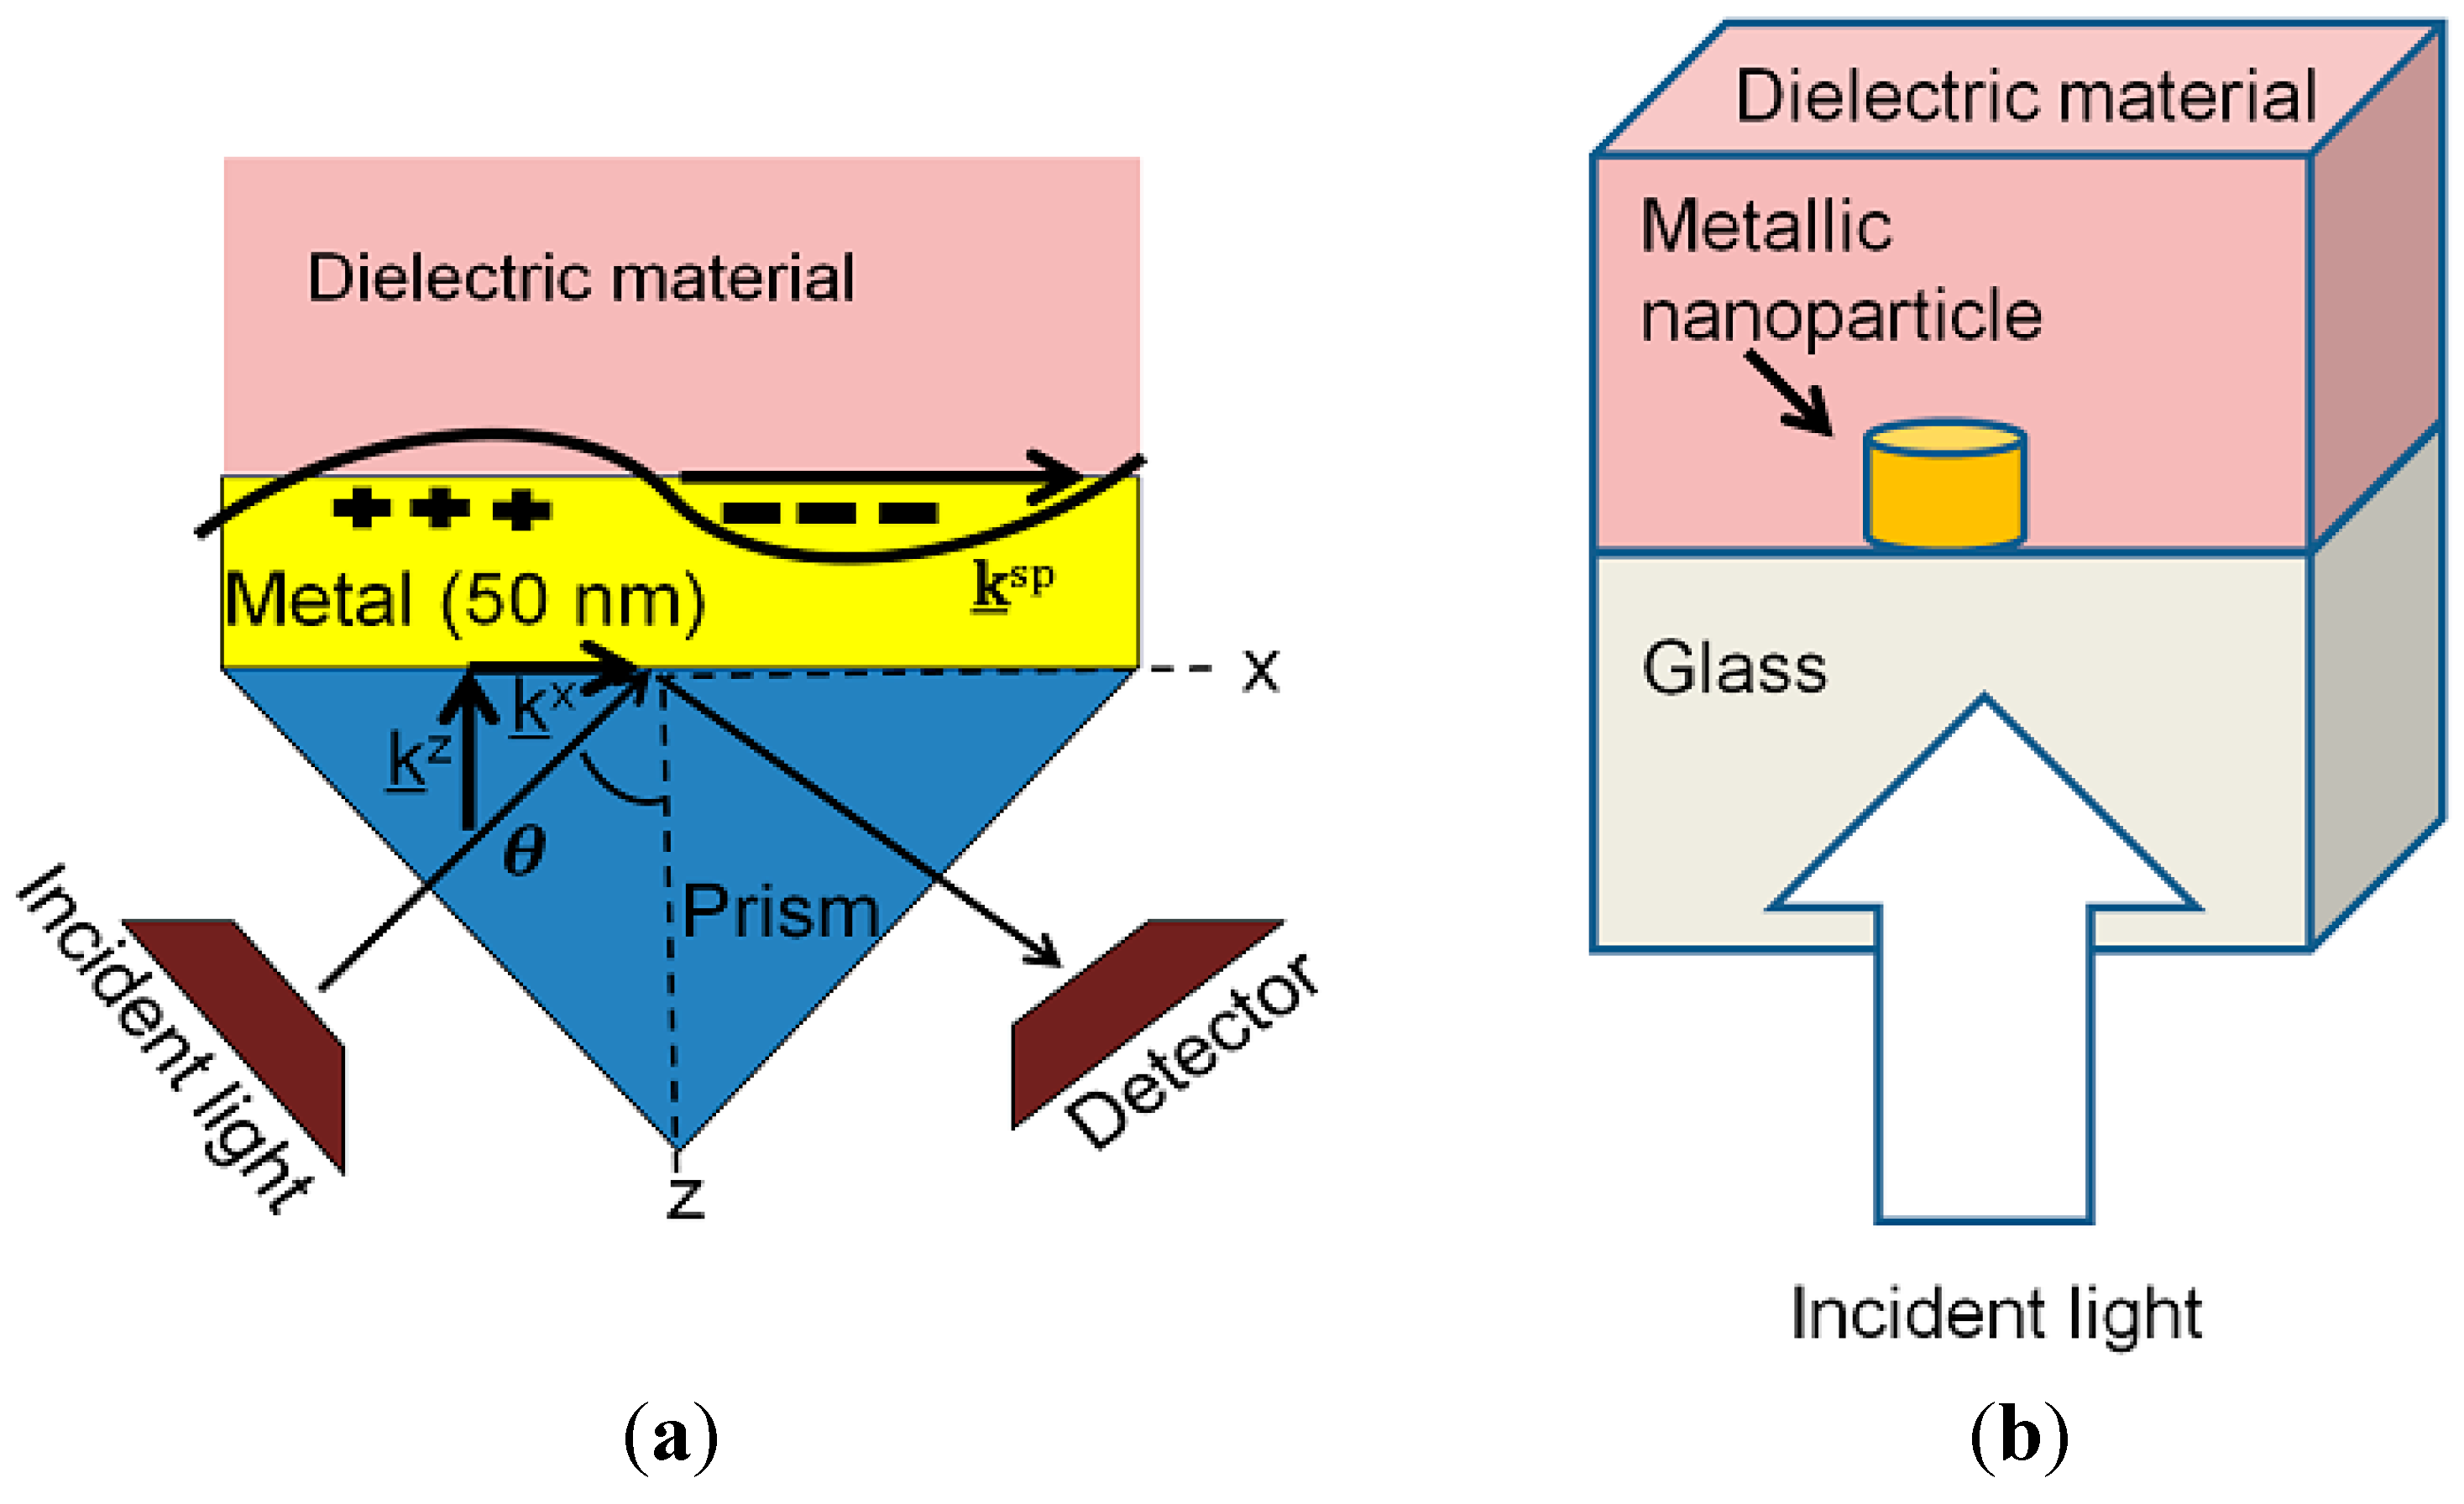
3.1. SPR Biosensors and Present Research

| Structure | Characteristics | Wavelength | Sensitivity | Reference |
|---|---|---|---|---|
| Kretschmann configuration | ||||
| Typical sensor | Au, Ag metal film | 400–800 nm | 100–300 deg./RIU | [88] |
| Ag film, low index prism | 1310 nm | 500 deg./RIU | [89] | |
| Au metal film | 500–1000 nm | 7500 nm/RIU, 10−8 RIU | [90] | |
| Over layer | Au and Si, ZrO2 thin film | 632.8 nm | 50–230 deg./RIU | [91] |
| Ag-Au bimetallic layer | 632.8 nm | 7.85 × 10⁻⁶ RIU | [92] | |
| Nanostructured sensor | Au nano cylindrical array | 632 nm | 10−7/RIU | [93] |
| Au nanorod metamaterial | 1200–1300 nm | 30,000 nm/RIU | [94] | |
| M-D mixed grating | 633 nm | ~120 deg./RIU | [95] | |
| Multichannel sensor | Dual channel, D over-layer | 550–1150 nm | 5 µg/mL α-DNA | [96] |
| Angled polishing prism | 500–900 nm | 2710, 8500 nm/RIU | [97] | |
| Fiber-Optic SPR sensors | ||||
| Symmetrical cladding off | Au, Ag metal film | 400–650 nm | 2000–4500 nm/RIU | [98] |
| Grating | Cascaded LPG | ~1520 nm | −23.45 nm/RIU | |
| Nano-structured sensor | Au metallic grating | 900–1600 nm | 4000–9800 nm/RIU | [98] |
| Nano-structured-coupling | ||||
| Grating coupling | Au surface grating | ~600 nm | 440 nm/RIU | |
| Al-Au bimetallic layer | 900 nm | 187.2 deg./RIU | [99] | |
| Metamaterial-like | Au nano-structured layer | ~150 THz (~2000 nm) | 588 nm/RIU | [100] |
| Nanoparticle based sensors | ||||
| Nano-structure | Single or double-square periodic nanoparticle array | 400–950 nm | 200–350 nm/RIU | [101] |
| Nanoparticle pair, disk pair | 500–900 nm | 172,434 nm/RIU | [102] | |
| Unperiodic array | 300–700 nm | 165 nm/RIU | [103] | |
| Gold nano-ring array | 300–1800 nm | 637.3 nm/RIU | [104] | |
| EOT based sensors | ||||
| Square nanohole array | 600–1000 nm | 300 nm/RIU | [88] | |
| Nanohole array | 1520–1570 nm | 1110, 1570 nm/RIU | [105] | |
| Fluoropolymer Substrates | ~600 nm | 323 nm/RIU | [106] | |
| Interferometer | ||||
| Mach-Zehnder type | ~1550 nm | 250 nm/RIU | [107] | |
| Two slit interference | 877.3 nm | 4547 nm/RIU | [108] | |
| Ring resonator | ||||
| Disk resonator | ~1460 nm | 600 nm/RIU | ||
| Triangular resonator | ~1555 nm | [109] | ||
3.1.1. Insecticide Detection
| Pesticide | Detection Range | Instrument | Reference |
|---|---|---|---|
| Atrazine | 0.05–1 ng/mL | Biacore | [111] |
| Simazine | 0.2 µg/L in | Integrated SPR | [112] |
| Atrazine | 5 ng/mL in | Biacore 2000 | [113] |
| Atrazine | 1 ng/L–1 mg/L | Biacore 2000 | [114] |
| 2,4-Dichlorophenol | 10–250 ppb | SPR-20 | [115] |
| 2,4-Dichlorophenoxyacetic acid (2,4-D) | 0.5 ng/mL–1 µg/mL | SPR-20 | [116] |
| Paraoxon | 1–100 ppb | L-SPR | [117] |
| Chlorpyrifos | 45–65 ng/L | β-SPR | [118] |
| Carbaryl | 1.38 µg/L | β-SPR | [119] |
3.1.2. Explosive Detection
| Explosive | Detection Range | Instrument | Reference |
|---|---|---|---|
| Trinitrotolene (TNT) | 8 ppt–30 ppb | SPR 670 M | [120] |
| 2,4,6-Trinitrophenol (TNP) | 10 ppt–100 ppb | SPR-760 | [121] |
| TNT | 0.09–1000 ng/mL | SPR-760 | [122] |
| TNT | 1 µg/mL | Spreeta | [123] |
| TNP | 0.1 ppb | SPR-760 | [124] |
| TNT | 95 ppt | SPR-760 | [125] |
| TNT | 1–10 pg/µL | SPR, QCM | [126] |
| TNT | 0.008–30 ng/mL | SPR-760 | [120] |
3.1.3. Environmental Pollutant Detection
| Pollutant | Detecting Range | Instrument | Reference |
|---|---|---|---|
| 2,3,7,8-Tetrachlorodibenzo-p-dioxin | 0.1 ng/mL | Biacore 2000 | [113] |
| 4-Nonylphenol | 2 ng/mL | Biacore Q | [127] |
| Phenol, hydroquinone, resorcinol, phloroglucinol, and catechol | 100 µg/mL | Intensity modulation SPR | [128] |
| Phenol | 5 µg | Multiscope SPR | [129] |
| Bisphenol A (BPA) | 10 ppb | SPR-20 | [115] |
| 3,3',4,4',5-pentachlorobiphenyl (PCB) | 2.5 ng/mL | Biacore 2000 | [113] |
| 2-Hydroxybiphenyl (HBP) | 0.1 ng/mL | Miniaturized SPR biosensor, 1-1, | [130] |
| Cadmium, zinc, and nickel | 0.1 ng/mL in buffer | Biacore SPR | [131] |
| Copper ions (Cu++) | 0.063 pg/mL–6.3 µg/mL | [132] |
3.1.4. Bacteria Detection
| Bacteria | Used Assay | Range of Detection | Instrument | References |
|---|---|---|---|---|
| Escherichia coli O157:H7 | Inhibition immunoassay | 0.1–1 × 10⁷ cfu/mL | Biacore | [136] |
| Escherichia coli O157:H7 | 104 cfu/mL | Multiscope SPR | [137] | |
| Escherichia coli O157:H7 | Direct immunoassay | 8.7 × 10⁶ cfu/mL | Spreeta | [138] |
| Escherichia coli O157:H7 | 106 cfu/mL in buffer 108 cfu/mL in apple juice | Reichert SR7000 SPR | [139,140] | |
| Escherichia coli O157:H7 | 105–107 cfu/mL | Custom made | [141,142] | |
| Salmonella typhimurium | 102–109 cfu/mL | Multiskop | [143] | |
| Salmonella paratyphi | 102–107 cfu/mL | Multiskop | [144] | |
| Salmonella enteritidis, Listeria monocytogenes | 106 cfu/mL | Custom made | [145] | |
| Listeria monocytogenes | 107 cfu/mL | Biacore 3000 SPR | [146] | |
| Bacillus subtilus spores | 107 spores/mL | Scattering SPR | [133] | |
| Staphylococcus aureus | 107 cfu/mL | Reichert SR7000 SPR | [147] | |
| Vibrio cholerae O l | 3.7×10⁵ cfu/mL | Multiskop | [148] | |
| Legionella pneumophila | 105 cfu/mL | Custom made | [149] | |
| Yersinia enterocolitica | 102–107 cfu/mL | Custom made | [150] | |
| Campylobacter jejuni | 1.1 × 10⁵ cfu/mL | Custom made | [141] | |
| Legionella pneumophila | 105 cfu/mL | Custom made | [149] | |
| E. coli O157:H7 | 105 cfu/mL | Multi-channel SPR | [150] | |
| Staphylococcus aureus | 104 cfu/mL | Spreeta | [151] | |
| E. coli O157:H7 | Sandwich immunoassay | 1.4 × 10⁴ cfu/mL | Custom made | [141] |
| S. choleraesuis | 4.4 × 10⁴ cfu/mL | |||
| L. monocytogenes | 3.5 × 10³ cfu/mL | |||
| C. jejuni | 1.1 × 10⁵ cfu/mL | |||
| Escherichia coli O157:H7 | 5–7 × 10⁷ cfu/mL | Biacore | [151] | |
| Salmonella strains from groups A, B, D, and E | 1.7 × 10³ cfu/mL | Biacore | [152] | |
| Staphylococcus aureus | 105 cfu/mL | Reichert SR7000 SPR | [147] | |
| Listeria monocytogenes | Subtractive inhibition immunoassay | 105 cfu/mL in less than 30 min | Biacore 3000 | [153] |
| Listeria monocytogenes | 105 cfu/mL | Biacore 3000 | [154] |
3.1.5. Virus Detection
| Detected Virus | Used Assay | Detection Limit | Instrument | Reference |
|---|---|---|---|---|
| Epstein-Barr virus | Direct immunoassay | 0.2 ng/mL | Custom-made | [155] |
| Hepatitis B | Direct immunoassay | 9.2 nm | Spreeta | [156] |
| Sandwich immunoassay | 4.39 nm | |||
| Peroxidase–anti-peroxidase complex | 0.62 nm | |||
| Cowpea mosaic virus | Direct immunoassay | Biacore | [157] | |
| Human immunodeficiency virus type 1 (HIV 1) | Using specific hybridization of immobilized biotinylated HIV-1 | Biacore 1000 | [158] |
3.1.6. Toxin Detection
| Toxin | Assay | Matrix | Detection Range | Instrument | Reference |
|---|---|---|---|---|---|
| Staphylococcal enterotoxin B (SEB) | Direct Immunoassay | Buffer | 5 ng/mL | Wavelength Modulation SPR | [159] |
| Sandwich Immunoassay | Buffer and milk | 0.5 ng/mL | |||
| SEB | Sandwich immunoassay | Buffer | 2.5–50 ng/mL | Biacore 1000 | [160] |
| SEB | Competitive immunoassay | Buffer | 0.78–50 ng/mL | Biacore 1000 | [161] |
| Whole and skimmed milk | 0.312–25 ng/mL | ||||
| SEB | Direct immunoassay | Buffer | In ng range | Fiber-optic SPR | [162] |
| SEB | Direct assay | Buffer | In nm range | Spreeta | [163] |
| Sandwich immunoassay | In fm range | ||||
| Aflatoxins B1 | Inhibition immunoassay | Buffer | 3–100 ng/mL | Biacore 1000 | [164] |
| Fumonisin B1 (FB1) | Direct immunoassay | Buffer | 50 ng/mL | Custom-built SPR | [165] |
| Deoxynivalenol | Inhibition immunoassay | Naturally contaminated wheat samples in buffer | 2.5–30 ng/mL | Biacore Q | [166] |
| Domoic acid | Inhibition immunoassay | Buffer | 0.1–1000 ng/mL | Custom-built | [167] |
| Competitive immunoassay | 3 ppb (10 nM), from 4–60 ppb (13–200 nM) | Six-channel SPR, Spreeta | [168] | ||
| Competitive immunoassay | Buffer | 2 ng/mL to 3.3 µg/mL | Biacore 3000 | [169] | |
| Tetanus | Direct immunoassay | Buffer | 0.028 Lf/mL | Wavelength modulation SPR | [170] |
3.1.7. Allergen Detection
| Allergen | Detection Limit | Instrument | Reference |
|---|---|---|---|
| Peanut proteins | 0.7 µg/mL | Miniaturized SPR Biosensor | [171] |
| Soy, pea, and soluble wheat proteins allergens | Below 0.1% of plant protein in the total milk protein content | Biacore 3000 | [172] |
| β-Casein | 85 ng/mL | Biacore 3000 | [173] |
| Histamine (3-imidazole) | 3 ppb | SPR 20 | [174] |
| Pollen of perennial rye grass | Biacore | [175] |
3.1.8. Biomedical Analyte Detection
| Analyte | Matrix | Assay | Detection Range | Instrument | Reference | ||||||
|---|---|---|---|---|---|---|---|---|---|---|---|
| Myocardial-damage markers | |||||||||||
| Myoglubin and Tropinon I | Buffer | Direct immunoassay | 3 ng/mL | Two-channel multi-mode SPR | [176] | ||||||
| Tropinin T | Direct immunoassay | 0.01 ng/mL | SPR | [177] | |||||||
| Human Tropinone I | Direct assay | 2.5–40 ng/mL | Wavelength modulation SPR | [178] | |||||||
| Sandwich immunoassay | 0.5-20 ng/mL | ||||||||||
| Fatty acid binding protein (H-FABP) | Buffer | Competitive immunoassay | 200 ng/mL | Planar SPR and fiber optic-SPR | [179] | ||||||
| Cancer markers | |||||||||||
| Prostate-Specific Antigen (PSA) | Buffer | Direct assay | 0.15 ng/mL | IBIS II dual channel SPR | [180] | ||||||
| Sandwich immunoassays | 2.4 ng/mL | ||||||||||
| Serum | Direct enhancement | 10 ng/mL | Biacore 2000 | [181] | |||||||
| Interleukin-8 (IL-8) | Buffer | Sandwich immunoassay | 2.5 pM | Biacore | [182] | ||||||
| Saliva | 184 pM | ||||||||||
| Hormones | |||||||||||
| Estrone and estradiol | Buffer | Inhibition immunoassay | 0.01–3000 ng/mL | Biacore | [183] | ||||||
| 17-β-Estradiol | Buffer | Inhibition immunoassay | 0.47–21.4 nM | [184] | |||||||
| Progesterone | Buffer | Indirect inhibition immunoassay | 143 pg/mL | Biacore | [185] | ||||||
| Insulin growth factor-1 | Milk | Direct immunoassay | 0.5–1 ng/mL | Biacore | [186] | ||||||
| Human chronic gonadotropin (hCG) | Buffer | 0.05–1 µg/mL | [187] | ||||||||
| Drugs | |||||||||||
| Morphine | Buffer | Inhibition immunoassay | 0.1–10 ng/mL | SPR and QCM | [188] | ||||||
| Morphine-3 glucronide (M3G) | Buffer | Indirect inhibition immunoassay | 0.7 ng/mL | Biacore 1000 | [189] | ||||||
| Dilute urine | 2.4 ng/mL | ||||||||||
| Anti-thrombotic agent Fragmin | Buffer | Inhibition immunoassay | 625 ng/mL | Biacore 3000 | [190] | ||||||
| 7-Hydroxycoumarin | Diluted serum | Competitive and Inhibition immunoassays | 0.5–80 µg/mL | Biacore | [191] | ||||||
| Oral anticoagulant 4'-aminowarafrin | Plasma samples | Inhibition immunoassay | 4–250 ng/mL | Biacore 3000 | [192] | ||||||
| β-Lactam antibiotics | Milk | Direct inhibition | 4 µg/kg | Biacore 3000 | [193] | ||||||
| β-Lactam antibiotics (penicillin G) | Milk | Inhibition immunoassay | 1.2 µg/kg | Biacore Q | [194] | ||||||
3.2. LSPR Biosensors and Associated Surface Enhanced Phenomena
| Different Parameter | SPR | LSPR |
|---|---|---|
| Refractive index sensitivity | ~2 × 10⁶ nm/RIU | ~2 × 10² nm/RIU |
| Overall sensitivity | The sensitivity of LSPR sensors are better than that of the traditional SPR sensors without metallic nanostructures | |
| Decay length | ~200 nm | ~6 nm |
| Throughput | LSPR technology has high-throughput screening capabilities in a highly compact design | |
| Controls over angle of incidence | Needs precise control | No precise control is needed |
| Controls over ambient temperature | Needs precise control | No precise control is needed |
| Nature of Measurement | Invasive | Non-invasive |
| Use in in vivo quantification | LSPR is better for in vivo quantification than SPR | |
3.2.1. Wavelength-Shift Based Application
| Structure | Dimension (nm) | λLSPR (nm) | Sensitivity (nm/RIU) | FOM 1 (RIU−1) | References |
|---|---|---|---|---|---|
| Gold nanoparticles | |||||
| Nanospheres | 15 | 520 | 44 | 0.6 | [197,201, 202] |
| 50 | 60 | ||||
| 30 | 71 | ||||
| 13 | 76 | ||||
| Nanobranches | 80 | 1141 | 703 | 0.8 | [202] |
| Nanoshells hollow | 50 | 680 | 409 | [201] | |
| Nanoshells/SiO2 core | 50–175 | Varies | 570–996 | [203] | |
| Nanorings | 75–150 | 1058–1545 | 880 | [204] | |
| Nanorods | 74 (d = 33) | 700 | 252 | [202,205] | |
| 40 | 653 | 195 | 2.6 | ||
| 55 | 728 | 224 | 2.1 | ||
| 74 (d = 17) | 846 | 288 | 1.7 | ||
| Nanorice core | 9.8–27.5 | 1160 | 800 | [206] | |
| Nanocubes | 44 | 538 | 83 | 1.5 | [202] |
| Nanobipyramids | 27–189 | 645 | 15 | 1.7 | [202] |
| 50 | 735 | 212 | 2.8 | ||
| 103 | 886 | 392 | 4.2 | ||
| 189 | 1096 | 540 | 4.5 | ||
| Nanostars | 100 | 647,700,783 | 879 2 | 10.7 | [207] |
| Metamaterial | 400 × 80 and 340 × 90 3 | 588 | 3.8 | [100] | |
| Silver nanoparticles | |||||
| Nanosphere | 40–90 | 400–480 | 160 | [208] | |
| Nanoprism | 55–120 | 600–700 | 200–350 | 2.3–3.3 | [208,209] |
| Nanoprism/Au coated | 21–22 | 940 | 470 | [210] | |
| Array (NSL) | Varies | 500–700 | 200 | [211] | |
| Nanocubes | 30 | 430 | 1569 4 | 5.4 | [212] |
3.2.2. Nano Plasmonic Molecular Rulers (PMRs) and PRET Biosensors
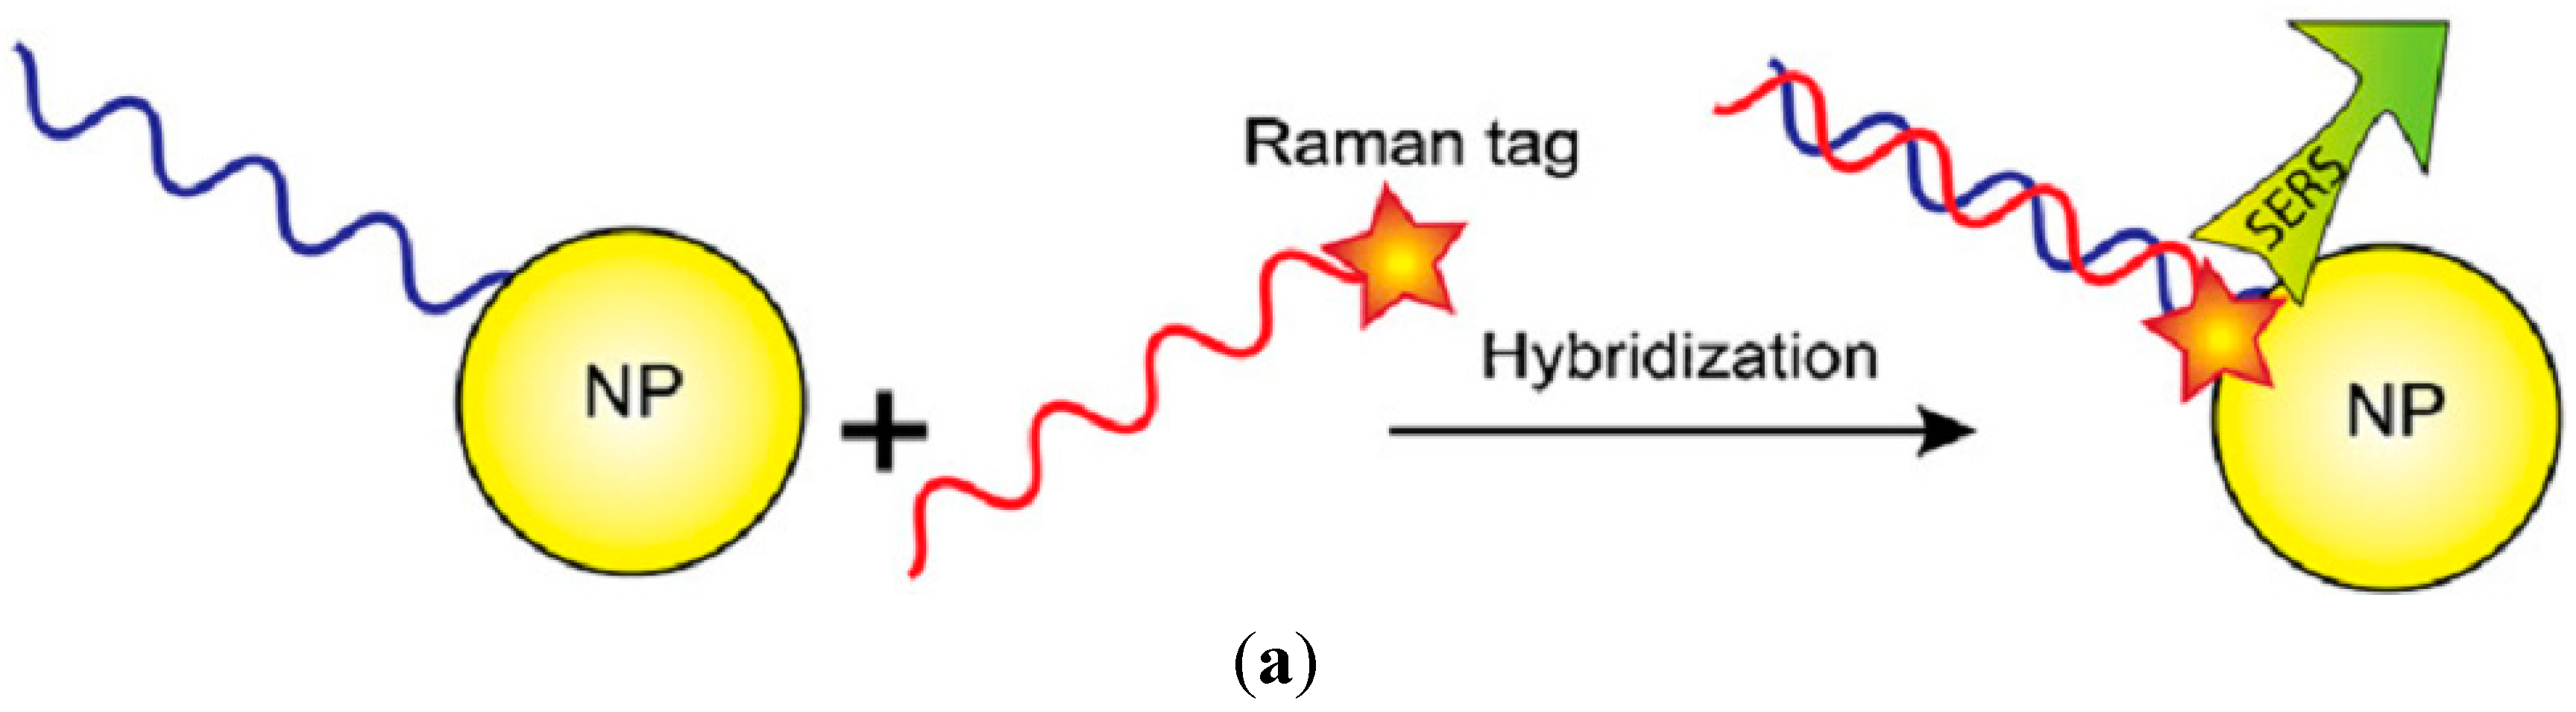
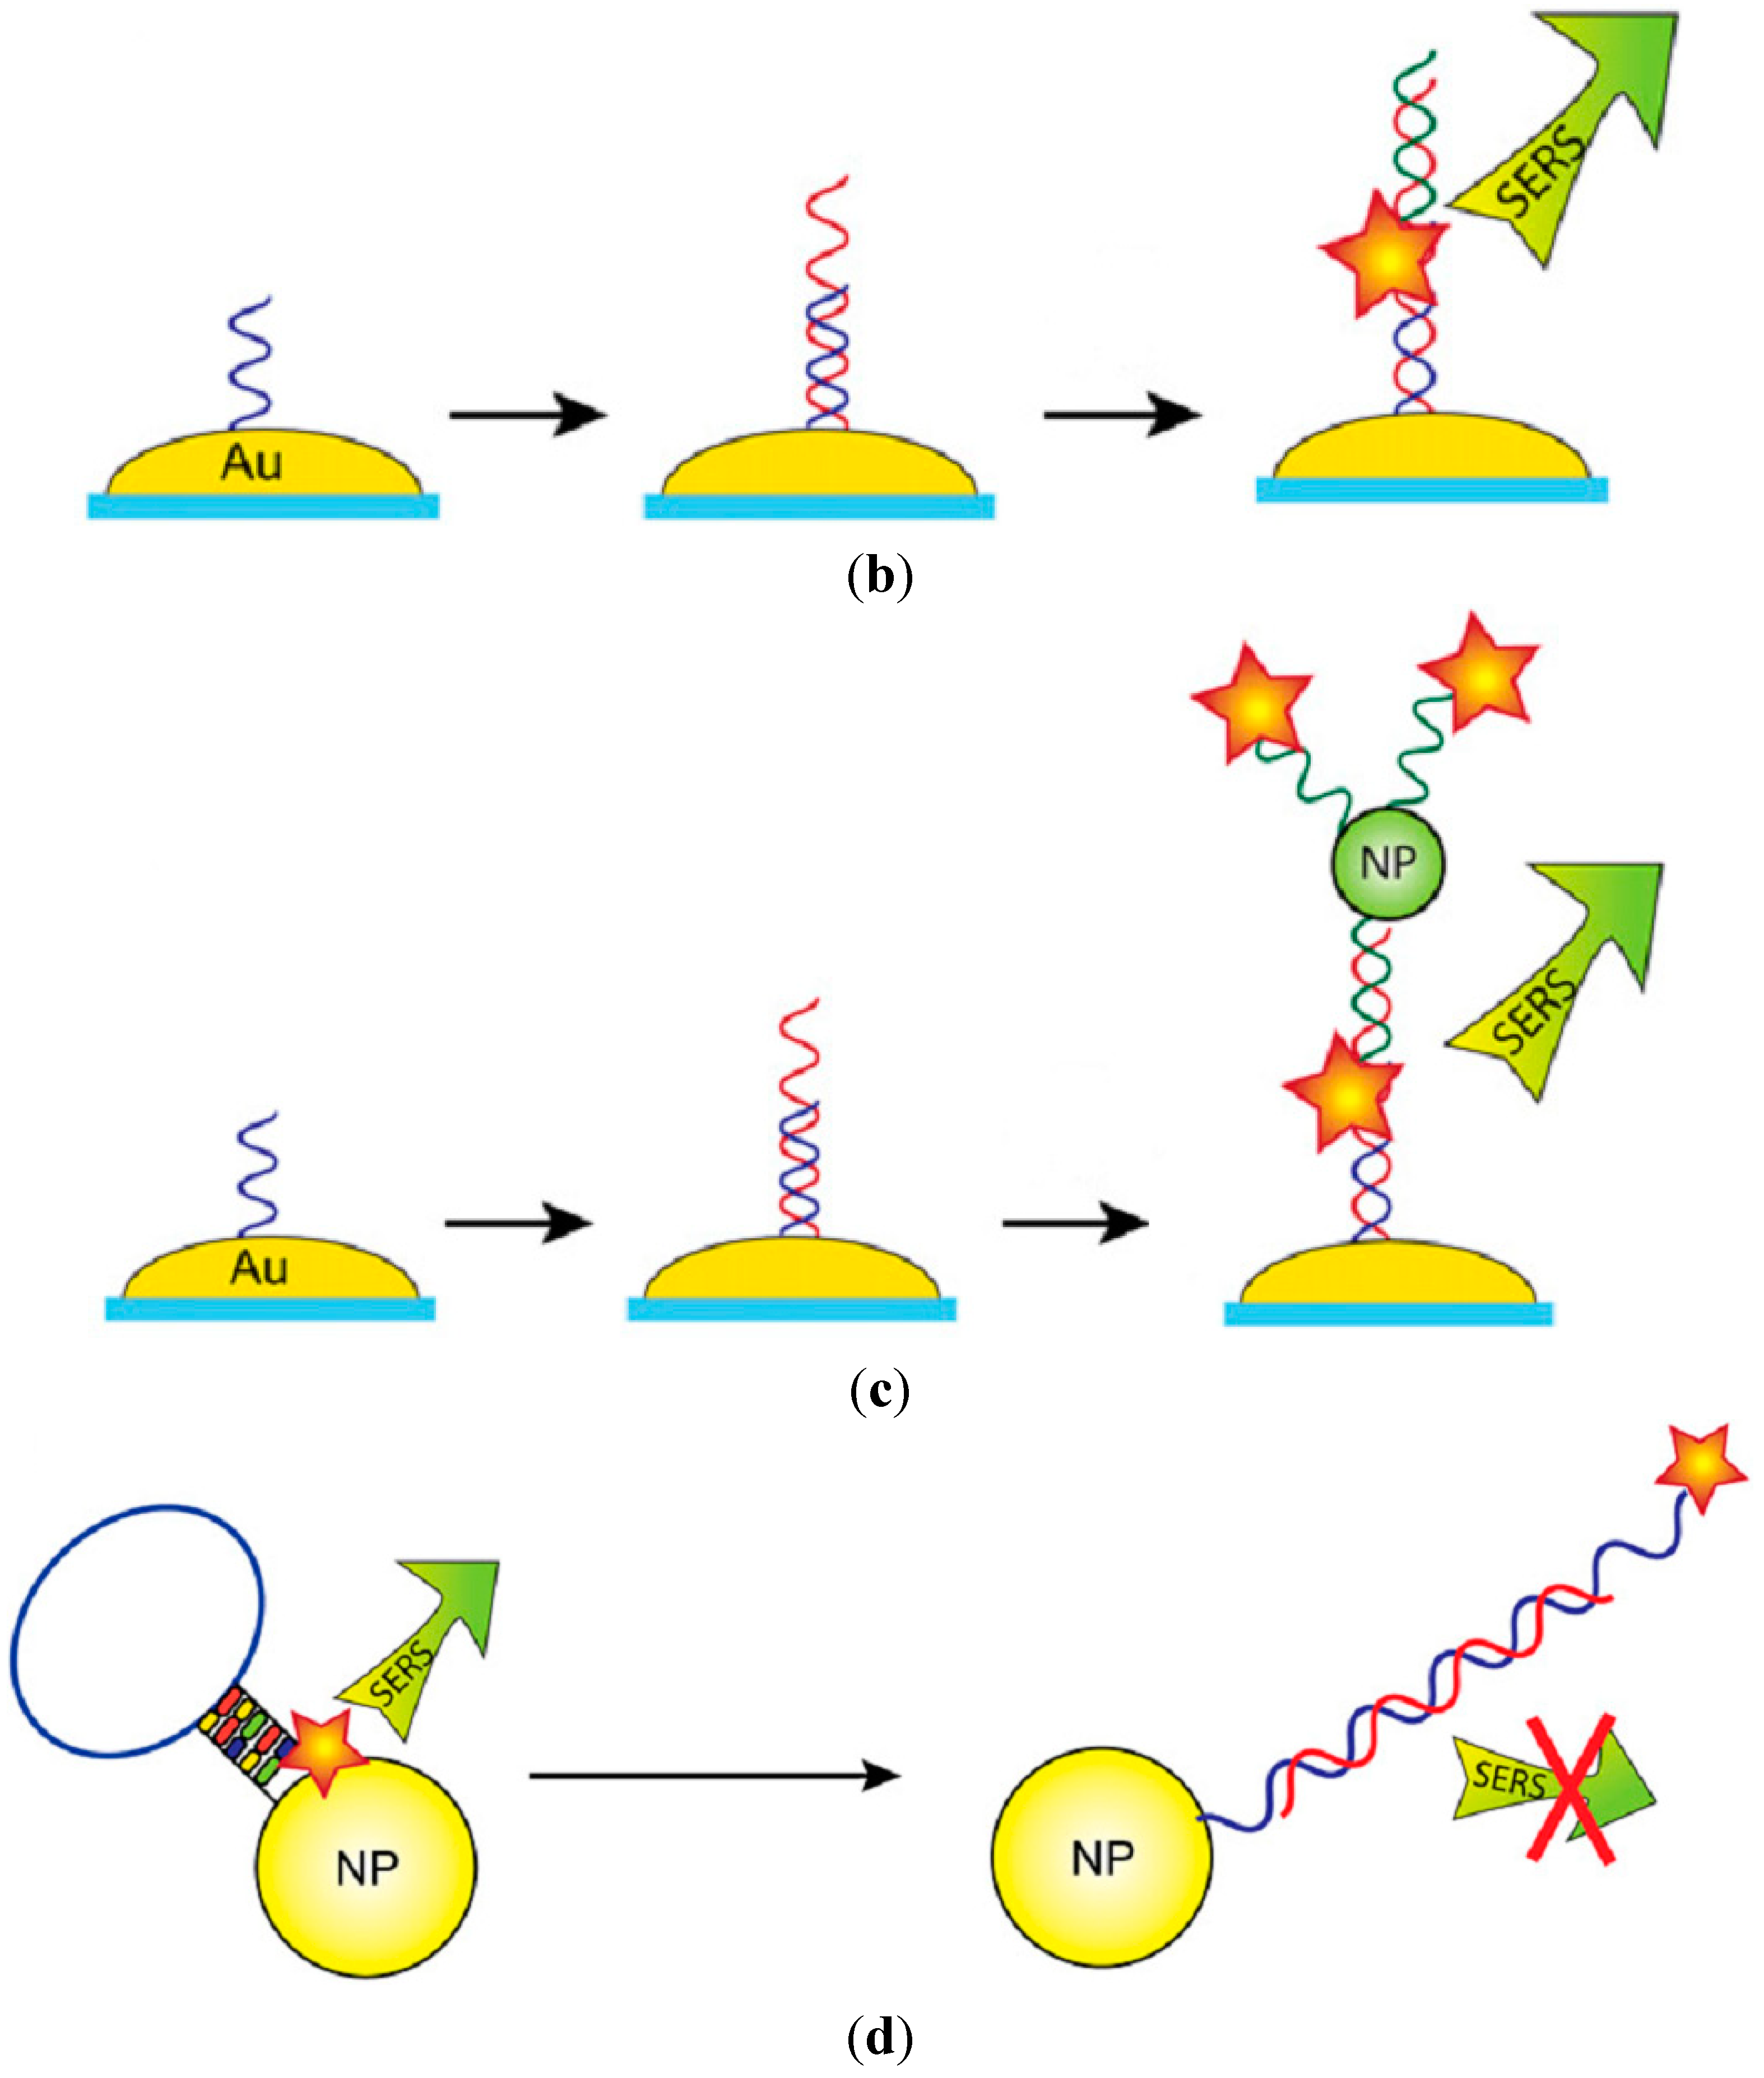
3.2.3. Nucleic Acid Hybridization Assays


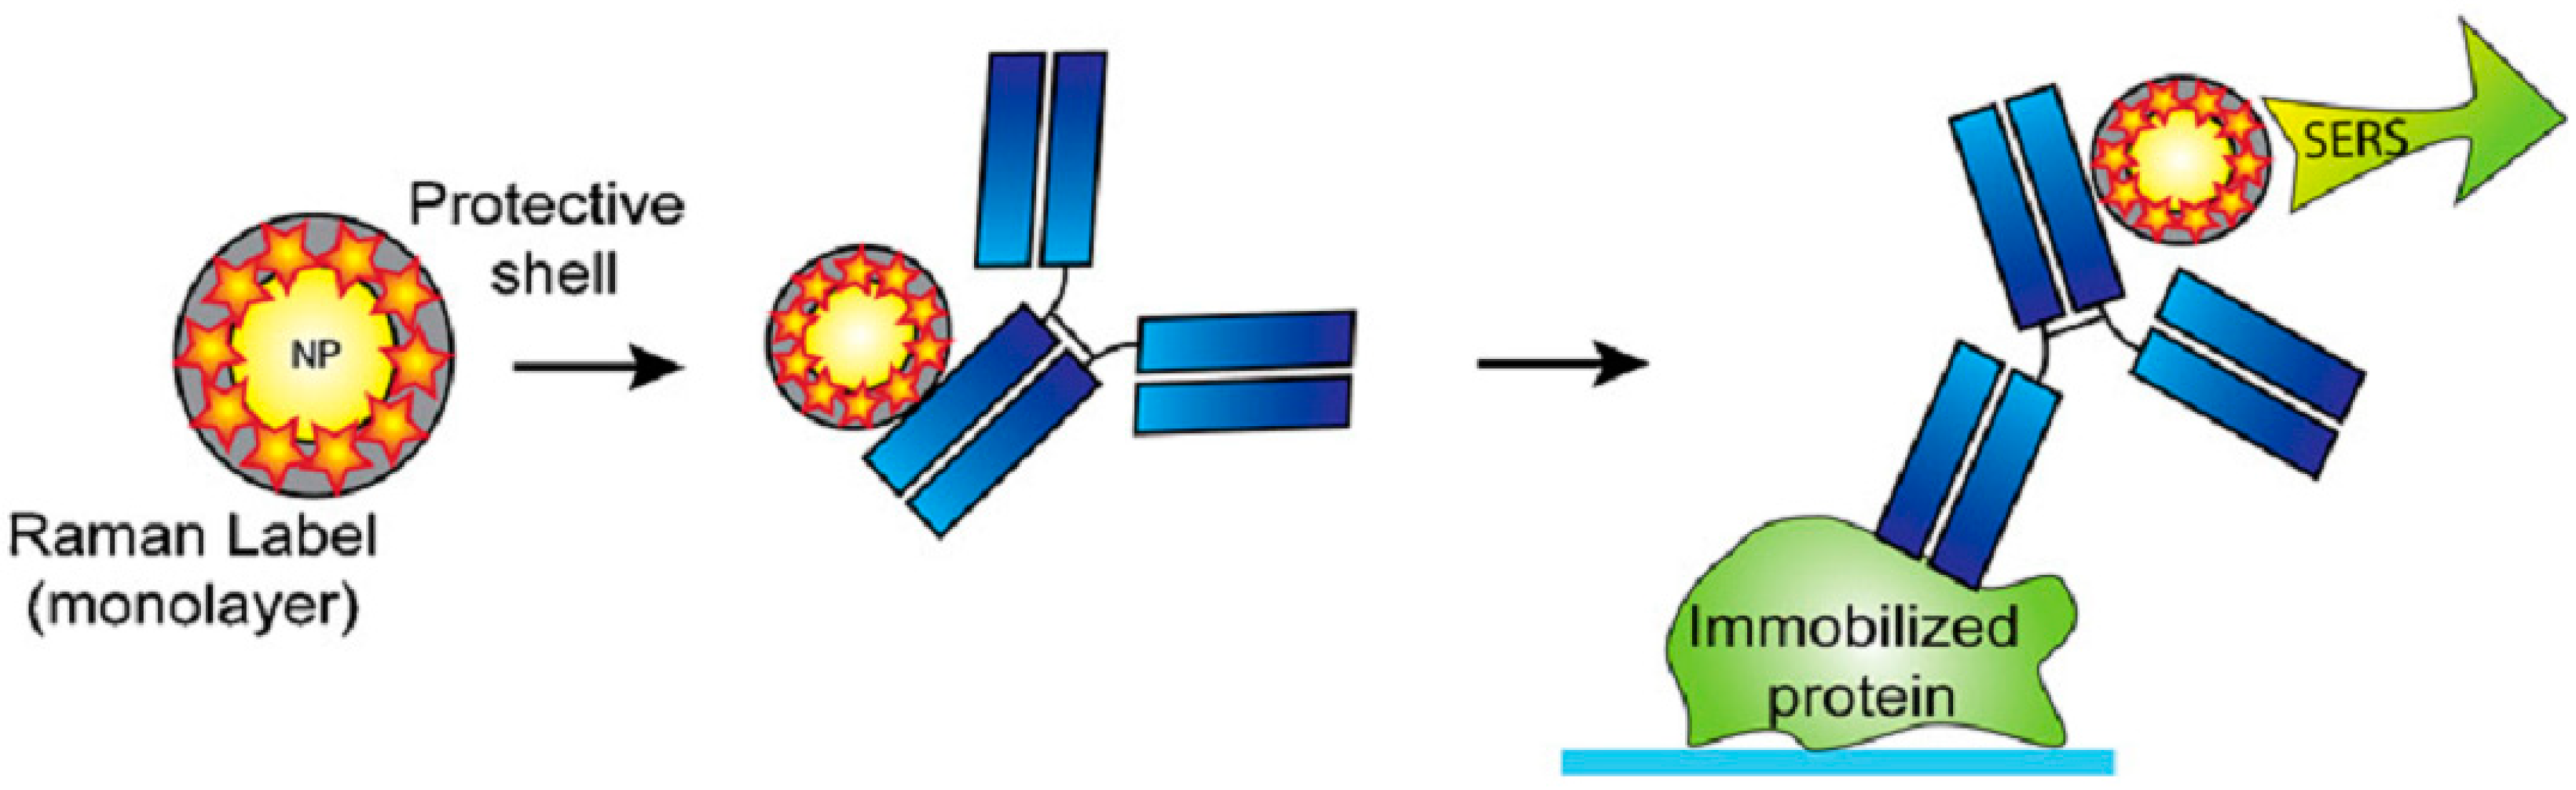
3.2.4. Protein Recognition Assays
3.2.5. Raman Labels

3.2.6. Intracellular Detection
3.3. Challenges of Designing Optical Bio-Sensors
- (i)
- The ultimate challenges in designing biosensors are proper understanding about the correlation among the construction, operation and dynamics of different biomolecules in living cells. Though modern techniques have made massive improvements in detecting the components of different cells, detection of molecular procedures in living cells remains a main objective.
- (ii)
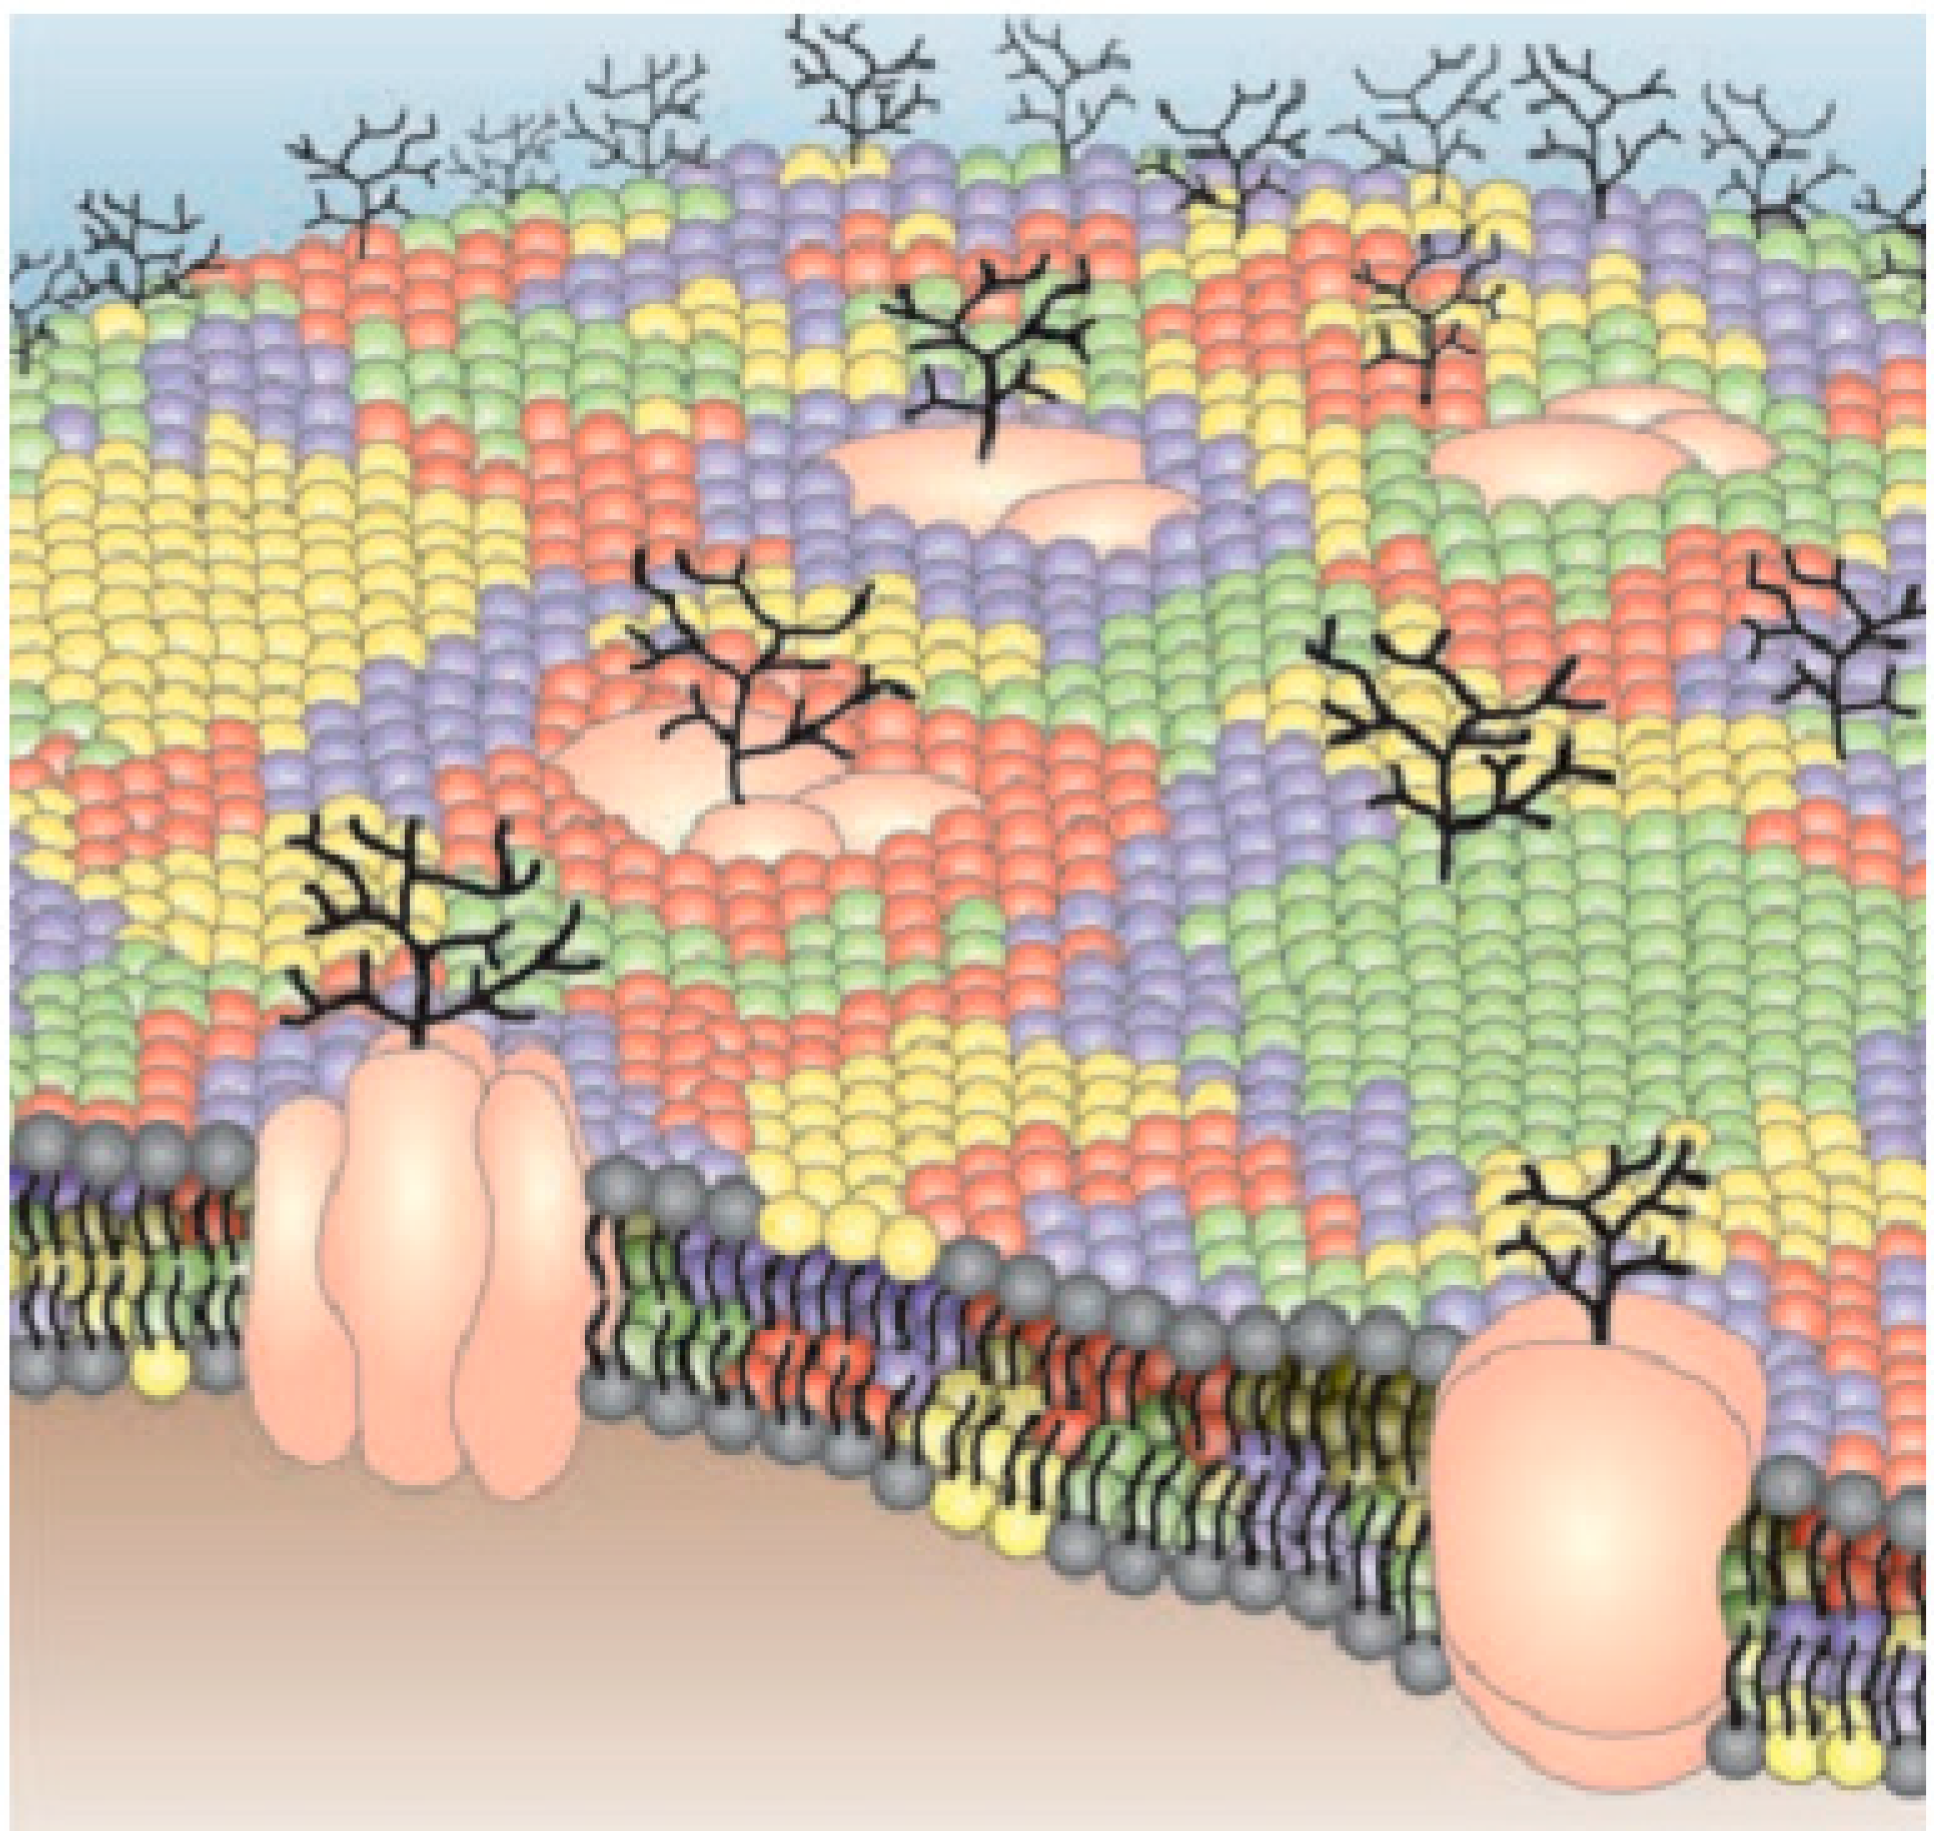
- Different multi-molecular relations that command different cell functions happen at the nanometer scale [242,243] (Figure 8). This size regime is not reachable by classical optics with the diffraction of light, so we need a proper understanding of nanophotonics by which we can overcome the limitations of classical optics.
- (iii)
- We need proper knowledge about the functionality and effects of nanoparticles before practical implementation.
- (iv)
- Reproducibility and precise fabrication of resonant antenna‒without precise fabrication, it is not possible to achieve the desired sensitivity and accuracy.
- (v)
- Once we have designed an optical antenna for biomedical applications, we must take time for enough study about the possible side effects. Therefore, a proper understanding about the effects of the specific antenna before practical implementation is a prerequisite [244].
- (vi)

| Constraints |
|---|
| Extensive difference of laboratory facilities among countries |
| Poor or missing peripheral quality control and laboratory certification systems |
| Erratic quality of reagents |
| Lack of important equipment |
| Shortage of consumables in laboratory |
| Undependable water supply and quality |
| Unreliable power supply and quality |
| Inconsistent capacity of refrigeration |
| Insufficient skilled staff |
| Limited training opportunities |
| Poor waste-management facilities |
3.3.1. Use of Nanoantenna Gratings for Tuning of Biosensors
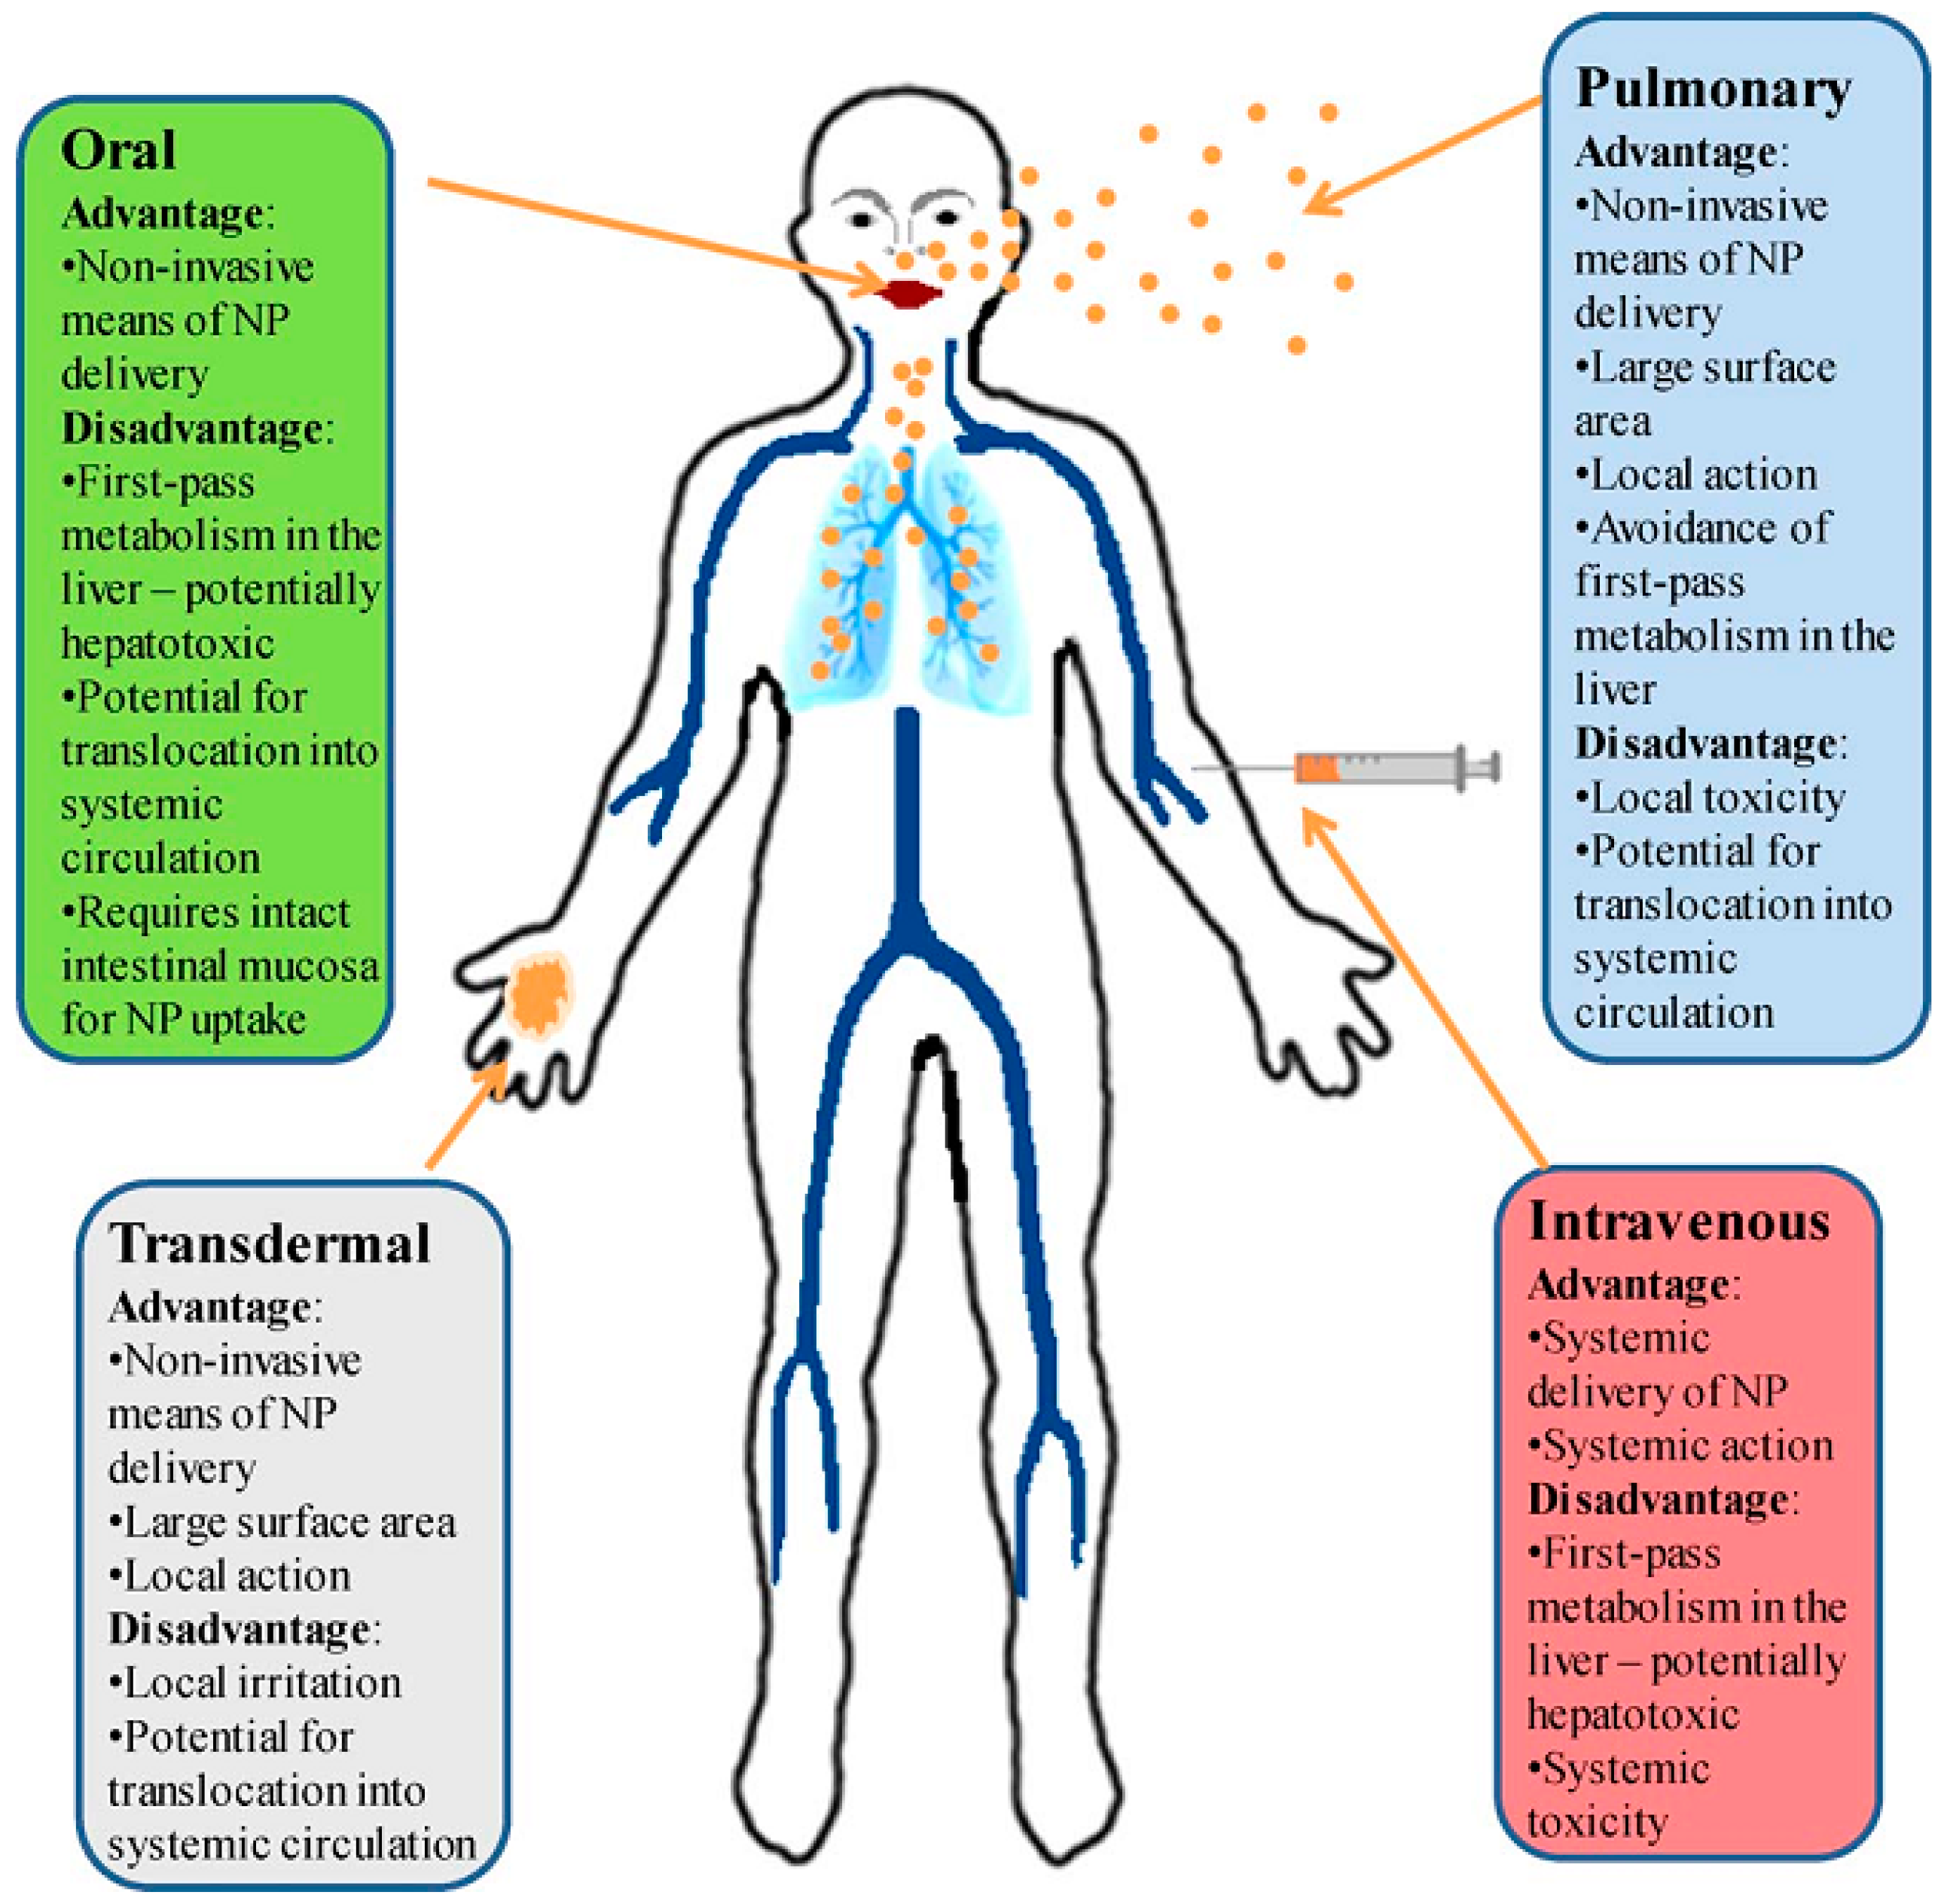
3.3.2. Human Exposure to Nanotoxicology
- (i)
- All of the nanostructures have their own optical, electronic, and magnetic properties associated with their dimensions. The breaking of these types of structures may cause a poisonous outcome.
- (ii)
- The surfaces of the nanostructure take part in many oxidative and catalytic reactions. If these responses produce cytotoxicity, the deadliness becomes superior for greater surface-to-volume ratio. This surface-to-volume ratio increases when the diameter of a spherical particle becomes smaller and due to this increased surface area, the chemical reactivity is increased. This is most significant for nanobiological relations.
- (iii)
- Many of the nanostructures have composites with well-known harmfulness and in consequence, the disintegration of these composites will possibly cause alike toxic reactions to the metals or composites themselves. Table 13 highlights the applications and concern surveys for the most frequently used nanostructures.
- (iv)
- Traditionally, toxicology is related to the conception of dose and reaction to a dose. In nanotoxicology, the evaluation of appropriate and realistic dose ranges is essential for achieving significant results from public health risk assumption experiments. Therefore, the nano-toxicologist ought to test the toxicity of nanoparticles on the basis of practical doses in spite of the impractically high doses for achieving a biological reaction.
- (v)
- The size of nanoparticles is at the same scale of protein molecules and they are capable of interfering with the signaling systems of cells. They also can interact with proteins, by chaperone-like action or by altering their configuration. This type of protein missformation leads to neurodegenerative infections. Inspecting probable missformation of proteins and macromolecules is vital for nanotoxicological research.
| Nanostructures | Applications | Concerns | References |
|---|---|---|---|
| Metal nanoparticles | Contrast agents; drug delivery | Element specific toxicity; reactive oxygen species | [249,252] |
| Nanoshells | Hyperthermia therapy | None demonstrated | [252,253] |
| Fullerenes | Vaccine adjuncts; hyperthermia therapy | Antibody generation | [252,254] |
| Quantum dots | Fluorescent contrast agent | Metabolism | [255,256] |
| Polymer nanoparticles | Drug delivery; therapeutics | Unknown | [257] |
| Dendrimer | Guest supply of drug | Metabolic path | [252,258] |
| Liposomes | Drug supply; contrast agent vehicle | Hypersensitivity reactions | [252,257] |
4. Prospective and Conclusions
Acknowledgments
Author Contributions
Conflicts of Interest
References
- Novotny, L.; van Hulst, N. Antennas for light. Nat. Photonics 2011, 5, 83–90. [Google Scholar] [CrossRef]
- Alda, J.; Fumeaux, C.; Codreanu, I.; Schaefer, J.A.; Boreman, G.D. Deconvolution method for two-dimensional spatial-response mapping of lithographic infrared antennas. Appl. Opt. 1999, 38, 3993–4000. [Google Scholar] [CrossRef] [PubMed]
- Gonzalez, F.J.; Gritz, M.A.; Fumeaux, C.; Boreman, G.D. Two dimensional array of antenna-coupled microbolometers. Int. J. Infrared Millim. Waves 2002, 23, 785–797. [Google Scholar] [CrossRef]
- Hauge, E.H.; Støvneng, J.A. Tunneling times: A critical review. Rev. Mod. Phys. 1989, 61, 917–936. [Google Scholar] [CrossRef]
- Codreanu, I.; Boreman, G.D. Integration of microbolometers with infrared microstrip antennas. Infrared Phys. Technol. 2002, 43, 335–344. [Google Scholar] [CrossRef]
- Fumeaux, C.; Gritz, M.A.; Codreanu, I.; Schaich, W.L.; González, F.J.; Boreman, G.D. Measurement of the resonant lengths of infrared dipole antennas. Infrared Phys. Technol. 2000, 41, 271–281. [Google Scholar] [CrossRef]
- Pitarke, J.M.; Silkin, V.M.; Chulkov, E.V.; Echenique, P.M. Theory of surface plasmons and surface-plasmon polaritons. Rep. Prog. Phys. 2007, 70. [Google Scholar] [CrossRef]
- Pohl, D.W. Near Field Optics Seen as an Antenna Problem. In Near-Field Optics; World Scientific: Singapore, 2000; pp. 9–21. [Google Scholar]
- Novotny, L. Effective wavelength scaling for optical antennas. Phys. Rev. Lett. 2007, 98, 266802-1–266802-4. [Google Scholar] [CrossRef] [PubMed]
- Wessel, J. Surface-enhanced optical microscopy. JOSA B 1985, 2, 1538–1541. [Google Scholar] [CrossRef]
- Fischer, U.C.; Pohl, D.W. Observation of single-particle plasmons by near-field optical microscopy. Phys. Rev. Lett. 1989, 62, 458–461. [Google Scholar] [CrossRef] [PubMed]
- Novotny, L.; Stranick, S.J. Near-field optical microscopy and spectroscopy with pointed probes. Annu. Rev. Phys. Chem. 2006, 57, 303–331. [Google Scholar] [CrossRef] [PubMed]
- D’Andrea, C.; Bochterle, J.; Toma, A.; Huck, C.; Neubrech, F.; Messina, E.; Fazio, B.; Marago, O.M.; di Fabrizio, E.; de la Chapelle, M.L.; et al. Optical nanoantennas for multiband surface-enhanced infrared and Raman spectroscopy. ACS Nano 2013, 7, 3522–3531. [Google Scholar] [CrossRef] [PubMed]
- David, C.; d’ Andrea, C.; Lancelot, E.; Bochterle, J.; Guillot, N.; Fazio, B.; Maragò, O.M.; Sutton, A.; Charnaux, N.; Neubrech, F.; et al. Raman and IR spectroscopy of manganese superoxide dismutase, a pathology biomarker. Vib. Spectrosc. 2012, 62, 50–58. [Google Scholar] [CrossRef]
- Li, L.; Yang, S.; Han, F.; Wang, L.; Zhang, X.; Jiang, Z.; Pan, A. Optical Sensor Based on a Single CdS Nanobelt. Sensors 2014, 14, 7332–7341. [Google Scholar] [CrossRef] [PubMed]
- Fetterman, H.R.; Clifton, B.J.; Tannenwald, P.E.; Parker, C.D. Submillimeter detection and mixing using Schottky diodes. Appl. Phys. Lett. 1974, 24, 70–72. [Google Scholar] [CrossRef]
- Fetterman, H.R.; Tannenwald, P.E.; Clifton, B.J.; Parker, C.D.; Fitzgerald, W.D.; Erickson, N.R. Far-ir heterodyne radiometric measurements with quasioptical Schottky diode mixers. Appl. Phys. Lett. 1978, 33, 151–154. [Google Scholar] [CrossRef]
- Alda, J.; Rico-García, J.M.; López-Alonso, J.M.; Boreman, G. Optical antennas for nano-photonic applications. Nanotechnology 2005, 16. [Google Scholar] [CrossRef]
- González, F.J.; Boreman, G.D. Comparison of dipole, bowtie, spiral and log-periodic IR antennas. Infrared Phys. Technol. 2005, 46, 418–428. [Google Scholar] [CrossRef]
- Djaker, N.; Brustlein, S.; Rohman, G.; Huot, S.; de la Chapelle, M.L.; Migonney, V. Characterization of a synthetic bioactive polymer by nonlinear optical microscopy. Biomed. Opt. Express 2014, 5, 149–157. [Google Scholar] [CrossRef]
- Grober, R.D.; Schoelkopf, R.J.; Prober, D.E. Optical antenna: Towards a unity efficiency near-field optical probe. Appl. Phys. Lett. 1997, 70, 1354–1356. [Google Scholar] [CrossRef]
- Farahani, J.N.; Pohl, D.W.; Eisler, H.-J.; Hecht, B. Single quantum dot coupled to a scanning optical antenna: A tunable superemitter. Phys. Rev. Lett. 2005, 95. [Google Scholar] [CrossRef]
- Taminiau, T.H.; Moerland, R.J.; Segerink, F.B.; Kuipers, L.; van Hulst, N.F. λ/4 resonance of an optical monopole antenna probed by single molecule fluorescence. Nano Lett. 2007, 7, 28–33. [Google Scholar] [CrossRef] [PubMed]
- Frey, H.G.; Witt, S.; Felderer, K.; Guckenberger, R. High-resolution imaging of single fluorescent molecules with the optical near-field of a metal tip. Phys. Rev. Lett. 2004, 93. [Google Scholar] [CrossRef] [PubMed]
- Schuller, J.A.; Barnard, E.S.; Cai, W.; Jun, Y.C.; White, J.S.; Brongersma, M.L. Plasmonics for extreme light concentration and manipulation. Nat. Mater. 2010, 9, 193–204. [Google Scholar] [CrossRef] [PubMed]
- Höppener, C.; Novotny, L. Antenna-based optical imaging of single Ca2+ transmembrane proteins in liquids. Nano Lett. 2008, 8, 642–646. [Google Scholar] [CrossRef] [PubMed]
- Van Zanten, T.S.; Lopez-Bosque, M.J.; Garcia-Parajo, M.F. Imaging Individual Proteins and Nanodomains on Intact Cell Membranes with a Probe-Based Optical Antenna. Small 2010, 6, 270–275. [Google Scholar] [CrossRef] [PubMed]
- Bharadwaj, P.; Deutsch, B.; Novotny, L. Optical antennas. Adv. Opt. Photonics 2009, 1, 438–483. [Google Scholar] [CrossRef]
- Kaloshin, G.; Lukin, I. An Acousto-Optical Sensor with High Angular Resolution. Sensors 2012, 12, 3739–3746. [Google Scholar] [CrossRef] [PubMed]
- Gevaux, D. Optical antennas: Nano-antenna picks up green light. Nat. Photonics 2007, 1, 90–90. [Google Scholar] [CrossRef]
- Novotny, L. Nano-optics: Optical antennas tuned to pitch. Nature 2008, 455, 887–887. [Google Scholar] [CrossRef]
- Greffet, J.-J. Nanoantennas for light emission. Science 2005, 308, 1561–1563. [Google Scholar] [CrossRef] [PubMed]
- Purcell, E.M. Spontaneous emission probabilities at radio frequencies. Phys. Rev. 1946, 69. [Google Scholar] [CrossRef]
- Drexhage, K.H.; Fleck, M. Wide-Angle Interference and Multipole Nature of Fluorescence and Phosphorescence of Organic Dyes. Berichte Bunsenges. Phys. Chem. 1968, 72, 330–330. [Google Scholar]
- Kleppner, D. Inhibited Spontaneous Emission. Phys. Rev. Lett. 1981, 47, 233–236. [Google Scholar] [CrossRef]
- Goy, P.; Raimond, J.M.; Gross, M.; Haroche, S. Observation of cavity-enhanced single-atom spontaneous emission. Phys. Rev. Lett. 1983, 50. [Google Scholar] [CrossRef]
- Wilson, M.A.; Bushev, P.; Eschner, J.; Schmidt-Kaler, F.; Becher, C.; Blatt, R.; Dorner, U. Vacuum-field level shifts in a single trapped ion mediated by a single distant mirror. Phys. Rev. Lett. 2003, 91. [Google Scholar] [CrossRef]
- Labeau, O.; Tamarat, P.; Courtois, H.; Agarwal, G.S.; Lounis, B. Laser-induced resonance shifts of single molecules self-coupled by a metallic surface. Phys. Rev. Lett. 2007, 98, 143003. [Google Scholar] [CrossRef] [PubMed]
- Huang, C.; Bouhelier, A.; des Francs, G.C.; Bruyant, A.; Guenot, A.; Finot, E.; Weeber, J.-C.; Dereux, A. Gain, detuning, and radiation patterns of nanoparticle optical antennas. Phys. Rev. B 2008, 78, 155407. [Google Scholar] [CrossRef]
- Shen, H.; Rouxel, J.; Guillot, N.; de la Chapelle, M.L.; Toury, T. Light polarization properties of three fold symmetry gold nanoparticles: Model and experiments. Comptes Rendus Phys. 2012, 13, 830–836. [Google Scholar] [CrossRef]
- Taminiau, T.H.; Stefani, F.D.; van Hulst, N.F. Enhanced directional excitation and emission of single emitters by a nano-optical Yagi-Uda antenna. Opt. Express 2008, 16, 10858–10866. [Google Scholar] [CrossRef] [PubMed]
- Shimizu, K.T.; Woo, W.K.; Fisher, B.R.; Eisler, H.J.; Bawendi, M.G. Surface-enhanced emission from single semiconductor nanocrystals. Phys. Rev. Lett. 2002, 89, 117401. [Google Scholar] [CrossRef] [PubMed]
- Bharadwaj, P.; Novotny, L. Spectral dependence of single molecule fluorescence enhancement. Opt. Express 2007, 15, 14266–14274. [Google Scholar] [CrossRef] [PubMed]
- Kinkhabwala, A.; Yu, Z.; Fan, S.; Avlasevich, Y.; Müllen, K.; Moerner, W.E. Large single-molecule fluorescence enhancements produced by a bowtie nanoantenna. Nat. Photonics 2009, 3, 654–657. [Google Scholar] [CrossRef]
- Novotny, L.; Bian, R.X.; Xie, X.S. Theory of nanometric optical tweezers. Phys. Rev. Lett. 1997, 79. [Google Scholar] [CrossRef]
- Crozier, K.B.; Sundaramurthy, A.; Kino, G.S.; Quate, C.F. Optical antennas: Resonators for local field enhancement. J. Appl. Phys. 2003, 94, 4632–4642. [Google Scholar] [CrossRef]
- Curto, A.G.; Volpe, G.; Taminiau, T.H.; Kreuzer, M.P.; Quidant, R.; van Hulst, N.F. Unidirectional emission of a quantum dot coupled to a nanoantenna. Science 2010, 329, 930–933. [Google Scholar] [CrossRef] [PubMed]
- Kosako, T.; Kadoya, Y.; Hofmann, H.F. Directional control of light by a nano-optical Yagi-Uda antenna. Nat. Photonics 2010, 4, 312–315. [Google Scholar] [CrossRef]
- Novotny, L. The history of near-field optics. Prog. Opt. 2007, 50, 137–184. [Google Scholar]
- Bryant, G.W.; García de Abajo, F.J.; Aizpurua, J. Mapping the plasmon resonances of metallic nanoantennas. Nano Lett. 2008, 8, 631–636. [Google Scholar] [CrossRef] [PubMed]
- Sfeir, M.Y.; Beetz, T.; Wang, F.; Huang, L.; Huang, X.H.; Huang, M.; Hone, J.; O’Brien, S.; Misewich, J.A.; Heinz, T.F.; et al. Optical spectroscopy of individual single-walled carbon nanotubes of defined chiral structure. Science 2006, 312, 554–556. [Google Scholar] [CrossRef] [PubMed]
- Burke, P.J.; Li, S.; Yu, Z. Quantitative theory of nanowire and nanotube antenna performance. IEEE Trans. Nanotechnol. 2006, 5, 314–334. [Google Scholar] [CrossRef]
- Weber, D.; Albella, P.; Alonso-González, P.; Neubrech, F.; Gui, H.; Nagao, T.; Hillenbrand, R.; Aizpurua, J.; Pucci, A. Longitudinal and transverse coupling in infrared gold nanoantenna arrays: Long range versus short range interaction regimes. Opt. Express 2011, 19, 15047–15061. [Google Scholar] [CrossRef] [PubMed]
- Kessentini, S.; Barchiesi, D.; D’Andrea, C.; Toma, A.; Guillot, N.; di Fabrizio, E.; Fazio, B.; Maragó, O.M.; Gucciardi, P.G.; de la Chapelle, M.L.; et al. Gold Dimer Nanoantenna with Slanted Gap for Tunable LSPR and Improved SERS. J. Phys. Chem. C 2014, 118, 3209–3219. [Google Scholar] [CrossRef]
- Thioune, N.; Lidgi-Guigui, N.; Cottat, M.; Gabudean, A.-M.; Focsan, M.; Benoist, H.-M.; Astilean, S.; de la Chapelle, M.L. Study of gold nanorods–protein interaction by localized surface plasmon resonance spectroscopy. Gold Bull. 2013, 46, 275–281. [Google Scholar] [CrossRef]
- Abdel-Rahman, M.R.; Monacelli, B.; Weeks, A.R.; Zummo, G.; Boreman, G.D. Design, fabrication, and characterization of antenna-coupled metal-oxide-metal diodes for dual-band detection. Opt. Eng. 2005, 44, 066401–066401. [Google Scholar] [CrossRef]
- Tang, L.; Kocabas, S.E.; Latif, S.; Okyay, A.K.; Ly-Gagnon, D.-S.; Saraswat, K.C.; Miller, D.A. Nanometre-scale germanium photodetector enhanced by a near-infrared dipole antenna. Nat. Photonics 2008, 2, 226–229. [Google Scholar] [CrossRef]
- Taminiau, T.H.; Stefani, F.D.; Segerink, F.B.; van Hulst, N.F. Optical antennas direct single-molecule emission. Nat. Photonics 2008, 2, 234–237. [Google Scholar] [CrossRef]
- Hofmann, H.F.; Kosako, T.; Kadoya, Y. Design parameters for a nano-optical Yagi-Uda antenna. New J. Phys. 2007, 9, 217. [Google Scholar] [CrossRef]
- Li, J.; Salandrino, A.; Engheta, N. Shaping light beams in the nanometer scale: A Yagi-Uda nanoantenna in the optical domain. Phys. Rev. B 2007, 76. [Google Scholar] [CrossRef]
- Li, K.; Stockman, M.I.; Bergman, D.J. Self-similar chain of metal nanospheres as an efficient nanolens. Phys. Rev. Lett. 2003, 91. [Google Scholar] [CrossRef]
- Puente-Baliarda, C.; Romeu, J.; Pous, R.; Cardama, A. On the behavior of the Sierpinski multiband fractal antenna. IEEE Trans. Antennas Propag. 1998, 46, 517–524. [Google Scholar] [CrossRef]
- Curto, A.G.; Manjavacas, A.; García de Abajo, F.J. Near-field focusing with optical phase antennas. Opt. Express 2009, 17, 17801–17811. [Google Scholar] [CrossRef] [PubMed]
- Alù, A.; Engheta, N. Input impedance, nanocircuit loading, and radiation tuning of optical nanoantennas. Phys. Rev. Lett. 2008, 101. [Google Scholar] [CrossRef] [PubMed]
- Huang, J.-S.; Feichtner, T.; Biagioni, P.; Hecht, B. Impedance matching and emission properties of nanoantennas in an optical nanocircuit. Nano Lett. 2009, 9, 1897–1902. [Google Scholar] [CrossRef] [PubMed]
- Alù, A.; Engheta, N. Hertzian plasmonic nanodimer as an efficient optical nanoantenna. Phys. Rev. B 2008, 78. [Google Scholar] [CrossRef]
- Schnell, M.; Garcia-Etxarri, A.; Huber, A.J.; Crozier, K.; Aizpurua, J.; Hillenbrand, R. Controlling the near-field oscillations of loaded plasmonic nanoantennas. Nat. Photonics 2009, 3, 287–291. [Google Scholar] [CrossRef]
- Berthelot, J.; Bouhelier, A.; Huang, C.; Margueritat, J.; Colas-des-Francs, G.; Finot, E.; Weeber, J.-C.; Dereux, A.; Kostcheev, S.; Ahrach, H.I.E.; et al. Tuning of an optical dimer nanoantenna by electrically controlling its load impedance. Nano Lett. 2009, 9, 3914–3921. [Google Scholar] [CrossRef] [PubMed]
- Greffet, J.-J.; Laroche, M.; Marquier, F. Impedance of a nanoantenna and a single quantum emitter. Phys. Rev. Lett. 2010, 105. [Google Scholar] [CrossRef] [PubMed]
- Anger, P.; Bharadwaj, P.; Novotny, L. Enhancement and quenching of single-molecule fluorescence. Phys. Rev. Lett. 2006, 96. [Google Scholar] [CrossRef]
- Kühn, S.; Hakanson, U.; Rogobete, L.; Sandoghdar, V. Enhancement of single-molecule fluorescence using a gold nanoparticle as an optical nanoantenna. Phys. Rev. Lett. 2006, 97, 017402. [Google Scholar] [CrossRef] [PubMed]
- Falk, A.L.; Koppens, F.H.; Chun, L.Y.; Kang, K.; de Leon Snapp, N.; Akimov, A.V.; Jo, M.-H.; Lukin, M.D.; Park, H. Near-field electrical detection of optical plasmons and single-plasmon sources. Nat. Phys. 2009, 5, 475–479. [Google Scholar] [CrossRef]
- Gimzewski, J.K.; Reihl, B.; Coombs, J.H.; Schlittler, R.R. Photon emission with the scanning tunneling microscope. Z. Phys. B Condens. Matter 1988, 72, 497–501. [Google Scholar] [CrossRef]
- Schull, G.; Néel, N.; Johansson, P.; Berndt, R. Electron-plasmon and electron-electron interactions at a single atom contact. Phys. Rev. Lett. 2009, 102, 057401. [Google Scholar] [CrossRef] [PubMed]
- Johansson, P.; Monreal, R.; Apell, P. Theory for light emission from a scanning tunneling microscope. Phys. Rev. B 1990, 42. [Google Scholar] [CrossRef]
- Persson, B.N.J.; Baratoff, A. Theory of photon emission in electron tunneling to metallic particles. Phys. Rev. Lett. 1992, 68. [Google Scholar] [CrossRef] [PubMed]
- Zurita-Sánchez, J.R.; Novotny, L. Multipolar interband absorption in a semiconductor quantum dot. I. Electric quadrupole enhancement. JOSA B 2002, 19, 1355–1362. [Google Scholar] [CrossRef]
- Ditlbacher, H.; Hohenau, A.; Wagner, D.; Kreibig, U.; Rogers, M.; Hofer, F.; Aussenegg, F.R.; Krenn, J.R. Silver nanowires as surface plasmon resonators. Phys. Rev. Lett. 2005, 95, 257403. [Google Scholar] [CrossRef] [PubMed]
- Rodríguez-Lorenzo, L.; Alvarez-Puebla, R.A.; Pastoriza-Santos, I.; Mazzucco, S.; Stéphan, O.; Kociak, M.; Liz-Marzán, L.M.; García de Abajo, F.J. Zeptomol detection through controlled ultrasensitive surface-enhanced Raman scattering. J. Am. Chem. Soc. 2009, 131, 4616–4618. [Google Scholar] [CrossRef] [PubMed]
- Averitt, R.D.; Sarkar, D.; Halas, N.J. Plasmon resonance shifts of Au-coated Au 2 S nanoshells: Insight into multicomponent nanoparticle growth. Phys. Rev. Lett. 1997, 78, 4217. [Google Scholar] [CrossRef]
- Bharadwaj, P.; Novotny, L. Plasmon-Enhanced Photoemission from a Single Y3N@C80 Fullerene. J. Phys. Chem. C 2010, 114, 7444–7447. [Google Scholar] [CrossRef]
- D’Andrea, C.; Fazio, B.; Bochterle, J.; Cottat, M.; Toma, A.; Foti, A.; Messina, E.; Marago, O.M.; di Fabrizio, E.; de la Chapelle, M.L.; et al. Novel architectures for plasmon-enhanced vibrational spectroscopy and biomolecular sensing. In Proceedings of Laser Science, Tucson, AZ, USA, 19–23 October 2014. [CrossRef]
- Cottat, M.; Lidgi-Guigui, N.; Tijunelyte, I.; Barbillon, G.; Hamouda, F.; Gogol, P.; Aassime, A.; Lourtioz, J.-M.; Bartenlian, B.; de la Chapelle, M.L.; et al. Soft UV nanoimprint lithography-designed highly sensitive substrates for SERS detection. Nanoscale Res. Lett. 2014, 9, 1–6. [Google Scholar] [CrossRef] [PubMed]
- Barchiesi, D.; Lidgi-Guigui, N.; de la Chapelle, M.L. Functionalization layer influence on the sensitivity of surface plasmon resonance (SPR) biosensor. Opt. Commun. 2012, 285, 1619–1623. [Google Scholar] [CrossRef]
- Barchiesi, D.; Kessentini, S.; Guillot, N.; de La Chapelle, M.L.; Grosges, T. Localized surface plasmon resonance in arrays of nano-gold cylinders: Inverse problem and propagation of uncertainties. Opt. Express 2013, 21, 2245–2262. [Google Scholar] [CrossRef] [PubMed]
- Cottat, M.; Thioune, N.; Gabudean, A.-M.; Lidgi-Guigui, N.; Focsan, M.; Astilean, S.; de la Chapelle, M.L. Localized surface plasmon resonance (lspr) biosensor for the protein detection. Plasmonics 2013, 8, 699–704. [Google Scholar] [CrossRef]
- De la Chapelle, M.L.; Shen, H.; Guillot, N.; Frémaux, B.; Guelorget, B.; Toury, T. New Gold Nanoparticles Adhesion Process Opening the Way of Improved and Highly Sensitive Plasmonics Technologies. Plasmonics 2013, 8, 411–415. [Google Scholar] [CrossRef]
- Roh, S.; Chung, T.; Lee, B. Overview of plasmonic sensors and their design methods. In Proceedings of Proc. SPIE 7853,Advanced Sensor Systems and Applications IV, Beijing, China, 18 October 2010. [CrossRef]
- Huang, D.-W.; Ma, Y.-F.; Sung, M.-J.; Huang, C.-P. Approach the angular sensitivity limit in surface plasmon resonance sensors with low index prism and large resonant angle. Opt. Eng. 2010, 49, 054403–054403. [Google Scholar] [CrossRef]
- Nenninger, G.G.; Piliarik, M.; Homola, J. Data analysis for optical sensors based on spectroscopy of surface plasmons. Meas. Sci. Technol. 2002, 13. [Google Scholar] [CrossRef]
- Lahav, A.; Auslender, M.; Abdulhalim, I. Sensitivity enhancement of guided-wave surface-plasmon resonance sensors. Opt. Lett. 2008, 33, 2539–2541. [Google Scholar] [CrossRef] [PubMed]
- Lee, K.-S.; Son, J.M.; Jeong, D.-Y.; Lee, T.S.; Kim, W.M. Resolution enhancement in surface plasmon resonance sensor based on waveguide coupled mode by combining a bimetallic approach. Sensors 2010, 10, 11390–11399. [Google Scholar] [CrossRef] [PubMed]
- Chen, B.-H.; Wang, Y.-C.; Lin, J.-H. High sensitivity of phase-based surface plasmon resonance in nano-cylinder array. PIERS Online 2008, 4, 746–750. [Google Scholar] [CrossRef]
- Kabashin, A.V.; Evans, P.; Pastkovsky, S.; Hendren, W.; Wurtz, G.A.; Atkinson, R.; Pollard, R.; Podolskiy, V.A.; Zayats, A.V. Plasmonic nanorod metamaterials for biosensing. Nat. Mater. 2009, 8, 867–871. [Google Scholar] [CrossRef]
- Bin, W.; Qing-Kang, W. High Sensitivity Transmission-Type SPR Sensor by Using Metallic-Dielectric Mixed Gratings. Chin. Phys. Lett. 2008, 25. [Google Scholar] [CrossRef]
- Homola, J.; Lu, H.B.; Yee, S.S. Dual-channel surface plasmon resonance sensor with spectral discrimination of sensing channels using dielectric overlayer. Electron. Lett. 1999, 35, 1105–1106. [Google Scholar] [CrossRef]
- Dostalek, J.; Vaisocherova, H.; Homola, J. Multichannel surface plasmon resonance biosensor with wavelength division multiplexing. Sens. Actuators B Chem. 2005, 108, 758–764. [Google Scholar] [CrossRef]
- Lee, B.; Roh, S.; Kim, H.; Jung, J. Waveguide-based surface plasmon resonance sensor design. In Proceedings of Proc. SPIE 7420,Photonic Fiber and Crystal Devices: Advances in Materials and Innovations in Device Applications III, San Diego, CA, USA, 21 August 2009. [CrossRef]
- Hu, C.; Liu, D. High-performance grating coupled surface plasmon resonance sensor based on Al-Au Bimetallic layer. Mod. Appl. Sci. 2010, 4. [Google Scholar] [CrossRef]
- Liu, N.; Weiss, T.; Mesch, M.; Langguth, L.; Eigenthaler, U.; Hirscher, M.; Sönnichsen, C.; Giessen, H. Planar metamaterial analogue of electromagnetically induced transparency for plasmonic sensing. Nano Lett. 2009, 10, 1103–1107. [Google Scholar] [CrossRef]
- Nishiuma, S.; Handa, Y.; Imamura, T.; Ogino, M.; Yamada, T.; Furusawa, K.; Kuroda, R. Localized surface plasmon resonant metal nanostructures as refractive index sensors. Jpn. J. Appl. Phys. 2008, 47. [Google Scholar] [CrossRef]
- Jain, P.K.; El-Sayed, M.A. Noble metal nanoparticle pairs: Effect of medium for enhanced nanosensing. Nano Lett. 2008, 8, 4347–4352. [Google Scholar] [CrossRef] [PubMed]
- Galush, W.J.; Shelby, S.A.; Mulvihill, M.J.; Tao, A.; Yang, P.; Groves, J.T. A nanocube plasmonic sensor for molecular binding on membrane surfaces. Nano Lett. 2009, 9, 2077–2082. [Google Scholar] [CrossRef] [PubMed]
- Jiang, H.; Sabarinathan, J. Effects of coherent interactions on the sensing characteristics of near-infrared gold nanorings. J. Phys. Chem. C 2010, 114, 15243–15250. [Google Scholar] [CrossRef]
- Pang, L.; Hwang, G.M.; Slutsky, B.; Fainman, Y. Spectral sensitivity of two-dimensional nanohole array surface plasmon polariton resonance sensor. Appl. Phys. Lett. 2007, 91, 123112. [Google Scholar] [CrossRef]
- Kikuta, H.; Yoshida, H.; Iwata, K. Ability and limitation of effective medium theory for subwavelength gratings. Opt. Rev. 1995, 2, 92–99. [Google Scholar] [CrossRef]
- Nemova, G.; Kabashin, A.V.; Kashyap, R. Surface plasmon-polariton Mach-Zehnder refractive index sensor. JOSA B 2008, 25, 1673–1677. [Google Scholar] [CrossRef]
- Wu, X.; Zhang, J.; Chen, J.; Zhao, C.; Gong, Q. Refractive index sensor based on surface-plasmon interference. Opt. Lett. 2009, 34, 392–394. [Google Scholar] [CrossRef] [PubMed]
- Kim, D.G.; Choi, W.-K.; Choi, Y.W.; Dagli, N. Triangular resonator based on surface plasmon resonance of attenuated reflection mirror. Electron. Lett. 2007, 43, 1365–1367. [Google Scholar] [CrossRef]
- Abdulhalim, I.; Zourob, M.; Lakhtakia, A. Surface plasmon resonance for biosensing: A mini-review. Electromagnetics 2008, 28, 214–242. [Google Scholar] [CrossRef]
- Minunni, M.; Mascini, M. Detection of pesticide in drinking water using real-time biospecific interaction analysis (BIA). Anal. Lett. 1993, 26, 1441–1460. [Google Scholar] [CrossRef]
- Mouvet, C.; Harris, R.D.; Maciag, C.; Luff, B.J.; Wilkinson, J.S.; Piehler, J.; Brecht, A.; Gauglitz, G.; Abuknesha, R.; Ismail, G.; et al. Determination of simazine in water samples by waveguide surface plasmon resonance. Anal. Chim. Acta 1997, 338, 109–117. [Google Scholar] [CrossRef]
- Shimomura, M.; Nomura, Y.; Zhang, W.; Sakino, M.; Lee, K.-H.; Ikebukuro, K.; Karube, I. Simple and rapid detection method using surface plasmon resonance for dioxins, polychlorinated biphenylx and atrazine. Anal. Chim. Acta 2001, 434, 223–230. [Google Scholar] [CrossRef]
- Lim, T.; Oyama, M.; Ikebukuro, K.; Karube, I. Detection of Atrazine Based on the SPR Determination of P450 mRNA Levels in Saccharomyces c erevisiae. Anal. Chem. 2000, 72, 2856–2860. [Google Scholar] [CrossRef] [PubMed]
- Soh, N.; Watanabe, T.; Asano, Y.; Imato, T. Indirect competitive immunoassay for bisphenol A, based on a surface plasmon resonance sensor. Sens. Mater. 2003, 15, 423–438. [Google Scholar]
- Gobi, K.V.; Tanaka, H.; Shoyama, Y.; Miura, N. Highly sensitive regenerable immunosensor for label-free detection of 2,4-dichlorophenoxyacetic acid at ppb levels by using surface plasmon resonance imaging. Sens. Actuators B Chem. 2005, 111, 562–571. [Google Scholar] [CrossRef]
- Lin, T.-J.; Huang, K.-T.; Liu, C.-Y. Determination of organophosphorous pesticides by a novel biosensor based on localized surface plasmon resonance. Biosens. Bioelectron. 2006, 22, 513–518. [Google Scholar] [CrossRef] [PubMed]
- Mauriz, E.; Calle, A.; Lechuga, L.M.; Quintana, J.; Montoya, A.; Manclus, J.J. Real-time detection of chlorpyrifos at part per trillion levels in ground, surface and drinking water samples by a portable surface plasmon resonance immunosensor. Anal. Chim. Acta 2006, 561, 40–47. [Google Scholar] [CrossRef]
- Mauriz, E.; Calle, A.; Abad, A.; Montoya, A.; Hildebrandt, A.; Barceló, D.; Lechuga, L.M. Determination of carbaryl in natural water samples by a surface plasmon resonance flow-through immunosensor. Biosens. Bioelectron. 2006, 21, 2129–2136. [Google Scholar] [CrossRef] [PubMed]
- Kawaguchi, T.; Shankaran, D.R.; Kim, S.J.; Gobi, K.V.; Matsumoto, K.; Toko, K.; Miura, N. Fabrication of a novel immunosensor using functionalized self-assembled monolayer for trace level detection of TNT by surface plasmon resonance. Talanta 2007, 72, 554–560. [Google Scholar] [CrossRef] [PubMed]
- Shankaran, D.R.; Gobi, K.V.; Matsumoto, K.; Imato, T.; Toko, K.; Miura, N. Highly sensitive surface plasmon resonance immunosensor for parts-per-trillion level detection of 2,4,6-trinitrophenol. Sens. Actuators B Chem. 2004, 100, 450–454. [Google Scholar] [CrossRef]
- Shankaran, D.R.; Gobi, K.V.; Sakai, T.; Matsumoto, K.; Toko, K.; Miura, N. Surface plasmon resonance immunosensor for highly sensitive detection of 2,4,6-trinitrotoluene. Biosens. Bioelectron. 2005, 20, 1750–1756. [Google Scholar] [CrossRef] [PubMed]
- Strong, A.A.; Stimpson, D.I.; Bartholomew, D.U.; Jenkins, T.F.; Elkind, J.L. Detection of trinitrotoluene (TNT) extracted from soil using a surface plasmon resonance (SPR)-based sensor platform. Proceedings of Proc. SPIE 3710, Detection and Remediation Technologies for Mines and Minelike Targets IV 1999. [Google Scholar] [CrossRef]
- Onodera, T.; Harada, R.; Shankaran, D.R.; Sakai, T.; Liang, J.; Matsumoto, K. Development of Highly Sensitive Biosensor for Explosive Substances. In Systems and Human Science—For Safety, Security, and Dependability: Seleced Papers of the 1st International Symposium SSR2003, Osaka, Japan, November 2003; Amsterdam: Elsevier, 2005; pp. 287–296. [Google Scholar]
- Shankaran, D.R.; Matsumoto, K.; Toko, K.; Miura, N. Development and comparison of two immunoassays for the detection of 2,4,6-trinitrotoluene (TNT) based on surface plasmon resonance. Sens. Actuators B Chem. 2006, 114, 71–79. [Google Scholar] [CrossRef]
- Larsson, A.; Angbrant, J.; Ekeroth, J.; Mansson, P.; Liedberg, B. A novel biochip technology for detection of explosives—TNT: Synthesis, characterisation and application. Sens. Actuators B Chem. 2006, 113, 730–748. [Google Scholar] [CrossRef]
- Samsonova, J.V.; Uskova, N.A.; Andresyuk, A.N.; Franek, M.; Elliott, C.T. Biacore biosensor immunoassay for 4-nonylphenols: Assay optimization and applicability for shellfish analysis. Chemosphere 2004, 57, 975–985. [Google Scholar] [CrossRef] [PubMed]
- Wright, J.D.; Oliver, J.V.; Nolte, R.J.; Holder, S.J.; Sommerdijk, N.A.; Nikitin, P.I. The detection of phenols in water using a surface plasmon resonance system with specific receptors. Sens. Actuators B Chem. 1998, 51, 305–310. [Google Scholar] [CrossRef]
- Choi, J.-W.; Park, K.-W.; Lee, D.-B.; Lee, W.; Lee, W.H. Cell immobilization using self-assembled synthetic oligopeptide and its application to biological toxicity detection using surface plasmon resonance. Biosens. Bioelectron. 2005, 20, 2300–2305. [Google Scholar] [CrossRef] [PubMed]
- Kim, S.J.; Gobi, K.V.; Harada, R.; Shankaran, D.R.; Miura, N. Miniaturized portable surface plasmon resonance immunosensor applicable for on-site detection of low-molecular-weight analytes. Sens. Actuators B Chem. 2006, 115, 349–356. [Google Scholar] [CrossRef]
- Wu, C.-M.; Lin, L.-Y. Immobilization of metallothionein as a sensitive biosensor chip for the detection of metal ions by surface plasmon resonance. Biosens. Bioelectron. 2004, 20, 864–871. [Google Scholar] [CrossRef] [PubMed]
- Ock, K.; Jang, G.; Roh, Y.; Kim, S.; Kim, J.; Koh, K. Optical detection of Cu2+ ion using a SQ-dye containing polymeric thin-film on Au surface. Microchem. J. 2001, 70, 301–305. [Google Scholar] [CrossRef]
- Perkins, E.A.; Squirrell, D.J. Development of instrumentation to allow the detection of microorganisms using light scattering in combination with surface plasmon resonance. Biosens. Bioelectron. 2000, 14, 853–859. [Google Scholar] [CrossRef] [PubMed]
- Zourob, M.; Hawkes, J.J.; Coakley, W.T.; Treves Brown, B.J.; Fielden, P.R.; McDonnell, M.B.; Goddard, N.J. Optical leaky waveguide sensor for detection of bacteria with ultrasound attractor force. Anal. Chem. 2005, 77, 6163–6168. [Google Scholar] [CrossRef] [PubMed]
- Zourob, M.; Mohr, S.; Brown, B.J.T.; Fielden, P.R.; McDonnell, M.B.; Goddard, N.J. An integrated optical leaky waveguide sensor with electrically induced concentration system for the detection of bacteria. Lab Chip 2005, 5, 1360–1365. [Google Scholar] [CrossRef] [PubMed]
- Fratamico, P.M.; Strobaugh, T.P.; Medina, M.B.; Gehring, A.G. A surface plasmon resonance biosensor for real-time immunologic detection of Escherichia coli O157:H7. In New Techniques in the Analysis of Foods; Springer: New York, NY, USA, 1998; pp. 103–112. [Google Scholar]
- Oh, B.-K.; Kim, Y.-K.; Bae, Y.M.; Lee, W.H.; Choi, J.-W. Detection of Escherichia coli O157:H7 using immunosensor based on surface plasmon resonance. J. Microbiol. Biotechnol. 2002, 12, 780–786. [Google Scholar]
- Meeusen, C.A.; Alocilja, E.C.; Osburn, W.N. Detection of E. coli O157:H7 using a miniaturized surface plasmon resonance biosensor. Trans. ASAE 2005, 48, 2409–2416. [Google Scholar] [CrossRef]
- Subramanian, A.S.; Irudayaraj, J.M. Surface plasmon resonance based immunosensing of E. coli O157:H7 in apple juice. Trans. ASABE 2006, 49, 1257–1262. [Google Scholar] [CrossRef]
- Subramanian, A.; Irudayaraj, J.; Ryan, T. A mixed self-assembled monolayer-based surface plasmon immunosensor for detection of E. coli O157:H7. Biosens. Bioelectron. 2006, 21, 998–1006. [Google Scholar] [CrossRef] [PubMed]
- Taylor, A.D.; Ladd, J.; Yu, Q.; Chen, S.; Homola, J.; Jiang, S. Quantitative and simultaneous detection of four foodborne bacterial pathogens with a multi-channel SPR sensor. Biosens. Bioelectron. 2006, 22, 752–758. [Google Scholar] [CrossRef] [PubMed]
- Taylor, A.D.; Yu, Q.; Chen, S.; Homola, J.; Jiang, S. Comparison of E. coli O157:H7 preparation methods used for detection with surface plasmon resonance sensor. Sens. Actuators B Chem. 2005, 107, 202–208. [Google Scholar] [CrossRef]
- Oh, B.-K.; Kim, Y.-K.; Park, K.W.; Lee, W.H.; Choi, J.-W. Surface plasmon resonance immunosensor for the detection of Salmonella typhimurium. Biosens. Bioelectron. 2004, 19, 1497–1504. [Google Scholar] [CrossRef] [PubMed]
- Oh, B.-K.; Lee, W.; Kim, Y.-K.; Lee, W.H.; Choi, J.-W. Surface plasmon resonance immunosensor using self-assembled protein G for the detection of Salmonella paratyphi. J. Biotechnol. 2004, 111, 1–8. [Google Scholar] [CrossRef] [PubMed]
- Koubova, V.; Brynda, E.; Karasova, L.; Škvor, J.; Homola, J.; Dostalek, J.; Tobiška, P.; Rošickỳ, J. Detection of foodborne pathogens using surface plasmon resonance biosensors. Sens. Actuators B Chem. 2001, 74, 100–105. [Google Scholar] [CrossRef]
- Hearty, S.; Leonard, P.; Quinn, J.; O’Kennedy, R. Production, characterisation and potential application of a novel monoclonal antibody for rapid identification of virulent Listeria monocytogenes. J. Microbiol. Methods 2006, 66, 294–312. [Google Scholar] [CrossRef] [PubMed]
- Subramanian, A.; Irudayaraj, J.; Ryan, T. Mono and dithiol surfaces on surface plasmon resonance biosensors for detection of Staphylococcus aureus. Sens. Actuators B Chem. 2006, 114, 192–198. [Google Scholar] [CrossRef]
- Jyoung, J.-Y.; Hong, S.; Lee, W.; Choi, J.-W. Immunosensor for the detection of Vibrio cholerae O1 using surface plasmon resonance. Biosens. Bioelectron. 2006, 21, 2315–2319. [Google Scholar] [CrossRef] [PubMed]
- Oh, B.-K.; Lee, W.; Bae, Y.M.; Lee, W.H.; Choi, J.-W. Surface plasmon resonance immunosensor for detection of Legionella pneumophila. Biotechnol. Bioprocess Eng. 2003, 8, 112–116. [Google Scholar] [CrossRef]
- Oh, B.-K.; Lee, W.; Chun, B.S.; Bae, Y.M.; Lee, W.H.; Choi, J.-W. Surface plasmon resonance immunosensor for the detection of Yersinia enterocolitica. Colloids Surf. Physicochem. Eng. Asp. 2005, 257, 369–374. [Google Scholar] [CrossRef]
- Fratamico, P.M.; Strobaugh, T.P.; Medina, M.B.; Gehring, A.G. Detection of Escherichia coli 0157:H7 using a surface plasmon resonance biosensor. Biotechnol. Tech. 1998, 12, 571–576. [Google Scholar] [CrossRef]
- Bokken, G.C.; Corbee, R.J.; Knapen, F.; Bergwerff, A.A. Immunochemical detection of Salmonella group B, D and E using an optical surface plasmon resonance biosensor. FEMS Microbiol. Lett. 2003, 222, 75–82. [Google Scholar] [CrossRef] [PubMed]
- Leonard, P.; Hearty, S.; Quinn, J.; O’Kennedy, R. A generic approach for the detection of whole Listeria monocytogenes cells in contaminated samples using surface plasmon resonance. Biosens. Bioelectron. 2004, 19, 1331–1335. [Google Scholar] [CrossRef] [PubMed]
- Leonard, P.; Hearty, S.; Wyatt, G.; Quinn, J.; O’kennedy, R. Development of a Surface Plasmon Resonance-Based Immunoassay for Listeria monocytogenes. J. Food Prot. 2005, 68, 728–735. [Google Scholar] [PubMed]
- Vaisocherova, H.; Mrkvová, K.; Piliarik, M.; Jinoch, P.; Šteinbachová, M.; Homola, J. Surface plasmon resonance biosensor for direct detection of antibody against Epstein-Barr virus. Biosens. Bioelectron. 2007, 22, 1020–1026. [Google Scholar] [CrossRef] [PubMed]
- Chung, J.W.; Kim, S.D.; Bernhardt, R.; Pyun, J.C. Application of SPR biosensor for medical diagnostics of human hepatitis B virus (hHBV). Sens. Actuators B Chem. 2005, 111, 416–422. [Google Scholar] [CrossRef]
- Torrance, L.; Ziegler, A.; Pittman, H.; Paterson, M.; Toth, R.; Eggleston, I. Oriented immobilisation of engineered single-chain antibodies to develop biosensors for virus detection. J. Virol. Methods 2006, 134, 164–170. [Google Scholar] [CrossRef] [PubMed]
- Bianchi, N.; Rutigliano, C.; Tomassetti, M.; Feriotto, G.; Zorzato, F.; Gambari, R. Biosensor technology and surface plasmon resonance for real-time detection of HIV-1 genomic sequences amplified by polymerase chain reaction. Clin. Diagn. Virol. 1997, 8, 199–208. [Google Scholar] [CrossRef] [PubMed]
- Homola, J.; Dostalek, J.; Chen, S.; Rasooly, A.; Jiang, S.; Yee, S.S. Spectral surface plasmon resonance biosensor for detection of staphylococcal enterotoxin B in milk. Int. J. Food Microbiol. 2002, 75, 61–69. [Google Scholar] [CrossRef] [PubMed]
- Medina, M.B. Detection of Staphylococcal Enterotoxin B (Seb) with Surface Plasmon Resonance Biosensor1. J. Rapid Methods Autom. Microbiol. 2003, 11, 225–243. [Google Scholar] [CrossRef]
- Medina, M.B. A Biosensor Method for a Competitive Immunoassay Detection of Staphylococcal Enterotoxin B (Seb) In Milk2. J. Rapid Methods Autom. Microbiol. 2005, 13, 37–55. [Google Scholar] [CrossRef]
- Slavık, R.; Homola, J.; Brynda, E. A miniature fiber optic surface plasmon resonance sensor for fast detection of staphylococcal enterotoxin B. Biosens. Bioelectron. 2002, 17, 591–595. [Google Scholar] [CrossRef] [PubMed]
- Naimushin, A.N.; Soelberg, S.D.; Nguyen, D.K.; Dunlap, L.; Bartholomew, D.; Elkind, J.; Melendez, J.; Furlong, C.E. Detection of Staphylococcus aureus enterotoxin B at femtomolar levels with a miniature integrated two-channel surface plasmon resonance (SPR) sensor. Biosens. Bioelectron. 2002, 17, 573–584. [Google Scholar] [CrossRef] [PubMed]
- Daly, S.J.; Keating, G.J.; Dillon, P.P.; Manning, B.M.; O’Kennedy, R.; Lee, H.A.; Morgan, M.R. Development of surface plasmon resonance-based immunoassay for aflatoxin B1. J. Agric. Food Chem. 2000, 48, 5097–5104. [Google Scholar] [CrossRef] [PubMed]
- Mullett, W.; Lai, E.P.; Yeung, J.M. Immunoassay of fumonisins by a surface plasmon resonance biosensor. Anal. Biochem. 1998, 258, 161–167. [Google Scholar] [CrossRef] [PubMed]
- Tüdös, A.J.; Lucas-van den Bos, E.R.; Stigter, E.C. Rapid surface plasmon resonance-based inhibition assay of deoxynivalenol. J. Agric. Food Chem. 2003, 51, 5843–5848. [Google Scholar] [CrossRef] [PubMed]
- Yu, Q.; Chen, S.; Taylor, A.D.; Homola, J.; Hock, B.; Jiang, S. Detection of low-molecular-weight domoic acid using surface plasmon resonance sensor. Sens. Actuators B Chem. 2005, 107, 193–201. [Google Scholar] [CrossRef]
- Stevens, R.C.; Soelberg, S.D.; Eberhart, B.-T.L.; Spencer, S.; Wekell, J.C.; Chinowsky, T.M.; Trainer, V.L.; Furlong, C.E. Detection of the toxin domoic acid from clam extracts using a portable surface plasmon resonance biosensor. Harmful Algae 2007, 6, 166–174. [Google Scholar] [CrossRef]
- Lotierzo, M.; Henry, O.Y.F.; Piletsky, S.; Tothill, I.; Cullen, D.; Kania, M.; Hock, B.; Turner, A.P. Surface plasmon resonance sensor for domoic acid based on grafted imprinted polymer. Biosens. Bioelectron. 2004, 20, 145–152. [Google Scholar] [CrossRef] [PubMed] [Green Version]
- Liu, X.; Song, D.; Zhang, Q.; Tian, Y.; Zhang, H. An optical surface plasmon resonance biosensor for determination of tetanus toxin. Talanta 2004, 62, 773–779. [Google Scholar] [CrossRef] [PubMed]
- Mohammed, I.; Mullett, W.M.; Lai, E.P.; Yeung, J.M. Is biosensor a viable method for food allergen detection? Anal. Chim. Acta 2001, 444, 97–102. [Google Scholar] [CrossRef]
- Haasnoot, W.; Olieman, K.; Cazemier, G.; Verheijen, R. Direct biosensor immunoassays for the detection of nonmilk proteins in milk powder. J. Agric. Food Chem. 2001, 49, 5201–5206. [Google Scholar] [CrossRef] [PubMed]
- Muller-Renaud, S.; Dupont, D.; Dulieu, P. Quantification of β-casein in milk and cheese using an optical immunosensor. J. Agric. Food Chem. 2004, 52, 659–664. [Google Scholar] [CrossRef] [PubMed]
- Li, Y.; Kobayashi, M.; Furui, K.; Soh, N.; Nakano, K.; Imato, T. Surface plasmon resonance immunosensor for histamine based on an indirect competitive immunoreaction. Anal. Chim. Acta 2006, 576, 77–83. [Google Scholar] [CrossRef] [PubMed]
- De Lalla, C.; Tamborini, E.; Longhi, R.; Tresoldi, E.; Manoni, M.; Siccardi, A.G.; Arosio, P.; Sidoli, A. Human recombinant antibody fragments specific for a rye-grass pollen allergen: Characterization and potential applications. Mol. Immunol. 1996, 33, 1049–1058. [Google Scholar] [CrossRef] [PubMed]
- Masson, J.-F.; Obando, L.; Beaudoin, S.; Booksh, K. Sensitive and real-time fiber-optic-based surface plasmon resonance sensors for myoglobin and cardiac troponin I. Talanta 2004, 62, 865–870. [Google Scholar] [CrossRef] [PubMed]
- Dutra, R.F.; Kubota, L.T. An SPR immunosensor for human cardiac troponin T using specific binding avidin to biotin at carboxymethyldextran-modified gold chip. Clin. Chim. Acta 2007, 376, 114–120. [Google Scholar] [CrossRef] [PubMed]
- Wei, J.; Mu, Y.; Song, D.; Fang, X.; Liu, X.; Bu, L.; Zhang, H.; Zhang, G.; Ding, J.; Wang, W.; et al. A novel sandwich immunosensing method for measuring cardiac troponin I in sera. Anal. Biochem. 2003, 321, 209–216. [Google Scholar] [CrossRef] [PubMed]
- Kunz, U.; Katerkamp, A.; Renneberg, R.; Spener, F.; Cammann, K. Sensing fatty acid binding protein with planar and fiber-optical surface plasmon resonance spectroscopy devices. Sens. Actuators B Chem. 1996, 32, 149–155. [Google Scholar] [CrossRef]
- Besselink, G.A.; Kooyman, R.P.; van Os, P.J.; Engbers, G.H.; Schasfoort, R. Signal amplification on planar and gel-type sensor surfaces in surface plasmon resonance-based detection of prostate-specific antigen. Anal. Biochem. 2004, 333, 165–173. [Google Scholar] [CrossRef] [PubMed]
- Huang, L.; Reekmans, G.; Saerens, D.; Friedt, J.-M.; Frederix, F.; Francis, L.; Muyldermans, S.; Campitelli, A.; Hoof, C.V. Prostate-specific antigen immunosensing based on mixed self-assembled monolayers, camel antibodies and colloidal gold enhanced sandwich assays. Biosens. Bioelectron. 2005, 21, 483–490. [Google Scholar] [CrossRef] [PubMed]
- Yang, C.-Y.; Brooks, E.; Li, Y.; Denny, P.; Ho, C.-M.; Qi, F.; Shi, W.; Wolinsky, L.; Wu, B.; Wong, D.T.; et al. Detection of picomolar levels of interleukin-8 in human saliva by SPR. Lab Chip 2005, 5, 1017–1023. [Google Scholar] [CrossRef] [PubMed]
- Coille, I.; Gauglitz, G.; Hoebeke, J. Characterisation of antibodies and analytes by surface plasmon resonance for the optimisation of a competitive immunoassay based on energy transfer. Anal. Bioanal. Chem. 2002, 372, 293–300. [Google Scholar] [CrossRef] [PubMed]
- Miyashita, M.; Shimada, T.; Miyagawa, H.; Akamatsu, M. Surface plasmon resonance-based immunoassay for 17β-estradiol and its application to the measurement of estrogen receptor-binding activity. Anal. Bioanal. Chem. 2005, 381, 667–673. [Google Scholar] [CrossRef] [PubMed]
- Mitchell, J.S.; Wu, Y.; Cook, C.J.; Main, L. Sensitivity enhancement of surface plasmon resonance biosensing of small molecules. Anal. Biochem. 2005, 343, 125–135. [Google Scholar] [CrossRef] [PubMed]
- Guidi, A.; Laricchia-Robbio, L.; Gianfaldoni, D.; Revoltella, R.; del Bono, G. Comparison of a conventional immunoassay (ELISA) with a surface plasmon resonance-based biosensor for IGF-1 detection in cows’ milk. Biosens. Bioelectron. 2001, 16, 971–977. [Google Scholar] [CrossRef] [PubMed]
- Piliarik, M.; Vaisocherová, H.; Homola, J. A new surface plasmon resonance sensor for high-throughput screening applications. Biosens. Bioelectron. 2005, 20, 2104–2110. [Google Scholar] [CrossRef] [PubMed]
- Sakai, G.; Ogata, K.; Uda, T.; Miura, N.; Yamazoe, N. A surface plasmon resonance-based immunosensor for highly sensitive detection of morphine. Sens. Actuators B Chem. 1998, 49, 5–12. [Google Scholar] [CrossRef]
- Dillon, P.P.; Daly, S.J.; Manning, B.M.; O’Kennedy, R. Immunoassay for the determination of morphine-3-glucuronide using a surface plasmon resonance-based biosensor. Biosens. Bioelectron. 2003, 18, 217–227. [Google Scholar] [CrossRef] [PubMed]
- Liljeblad, M.; Lundblad, A.; Ohlson, S.; Pahlsson, P. Detection of low-molecular-weight heparin oligosaccharides (FragminTM) using surface plasmon resonance. J. Mol. Recognit. 1998, 11, 191–193. [Google Scholar] [CrossRef] [PubMed]
- Keating, G.J.; Quinn, J.G.; O’Kennedy, R. Immunoassay for the determination of 7-hydroxycoumarin in serum using ‘real-time’ biosensor analysis. Analytical Letters 1999, 32, 2163–2176. [Google Scholar]
- Fitzpatrick, B.; O’Kennedy, R. The development and application of a surface plasmon resonance-based inhibition immunoassay for the determination of warfarin in plasma ultrafiltrate. J. Immunol. Methods 2004, 291, 11–25. [Google Scholar] [CrossRef] [PubMed]
- Cacciatore, G.; Petz, M.; Rachid, S.; Hakenbeck, R.; Bergwerff, A.A. Development of an optical biosensor assay for detection of β-lactam antibiotics in milk using the penicillin-binding protein 2×. Anal. Chim. Acta 2004, 520, 105–115. [Google Scholar] [CrossRef]
- Gustavsson, E.; Degelaen, J.; Bjurling, P.; Sternesjö, A. Determination of β-lactams in milk using a surface plasmon resonance-based biosensor. J. Agric. Food Chem. 2004, 52, 2791–2796. [Google Scholar] [CrossRef] [PubMed]
- Ortega-Mendoza, J.G.; Padilla-Vivanco, A.; Toxqui-Quitl, C.; Zaca-Morán, P.; Villegas-Hernández, D.; Chávez, F. Optical Fiber Sensor Based on Localized Surface Plasmon Resonance Using Silver Nanoparticles Photodeposited on the Optical Fiber End. Sensors 2014, 14, 18701–18710. [Google Scholar] [CrossRef] [PubMed]
- Eck, D.; Helm, C.A.; Wagner, N.J.; Vaynberg, K.A. Plasmon resonance measurements of the adsorption and adsorption kinetics of a biopolymer onto gold nanocolloids. Langmuir 2001, 17, 957–960. [Google Scholar] [CrossRef]
- Nath, N.; Chilkoti, A. A colorimetric gold nanoparticle sensor to interrogate biomolecular interactions in real time on a surface. Anal. Chem. 2002, 74, 504–509. [Google Scholar] [CrossRef] [PubMed]
- Haes, A.J.; van Duyne, R.P. A nanoscale optical biosensor: Sensitivity and selectivity of an approach based on the localized surface plasmon resonance spectroscopy of triangular silver nanoparticles. J. Am. Chem. Soc. 2002, 124, 10596–10604. [Google Scholar] [CrossRef] [PubMed]
- Jung, L.S.; Campbell, C.T.; Chinowsky, T.M.; Mar, M.N.; Yee, S.S. Quantitative interpretation of the response of surface plasmon resonance sensors to adsorbed films. Langmuir 1998, 14, 5636–5648. [Google Scholar] [CrossRef]
- Guillot, N.; de la Chapelle, M.L. The electromagnetic effect in surface enhanced Raman scattering: Enhancement optimization using precisely controlled nanostructures. J. Quant. Spectrosc. Radiat. Transf. 2012, 113, 2321–2333. [Google Scholar] [CrossRef]
- Sun, Y.; Xia, Y. Increased sensitivity of surface plasmon resonance of gold nanoshells compared to that of gold solid colloids in response to environmental changes. Anal. Chem. 2002, 74, 5297–5305. [Google Scholar] [CrossRef] [PubMed]
- Chen, H.; Kou, X.; Yang, Z.; Ni, W.; Wang, J. Shape-and size-dependent refractive index sensitivity of gold nanoparticles. Langmuir 2008, 24, 5233–5237. [Google Scholar] [CrossRef] [PubMed]
- Tam, F.; Moran, C.; Halas, N. Geometrical parameters controlling sensitivity of nanoshell plasmon resonances to changes in dielectric environment. J. Phys. Chem. B 2004, 108, 17290–17294. [Google Scholar] [CrossRef]
- Larsson, E.M.; Alegret, J.; Käll, M.; Sutherland, D.S. Sensing characteristics of NIR localized surface plasmon resonances in gold nanorings for application as ultrasensitive biosensors. Nano Lett. 2007, 7, 1256–1263. [Google Scholar] [CrossRef] [PubMed]
- Marinakos, S.M.; Chen, S.; Chilkoti, A. Plasmonic detection of a model analyte in serum by a gold nanorod sensor. Anal. Chem. 2007, 79, 5278–5283. [Google Scholar] [CrossRef] [PubMed]
- Wang, H.; Brandl, D.W.; Le, F.; Nordlander, P.; Halas, N.J. Nanorice: A hybrid plasmonic nanostructure. Nano Lett. 2006, 6, 827–832. [Google Scholar] [CrossRef] [PubMed]
- Nehl, C.L.; Liao, H.; Hafner, J.H. Optical properties of star-shaped gold nanoparticles. Nano Lett. 2006, 6, 683–688. [Google Scholar] [CrossRef] [PubMed] [Green Version]
- Mock, J.J.; Smith, D.R.; Schultz, S. Local refractive index dependence of plasmon resonance spectra from individual nanoparticles. Nano Lett. 2003, 3, 485–491. [Google Scholar] [CrossRef]
- Sherry, L.J.; Jin, R.; Mirkin, C.A.; Schatz, G.C.; van Duyne, R.P. Localized surface plasmon resonance spectroscopy of single silver triangular nanoprisms. Nano Lett. 2006, 6, 2060–2065. [Google Scholar] [CrossRef]
- Aherne, D.; Charles, D.E.; Brennan-Fournet, M.E.; Kelly, J.M.; Gun’ko, Y.K. Etching-resistant silver nanoprisms by epitaxial deposition of a protecting layer of gold at the edges. Langmuir 2009, 25, 10165–10173. [Google Scholar] [CrossRef] [PubMed]
- Malinsky, M.D.; Kelly, K.L.; Schatz, G.C.; van Duyne, R.P. Chain length dependence and sensing capabilities of the localized surface plasmon resonance of silver nanoparticles chemically modified with alkanethiol self-assembled monolayers. J. Am. Chem. Soc. 2001, 123, 1471–1482. [Google Scholar] [CrossRef]
- Sherry, L.J.; Chang, S.-H.; Schatz, G.C.; van Duyne, R.P.; Wiley, B.J.; Xia, Y. Localized surface plasmon resonance spectroscopy of single silver nanocubes. Nano Lett. 2005, 5, 2034–2038. [Google Scholar] [CrossRef] [PubMed]
- Petryayeva, E.; Krull, U.J. Localized surface plasmon resonance: Nanostructures, bioassays and biosensing—A review. Anal. Chim. Acta 2011, 706, 8–24. [Google Scholar] [CrossRef] [PubMed]
- Sönnichsen, C.; Reinhard, B.M.; Liphardt, J.; Alivisatos, A.P. A molecular ruler based on plasmon coupling of single gold and silver nanoparticles. Nat. Biotechnol. 2005, 23, 741–745. [Google Scholar] [CrossRef] [PubMed]
- Liu, G.L.; Yin, Y.; Kunchakarra, S.; Mukherjee, B.; Gerion, D.; Jett, S.D.; Bear, D.G.; Gray, J.W.; Alivisatos, A.P.; Lee, L.P.; et al. A nanoplasmonic molecular ruler for measuring nuclease activity and DNA footprinting. Nat. Nanotechnol. 2006, 1, 47–52. [Google Scholar] [CrossRef] [PubMed]
- Liu, G.L.; Long, Y.-T.; Choi, Y.; Kang, T.; Lee, L.P. Quantized plasmon quenching dips nanospectroscopy via plasmon resonance energy transfer. Nat. Methods 2007, 4, 1015–1017. [Google Scholar] [CrossRef] [PubMed]
- Choi, Y.; Kang, T.; Lee, L.P. Plasmon resonance energy transfer (PRET)-based molecular imaging of cytochrome c in living cells. Nano Lett. 2008, 9, 85–90. [Google Scholar] [CrossRef]
- Choi, Y.; Park, Y.; Kang, T.; Lee, L.P. Selective and sensitive detection of metal ions by plasmonic resonance energy transfer-based nanospectroscopy. Nat. Nanotechnol. 2009, 4, 742–746. [Google Scholar] [CrossRef] [PubMed]
- Huh, Y.S.; Chung, A.J.; Cordovez, B.; Erickson, D. Enhanced on-chip SERS based biomolecular detection using electrokinetically active microwells. Lab Chip 2009, 9, 433–439. [Google Scholar] [CrossRef] [PubMed]
- Yuan, W.; Ho, H.P.; Lee, R.K.; Kong, S.K. Surface-enhanced Raman scattering biosensor for DNA detection on nanoparticle island substrates. Appl. Opt. 2009, 48, 4329–4337. [Google Scholar] [CrossRef] [PubMed]
- Vo-Dinh, T. Nanobiosensing using plasmonic nanoprobes. IEEE J. Sel. Top. Quantum Electron. 2008, 14, 198–205. [Google Scholar] [CrossRef] [PubMed]
- Wabuyele, M.B.; Vo-Dinh, T. Detection of human immunodeficiency virus type 1 DNA sequence using plasmonics nanoprobes. Anal. Chem. 2005, 77, 7810–7815. [Google Scholar] [CrossRef] [PubMed]
- Fabris, L.; Dante, M.; Braun, G.; Lee, S.J.; Reich, N.O.; Moskovits, M.; Nguyen, T.-Q.; Bazan, G.C. A heterogeneous PNA-based SERS method for DNA detection. J. Am. Chem. Soc. 2007, 129, 6086–6087. [Google Scholar] [CrossRef] [PubMed]
- Guillot, N.; de la Chapelle, M.L. Lithographied nanostructures as nanosensors. J. Nanophotonics 2012, 6. [Google Scholar] [CrossRef]
- Pavel, I.; McCarney, E.; Elkhaled, A.; Morrill, A.; Plaxco, K.; Moskovits, M. Label-free SERS detection of small proteins modified to act as bifunctional linkers. J. Phys. Chem. C 2008, 112, 4880–4883. [Google Scholar] [CrossRef]
- Maher, R.C.; Maier, S.A.; Cohen, L.F.; Koh, L.; Laromaine, A.; Dick, J.A.G.; Stevens, M.M. Exploiting SERS Hot Spots for Disease-Specific Enzyme Detection. J. Phys. Chem. C 2009, 114, 7231–7235. [Google Scholar] [CrossRef]
- Li, T.; Guo, L.; Wang, Z. Gold Nanoparticle-based Surface Enhanded Raman Scattering Spectroscopic Assay for the Detection of Protein-Protein Interactions. Anal. Sci. 2008, 24, 907–910. [Google Scholar] [CrossRef] [PubMed]
- Gellner, M.; Küstner, B.; Schlücker, S. Optical properties and SERS efficiency of tunable gold/silver nanoshells. Vib. Spectrosc. 2009, 50, 43–47. [Google Scholar] [CrossRef]
- Yang, M.; Chen, T.; Lau, W.S.; Wang, Y.; Tang, Q.; Yang, Y.; Chen, H. Development of polymer-encapsulated metal nanoparticles as surface-enhanced Raman scattering probes. Small 2009, 5, 198–202. [Google Scholar] [CrossRef] [PubMed]
- Su, X.; Zhang, J.; Sun, L.; Koo, T.-W.; Chan, S.; Sundararajan, N.; Yamakawa, M.; Berlin, A.A. Composite organic-inorganic nanoparticles (COINs) with chemically encoded optical signatures. Nano Lett. 2005, 5, 49–54. [Google Scholar] [CrossRef] [PubMed]
- Mulvaney, S.P.; Musick, M.D.; Keating, C.D.; Natan, M.J. Glass-coated, analyte-tagged nanoparticles: A new tagging system based on detection with surface-enhanced Raman scattering. Langmuir 2003, 19, 4784–4790. [Google Scholar] [CrossRef]
- Graham, D.; Faulds, K.; Smith, W.E. Biosensing using silver nanoparticles and surface enhanced resonance Raman scattering. Chem. Commun. 2006, 4363–4371. [Google Scholar] [CrossRef]
- Cao, Y.C.; Jin, R.; Nam, J.-M.; Thaxton, C.S.; Mirkin, C.A. Raman dye-labeled nanoparticle probes for proteins. J. Am. Chem. Soc. 2003, 125, 14676–14677. [Google Scholar] [CrossRef] [PubMed]
- Grubisha, D.S.; Lipert, R.J.; Park, H.-Y.; Driskell, J.; Porter, M.D. Femtomolar detection of prostate-specific antigen: An immunoassay based on surface-enhanced Raman scattering and immunogold labels. Anal. Chem. 2003, 75, 5936–5943. [Google Scholar] [CrossRef] [PubMed]
- Huang, X.; Jain, P.K.; el-Sayed, I.H.; el-Sayed, M.A. Plasmonic photothermal therapy (PPTT) using gold nanoparticles. Lasers Med. Sci. 2008, 23, 217–228. [Google Scholar] [CrossRef] [PubMed]
- Breuzard, G.; Angiboust, J.-F.; Jeannesson, P.; Manfait, M.; Millot, J.-M. Surface-enhanced Raman scattering reveals adsorption of mitoxantrone on plasma membrane of living cells. Biochem. Biophys. Res. Commun. 2004, 320, 615–621. [Google Scholar] [CrossRef] [PubMed]
- Kneipp, K.; Kneipp, H.; Kneipp, J. Surface-enhanced Raman scattering in local optical fields of silver and gold nanoaggregates from single-molecule Raman spectroscopy to ultrasensitive probing in live cells. Acc. Chem. Res. 2006, 39, 443–450. [Google Scholar] [CrossRef] [PubMed]
- Bálint, Š.; Rao, S.; Huntošová, V.; Miškovskỳ, P.; Petrov, D.; Sánchez, M.M. Diffusion and cellular uptake of drugs in live cells studied with surface-enhanced Raman scattering probes. J. Biomed. Opt. 2010, 15. [Google Scholar] [CrossRef]
- Gregas, M.K.; Scaffidi, J.P.; Lauly, B.; Vo-Dinh, T. Surface-enhanced Raman scattering detection and tracking of nanoprobes: Enhanced uptake and nuclear targeting in single cells. Appl. Spectrosc. 2010, 64, 858–866. [Google Scholar] [CrossRef] [PubMed]
- Sha, M.Y.; Xu, H.; Natan, M.J.; Cromer, R. Surface-enhanced Raman scattering tags for rapid and homogeneous detection of circulating tumor cells in the presence of human whole blood. J. Am. Chem. Soc. 2008, 130, 17214–17215. [Google Scholar] [CrossRef] [PubMed]
- Ligler, F.S. Perspective on optical biosensors and integrated sensor systems. Anal. Chem. 2008, 81, 519–526. [Google Scholar] [CrossRef]
- Grakoui, A.; BromLey, S.K.; Sumen, C.; Davis, M.M.; Shaw, A.S.; Allen, P.M.; Dustin, M.L. The immunological synapse: A molecular machine controlling T cell activation. Science 1999, 285, 221–227. [Google Scholar] [CrossRef] [PubMed]
- Garcia-Parajo, M.F. Optical antennas focus in on biology. Nat. Photonics 2008, 2, 201–203. [Google Scholar] [CrossRef]
- Kessentini, S.; Barchiesi, D.; Grosges, T.; de la Chapelle, M.L. Particle swarm optimization and evolutionary methods for plasmonic biomedical applications. In Proceedings of the IEEE Congress on Evolutionary Computation (CEC), New Orleans, LA, USA, 5–8 June 2011; pp. 2315–2320.
- Yager, P.; Domingo, G.J.; Gerdes, J. Point-of-care diagnostics for global health. Annu. Rev. Biomed. Eng. 2008, 10, 107–144. [Google Scholar] [CrossRef] [PubMed]
- De la Chapelle, M.L.; Guillot, N.; Frémaux, B.; Shen, H.; Toury, T. Novel apolar plasmonic nanostructures with extended optical tunability for sensing applications. Plasmonics 2013, 8, 475–480. [Google Scholar] [CrossRef]
- Yildirimer, L.; Thanh, N.T.; Loizidou, M.; Seifalian, A.M. Toxicology and clinical potential of nanoparticles. Nano Today 2011, 6, 585–607. [Google Scholar] [CrossRef] [PubMed]
- Borm, P.; Klaessig, F.C.; Landry, T.D.; Moudgil, B.; Pauluhn, J.; Thomas, K.; Trottier, R.; Wood, S. Research strategies for safety evaluation of nanomaterials, part V: Role of dissolution in biological fate and effects of nanoscale particles. Toxicol. Sci. 2006, 90, 23–32. [Google Scholar] [CrossRef] [PubMed]
- Xia, T.; Kovochich, M.; Brant, J.; Hotze, M.; Sempf, J.; Oberley, T.; Sioutas, C.; Yeh, J.I.; Wiesner, M.R.; Nel, A.E.; et al. Comparison of the abilities of ambient and manufactured nanoparticles to induce cellular toxicity according to an oxidative stress paradigm. Nano Lett. 2006, 6, 1794–1807. [Google Scholar] [CrossRef] [PubMed]
- Elsaesser, A.; Howard, C.V. Toxicology of nanoparticles. Adv. Drug Deliv. Rev. 2012, 64, 129–137. [Google Scholar] [CrossRef] [PubMed]
- Dawson, K.A.; Salvati, A.; Lynch, I. Nanotoxicology: Nanoparticles reconstruct lipids. Nat. Nanotechnol. 2009, 4, 84–85. [Google Scholar] [CrossRef] [PubMed]
- Caruthers, S.D.; Wickline, S.A.; Lanza, G.M. Nanotechnological applications in medicine. Curr. Opin. Biotechnol. 2007, 18, 26–30. [Google Scholar] [CrossRef] [PubMed]
- James, W.D.; Hirsch, L.R.; West, J.L.; O’Neal, P.D.; Payne, J.D. Application of INAA to the build-up and clearance of gold nanoshells in clinical studies in mice. J. Radioanal. Nucl. Chem. 2007, 271, 455–459. [Google Scholar] [CrossRef]
- Oberdörster, G.; Stone, V.; Donaldson, K. Toxicology of nanoparticles: A historical perspective. Nanotoxicology 2007, 1, 2–25. [Google Scholar] [CrossRef]
- Medintz, I.L.; Uyeda, H.T.; Goldman, E.R.; Mattoussi, H. Quantum dot bioconjugates for imaging, labelling and sensing. Nat. Mater. 2005, 4, 435–446. [Google Scholar] [CrossRef] [PubMed]
- Choi, H.S.; Liu, W.; Misra, P.; Tanaka, E.; Zimmer, J.P.; Ipe, B.I.; Bawendi, M.G.; Frangioni, J.V. Renal clearance of quantum dots. Nat. Biotechnol. 2007, 25, 1165–1170. [Google Scholar] [CrossRef] [PubMed]
- Dobrovolskaia, M.A.; McNeil, S.E. Immunological properties of engineered nanomaterials. Nat. Nanotechnol. 2007, 2, 469–478. [Google Scholar] [CrossRef] [PubMed]
- Duncan, R.; Izzo, L. Dendrimer biocompatibility and toxicity. Adv. Drug Deliv. Rev. 2005, 57, 2215–2237. [Google Scholar] [CrossRef] [PubMed]
- Savolainen, K.; Alenius, H.; Norppa, H.; Pylkkänen, L.; Tuomi, T.; Kasper, G. Risk assessment of engineered nanomaterials and nanotechnologies—A review. Toxicology 2010, 269, 92–104. [Google Scholar] [CrossRef] [PubMed]
- Schuler, E. Perception of risks and nanotechnology. Discov. Nanoscale 2004, 279–284. [Google Scholar]
- Holsapple, M.P.; Lehman-McKeeman, L.D. Forum series: Research strategies for safety evaluation of nanomaterials. Toxicol. Sci. 2005, 87, 315–315. [Google Scholar] [CrossRef] [PubMed]
- Lauterwasser, C. Small Sizes That Matter: Opportunities and Risks of Nanotechnologies; Allianz: München, Germany, 2005. [Google Scholar]
- Oberdörster, G. Safety assessment for nanotechnology and nanomedicine: Concepts of nanotoxicology. J. Intern. Med. 2010, 267, 89–105. [Google Scholar] [CrossRef] [PubMed]
- Dreher, K.L. Health and environmental impact of nanotechnology: Toxicological assessment of manufactured nanoparticles. Toxicol. Sci. 2004, 77, 3–5. [Google Scholar] [CrossRef] [PubMed]
- Lövestam, G.; Rauscher, H.; Roebben, G.; Klüttgen, B.S.; Gibson, N.; Putaud, J.-P.; Stamm, H. Considerations on a Definition of Nanomaterial for Regulatory Purposes; Publications Office of the European Union: Luxembourg, 2010. [Google Scholar]
- Maynard, A.D. Don’t define nanomaterials. Nature 2011, 475. [Google Scholar] [CrossRef]
- Hansen, S.F.; Jensen, K.A.; Baun, A. NanoRiskCat: A conceptual tool for categorization and communication of exposure potentials and hazards of nanomaterials in consumer products. J. Nanopart. Res. 2014, 16, 1–25. [Google Scholar] [CrossRef]
- Van Duuren-Stuurman, B.; Vink, S.R.; Verbist, K.J.; Heussen, H.G.; Brouwer, D.H.; Kroese, D.E.; van Niftrik, M.F.; Tielemans, E.; Fransman, W. Stoffenmanager nano version 1.0: A web-based tool for risk prioritization of airborne manufactured nano objects. Ann. Occup. Hyg. 2012, 56, 525–541. [Google Scholar] [PubMed]
- Iavicoli, S.; Rondinone, B.M.; Boccuni, F. Occupational safety and health’s role in sustainable, responsible nanotechnology: Gaps and needs. Hum. Exp. Toxicol. 2009, 28, 433–443. [Google Scholar] [CrossRef] [PubMed]
© 2015 by the authors; licensee MDPI, Basel, Switzerland. This article is an open access article distributed under the terms and conditions of the Creative Commons Attribution license (http://creativecommons.org/licenses/by/4.0/).
Share and Cite
Kausar, A.S.M.Z.; Reza, A.W.; Latef, T.A.; Ullah, M.H.; Karim, M.E. Optical Nano Antennas: State of the Art, Scope and Challenges as a Biosensor Along with Human Exposure to Nano-Toxicology. Sensors 2015, 15, 8787-8831. https://doi.org/10.3390/s150408787
Kausar ASMZ, Reza AW, Latef TA, Ullah MH, Karim ME. Optical Nano Antennas: State of the Art, Scope and Challenges as a Biosensor Along with Human Exposure to Nano-Toxicology. Sensors. 2015; 15(4):8787-8831. https://doi.org/10.3390/s150408787
Chicago/Turabian StyleKausar, Abu Sulaiman Mohammad Zahid, Ahmed Wasif Reza, Tarik Abdul Latef, Mohammad Habib Ullah, and Mohammad Ershadul Karim. 2015. "Optical Nano Antennas: State of the Art, Scope and Challenges as a Biosensor Along with Human Exposure to Nano-Toxicology" Sensors 15, no. 4: 8787-8831. https://doi.org/10.3390/s150408787