Article

Enhancing Electronic Nose Performance Based on a Novel QPSO-KELM Model

College of Electronic and Information Engineering, Southwest University, Chongqing 400715, China
*
Author to whom correspondence should be addressed.
Sensors 2016, 16(4), 520; https://doi.org/10.3390/s16040520
Submission received: 24 February 2016 / Revised: 27 March 2016 / Accepted: 7 April 2016 / Published: 11 April 2016
(This article belongs to the Special Issue Olfactory and Gustatory Sensors)

Abstract

:
A novel multi-class classification method for bacteria detection termed quantum-behaved particle swarm optimization-based kernel extreme learning machine (QPSO-KELM) based on an electronic nose (E-nose) technology is proposed in this paper. Time and frequency domain features are extracted from E-nose signals used for detecting four different classes of wounds (uninfected and infected with Staphylococcu aureus, Escherichia coli and Pseudomonas aeruginosa) in this experiment. In addition, KELM is compared with five existing classification methods: Linear discriminant analysis (LDA), quadratic discriminant analysis (QDA), extreme learning machine (ELM), k-nearest neighbor (KNN) and support vector machine (SVM). Meanwhile, three traditional optimization methods including particle swarm optimization algorithm (PSO), genetic algorithm (GA) and grid search algorithm (GS) and four kernel functions (Gaussian kernel, linear kernel, polynomial kernel and wavelet kernel) for KELM are discussed in this experiment. Finally, the QPSO-KELM model is also used to deal with another two experimental E-nose datasets in the previous experiments. The experimental results demonstrate the superiority of QPSO-KELM in various E-nose applications.

Graphical Abstract

1. Introduction

An electronic nose (E-nose), combined with artificial intelligence algorithms, is designed for mimicking the mammalian olfactory system to recognize gases and odors. The gas sensor array in an E-nose comprises several non-specific sensors and will generate characteristic patterns when exposed to odorant materials. Patterns of known odorants can be used to construct a database and train a pattern recognition model through quite a few pattern recognition algorithms. In this way, something unknown which can be discriminated by its odor is classified well [1,2,3]. During the past decades, much work has been done to investigate the E-nose technology which has been widely used in a multitude of fields, such as food quality control [4,5,6,7], disease diagnosis [8,9,10,11], environment quality assessment [12,13] and agriculture [14,15,16].
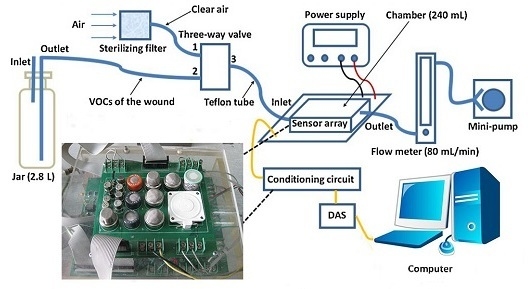
Previous work has proved the effectiveness of detecting bacteria by investigating volatile organic compounds (VOCs) emitted from cultures and swabs taken from patients with infected wounds [17,18,19]. In the pattern recognition, firstly, training data are employed to train the classifier. Then, the performance of this classifier is assessed by using the remaining independent testing samples. The final accuracy can be computed by comparing predicted classes with their true classes. So far, various kinds of classification models have been explored in E-nose applications, which can generally be divided into two categories. One is the linear classifier, such as k-nearest neighbor (KNN) [20,21,22], linear discriminant analysis (LDA) [23,24], partial least squares regression (PLSR) [25] and Bayes classifier [26,27], which is simple and relatively easy to construct but performs poor when it deals with a host of nonlinear problems in E-nose data processing. Another is nonlinear classification models such as the multilayer perceptron (MP) [28,29], radial basis function neural network (RBFNN) [24,30] and decision tree (DT) [31]. The nonlinear classifiers can not only fully approximate the nonlinear relationship of the data, but also show exceedingly strong robustness and fault tolerance. However, they show slow convergence, require too much learning time and are liable to get trapped in local optima.
Support vector machine (SVM) is a pretty promising machine learning method that has been widely applied in classification of E-nose data, especially in some complex odor discriminations. It has better results than many classifiers, not only in qualitative and quantitative analysis of E-nose results but also in other applications [32,33,34]. Extreme learning machine (ELM), a fast learning algorithm for single hidden layer feedforward neural networks (SLFNs), first proposed by Huang et al. [35], randomly generates the hidden node parameters and then analytically determines the output weights instead of iterative tuning. Therefore, ELM runs fast, is easy to implement and shows superiority over other classifiers [36]. Nowadays, ELM has been widely used in a range of fields, such as sales forecasting [37], mental tasks [38], face recognition [39] and food quality tracing [40]. However, the classification performance is obviously affected by the algorithm parameters. Meanwhile, the randomly generated input weights and hidden layer biases of ELM can make the algorithm unstable [41].
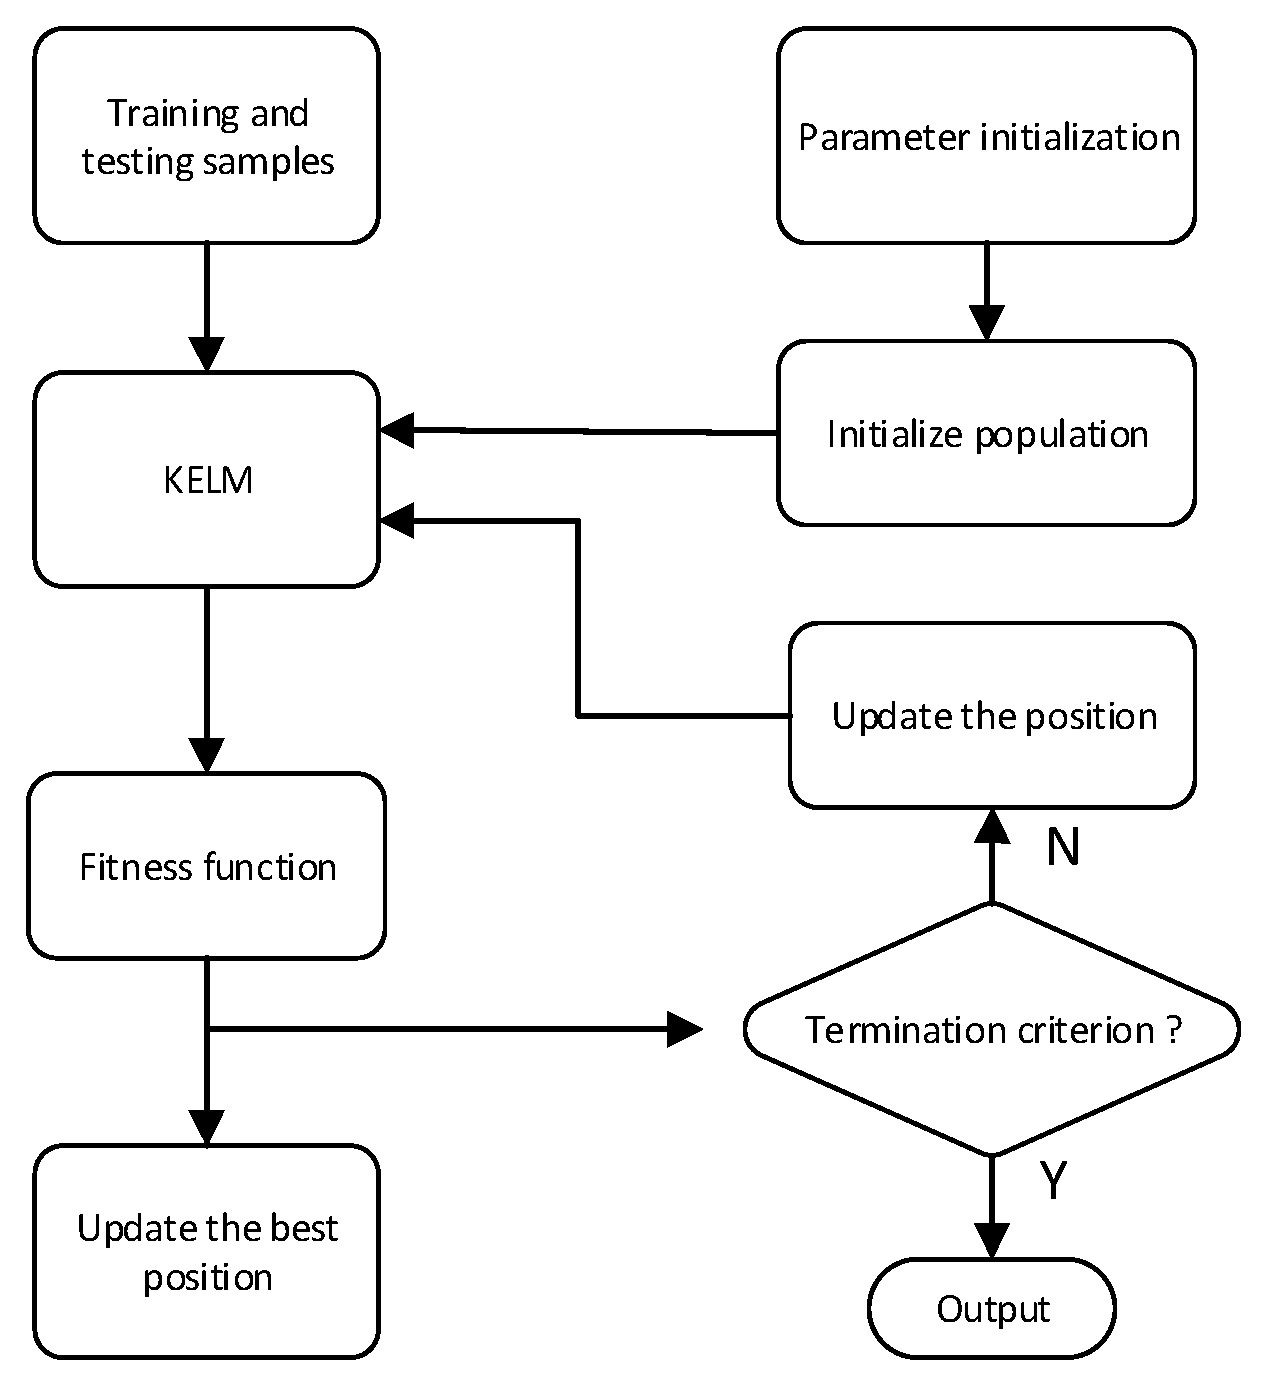
Kernel Extreme Learning Machine (KELM) is constructed based on ELM combined with kernel functions in this paper considering the above limiting factors. It not only has a good deal of the advantages of ELM, but also can nonlinearly map nonlinear inseparable patterns to a separable high-dimensional feature space, which further improves the accuracy of discriminations. However, due to the existence of kernel functions, KELM is sensitive to the kernel parameters settings. Thus, the quantum-behaved particle swarm optimization (QPSO) is used to optimize the parameters of KELM and in this paper and the QPSO-KELM method is applied to improving the classification accuracy of wound infection detection. The results demonstrate that the proposed method can obtain excellent classification performance in E-nose applications.

2. Materials and Experiments

The datasets used in the paper were obtained by a home-made E-nose, which details can be found in our previous publication [42]. However, to make the paper self-contained, the system structure and experimental setup are briefly repeated here.

2.1. E-Nose System

The sensor array in the research is constructed due to the high sensitivity and quick response of the sensors to the metabolites of three different bacteria. The E-nose system consists of 15 sensors: Fourteen metal oxide gas sensors (TGS800, TGS813, TGS816, TGS822, TGS825, TGS826, TGS2600, TGS2602, TGS2620, WSP2111, MQ135, MQ138, QS-01 and SP3S-AQ2) and one electrochemical sensor (AQ sensor). A 14-bit data acquisition system (DAS) is used as interface between the sensor array and a computer. The DAS converts analog signals from sensor array into digital signals which are stored in the computer for further processing.

2.2. Experimental Setup

Figure 1 shows the schematic diagram of the experimental system. It can be observed that the E-nose system is composed of an E-nose chamber, a data acquisition system (DAS), a pump, a rotor flowmeter, a triple valve, a filter, a glass wild-mouth bottle and a computer. The filter is used to purify the air. The pump is used to convey the VOCs and clean air over the sensor array. The rotor flowmeter is used to control the flow rate during the experiments. The three-way valve is used for switch between VOCs and clean air. The experimental setup has also been mentioned in [33]. The experimental procedure in this paper can be summarized as follows.
Each mouse was put in a big glass bottle with a rubber stopper. Two holes were made in the rubber stopper with two thin glass tubes inserted. One longer glass tube was used as an exit pipe and hung above the wound as close as possible while the shorter one was used as an intake-tube, inserted into the glass a little and was close to the bottleneck. The gases which contained the VOCs of the wound on the mouse outflowed along the longer glass tube and flowed into the sensor chamber. The air flowed into the glass along the shorter glass tube. Each test process comprises three stages: the baseline stage, the response stage and the recovery stage. In the baseline stage, the three-way valve switched on Port 1 and the clean air purified by the filter flowed through the sensor chamber for 3 min. In the response stage, the three-way valve switched on Port 2 and the gases containing the VOCs of the wound flowed through the sensor chamber for 5 min. In the recovery stage, the three-way valve switched on Port 1 again and the clean air flowed through the sensor chamber for 15 min. During the three stages of one test, the DAS always sampled the data and stored them in the computer. After one test and before the next one, for eliminating the influence of the residual odors, the sensor chamber was purged by the clean air for 5 min and in the purging process the DAS did not sample the data.
Four groups of mice were tested in the research, including one control group and three groups infected by Staphylococcu aureus, Escherichia coli and Pseudomonas aeruginosa, respectively. Twenty tests for each groups of mice in the same conditions were made, and finally 80 samples for all four groups of mice were collected from the above procedures. Figure 2 illustrates the sensor responses process when they are exposed to four different target wounds, where X-axis is the response time of the sensors and Y-axis is the output voltage of the sensors.

3. Methodology

3.1. KELM

ELM [36,41,43,44,45] is designed as a single hidden layer feed forward network and has been proved that its learning speed is extremely fast. It provides efficient unified solutions to generalized SLFNs, whose hidden nodes can be any piecewise nonlinear function. KELM generalizes ELM from explicit activation to implicit mapping function and produce better generalization in most applications. A brief introduction of KELM is as follows:
Suppose there are N training samples (xi,ti) where xi = [xi1,xi2,…,xin]TRn denotes one sample point in the n-dimensional space and ti = [ti1,ti2,…,tin]TRm is the sample class label. The SLFNs and activation function are defined as:
o i = j = 1 L β j g j ( x i ) = j = 1 L β j g ( w j x i + b j ) w j = [ w j 1 , w j 2 , , w j n ] T , β j = [ β j 1 , β j 2 , , β j m ] T , i = 1 , , N
where xi is the i-th sample, L is the number of hidden nodes, wj and βj denote the input weights to the hidden layer and the output weight linking the j-th hidden node to the output layer respectively. Meanwhile, bj is bias of the j-th hidden node and oi is the output vector of the input sample xi.
Then, this SLFN can approximate those N samples with zero error, which means that:
i = 1 L o i t i = 0
where ti is the sample class label vector of the input sample xi. That is to say, there exist βj, wj and bj such that:
j = 1 L β j g ( w j x i + b j ) = t i
This can be written as:
( g ( w 1 x 1 + b 1 ) g ( w L x 1 + b L ) g ( w 1 x N + b 1 ) g ( w L x N + b L ) ) N × L ( β 1 T β L T ) L × m = ( t 1 T t L T ) N × m
Then, Equation (4) can be also written as matrix form:
H β = T
where H = [ h ( x 1 ) h ( x N ) ] = ( g ( w 1 x 1 + b 1 ) g ( w L x 1 + b L ) g ( w 1 x N + b 1 ) g ( w L x N + b L ) ) is hidden layer output matrix.
Then, training such an SLFN is equivalent to finding a least-square solution as follows:
β = H + T
where H+ is the Moore-Penrose generalized inverse of the hidden layer output matrix H.
Huang et al. suggested adding a positive value 1/C (C is regularization coefficient) to calculate the output weights as follows according to the ridge regression theory:
β = H T ( 1 C + H H T ) 1 T
The output function for the SLFN is:
f ( x i ) = h ( x i ) β
where h(xi) is the output of the hidden nodes and actually maps the data from input space to the hidden layer feature space H.
Thus, substitute Equation (7) into Equation (8), the output function can be defined as follows:
f ( x i ) = [ h ( x i ) h ( x 1 ) T h ( x i ) h ( x N ) T ] ( 1 C + H H T ) 1 T
We define a kernel function k as:
k l k = k ( x l , x k ) = h ( x l ) h ( x k ) T
and then a KELM can be constructed using the kernel function exclusively, without having to consider the mapping explicitly.
We express this kernel function by Equation (11) for given classes p and q:
( k l k ) p q = h ( x l p ) h ( x k q ) T
Let K be a N × N matrix and K = (Kpq)p = 1,2,…,S, q = 1,2,…,S where Kpq, is a matrix composed of inner the product in the feature space:
K = ( K p q ) p = 1 , 2 , , S q = 1 , 2 , , S , K p q = ( k l k ) l = 1 , 2 , , N p k = 1 , 2 , , N q
where S is the number of the total classes, Np and Nq are the number of the samples in p-th and q-th classes respectively, Kpq is a (Np × Nq) matrix and K is a symmetrical matrix such that K p q T = K p q .
We can define the kernel matrix K = HHT from Equation (10) and the output function of KELM can be written as:
f ( x i ) = ( K ( x i , x 1 ) K ( x i , x N ) ) T ( 1 C + K ) 1 T
Some common kernel functions including linear kernel function, polynomial kernel function, Gaussian kernel function, wavelet kernel function are applied. Kernel parameters of the kernel functions, together with regularization coefficient C in Equation (13) will be optimized by QPSO. In this way, the index of the output node with the highest output value is considered as the label of the input data [44].

3.2. QPSO-KELM Model

It is well known that the parameters in algorithms will affect the performances. Therefore, QPSO [46] is used to optimize the value of C in Equation (10) and parameters of the kernel function. The dimension of searching space is corresponding to the number of parameters of KELM with different kernel functions, and the position of each particle represents the parameter values of kernel functions. Because the best generalization performance of KELM can be optimized by QPSO, the testing accuracy can be used as the fitness function of QPSO. The specific steps of QPSO-KELM are described as follows.
Step 1:
Normalize all the dataset extracted from the E-nose signals into the range [0,1] and the number of iterations and the population size are set as 30 and 400.
Step 2:
Initialize the position and local optimal position of each candidate particle, as well as global best position of the swarm.
Step 3:
Calculate each particle’s fitness value according to the fitness function. Update the local optimal positions and global best position.
Step 4:
Update the position of each candidate particle in each iteration, which can be calculated by Equation (13).
Step 5:
Check the termination criterion. If the maximum number of iterations is not yet reached, return to Step 3 or else go to the Step 6.
Step 6:
The best combination of parameters of the kernel function can be acquired, which result in the maximal fitness value.
The flowchart of this procedure is illustrated in Figure 3.

4. Results and Discussion

Different features which are able to effectively represent the response of sensors are extracted from the time domain and frequency domain in order to evaluate the effectiveness of the proposed model. The peak value, the integral in the response stage, coefficients of Fourier coefficients (the DC component and first order harmonic component), and approximation coefficients of db1 wavelet of sensor response curve are chosen to be on behalf of the characteristics of E-nose signals from two transform domains [47,48,49,50]. Then, leave-one-out cross validation (LOO-CV) method is employed to evaluate the performances of different methods in this experiment for making full use of the data set. Another five classification models, namely ELM, SVM, KNN, LDA and quadratic discriminant analysis (QDA), are applied for comparison with KELM. ELM is an algorithm for single-hidden layer feed forward networks training that leads to fast networking requiring low human supervision. The main idea in ELM is that the network hidden layer parameters need not to be learned, but can be randomly assigned. The only parameter is the number of hidden nodes in the hidden layer of SLFN, which is normally obtained by a trial and error method. Thus, the input weights are within (−1, 1) and the hidden layer biases are within (0, 1). 100 experiments were carried out according to the number of hidden nodes in the hidden layer from 1 to 100. Because the input weights and the hidden layer biases were chosen randomly, this experiment was repeated for 100 times. The best performance of all results will be regarded as the final classification results of ELM. For SVM, LIBSVM is employed in this paper, which is devolved by Chang and Lin [51].
KNN requires two parameters to tune: The number of neighbor k and the distance metric. In this work, the values of k vary from 1 to 20, and several distance metrics which are used are Euclidean distance, cityblock distance, cosine distance and correlation distance. The best classification accuracy of different values of k and distance metrics will be regarded as the final results of the KNN.
Table 1, Table 2, Table 3 and Table 4 list the classification results of the four feature extraction techniques and five classification models. The kernel function of KELM is set to Gaussian kernel. The bold type numbers in diagonal indicate the number of samples classified correctly, while others indicate the number of samples misclassified.
It can be observed from the above four tables that the classification accuracy of the four wounds is influenced both by different features and classification models. In general, features extracted from frequency domain can achieve better results, while features extracted from time domain do worse. It can be also seen that the classification effect of wavelet coefficients feature works best no matter what kinds of classifier are used, while peak value feature is just performs worst. QPSO-KELM always performs better than other four classifiers regardless of what kinds of features are used. SVM is invariably performs better than rest three classifiers as well. For wounds uninfected, the best performance is achieved when the wavelet feature is put into the QPSO-KELM model, where there is no sample misclassified; for wounds infected with Staphylococcu aureus, QPSO-KELM performs best when the peak value is used as the feature, in which there is only one sample misclassified; for wounds infected with Escherichia coli, the highest classification accuracy is achieved by QDA with the feature of Fourier coefficients; for wounds infected with Pseudomonas aeruginosa, QPSO-KELM achieves best when features are integral value and wavelet coefficients.
Figure 4 and Figure 5 show the variation of the classification rate with the number of hidden nodes in the hidden layer of ELM and the k value of KNN for the priority to classification of wavelet coefficients feature. Figure 4 shows only the classification results of one of the 100 repeated experiments to display the change process with the number of hidden nodes in the hidden layer varying from 1 to 100. It can be clearly seen that the classification rate gradually improves with the number of hidden nodes from 1 to 34 and from 79 to 96 from the Figure 4, while the classification rate gradually declines with the number of hidden nodes from 55 to 79. Moreover, ELM can achieve the best classification accuracy of 85% when is the number of hidden nodes are 45, 51 and 55.
Figure 5 manifests that the classification rate gradually declines as the k value increases on the whole. For different distance metrics, the cityblock distance performs worst except k = 8, 10, 20. Meanwhile, the cosine distance can achieve the best classification accuracy of 86.25% at the start stage and performs best as well at the last stage.
Another three traditional optimization methods are also investigated and used to devaluate the effectiveness of the proposed model when wavelet coefficients are used as features. PSO [52], Genetic algorithm (GA) [53,54] and Grid search algorithm (GS) are employed to optimize parameters of KELM. For GA and PSO, the maximum number of iterations and the population size are also 400 and 30, respectively, which is the same as those of QPSO. For GS, the ranges of the model parameters are set according to [44].
The range of the cost parameter C and the kernel parameter of the Gaussian kernel function are both [2–25,225], and the step length is set as 20.5. Their classification performances are shown in Table 5.
It is obviously that the QPSO-KELM model obtains 95% classification rate, while other traditional methods perform worse than the proposed model from Table 5, especially that it is all predicted correctly for wounds uninfected and wounds infected with Pseudomonas aeruginosa. QPSO-KELM, PSO-KELM, GA-KELM and GS-KELM can only achieve 88.75%, 87.5% and 86.25% classification rates, respectively.
It is well known that the choice of kernel function plays a crucial role in recognition and generalization capability. Thus, in order to further explore the effects of different kernel functions on the QPSO-KELM model, the effects of four kinds of common kernel functions combined with wavelet features are investigated in this experiment. Their classification performances of different kernel functions are shown in Table 6.
It can be clearly concluded that the QPSO-KELM model with Gaussian kernel function performs best from Table 6, while the linear kernel function achieves the worst accuracy. Meanwhile, the performance of the polynomial kernel function is close to that of wavelet kernel function, which achieves 91.25% and 92.50% respectively. It means that the proposed model performs best in all of the above methods.
We also use the proposed model to deal with another two experimental E-nose datasets: (1) dataset of an E-nose which recognizes seven bacteria: Pseudomonas aeruginosa, Escherichia coli, Acinetobacter baumannii, Staphylococcu aureus, Staphylococcus epidermidis, Klebsiella pneumoniae and Streptococcus pyogenes. The classification results of various classification models based on steady-state signals of sensors are shown in Table 7. More details concerning the experiment can be found in [55]; (2) dataset of an E-nose which detects six indoor air contaminants including formaldehyde (HCHO), benzene (C6H6), toluene (C7H8), carbon monoxide (CO), ammonia (NH3) and nitrogen dioxide (NO2) and classification results are also shown in Table 8. More details include dataset generation regarding the experiment can be found in [56].
It can be clearly concluded that the proposed QPSO-KELM model achieves the best classification accuracy among all of the above classification models for different datasets. The KELM achieves the best recognition performance of 100% for the dataset in [55] and can also obtain the best recognition accuracy except the recognition rate 70% of NH3 for the dataset [56]. It demonstrates that the QPSO-KELM approach has outstanding generalized performance with other datasets, which efficacy does not depend on a particular dataset.

5. Conclusions

In this paper, a new methodology based on the QPSO-KELM model has been presented to enhance the performance of an E-nose for wound infection detection. Four kinds of features extracted from the time and frequency domains have been developed to demonstrate the effectiveness of this classification model for four different classes of wounds. It first introduces the kernel method based on extreme learning machine into the E-nose application of this paper, which provides a new idea for signal processing of E-nose data. Moreover, this paper also provides a good solution for the optimization of kernel function parameters by QPSO, which is a contraction mapping algorithm that outperforms ordinary optimization algorithms in the rate of convergence and convergence ability. Experimental tests have been carried out to verify that the proposed QPSO-KELM model can lead to a higher accuracy rate and manifest that the QPSO-KELM model can obviously enhance E-nose performance in various applications. The model in this study also provides an efficient approach in applications related to classification or prediction, not only in E-nose applications, but also in other uses.

Acknowledgments

The work was supported by National Natural Science Foundation of China (Grant Nos. 61372139, 61571372, 61101233, 60972155), Program for New Century Excellent Talents in University (Grant Nos.[2013]47), Chongqing Postdoctoral Science Foundation Special Funded Project (Grant No. xm2015020), Science and Technology Personnel Training Program Fund of Chongqing (Grant No.cstc2013kjrc-qnrc40011), “Spring Sunshine Plan” Research Project of Ministry of Education of China (Grant No. z2011148), Fundamental Research Funds for the Central Universities (Grant Nos. XDJK2014C016, XDJK2016A001, XDJK2014A009, XDJK2013B011), Program for Excellent Talents in scientific and technological activities for Overseas Scholars, Ministry of Personnel in China (Grant No. 2012-186), University Excellent Talents Supporting Foundations in of Chongqing (Grant No. 2011-65), University Key Teacher Supporting Foundations of Chongqing (Grant No. 2011-65), National Undergraduate Training Programs for Innovation and Entrepreneurship of China (Grant No. 201510635059). Undergraduate Students Science and Technology Innovation Fund Project of Southwest University (Grant No. 20151803002).

Author Contributions

Jia Yan is the group leader and he was responsible for the project management and in charge of revising this manuscript. Chao Peng is in charge of data analysis and the preparation of this manuscript. Pengfei Jia is in charge of planning and performing experiments. Shukai Duan and Lidan Wang provided valuable advice about the revised manuscript. Songlin Zhang is involved in discussions and the experimental analysis.

Conflicts of Interest

The authors declare no conflict of interest.

References

  1. Gardner, J.W.; Bartlett, P.N. A brief history of electronic noses. Sens. Actuators B Chem. 1994, 18, 211–220. [Google Scholar] [CrossRef]
  2. Röck, F.; Barsan, N.; Weimar, U. Electronic nose: Current status and future trends. Chem. Rev. 2008, 108, 705–725. [Google Scholar] [CrossRef] [PubMed]
  3. Wilson, A.D.; Baietto, M. Applications and Advances in Electronic-Nose Technologies. Sensors 2009, 9, 5099–5148. [Google Scholar] [CrossRef] [PubMed]
  4. Biondi, E.; Blasioli, S.; Galeone, A.; Spinelli, F.; Cellini, A.; Lucchese, C.; Braschi, I. Detection of potato brown rot and ring rot by electronic nose: From laboratory to real scale. Talanta 2014, 129, 422–430. [Google Scholar] [CrossRef] [PubMed]
  5. Kaur, R.; Kumar, R.; Gulati, A.; Ghanshyam, C.; Kapur, P.; Bhondekar, A.P. Enhancing electronic nose performance: A novel feature selection approach using dynamic social impact theory and moving window time slicing for classification of Kangra orthodox black tea (Camellia sinensis (L.) O. Kuntze). Sens. Actuators B Chem. 2012, 166, 309–319. [Google Scholar] [CrossRef]
  6. Wei, Z.; Wang, J.; Zhang, W. Detecting internal quality of peanuts during storage using electronic nose responses combined with physicochemical methods. Food Chem. 2015, 170, 90–96. [Google Scholar] [CrossRef] [PubMed]
  7. Loutfi, A.; Coradeschi, S.; Mani, G.K.; Shankar, P.; Rayappan, J.B.B. Electronic noses for food quality: A review. J. Food Eng. 2015, 144, 103–111. [Google Scholar] [CrossRef]
  8. Schnabel, R.M.; Boumans, M.L.L.; Smolinska, A.; Stobberingh, E.E.; Kaufmann, R.; Roekaerts, P.M.H.J.; Bergmans, D.C.J.J. Electronic nose analysis of exhaled breath to diagnose ventilator-associated pneumonia. Respir. Med. 2015, 109, 1454–1459. [Google Scholar] [CrossRef] [PubMed]
  9. Wilson, A.D. Recent progress in the design and clinical development of electronic-nose technologies. Nanobiosens. Dis. Diagn. 2016, 5, 15–27. [Google Scholar] [CrossRef]
  10. Adiguzel, Y.; Kulah, H. Breath sensors for lung cancer diagnosis. Biosen. Bioelectron. 2015, 65, 121–138. [Google Scholar] [CrossRef] [PubMed]
  11. Scarlata, S.; Pennazza, G.; Santonico, M.; Pedone, C.; Incalzi, R.A. Exhaled breath analysis by electronic nose in respiratory diseases. Exp. Rev. Mol. Diagn. 2015, 15, 933–956. [Google Scholar] [CrossRef] [PubMed]
  12. Xu, L.; He, J.; Duan, S.; Wu, X.; Wang, Q. Comparison of Machine Learning algorithms for concentration detection and prediction of formaldehyde based on Electronic Nose. Sens. Rev. 2016, 36, 207–216. [Google Scholar] [CrossRef]
  13. Capelli, L.; Sironi, S.; Del Rosso, R. Electronic noses for environmental monitoring applications. Sensors 2014, 14, 19979–20007. [Google Scholar] [CrossRef] [PubMed] [Green Version]
  14. Wilson, A.D. Diverse applications of electronic nose technologies in agriculture and forestry. Sensors 2013, 13, 2295–2348. [Google Scholar] [CrossRef] [PubMed]
  15. Trirongjitmoah, S.; Juengmunkong, Z.; Srikulnath, K.; Somboon, P. Classification of garlic cultivars using an electronic nose. Comput. Electron. Agric. 2015, 113, 148–153. [Google Scholar] [CrossRef]
  16. Zhang, B.; Huang, Y.; Zhang, Q.; Liu, X.; Li, F.; Chen, K. Fragrance discrimination of Chinese Cymbidium species and cultivars using an electronic nose. Sci. Hortic. Amst. 2014, 172, 271–277. [Google Scholar] [CrossRef]
  17. Wilson, A.D.; Lester, D.G.; Oberle, C.S. Development of conductive polymer analysis for the rapid detection and identification of phytopathogenic microbes. Phytopathology 2004, 94, 419–431. [Google Scholar] [CrossRef] [PubMed]
  18. Green, G.C.; Chan, A.D.C.; Lin, M. Robust identification of bacteria based on repeated odor measurements from individual bacteria colonies. Sens. Actuators B Chem. 2014, 190, 16–24. [Google Scholar] [CrossRef]
  19. Yan, J.; Duan, S.; Huang, T.; Wang, L. Hybrid Feature Matrix Construction and Feature Selection Optimization Based Multi-objective QPSO for Electronic Nose in Wound Infection Detection. Sens. Rev. 2016, 36, 23–33. [Google Scholar] [CrossRef]
  20. Güney, S.; Atasoy, A. Multiclass classification of n-butanol concentrations with k-nearest neighbor algorithm and support vector machine in an electronic nose. Sens. Actuators B Chem. 2012, 166, 721–725. [Google Scholar] [CrossRef]
  21. Westenbrink, E.; Arasaradnam, R.P.; O’Connellc, N.; Bailey, C.; Nwokolo, C.; Bardhan, K.D.; Covington, J.A. Development and application of a new electronic nose instrument for the detection of colorectal cancer. Biosens. Bioelectron. 2015, 67, 733–738. [Google Scholar] [CrossRef] [PubMed]
  22. Güney, S.; Atasoy, A. Study of fish species discrimination via electronic nose. Comput. Electron. Agric. 2015, 119, 83–91. [Google Scholar] [CrossRef]
  23. Qiu, S.; Wang, J.; Gao, L. Discrimination and characterization of strawberry juice based on electronic nose and tongue: Comparison of different juice processing approaches by LDA, PLSR, RF, and SVM. J. Agric. Food Chem. 2014, 62, 6426–6434. [Google Scholar] [CrossRef] [PubMed]
  24. Xiong, Y.; Xiao, X.; Yang, X.; Yan, D.; Zhang, C.; Zou, H.; Lin, H.; Peng, L.; Xiao, X.; Yan, Y. Quality control of Lonicera japonica stored for different months by electronic nose. J. Pharm. Biomed. 2014, 91, 68–72. [Google Scholar] [CrossRef] [PubMed]
  25. Zhang, H.; Wang, J.; Ye, S.; Chang, M. Application of electronic nose and statistical analysis to predict quality indices of peach. Food Bioprocess Technol. 2012, 5, 65–72. [Google Scholar] [CrossRef]
  26. Dutta, R.; Dutta, R. “Maximum probability rule” based classification of MRSA infections in hospital environment: Using electronic nose. Sens. Actuators B Chem. 2006, 120, 156–165. [Google Scholar] [CrossRef]
  27. Banerjee(Roy), R.; Chattopadhyay, P.; Tudu, B.; Bhattacharyya, N.; Bandyopadhyay, R. Artificial flavor perception of black tea using fusion of electronic nose and tongue response: A Bayesian statistical approach. J. Food Eng. 2014, 142, 87–93. [Google Scholar] [CrossRef]
  28. Tian, X.; Wang, J.; Cui, S. Analysis of pork adulteration in minced mutton using electronic nose of metal oxide sensors. J. Food Eng. 2013, 119, 744–749. [Google Scholar] [CrossRef]
  29. Zhang, L.; Tian, F.; Liu, S.; Guo, J.; Hu, B.; Ye, Q. Chaos based neural network optimization for concentration estimation of indoor air contaminants by an electronic nose. Sens. Actuators A Phys. 2013, 189, 161–167. [Google Scholar] [CrossRef]
  30. Saraoglu, H.M.; Selvi, A.O.; Ebeoglu, M.A. Electronic nose system based on quartz crystal microbalance sensor for blood glucose and HbA1c levels from exhaled breath odor. IEEE Sens. J. 2013, 13, 4229–4235. [Google Scholar] [CrossRef]
  31. Cho, J.H.; Kurup, P.U. Decision tree approach for classification and dimensionality reduction of electronic nose data. Sens. Actuators B Chem. 2011, 160, 542–548. [Google Scholar] [CrossRef]
  32. Ghasemi-Varnamkhasti, M.; Mohtasebi, S.S.; Siadat, M.; Siadat, M.; Ahmadi, H.; Ravazi, S.H. From simple classification methods to machine learning for the binary discrimination of beers using electronic nose data. Engineering in Agriculture. Environ. Food 2015, 8, 44–51. [Google Scholar]
  33. Jia, P.; Tian, F.; He, Q.; Fan, S.; Liu, J.; Yang, S.X. Feature extraction of wound infection data for electronic nose based on a novel weighted KPCA. Sens. Actuators B Chem. 2014, 201, 555–566. [Google Scholar] [CrossRef]
  34. Callejón, R.M.; Amigo, J.M.; Pairo, E.; Garmón, S.; Ocaña, J.A. Classification of Sherry vinegars by combining multidimensional fluorescence, parafac and different classification approaches. Talanta 2012, 88, 456–462. [Google Scholar] [CrossRef] [PubMed]
  35. Huang, G.B.; Zhu, Q.Y.; Siew, C.K. Extreme learning machine: A new learning scheme of feedforward neural networks. Proc. IEEE Int. jt. Conf. Neural Netw. 2004, 2, 985–990. [Google Scholar]
  36. Qiu, S.; Gao, L.; Wang, J. Classification and regression of ELM, LVQ and SVM for E-nose data of strawberry juice. J. Food Eng. 2015, 144, 77–85. [Google Scholar] [CrossRef]
  37. Sun, Z.L.; Choi, T.M.; Au, K.F.; Yu, Y. Sales forecasting using extreme learning machine with applications in fashion retailing. Decis. Support Syst. 2008, 46, 411–419. [Google Scholar] [CrossRef]
  38. Liang, N.Y.; Saratchandran, P.; Huang, G.B. Classification of mental tasks from EEG signals using extreme learning machine. Int. J. Neural Syst. 2006, 16, 29–38. [Google Scholar] [CrossRef] [PubMed]
  39. Mohammed, A.A.; Minhas, R.; Wu, Q.M.J.; Sid-Ahmed, M.A. Human face recognition based on multidimensional PCA and extreme learning machine. Pattern Recognit. 2011, 44, 2588–2597. [Google Scholar] [CrossRef]
  40. Qiu, S.; Wang, J.; Tang, C.; Du, D. Comparison of ELM, RF, and SVM on E-nose and E-tongue to trace the quality status of mandarin (Citrus unshiu Marc.). J. Food Eng. 2015, 166, 193–203. [Google Scholar] [CrossRef]
  41. Huang, G.B.; Zhu, Q.Y.; Siew, C.K. Extreme learning machine: Theory and applications. Neurocomputing 2006, 70, 489–501. [Google Scholar] [CrossRef]
  42. Guo, X.; Peng, C.; Zhang, S.; Yan, J.; Duan, S.; Wang, L.; Jia, P.; Tian, F. A novel feature extraction approach using window function capturing and QPSO-SVM for enhancing electronic nose performance. Sensors 2015, 15, 15198–15217. [Google Scholar] [CrossRef] [PubMed]
  43. Zhu, Q.Y.; Qin, A.K.; Suganthan, P.N.; Huang, G.B. Evolutionary extreme learning machine. Pattern Recognit. 2005, 38, 1759–1763. [Google Scholar] [CrossRef]
  44. Huang, G.B.; Zhou, H.; Ding, X. Extreme learning machine for regression and multiclass classification. IEEE Trans. Syst. Man Cybern. B 2012, 42, 513–529. [Google Scholar] [CrossRef] [PubMed]
  45. Huang, G.B.; Wang, D.H.; Lan, Y. Extreme learning machines: A survey. Int. J. Mach. Learn. Cybern. 2011, 2, 107–122. [Google Scholar] [CrossRef]
  46. Sun, J.; Feng, B.; Xu, W. Particle swarm optimization with particles having quantum behavior. Proc. Congr. Evol. Comput. 2004, 1, 325–331. [Google Scholar]
  47. Yan, J.; Guo, X.; Duan, S.; Jia, P.; Wang, L.; Peng, C.; Zhang, S. Electronic Nose Feature Extraction Methods: A Review. Sensors 2015, 15, 27804–27831. [Google Scholar] [CrossRef] [PubMed]
  48. He, A.; Yu, J.; Wei, G.; Chen, Y.; Wu, H.; Tang, Z. Short-Time Fourier Transform and Decision Tree-Based Pattern Recognition for Gas Identification Using Temperature Modulated Microhotplate Gas Sensors. J. Sens. 2016, 2016. [Google Scholar] [CrossRef]
  49. Dai, Y.; Zhi, R.; Zhao, L.; Gao, H.; Shi, B.; Wang, H. Longjing tea quality classification by fusion of features collected from E-nose. Chemom. Intell. Lab. 2015, 144, 63–70. [Google Scholar] [CrossRef]
  50. Moreno-Barón, L.; Cartas, R.; Merkoci, A.; Alegret, S. Application of the wavelet transform coupled with artificial neural networks for quantification purposes in a voltammetric electronic tongue. Sens. Actuators B Chem. 2006, 113, 487–499. [Google Scholar] [CrossRef]
  51. Chang, C.C.; Lin, C.J. LIBSVM: A library for support vector machines. ACM Trans. Intell. Syst. Technol. 2011, 2, 389–396. [Google Scholar] [CrossRef]
  52. Poli, R.; Kennedy, J.; Blackwell, T. Particle swarm optimization. Swarm Intell. US. 2007, 1, 33–57. [Google Scholar] [CrossRef]
  53. Whitley, D. A genetic algorithm tutorial. Stat. Comput. 1994, 4, 65–85. [Google Scholar] [CrossRef]
  54. Gardner, J.W.; Boilot, P.; Hines, E.L. Enhancing electronic nose performance by sensor selection using a new integer-based genetic algorithm approach. Sens. Actuators B Chem. 2005, 106, 114–121. [Google Scholar] [CrossRef]
  55. Yan, J.; Tian, F.; He, Q.; Shen, Y.; Xu, S.; Feng, J. Feature extraction from sensor data for detection of wound pathogen based on electronic nose. Sens. Mater. 2012, 24, 57–73. [Google Scholar]
  56. Dang, L.; Tian, F.; Zhang, L.; Kadri, C.; Yin, X.; Peng, X. A novel classifier ensemble for recognition of multiple indoor air contaminants by an electronic nose. Sens. Actuators A Phys. 2014, 207, 67–74. [Google Scholar] [CrossRef]
Figure 1. Schematic diagram of the experimental system.
Sensors 16 00520 g001
Figure 2. E-nose response to four wounds.
Sensors 16 00520 g002
Figure 3. Computational procedure of QPSO for optimizing KELM.
Sensors 16 00520 g003
Figure 4. The performance of ELM according to the number of hidden nodes from 1 to 100.
Sensors 16 00520 g004
Figure 5. The performance of KNN with different k values and distance metrics.
Sensors 16 00520 g005
Table 1. Classification results of peak value.
ClassPredicted as *
KELMELMSVMLDAKNNQDA
123412341234123412341234
1173001630116400146001640015302
2119004142051500911002171031610
3111620014600173101630315204133
4102170121700416005151121620315
Total86.25%76.25%80.00%70.00%80.00%73.75%
* 1, No-infection; 2, Staphylococcu aureus; 3, Escherichia coli; 4, Pseudomonas aeruginosa, similarly hereinafter.
Table 2. Classification results of integral value.
ClassPredicted as *
KELMELMSVMLDAKNNQDA
123412341234123412341234
1173001541015500137001730016310
2317006131041600812002180021440
3101810117200173101720315200173
4000200031700218004160161300416
Total90.00%77.50%82.50%72.50%78.75%78.75%
Table 3. Classification results of Fourier coefficients.
ClassPredicted as *
KELMELMSVMLDAKNNQDA
123412341234123412341234
1191001730017300164001730018200
2218002180021800317001190001550
3001820216211162001640118100191
4002180041600119004161111700515
Total91.25%83.75%87.50%81.25%88.75%83.75%
Table 4. Classification results of wavelet coefficients.
ClassPredicted as *
KELMELMSVMLDAKNNQDA
123412341234123412341234
1200001541017300173001730020000
2218002180031700515003170011720
3101810018200182101810018200173
4000200121700119002180031700614
Total95.00%85.00%88.75%85.00%86.25%85.00%
Table 5. Comparison with different optimization methods for KELM.
ClassPredicted as *
QPSOPSOGAGS
1234123412341234
120000182001820017102
221800317003170021800
310181001910019110172
400020003170041610217
Total95.00%88.75%87.50%86.25%
Table 6. Classification results of four kernel functions used in the QPSO-KELM model.
ClassPredicted as *
GaussianLinearPolynomialWavelet
1234123412341234
120000182001820019100
221800218002180021800
310181001731018110181
400020005150011900119
Total95.00%85.00%91.25%92.50%
Table 7. Accuracy results of various feature extraction techniques and classification models for datasets in [55].
ClassAccuracy Rate (%)
KELMSVMELMKNNLDAQDA
Pseudomonas aeruginosa100.00100.0080.00100.00100.00100.00
Escherichia coli100.00100.00100.00100.00100.0090.00
Acinetobacter baumannii100.00100.0090.0090.0090.00100.00
Staphylococcu aureus100.0090.0090.0080.0090.0090.00
Staphylococcus epidermidis100.00100.00100.00100.00100.00100.00
Klebsiella pneumoniae100.0090.00100.0080.0080.0070.00
Streptococcus pyogenes100.0080.0090.0060.0060.0060.00
Average100.0094.2992.8687.1488.5787.14
Table 8. Accuracy results of various feature extraction techniques and classification models for datasets in [56].
ClassAccuracy Rate (%)
KELMSVMELMKNNLDAQDA
HCHO94.2394.2392.3190.3894.2363.46
C6H690.9187.8872.7375.7657.5887.88
C7H8100.00100.00100.00100.00100.00100.00
CO100.0091.67100.0091.6783.33100.00
NH370.0060.0070.0070.0080.0080.00
NO2100.00100.0066.6766.6783.3383.33
Average92.5288.9683.6282.4183.0885.78

