
Bootstrapping Security Policies for Wearable Apps Using Attributed Structural Graphs


Abstract
:1. Introduction
1.1. Overview of Our Contribution
1.2. Organization
2. System Model
2.1. WBAN Elements
- If there exists a network connection between devices and , then .
- If app is deployed on device , then .
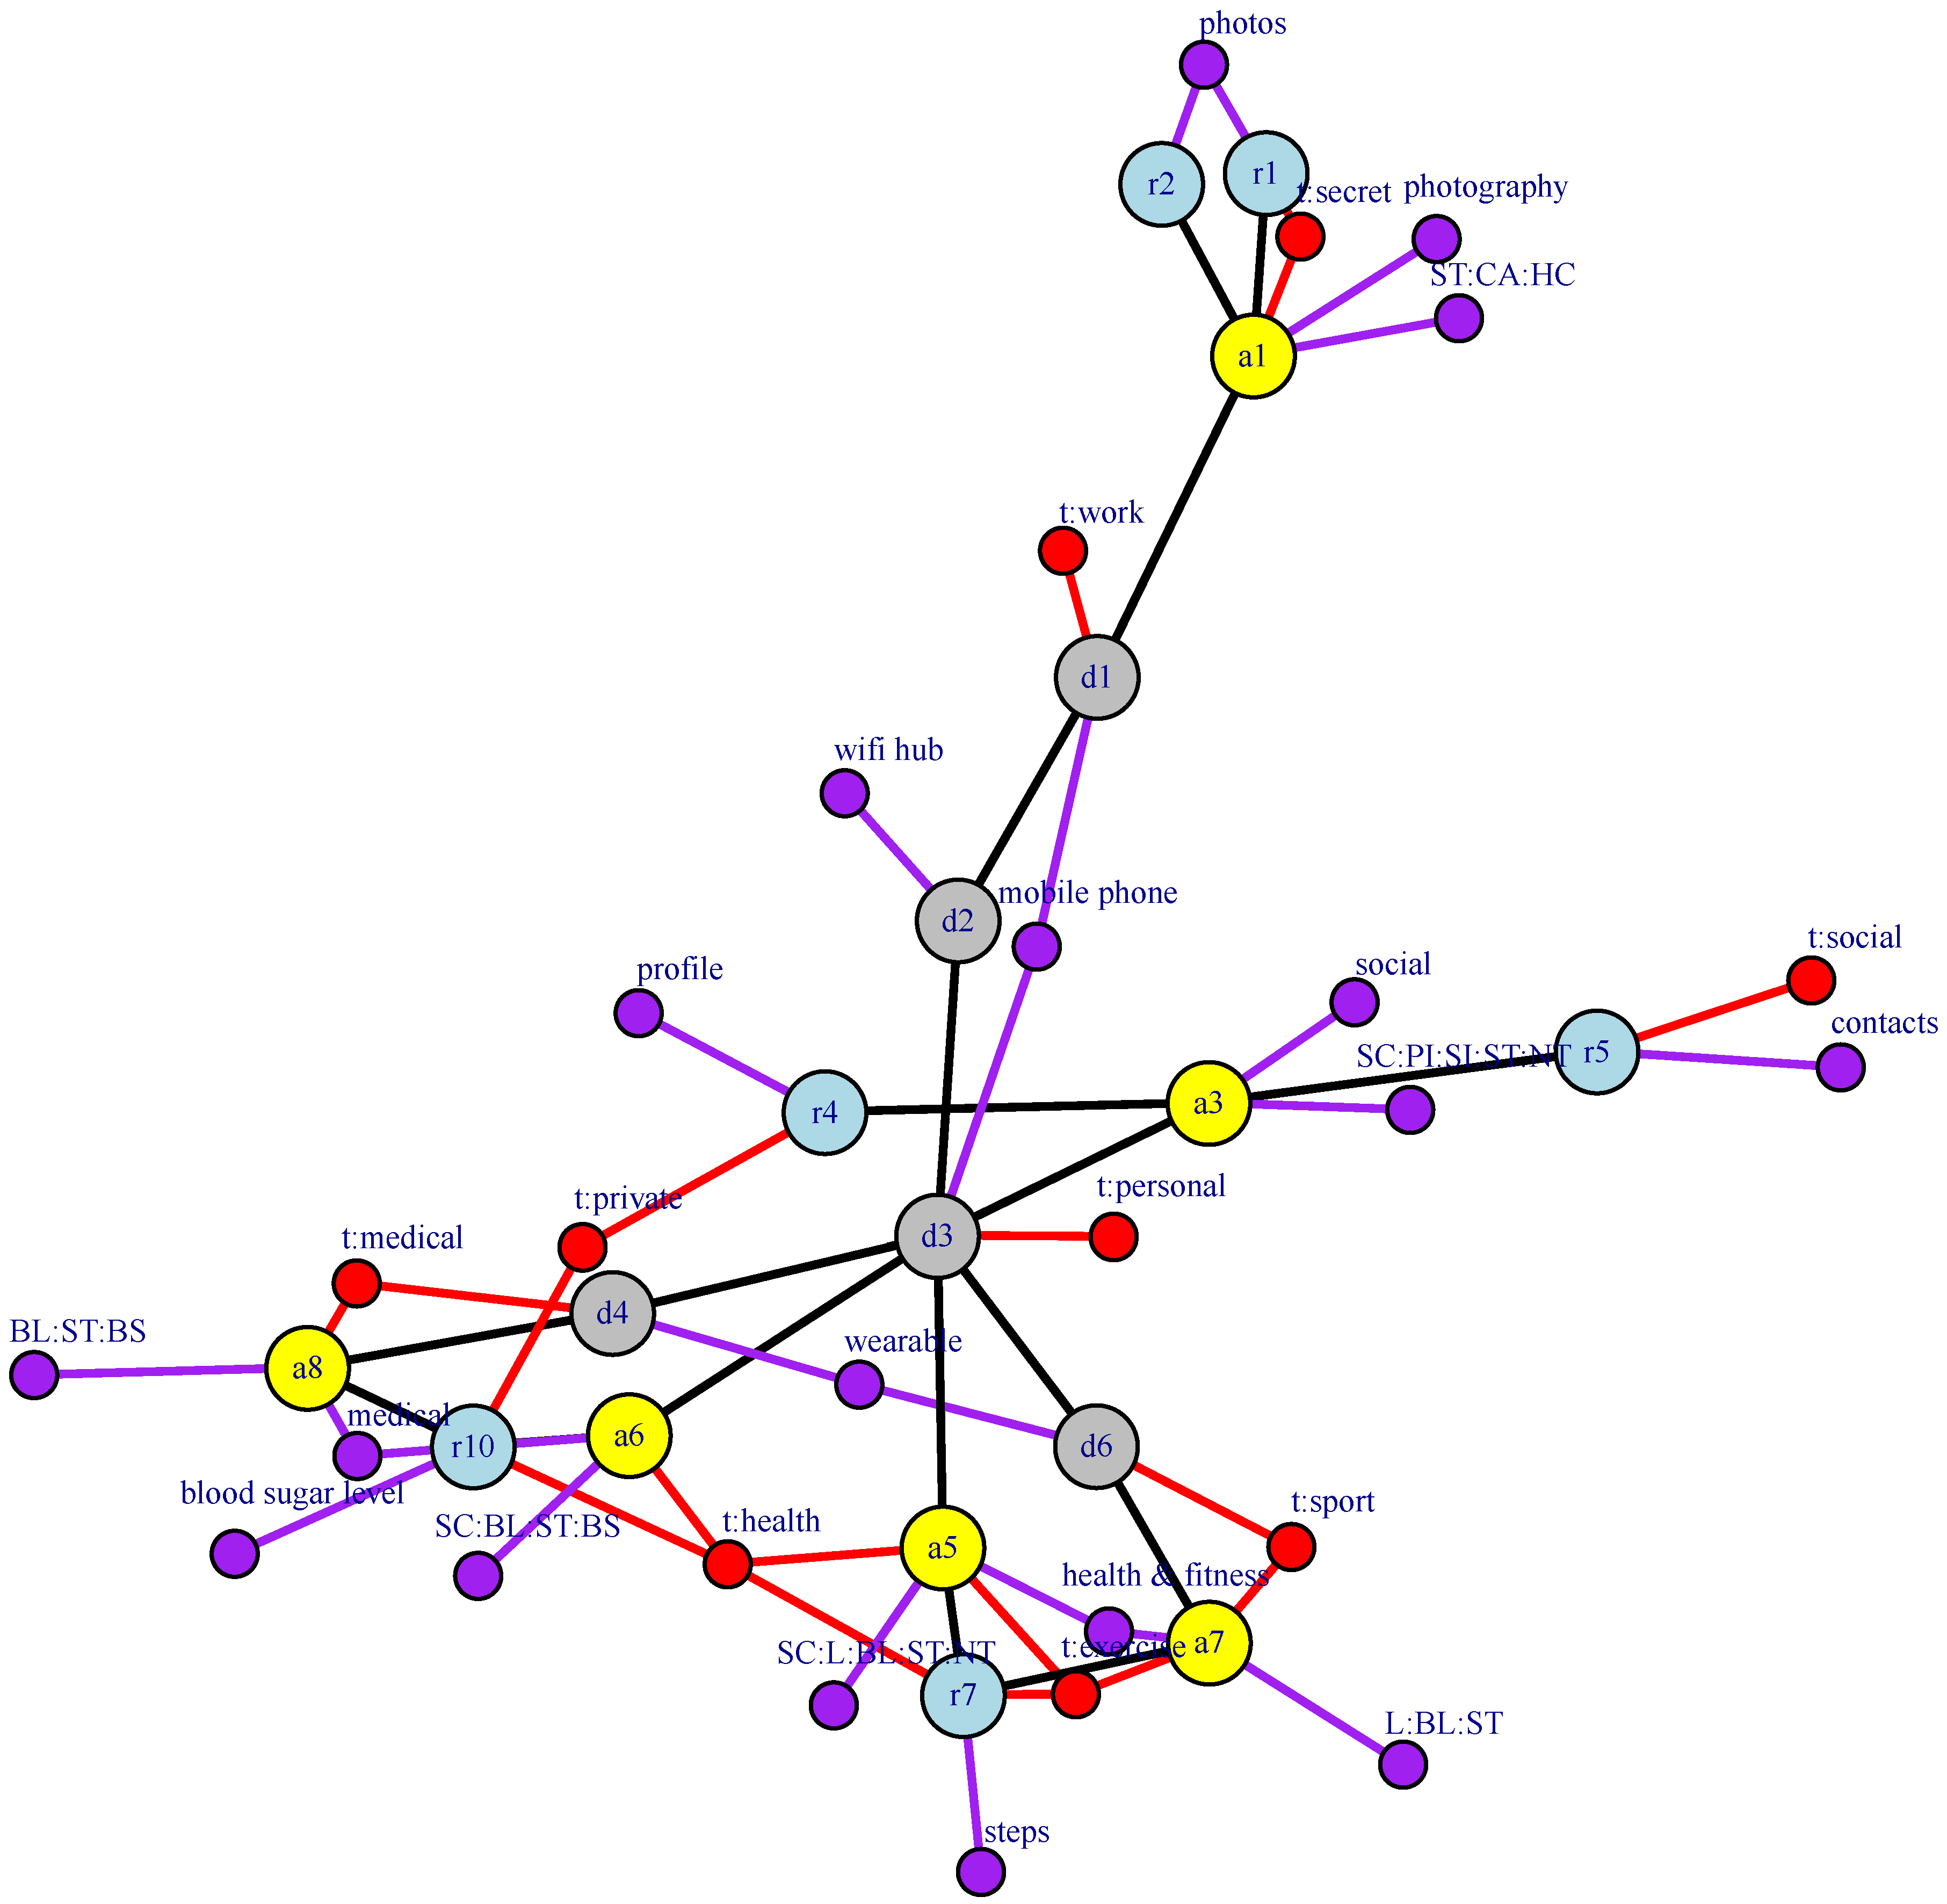
- If the app makes use of resource , either because it is owned by or because it is a data storage that is shared (synchronized) between and another paired app (see, for example, resource in Figure 1), then .
2.2. Attributes
- Features, which model a factual characteristic of an element.
- Tags, which are used to describe personal (i.e., user-defined) characteristics.
2.3. Security Policy Model
3. Similarity Metrics for WBAN Apps
- the similarity between the attributes of the two apps, both features and tags;
- the similarity between the set of resources used by both apps according to the attributes of each resource;
- the similarity between the devices where both apps are deployed, considering not only the attributes of both devices, but also the apps already deployed on each one of them; and
- the structural proximity between both apps, this being a measure of how distant in the WBAN one app is from the other considering, for example, the network distance between their host devices or the resources they share.
3.1. The ALG-2 Metric: Random Walks over Augmented WBAN Structural Graphs
3.2. The ALG-3 Metric: Random Walks over Doubly-Augmented WBAN Structural Graphs
4. Evaluation
4.1. Description of the Exemplar Case Study: The Smartphone Ecosystem WBAN
4.2. Construction of the Augmented Graphs
4.3. Analysis of Computed Similarities Using Both ALG-2 and ALG-3 Metrics
5. Related Work
5.1. Graph-Based Similarity Measures
5.2. Similarity Measures for Mobile Apps
5.3. Automatic Inference of Privacy Policies
5.3.1. Website Navigation and Online Social Networks
5.3.2. Smartphones
6. Conclusions and Future Work
Acknowledgments
Author Contributions
Conflicts of Interest
References
- Suarez-Tangil, G.; Tapiador, J.E.; Peris-Lopez, P.; Ribagorda, A. Evolution, detection and analysis of malware for smart devices. IEEE Commun. Surv. Tutor. 2014, 16, 961–987. [Google Scholar] [CrossRef]
- Ackerman, L. Mobile Health and Fitness Applications and Information Privacy; Privacy Rights Clearinghouse: San Diego, CA, USA, 2013. [Google Scholar]
- Knorr, K.; Aspinall, D.; Wolters, M. On the privacy, security and safety of blood pressure and diabetes apps. In Proceedings of the 30th IFIP TC 11 International Conference, SEC 2015, Hamburg, Germany, 26–28 May 2015; pp. 571–584.
- Android Users Have an Average of 95 Apps Installed on Their Phones, According to Yahoo Aviate Data. Available online: http://thenextweb.com/apps/2014/08/26/android-users-average-95-apps-installed-phones-according-yahoo-aviate-data/ (accessed on 26 June 2015).
- Rowan, M.; Dehlinger, J. Privacy incongruity: An analysis of a survey of mobile end-users. In Proceedings of the 13th International Conference on Security and Management, Las Vegas, NV, USA, 21–24 July 2014.
- Sadeh, N.; Hong, J.; Cranor, L.; Fette, I.; Kelley, P.; Prabaker, M.; Rao, J. Understanding and capturing people’s privacy policies in a mobile social networking application. Pers. Ubiquitous Comput. 2009, 13, 401–412. [Google Scholar] [CrossRef]
- Felt, A.P.; Ha, E.; Egelman, S.; Haney, A.; Chin, E.; Wagner, D. Android permissions: User attention, comprehension, and behavior. In Proceedings of the Eighth Symposium on Usable Privacy and Security, Washington, DC, USA, 11–13 July 2012; ACM: New York, NY, USA, 2012; p. 3. [Google Scholar]
- Bettini, C.; Riboni, D. Privacy protection in pervasive systems: State of the art and technical challenges. Pervasive Mob. Comput. 2015, 17, 159–174. [Google Scholar] [CrossRef]
- Cheng, H.; Zhou, Y.; Yu, J.X. Clustering large attributed graphs: A balance between structural and attribute similarities. ACM Trans. Knowl. Discov. Data (TKDD) 2011, 5, 12. [Google Scholar]
- Picazo-Sanchez, P.; Tapiador, J.E.; Peris-Lopez, P.; Suarez-Tangil, G. Secure publish-subscribe protocols for heterogeneous medical Wireless Body Area Networks. Sensors 2014, 14, 22619–22642. [Google Scholar] [CrossRef] [PubMed]
- Nauman, M.; Khan, S.; Othman, A.T.; Musa, S. Realization of a user-centric, privacy preserving permission framework for Android. Secur. Commun. Netw. 2015, 8, 368–382. [Google Scholar] [CrossRef]
- Bothorel, C.; Cruz, J.D.; Magnani, M.; Micenkova, B. Clustering attributed graphs: Models, measures and methods. Netw. Sci. 2015. [Google Scholar] [CrossRef]
- Google Play Store. Available online: https://play.google.com/store/apps?hl=en (accessed on 9 May 2016).
- Reference Android API: Manifest.permission_group. Available online: http://developer.android.com/reference/android/Manifest.permission_group.html (accessed on 9 May 2016).
- Zhou, Y.; Cheng, H.; Yu, J.X. Graph clustering based on structural/attribute similarities. Proc. VLDB Endow. 2009, 2, 718–729. [Google Scholar] [CrossRef]
- Tong, H.; Faloutsos, C.; Pan, J.Y. Fast random walk with restart and its applications. In Proceedings of the 6th IEEE International Conference on Data Mining, ICDM’06, Hong Kong, China, 18–22 December 2006.
- Xie, H.; Li, Q.; Mao, X.; Li, X.; Cai, Y.; Zheng, Q. Mining latent user community for tag-based and content-based search in social media. Comput. J. 2014, 57, 1415–1430. [Google Scholar] [CrossRef]
- Harispe, S.; Ranwez, S.; Janaqi, S.; Montmain, J. Semantic Measures for the Comparison of Units of Language, Concepts or Instances from Text and Knowledge Base Analysis. 2013. arXiv preprint arXiv:1310.1285. Available online: http://arxiv.org/abs/1310.1285 (accessed on 9 May 2016).
- Banerjee, S.; Pedersen, T. An adapted Lesk algorithm for word sense disambiguation using WordNet. Lect. Notes Comput. Sci. 2002, 2276, 136–145. [Google Scholar]
- Lesk, M. Automatic sense disambiguation using machine readable dictionaries. In Proceedings of the 5th Annual International Conference on Systems Documentation, SIGDOC ’86, Toronto, ON, Canada, 8–11 June 1986; pp. 24–26.
- Princenton University “About WordNet”. WordNet. Princenton University, 2010. Available online: http://wordnet.princeton.edu (accessed on 9 May 2016).
- Semilar Toolkit 1.0.2. Available online: http://www.semanticsimilarity.org/ (accessed on 9 May 2016).
- WordNet 3.0 DataBase. Available online: http://wordnet.princeton.edu/ (accessed on 9 May 2016).
- Deza, M.M.; Deza, E. Encyclopedia of Distances; Springer: Berlin/Heidelberg, Germany, 2009. [Google Scholar]
- Tan, D.J.; Chua, T.W.; Thing, V.L. Securing Android: A survey, taxonomy, and challenges. ACM Comput. Surv. (CSUR) 2015, 47, 58. [Google Scholar]
- Zhou, W.; Zhou, Y.; Grace, M.; Jiang, X.; Zou, S. Fast, scalable detection of piggybacked mobile applications. In Proceedings of the Third ACM Conference on Data and Application Security and Privacy, San Antonio, TX, USA, 18–20 February 2013; ACM: New York, NY, USA, 2013; pp. 185–196. [Google Scholar]
- Kywe, S.M.; Li, Y.; Deng, R.H.; Hong, J. Detecting camouflaged applications on mobile application markets. Lect. Notes Comput. Sci. 2014, 8949, 241–254. [Google Scholar]
- Kim, J.; Kang, S.; Lim, Y.; Kim, H.M. Recommendation algorithm of the app store by using semantic relations between apps. J. Supercomput. 2013, 65, 16–26. [Google Scholar] [CrossRef]
- Bhandari, U.; Sugiyama, K.; Datta, A.; Jindal, R. Serendipitous recommendation for mobile apps using item-item similarity graph. In Proceedings of the 9th Asia Information Retrieval Societies Conference, Singapore, 9–11 December 2013; pp. 440–451.
- Yang, S.; Yu, H.; Deng, W.; Lai, X. Mobile application recommendations based on Complex information. In Proceedings of the 28th International Conference on Industrial, Engineering and Other Applications of Applied Intelligent Systems, Seoul, Korea, 10–12 June 2015; pp. 415–424.
- Chen, N.; Hoi, S.C.; Li, S.; Xiao, X. SimApp: A framework for detecting similar mobile applications by online kernel learning. In Proceedings of the Eighth ACM International Conference on Web Search and Data Mining, Shanghai, China, 2–6 February 2015; ACM: New York, NY, USA, 2015; pp. 305–314. [Google Scholar]
- Zhu, H.; Chen, E.; Xiong, H.; Cao, H.; Tian, J. Mobile app classification with enriched contextual information. IEEE Trans. Mob. Comput. 2014, 13, 1550–1563. [Google Scholar] [CrossRef]
- Tøndel, I.A.; Nyre, Å.A.; Bernsmed, K. Learning privacy preferences. In Proceedings of the 2011 Sixth International Conference on Availability, Reliability and Security (ARES), IEEE, Vienna, Austria, 22–26 August 2011; pp. 621–626.
- Tøndel, I.A.; Åsmund, A.N. Towards a similarity metric for comparing machine-readable privacy policies. Lect. Notes Comput. Sci. 2012, 7039, 89–103. [Google Scholar]
- Kelley, P.G.; Drielsma, P.H.; Sadeh, N.; Cranor, L.F. User-controllable learning of security and privacy policies. In Proceedings of the 1st ACM workshop on Workshop on AISec, Alexandria, VA, USA, 27–31 October 2008; ACM: New York, NY, USA, 2008; pp. 11–18. [Google Scholar]
- Toch, E.; Sadeh, N.M.; Hong, J. Generating default privacy policies for online social networks. In Proceedings of the Extended Abstracts on Human Factors in Computing Systems, CHI’10, Atlanta, GA, USA, 10–15 April 2010; ACM: New York, NY, USA, 2010; pp. 4243–4248. [Google Scholar]
- Squicciarini, A.C.; Shehab, M.; Wede, J. Privacy policies for shared content in social network sites. VLDB J. 2010, 19, 777–796. [Google Scholar] [CrossRef]
- Klemperer, P.; Liang, Y.; Mazurek, M.; Sleeper, M.; Ur, B.; Bauer, L.; Cranor, L.F.; Gupta, N.; Reiter, M. Tag, you can see it!: Using tags for access control in photo sharing. In Proceedings of the SIGCHI Conference on Human Factors in Computing Systems, Austin, TX, USA, 5–10 May 2012; ACM: New York, NY, USA, 2012; pp. 377–386. [Google Scholar]
- Naini, K.D.; Altingovde, I.S.; Kawase, R.; Herder, E.; Niederee, C. Analyzing and predicting privacy settings in the social Web. Lect. Notes Comput. Sci. 2015, 9146, 104–117. [Google Scholar]
- Zerr, S.; Siersdorfer, S.; Hare, J.; Demidova, E. Privacy-aware image classification and search. In Proceedings of the 35th international ACM SIGIR Conference on Research and Development in Information Retrieval, Portland, OR, USA, 12–16 August 2012; pp. 35–44.
- Squicciarini, A.C.; Caragea, C.; Balakavi, R. Analyzing images’ privacy for the modern web. In Proceedings of the 25th ACM Conference on Hypertext and Social Media, Santiago, Chile, 1–4 September 2014; pp. 136–147.
- Ghazinour, K.; Matwin, S.; Sokolova, M. Monitoring and recommending privacy settings in social networks. In Proceedings of the Joint EDBT/ICDT 2013 Workshops, Genoa, Italy, 18–22 March 2013; pp. 164–168.
- Squicciarini, A.; Karumanchi, S.; Lin, D.; DeSisto, N. Identifying hidden social circles for advanced privacy configuration. Comput. Secur. 2014, 41, 40–51. [Google Scholar] [CrossRef]
- Squicciarini, A.C.; Lin, D.; Sundareswaran, S.; Wede, J. Privacy policy inference of user-uploaded images on content sharing sites. IEEE Trans. Knowl. Data Eng. 2015, 27, 193–206. [Google Scholar] [CrossRef]
- Liu, B.; Lin, J.; Sadeh, N. Reconciling mobile app privacy and usability on smartphones: Could user privacy profiles help? In Proceedings of the 23rd International Conference on World Wide Web, Seoul, Korea, 7–11 April 2014; ACM: New York, NY, USA, 2014; pp. 201–212. [Google Scholar]
- Sadeh, J.L.B.L.N.; Hong, J.I. Modeling users’ mobile app privacy preferences: Restoring usability in a sea of permission settings. In Proceedings of the Symposium on Usable Privacy and Security (SOUPS), Menlo Park, CA, USA, 9–11 July 2014.
- Agarwal, Y.; Hall, M. ProtectMyPrivacy: Detecting and mitigating privacy leaks on iOS devices using crowdsourcing. In Proceedings of the 11th Annual International Conference on Mobile Systems, Applications, and Services, Taipei, Taiwan, 25–28 June 2013; ACM: New York, NY, USA, 2013; pp. 97–110. [Google Scholar]
- Rashidi, B.; Fung, C.; Vu, T. Dude, ask the experts!: Android resource access permission recommendation with RecDroid. In Proceedings of the 2015 IFIP/IEEE International Symposium on Integrated Network Management (IM), Ottawa, ON, Canada, 11–15 May 2015; pp. 296–304.
- Guo, Z.; Han, W.; Liu, L.; Xu, W.; Bu, R.; Ni, M. SPA: Inviting Your Friends to Help Set Android Apps. In Proceedings of the 20th ACM Symposium on Access Control Models and Technologies, SACMAT’15, Vienna, Austria, 1–3 June 2015.
- Gupta, A.; Miettinen, M.; Asokan, N.; Nagy, M. Intuitive security policy configuration in mobile devices using context profiling. In Proceedings of the 2012 International Conference on Privacy, Security, Risk and Trust (PASSAT) and 2012 International Confernece on Social Computing (SocialCom), Amsterdam, The Netherlands, 3–5 September 2012; pp. 471–480.
- Miettinen, M.; Heuser, S.; Kronz, W.; Sadeghi, A.R.; Asokan, N. ConXsense—Context profiling and classification for context-aware access control. In Proceedings of the 9th ACM Symposium on Information, Computer and Communications Security, ASIA CCS ’14, Kyoto, Japan, 3–6 June 2014; pp. 293–304.
- Chakraborty, S.; Shen, C.; Raghavan, K.R.; Shoukry, Y.; Millar, M.; Srivastava, M. ipShield: A framework for enforcing context-aware privacy. In Proceedings of the 11th USENIX Symposium on Networked Systems Design and Implementation (NSDI 14), Seattle, WA, USA, 2–4 April 2014; pp. 143–156.


| Element | Attribute | Domain |
|---|---|---|
| – | Tags | , , , , , , , , |
| Devices | deviceType | , , |
| Apps | appCategory | , , , |
| PermGroup | , , , , , , , , , | |
| Resources | DataType | , , , , |
© 2016 by the authors; licensee MDPI, Basel, Switzerland. This article is an open access article distributed under the terms and conditions of the Creative Commons Attribution (CC-BY) license (http://creativecommons.org/licenses/by/4.0/).
Share and Cite
González-Tablas, A.I.; Tapiador, J.E. Bootstrapping Security Policies for Wearable Apps Using Attributed Structural Graphs. Sensors 2016, 16, 674. https://doi.org/10.3390/s16050674
González-Tablas AI, Tapiador JE. Bootstrapping Security Policies for Wearable Apps Using Attributed Structural Graphs. Sensors. 2016; 16(5):674. https://doi.org/10.3390/s16050674
Chicago/Turabian StyleGonzález-Tablas, Ana I., and Juan E. Tapiador. 2016. "Bootstrapping Security Policies for Wearable Apps Using Attributed Structural Graphs" Sensors 16, no. 5: 674. https://doi.org/10.3390/s16050674